Adoption of Road Water Harvesting Practices and Their Impacts: Evidence from a Semi-Arid Region of Ethiopia
Abstract
1. Introduction
2. Materials and Methods
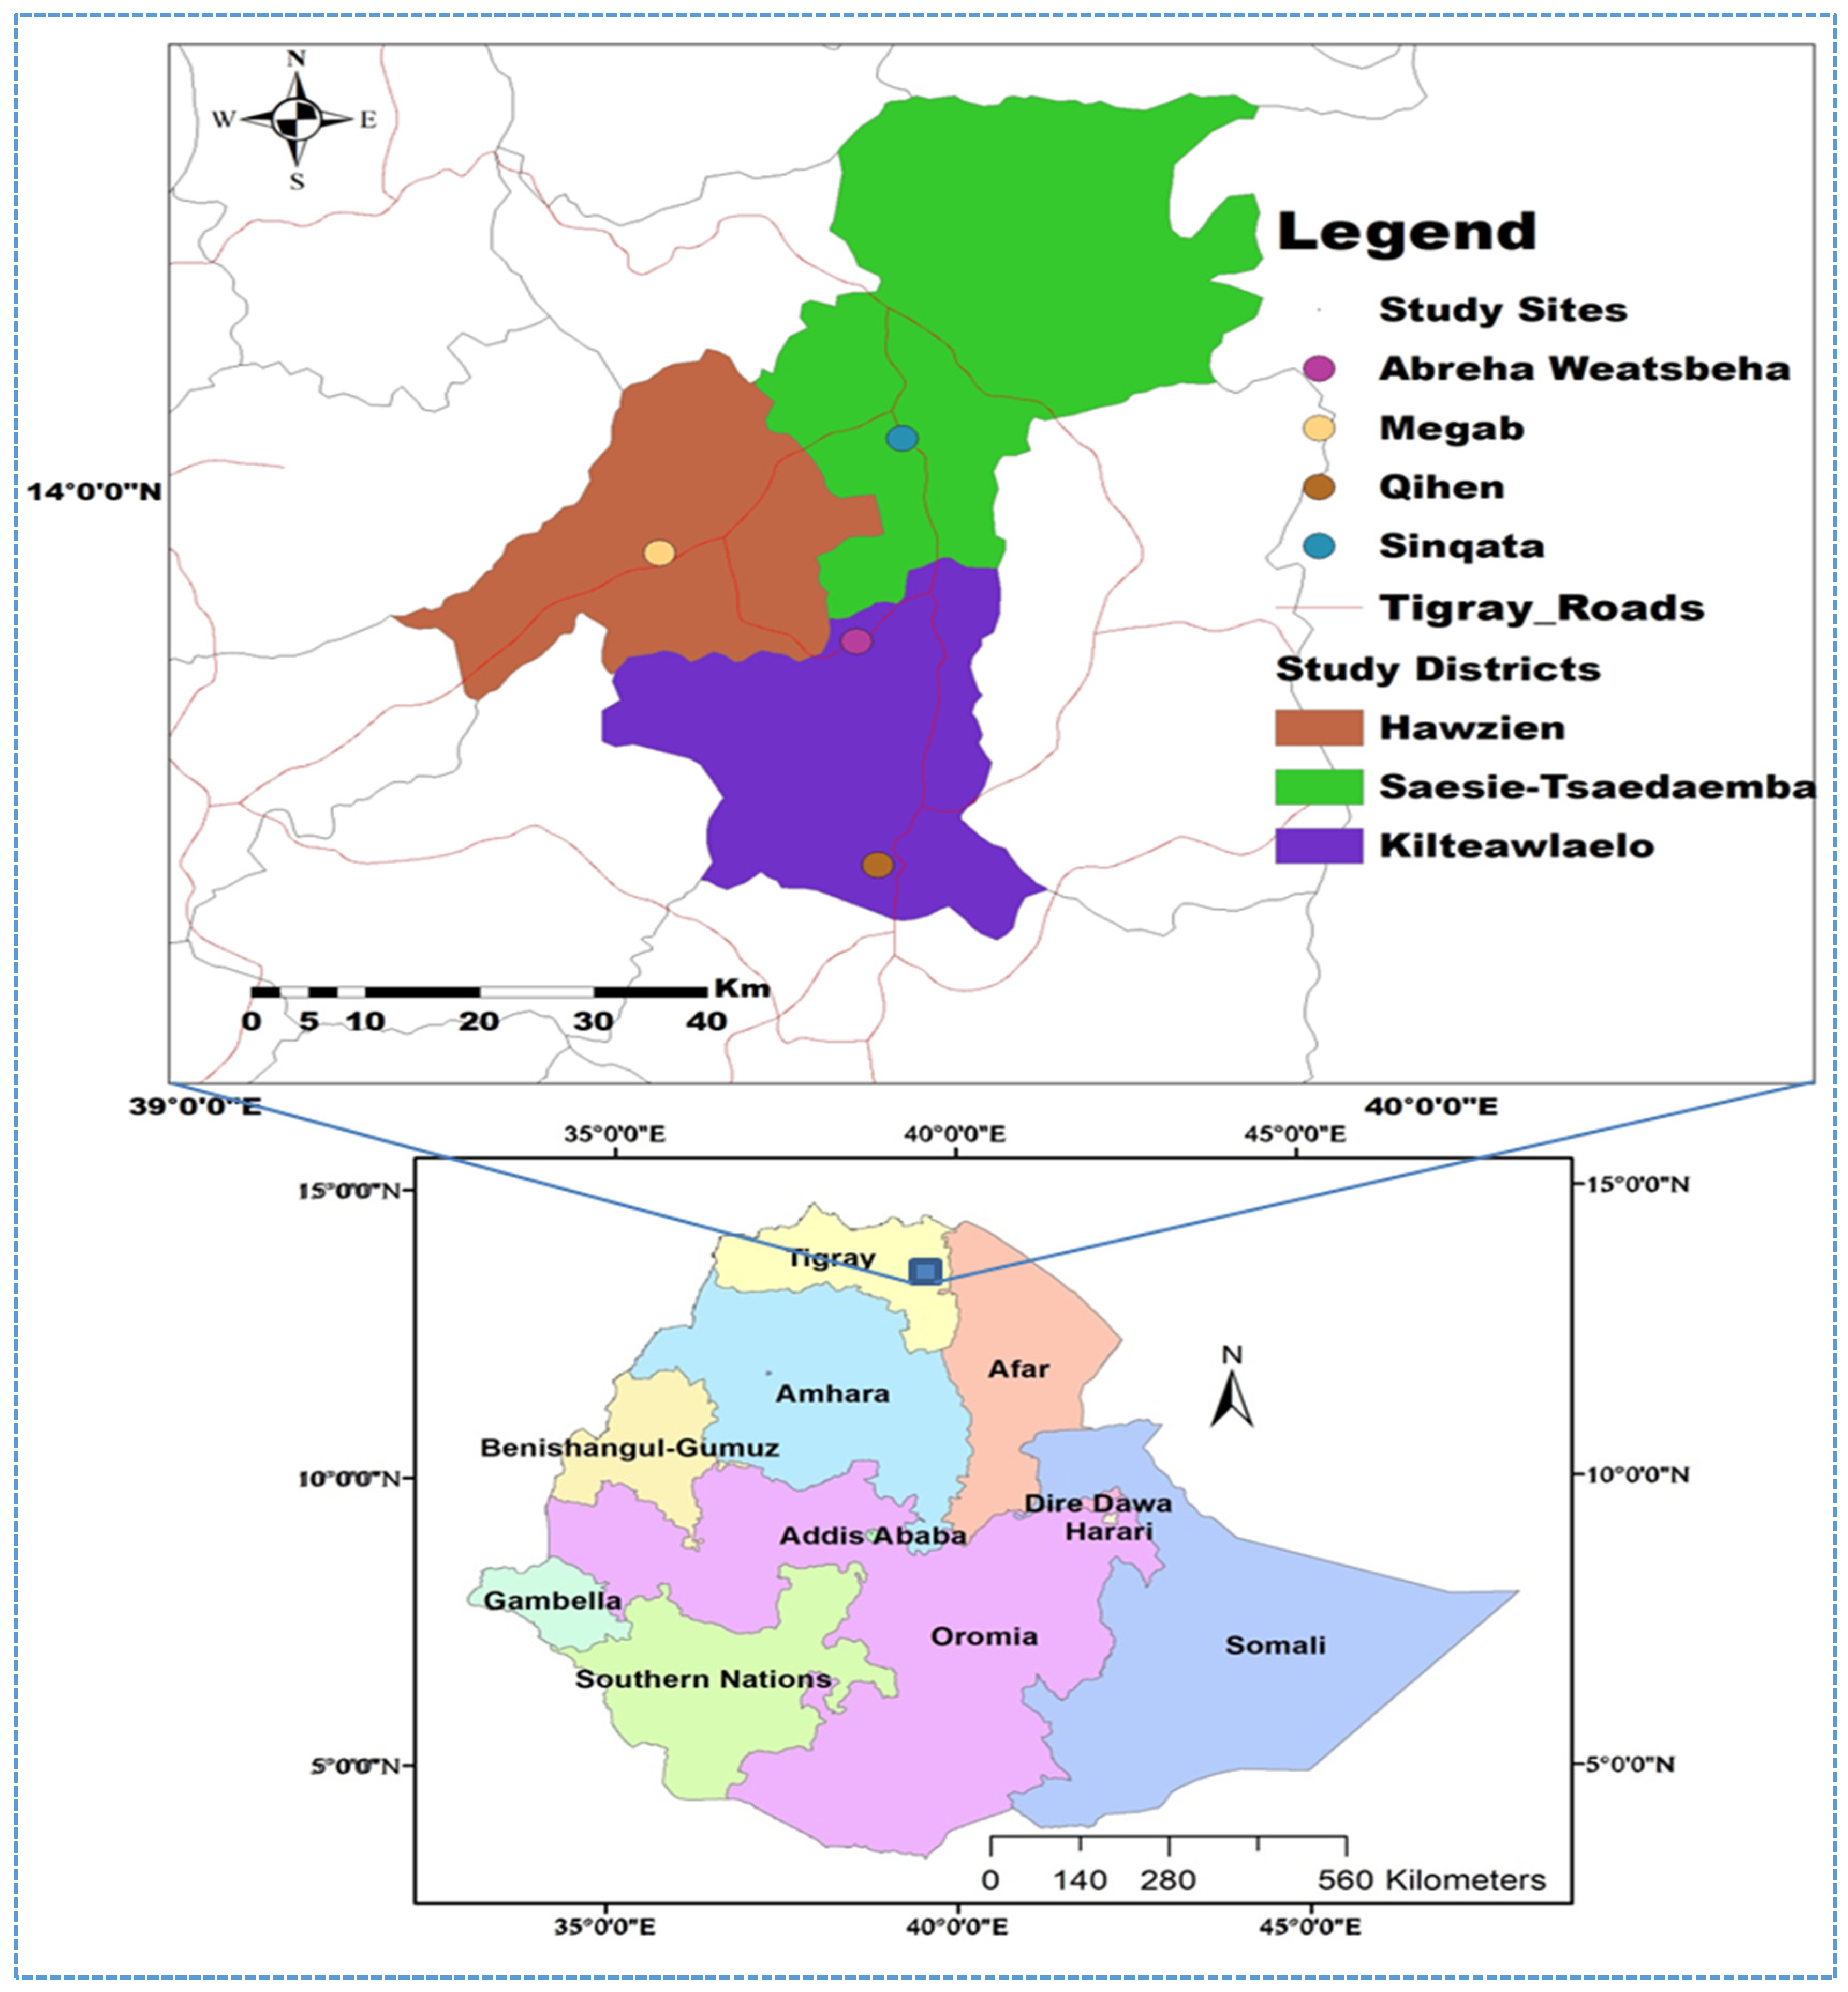
2.1. The Study Area
2.2. Sampling Procedures and Data
2.3. Analytical Procedures
3. Results and Discussion
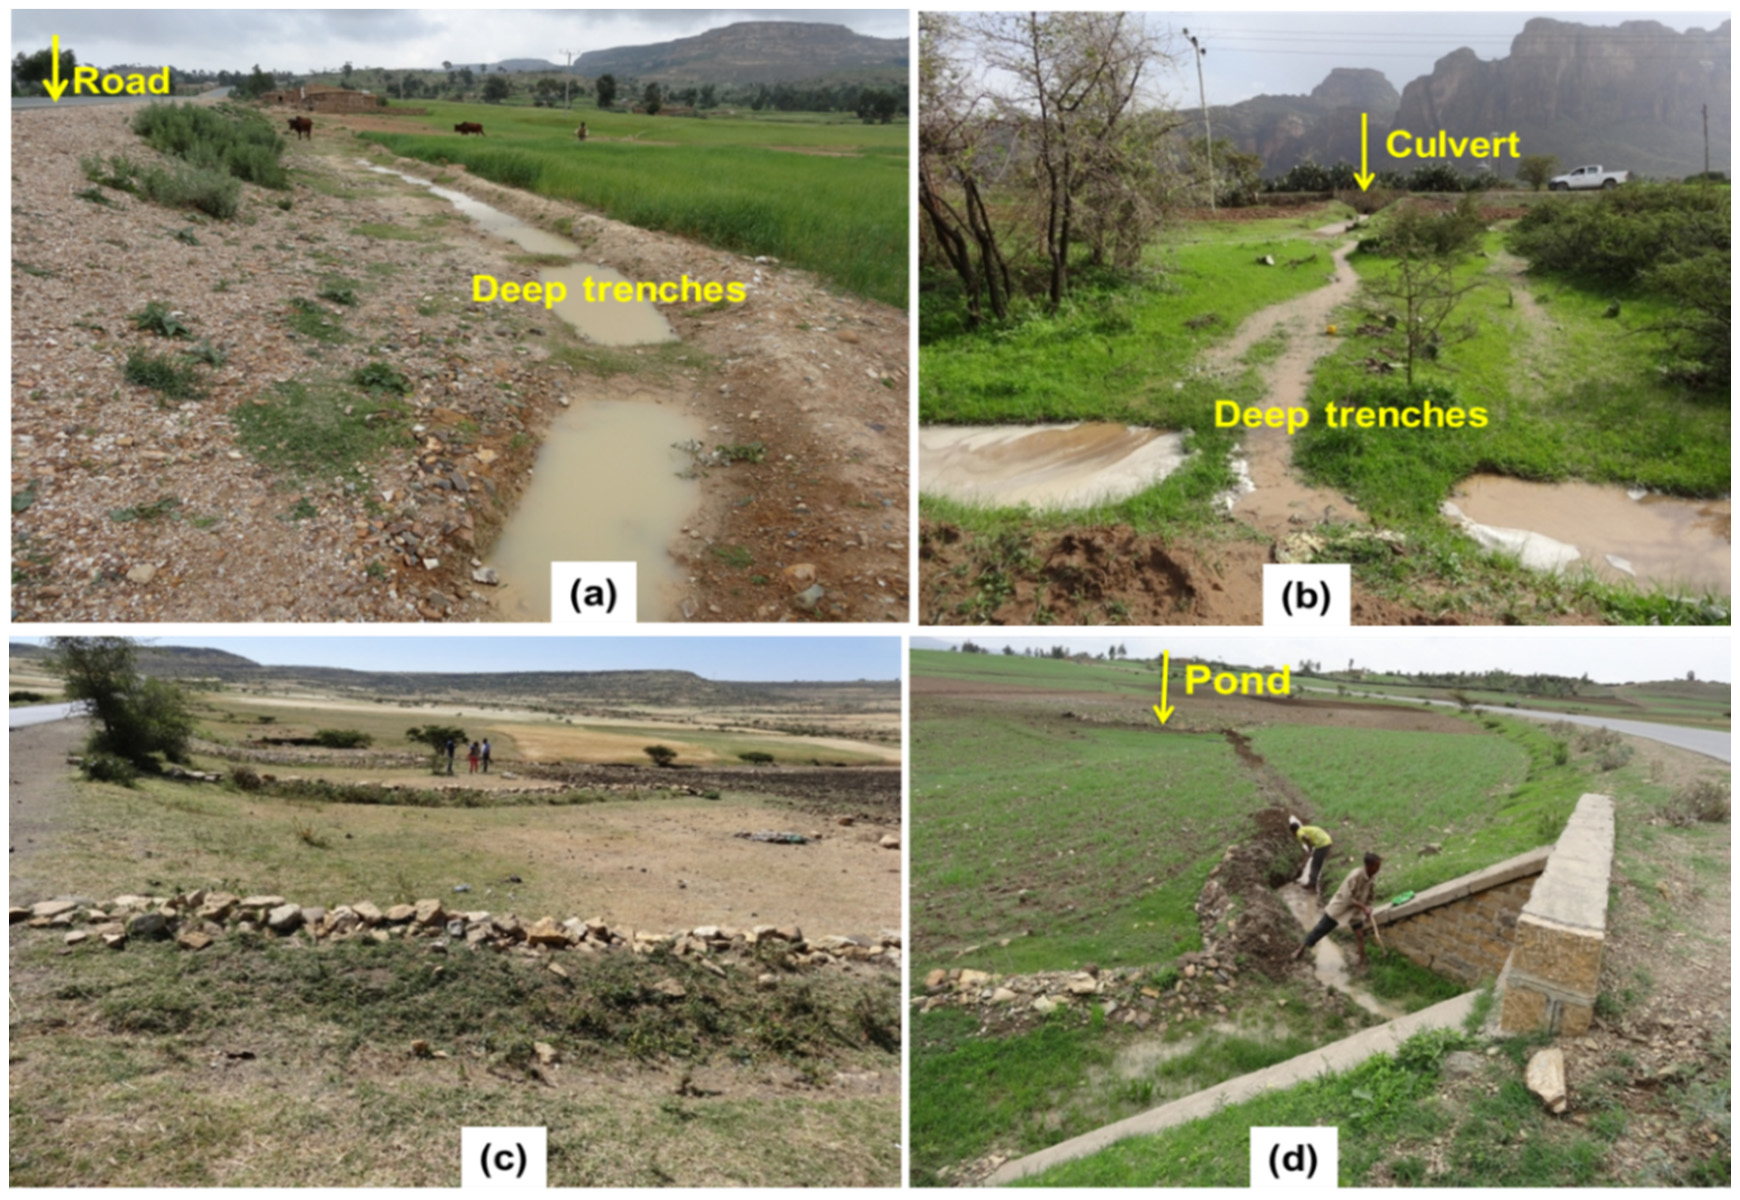
3.1. Descriptive Results
3.2. Factors Affecting Adoption of Road Water Harvesting Practices
3.3. Impacts of Road Water Harvesting
3.3.1. Impact of the Adoption of Road Water Harvesting Practices on Farmyard Manure and Fertilizer Use
3.3.2. Impact of the Adoption of Road Water Harvesting Practices on Crop Yield
3.3.3. Impact of the Adoption of Road Water Harvesting Practices on Household Income
4. Conclusions and Policy Implications
Author Contributions
Funding
Acknowledgments
Conflicts of Interest
Appendix A. Econometric Model Estimation Procedures
Y = 0: otherwise
ATT = E {E {Y1i − Y0i |Di = 1, p (Xi)}}
ATT = E {E {Y1i |Di = 1, p (Xi)} − E {Y0i |Di = 0, p (Xi)} |Di = 1}
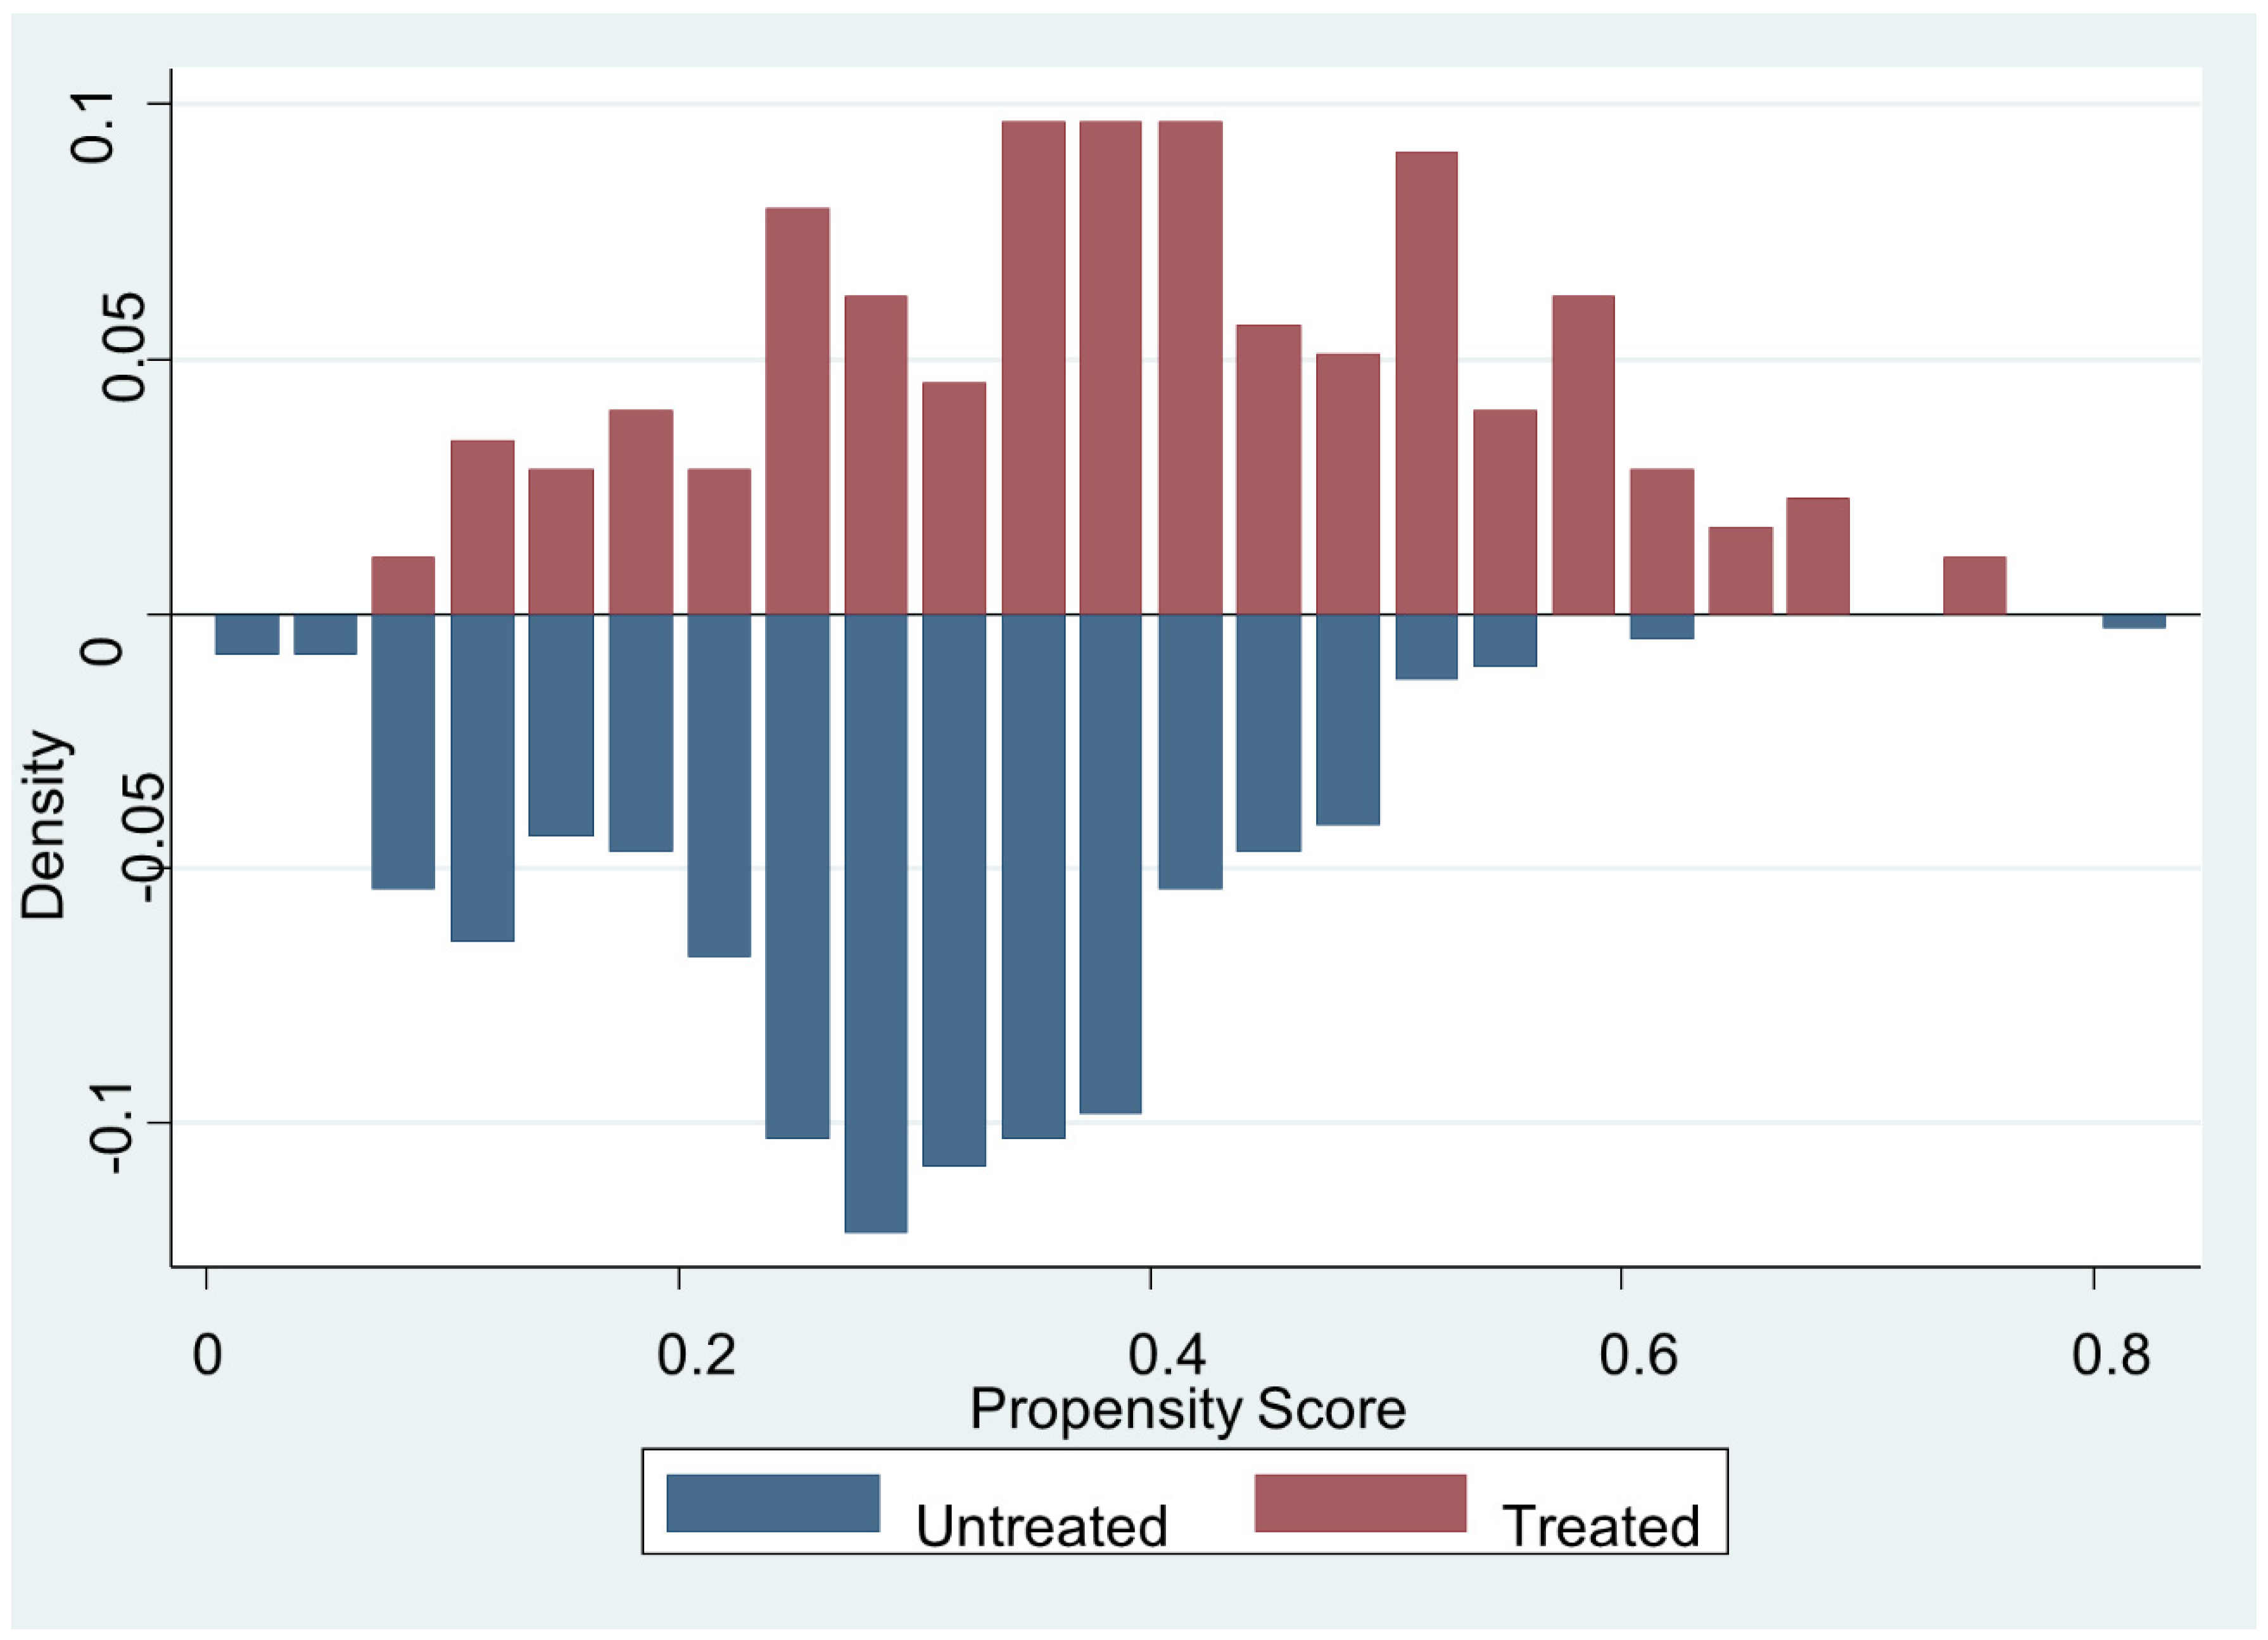
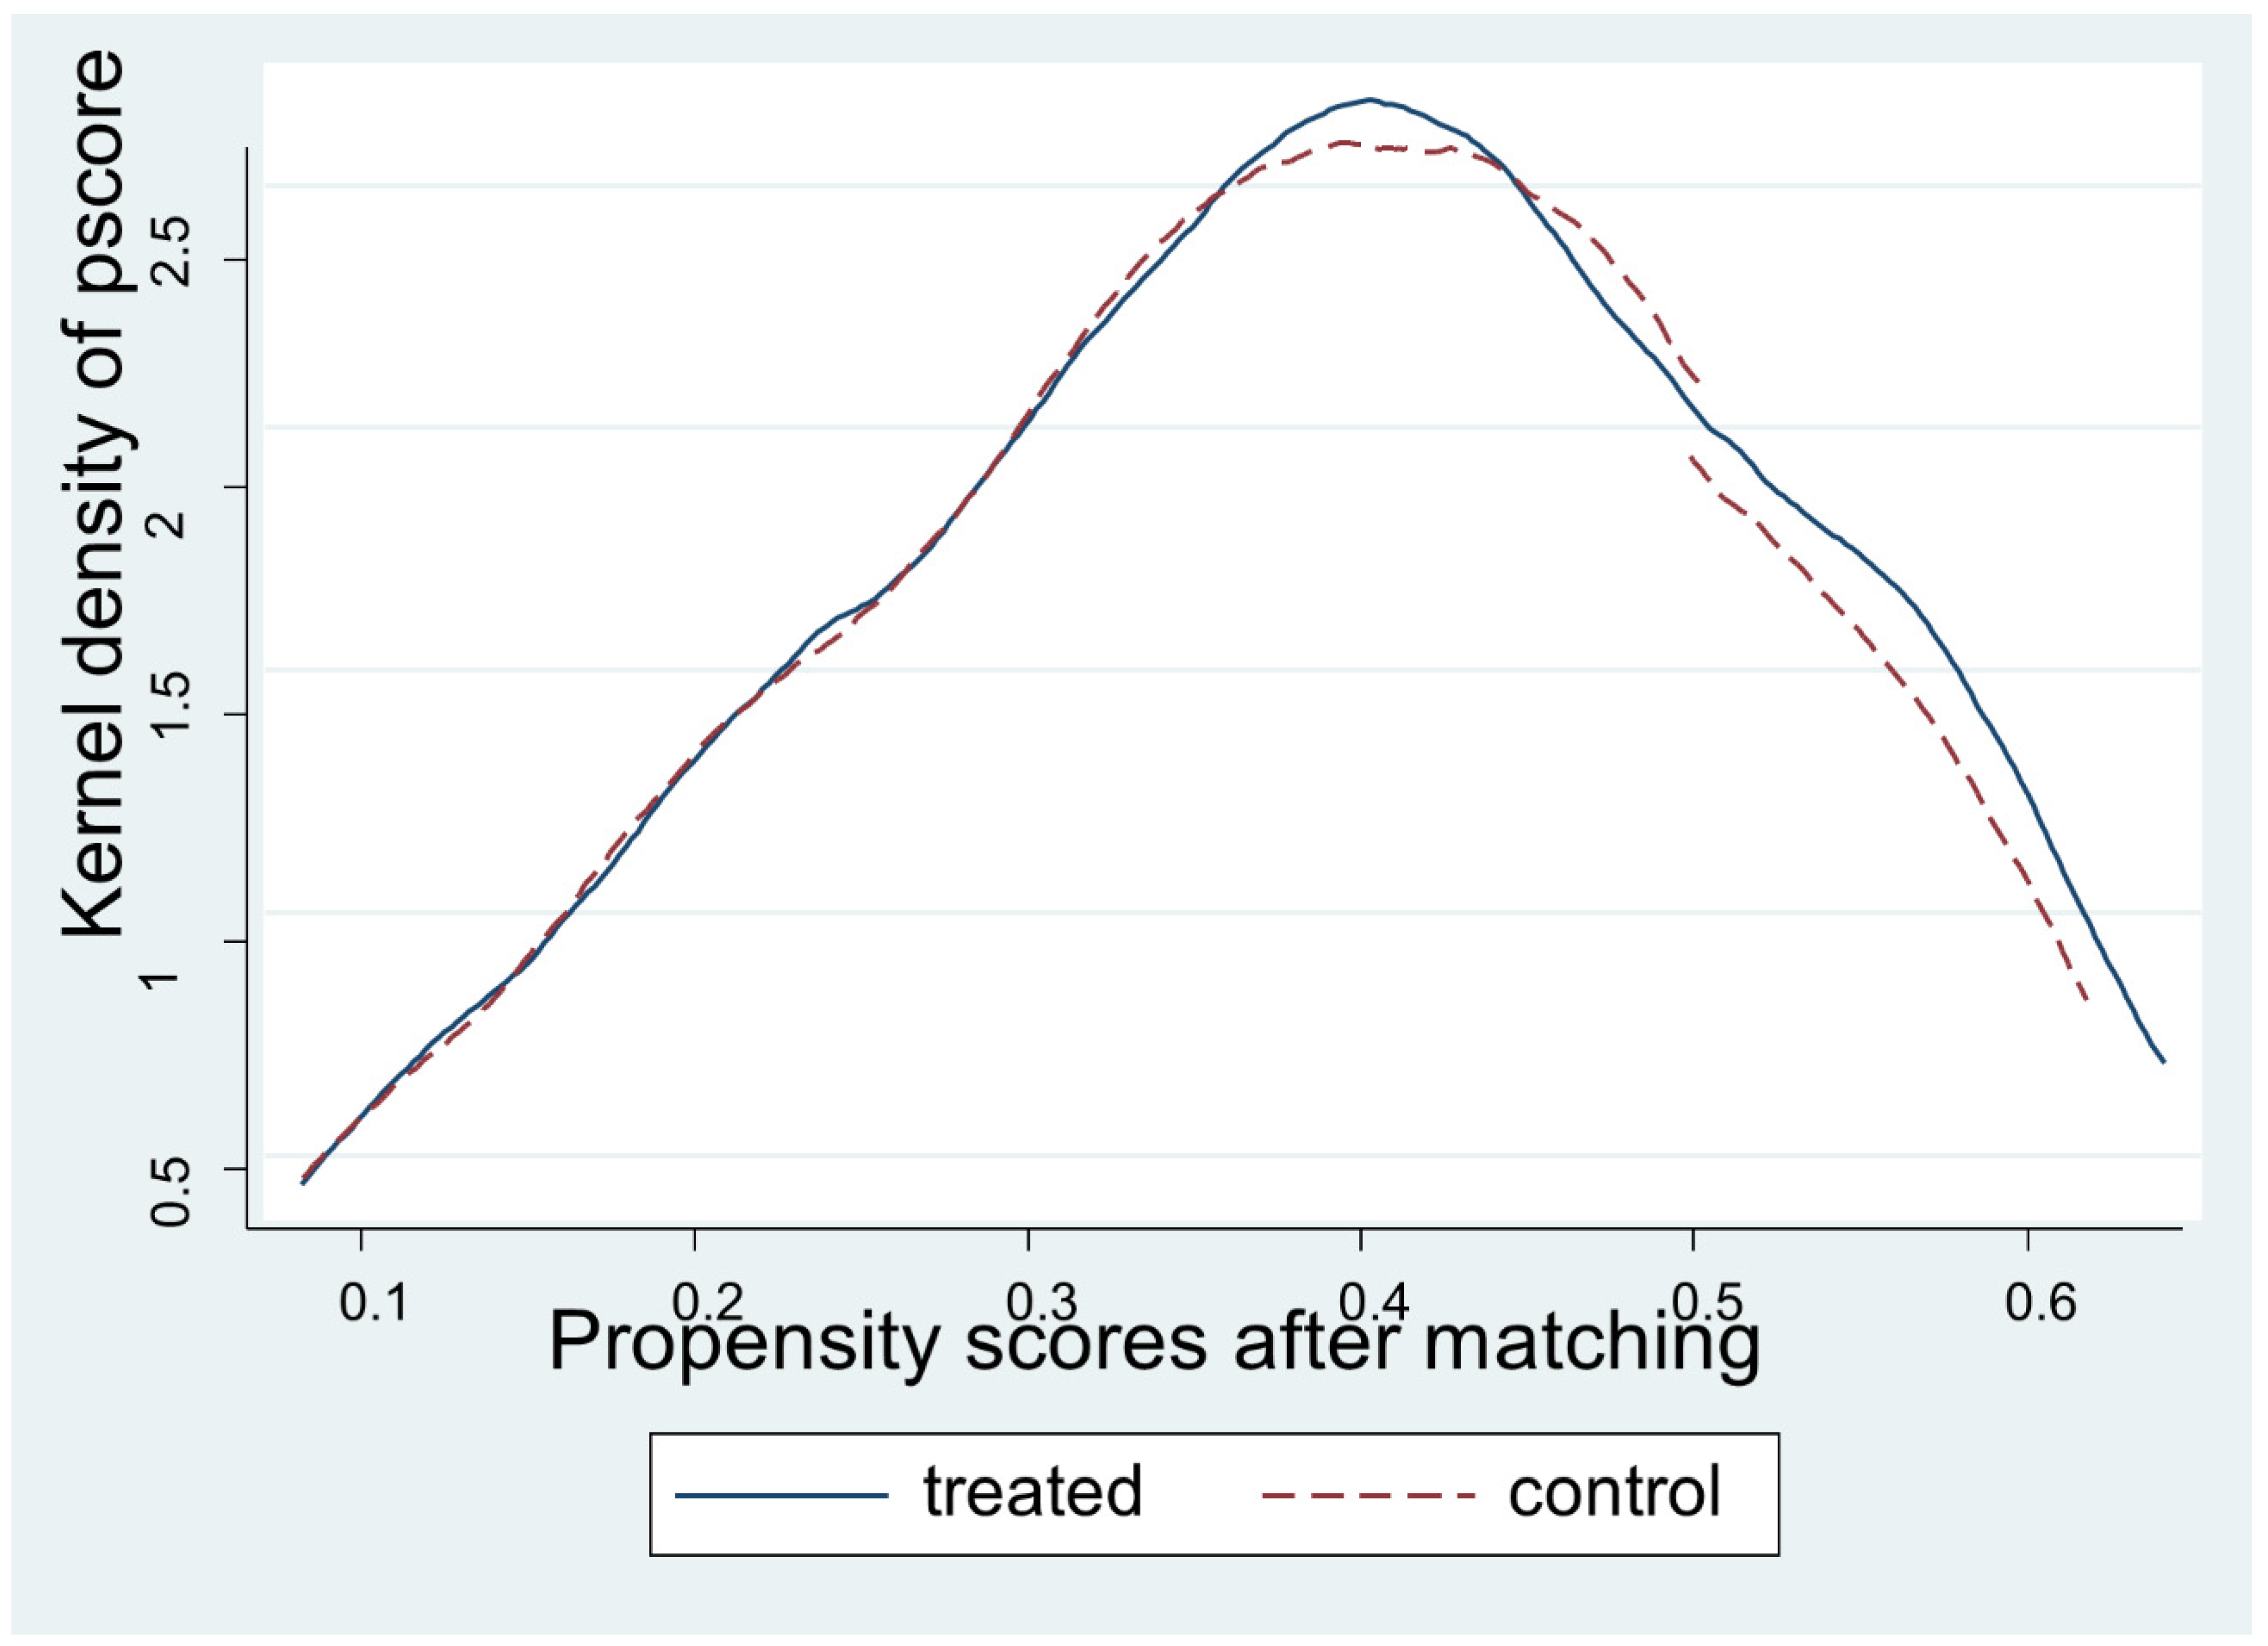
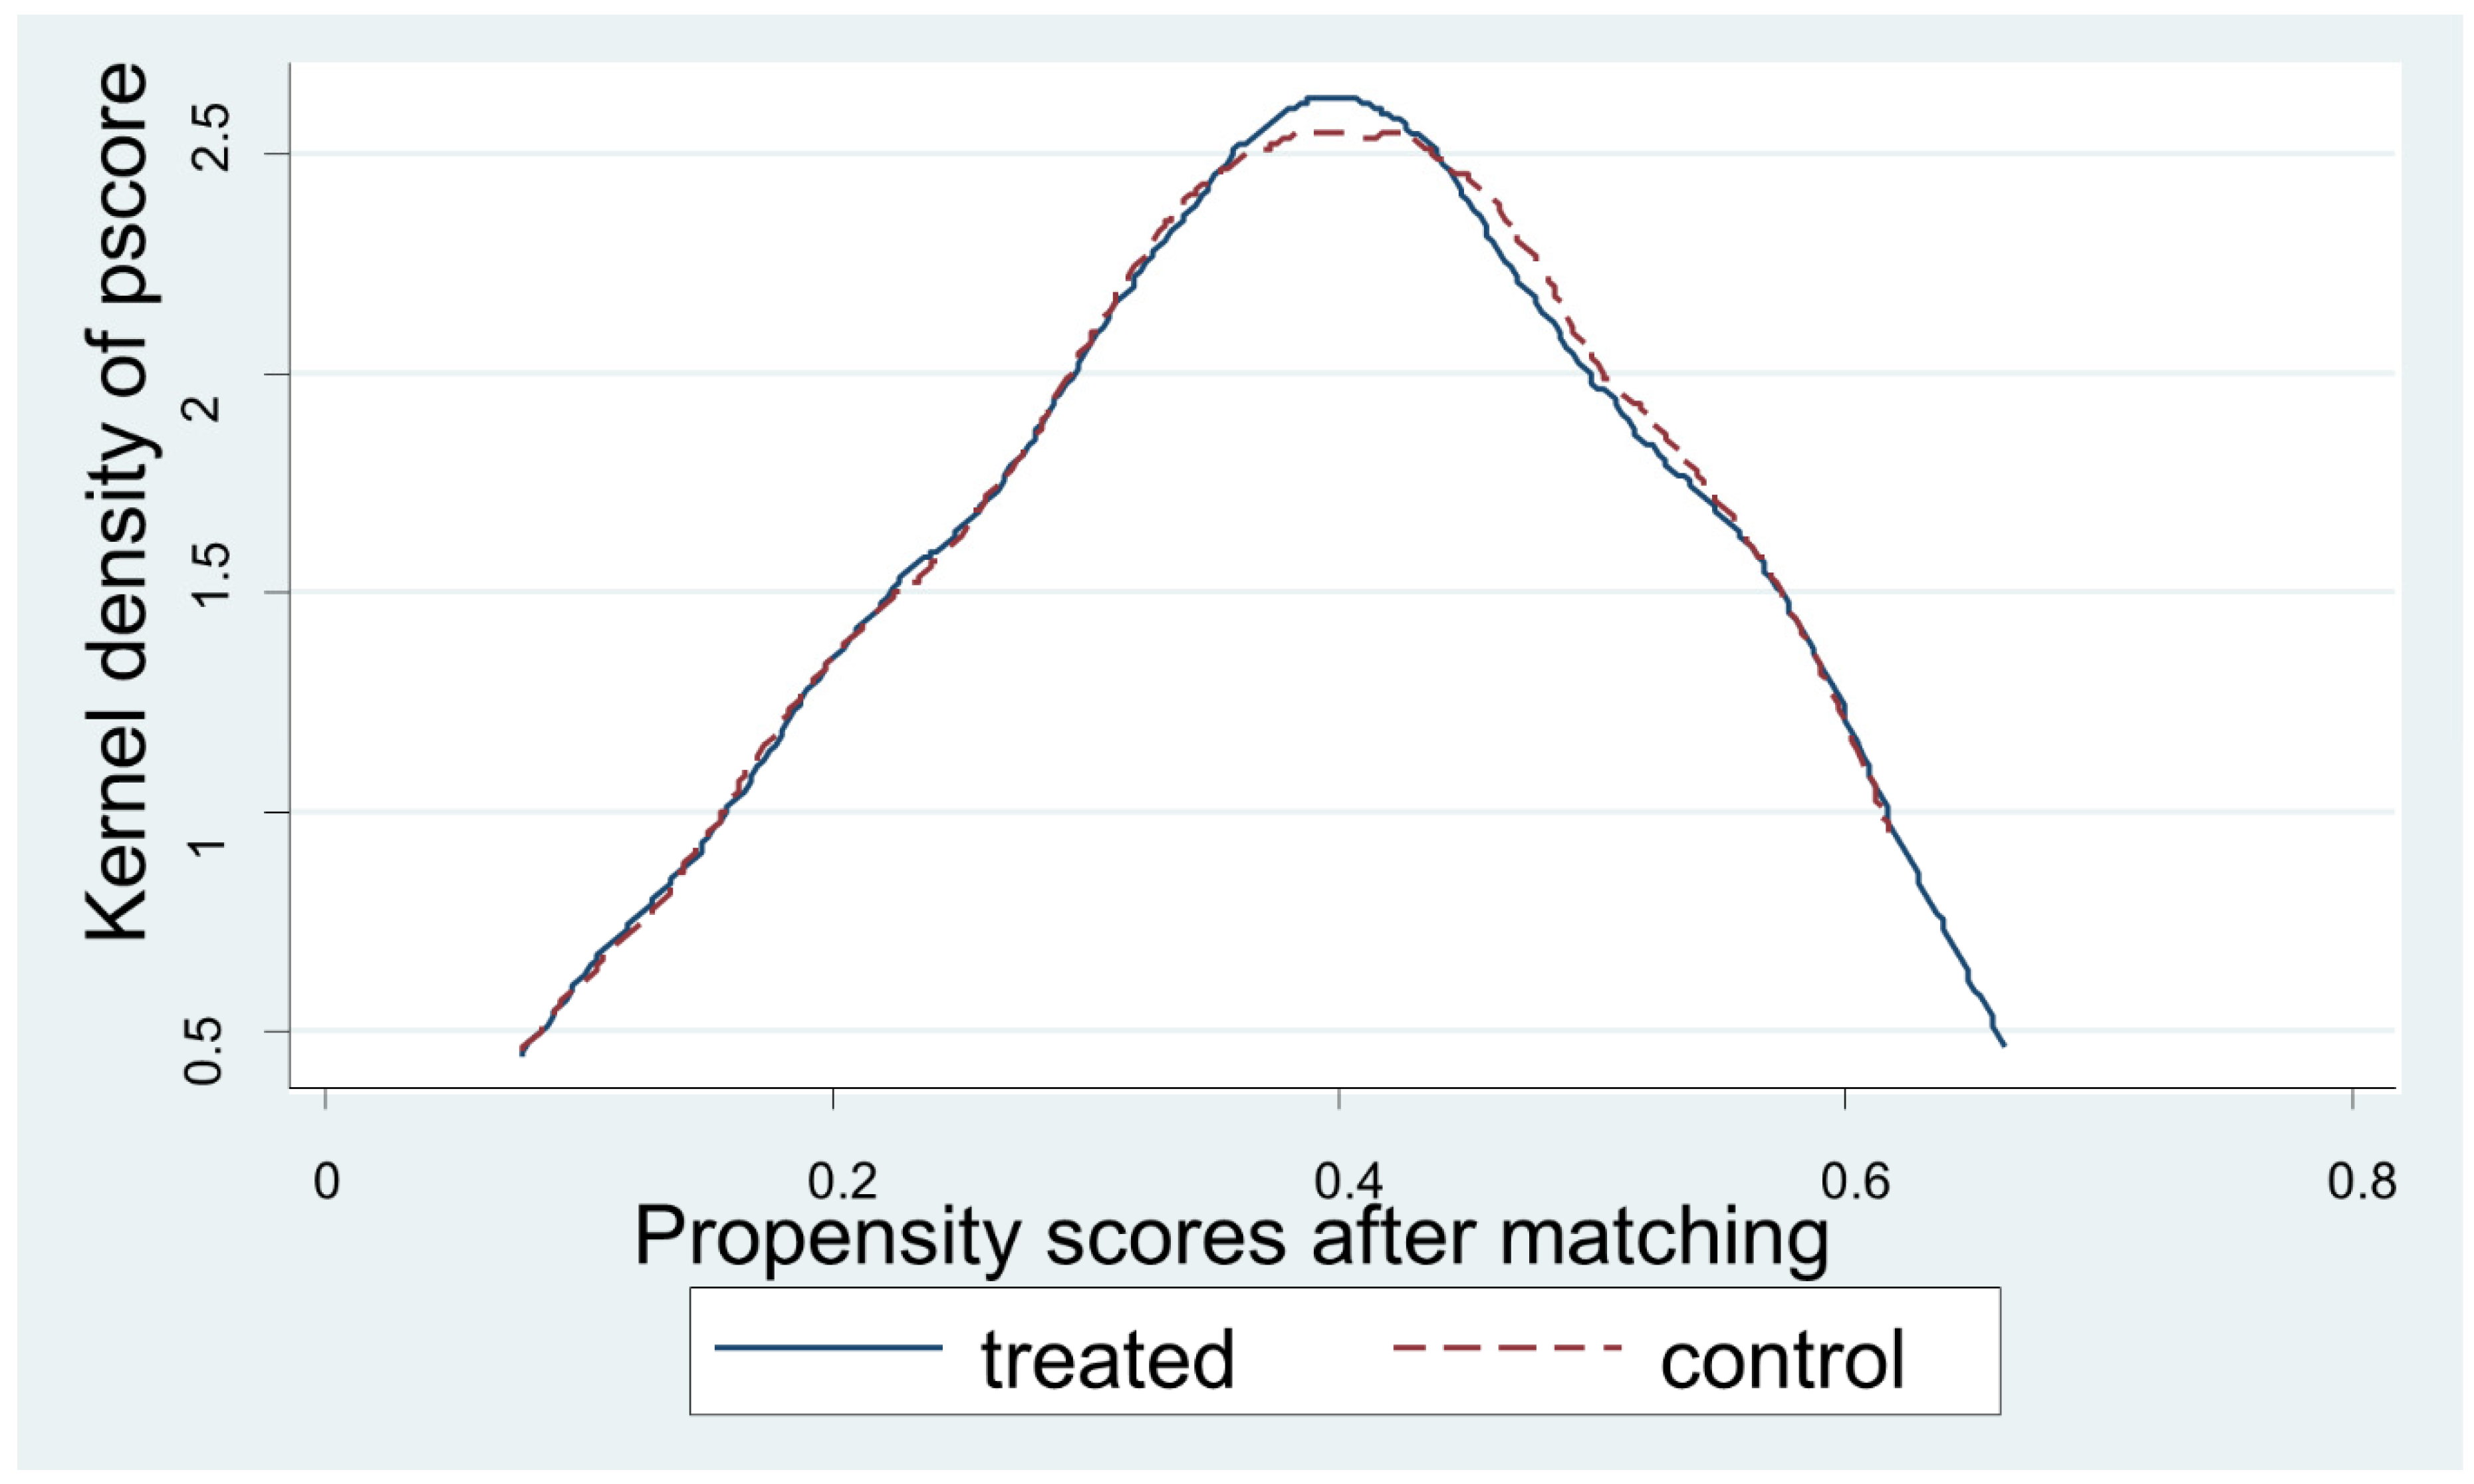
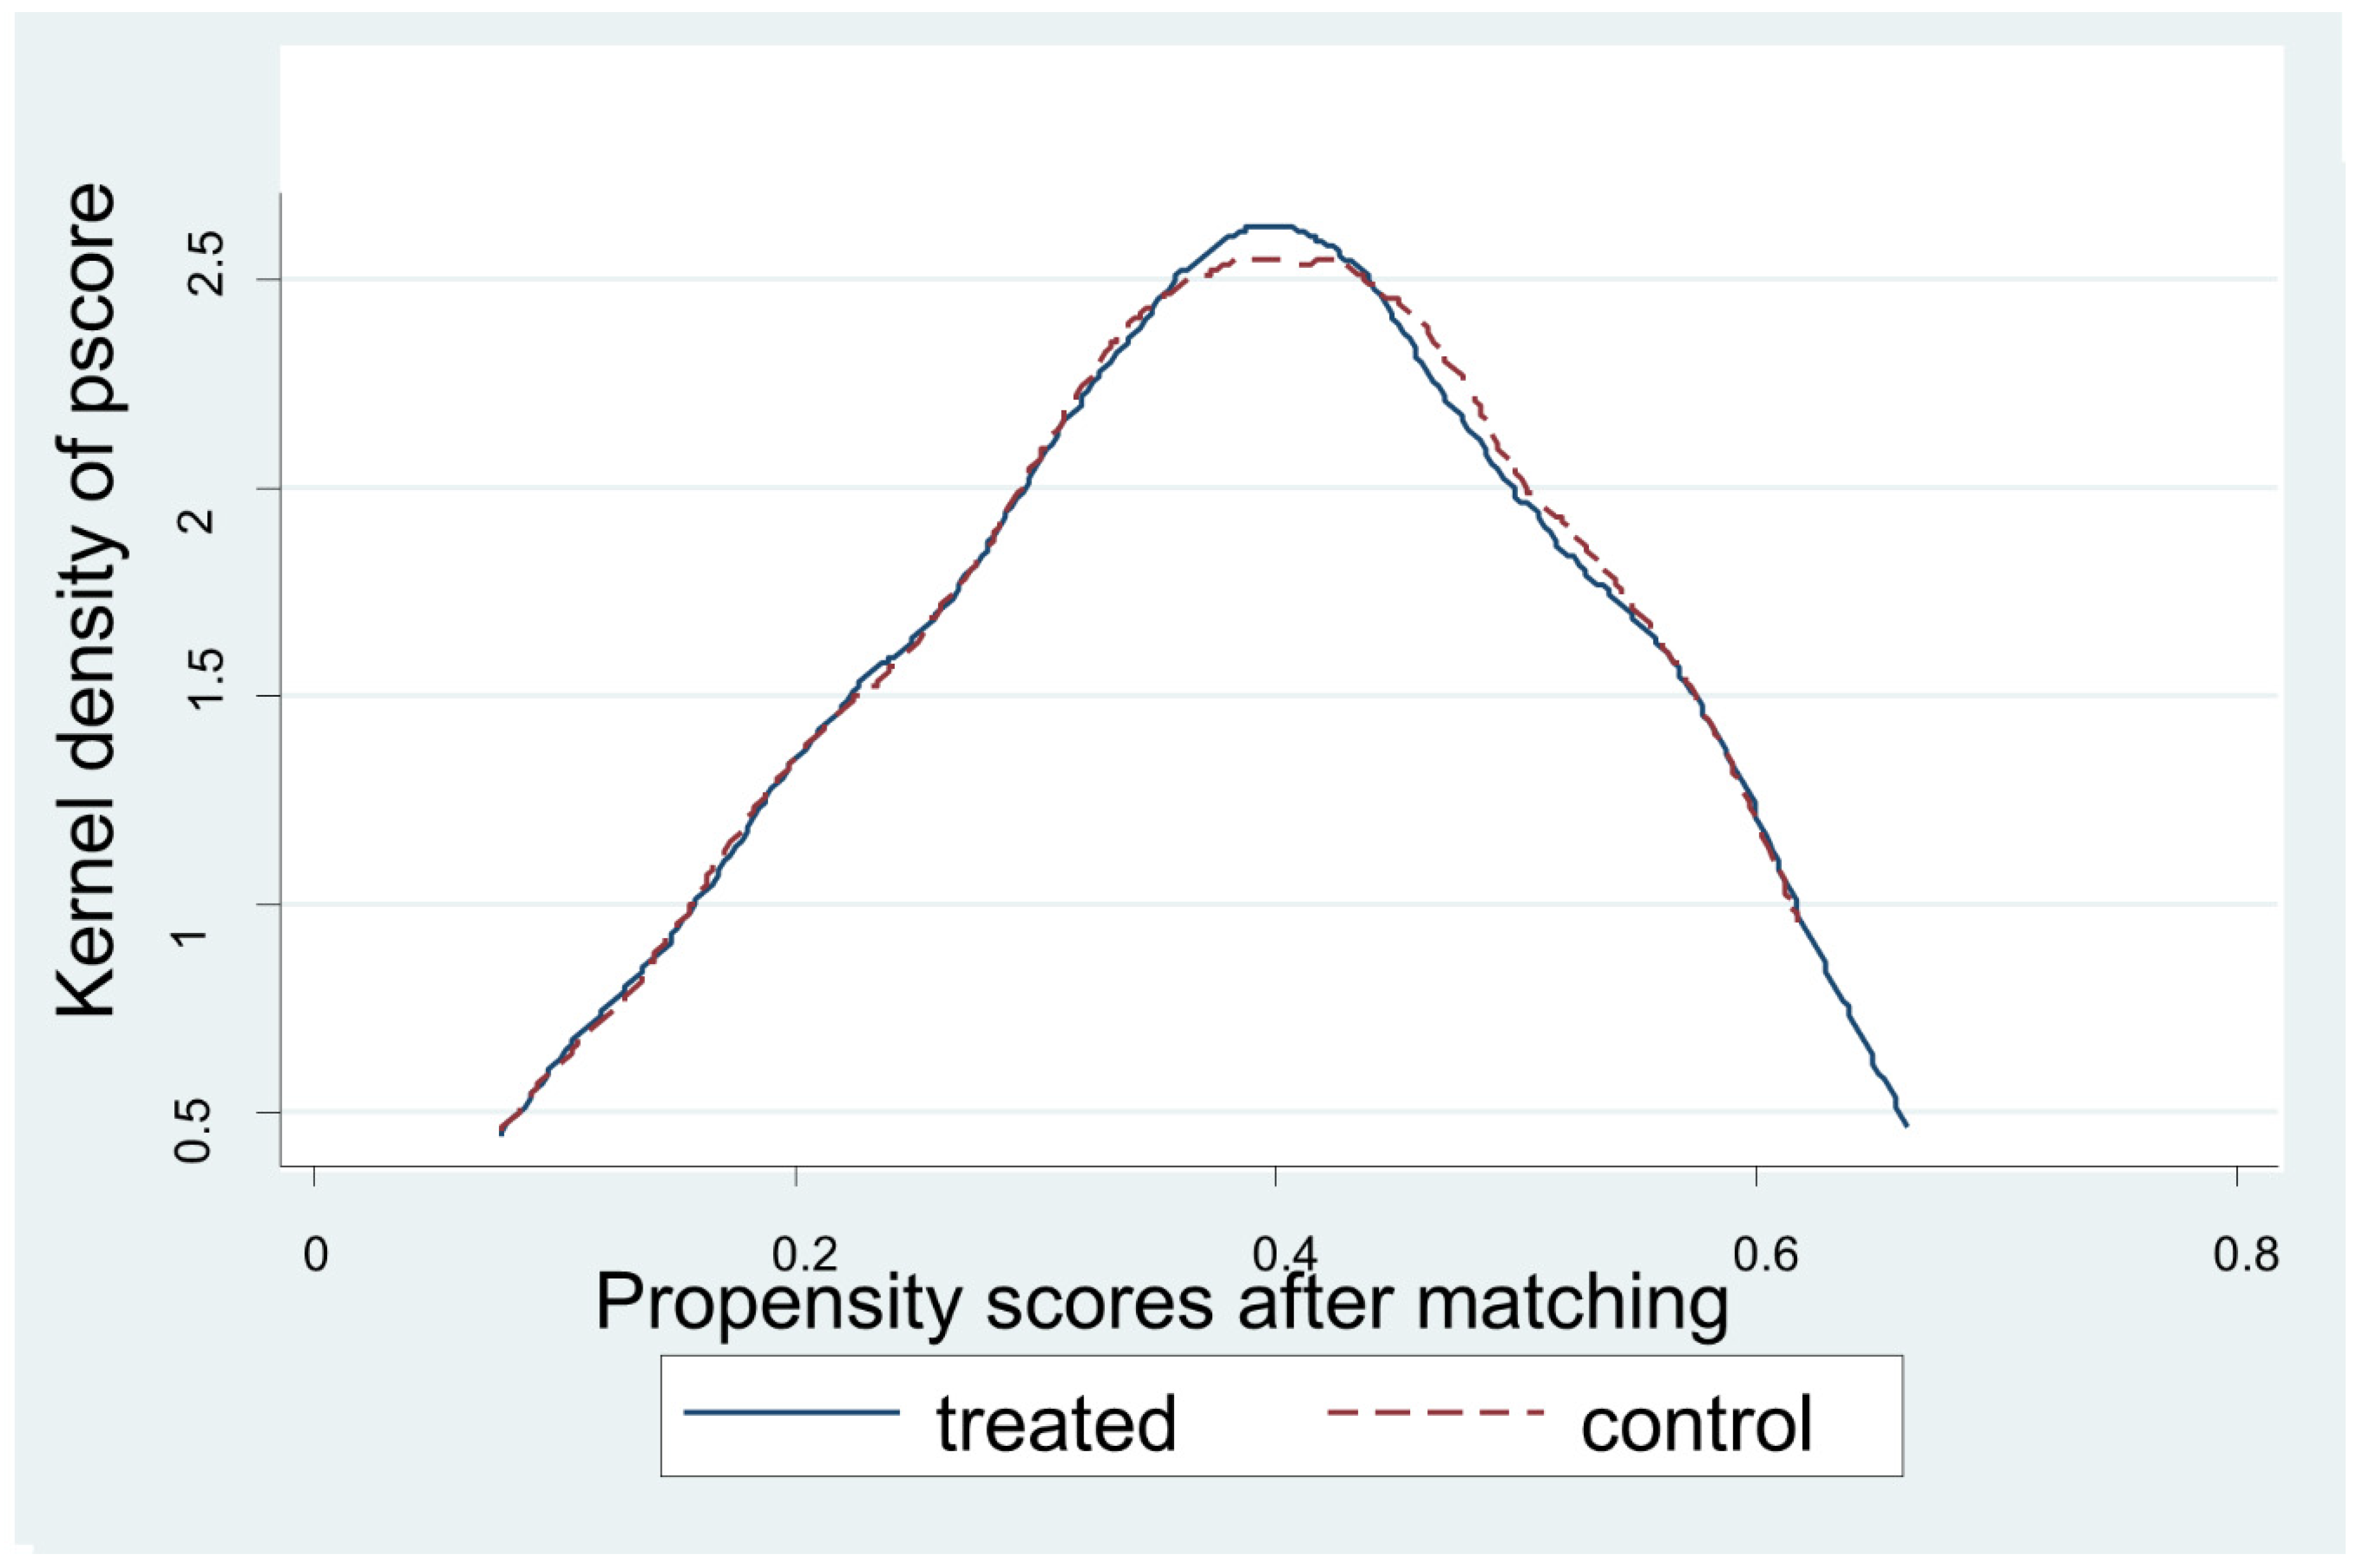
Appendix B. PSM Model Fitness
- Testing the balance of covariates
| Variable Characteristics | Variable | Before Matching (Mean) | After Matching (Mean) | ||||
|---|---|---|---|---|---|---|---|
| Treated | Control | t-Test | Treated | Control | t-Test | ||
| Household Characteristics | Age of household head | 7.0471 | 7.1256 | 0.341 | 7.0563 | 7.068 | 0.912 |
| Dependency ratio | 1.2723 | 1.5125 | 0.003 | 1.2899 | 1.2201 | 0.412 | |
| Livestock size | 4.8068 | 4.4806 | 0.206 | 4.5864 | 4.2425 | 0.203 | |
| Frequency of development agents contact | 3.9896 | 3.9366 | 0.857 | 4.0437 | 4.5355 | 0.183 | |
| Education level of household head | 0.40625 | 0.27317 | 0.001 | 0.38251 | 0.40437 | 0.670 | |
| Access to credit | 0.66667 | 0.66098 | 0.891 | 0.6776 | 0.62842 | 0.324 | |
| Distance from home to district market | 111.48 | 133.73 | 0.002 | 111.64 | 111.07 | 0.945 | |
| Plot Characteristics | Use of improved seed | 0.39583 | 0.22195 | 0.000 | 39344 | 0.25683 | 0.005 |
| Plot size | 4.3815 | 4.5244 | 0.488 | 4.2964 | 4.2787 | 0.940 | |
| Plot distance from dwelling | 15.417 | 24.81 | 0.000 | 15.787 | 16.885 | 0.637 | |
| Land tenure status | 0.84896 | 0.83171 | 0.594 | 0.85246 | 0.79235 | 0.13 | |
- Sensitivity analysis
| Outcome Variables | Gamma | sig+ | sig- | t-hat+ | t-hat- | CI+ | CI- |
|---|---|---|---|---|---|---|---|
| Amount of fertilizer used | 1 | 0 | 0 | 25 | 25 | 25 | 26 |
| 1.05 | 0 | 0 | 25 | 25 | 25 | 27.5 | |
| 1.1 | 0 | 0 | 25 | 25 | 25 | 30 | |
| 1.15 | 0 | 0 | 25 | 25 | 25 | 30 | |
| 1.2 | 0 | 0 | 25 | 25 | 25 | 32.5 | |
| 1.25 | 0 | 0 | 25 | 27.5 | 25 | 32.5 | |
| 1.3 | 0 | 0 | 25 | 30 | 25 | 35 | |
| 1.35 | 0 | 0 | 25 | 30 | 25 | 37.5 | |
| 1.4 | 0 | 0 | 25 | 30 | 25 | 37.5 | |
| 1.45 | 0 | 0 | 25 | 32.5 | 25 | 37.5 | |
| 1.5 | 0 | 0 | 25 | 32.5 | 25 | 37.5 | |
| 1 | 0 | 0 | 25 | 25 | 25 | 26 | |
| Amount of Farmyard Manure Used | 1 | 0 | 0 | 3 | 3 | −3.5e–07 | 50 |
| 1.05 | 0 | 0 | −3.5e–07 | 10 | −3.5e–07 | 50 | |
| 1.1 | 0 | 0 | −3.5e–07 | 25 | −3.5e–07 | 50 | |
| 1.15 | 0 | 0 | −3.5e–07 | 25 | −3.5e–07 | 50 | |
| 1.2 | 0 | 0 | −3.5e–07 | 50 | −3.5e–07 | 50 | |
| 1.25 | 0 | 0 | −3.5e–07 | 50 | −3.5e–07 | 50 | |
| 1.3 | 0 | 0 | −3.5e–07 | 50 | −3.5e–07 | 50 | |
| 1.35 | 0 | 0 | −3.5e–07 | 50 | −3.5e–07 | 60 | |
| 1.4 | 0 | 0 | −3.5e–07 | 50 | −3.5e–07 | 75 | |
| 1.45 | 0 | 0 | −3.5e–07 | 50 | −3.5e–07 | 100 | |
| 1.5 | 0 | 0 | −3.5e–07 | 50 | −3.5e–07 | 100 | |
| Crop yield | 1 | 0 | 0 | 201.5 | 201.5 | 200 | 225 |
| 1.05 | 0 | 0 | 200.5 | 225 | 200 | 250 | |
| 1.1 | 0 | 0 | 200 | 225 | 200 | 250 | |
| 1.15 | 0 | 0 | 200 | 225 | 175 | 250 | |
| 1.2 | 0 | 0 | 200 | 250 | 175 | 250 | |
| 1.25 | 0 | 0 | 200 | 250 | 175 | 250.25 | |
| 1.3 | 0 | 0 | 181 | 250 | 175 | 251.25 | |
| 1.35 | 0 | 0 | 175 | 250 | 155 | 275 | |
| 1.4 | 0 | 0 | 175 | 250 | 151.25 | 275 | |
| 1.45 | 0 | 0 | 175 | 250.5 | 150.625 | 275 | |
| 1.5 | 0 | 0 | 175 | 251.25 | 150.25 | 300 | |
| Annual crop income | 1 | 0 | 0 | 3585.37 | 3585.37 | 3187 | 3983.75 |
| 1.05 | 0 | 0 | 3234.8 | 3585.38 | 3187 | 3995.7 | |
| 1.1 | 0 | 0 | 3202.93 | 3983.75 | 3187 | 4182.94 | |
| 1.15 | 0 | 0 | 3192.98 | 3983.75 | 2788.63 | 4382.13 | |
| 1.2 | 0 | 0 | 3187 | 3983.75 | 2788.63 | 4780.5 | |
| 1.25 | 0 | 0 | 3187 | 3991.72 | 2788.62 | 4780.5 | |
| 1.3 | 0 | 0 | 3187 | 4015.62 | 2438.06 | 4780.5 | |
| 1.35 | 0 | 0 | 2812.53 | 4382.12 | 2410.17 | 4784.48 | |
| 1.4 | 0 | 0 | 2788.63 | 4382.13 | 2402.2 | 4792.45 | |
| 1.45 | 0 | 0 | 2788.62 | 4780.5 | 2398.22 | 4812.37 | |
| 1.5 | 0 | 0 | 2788.62 | 4780.5 | 2394.23 | 5015.54 |
- Choosing a Matching Algorithm
| Matching Methods | Ps R2 | LR chi2 | p > X2 | Mean Bias | Med Bias |
|---|---|---|---|---|---|
| Before matching | 0.317 | 418.34 | 0.000 | 13.1 | 14.3 |
| NNM (5) | 0.006 | 4.89 | 0.998 | 4.2 | 4.1 |
| KM (bind width .06) | 0.006 | 5.62 | 0.897 | 5.3 | 6.1 |
| RM (,06) | 0.006 | 4.89 | 0.998 | 4.2 | 4.1 |
| SS | 0.006 | 4.89 | 0.998 | 4.2 | 4.1 |
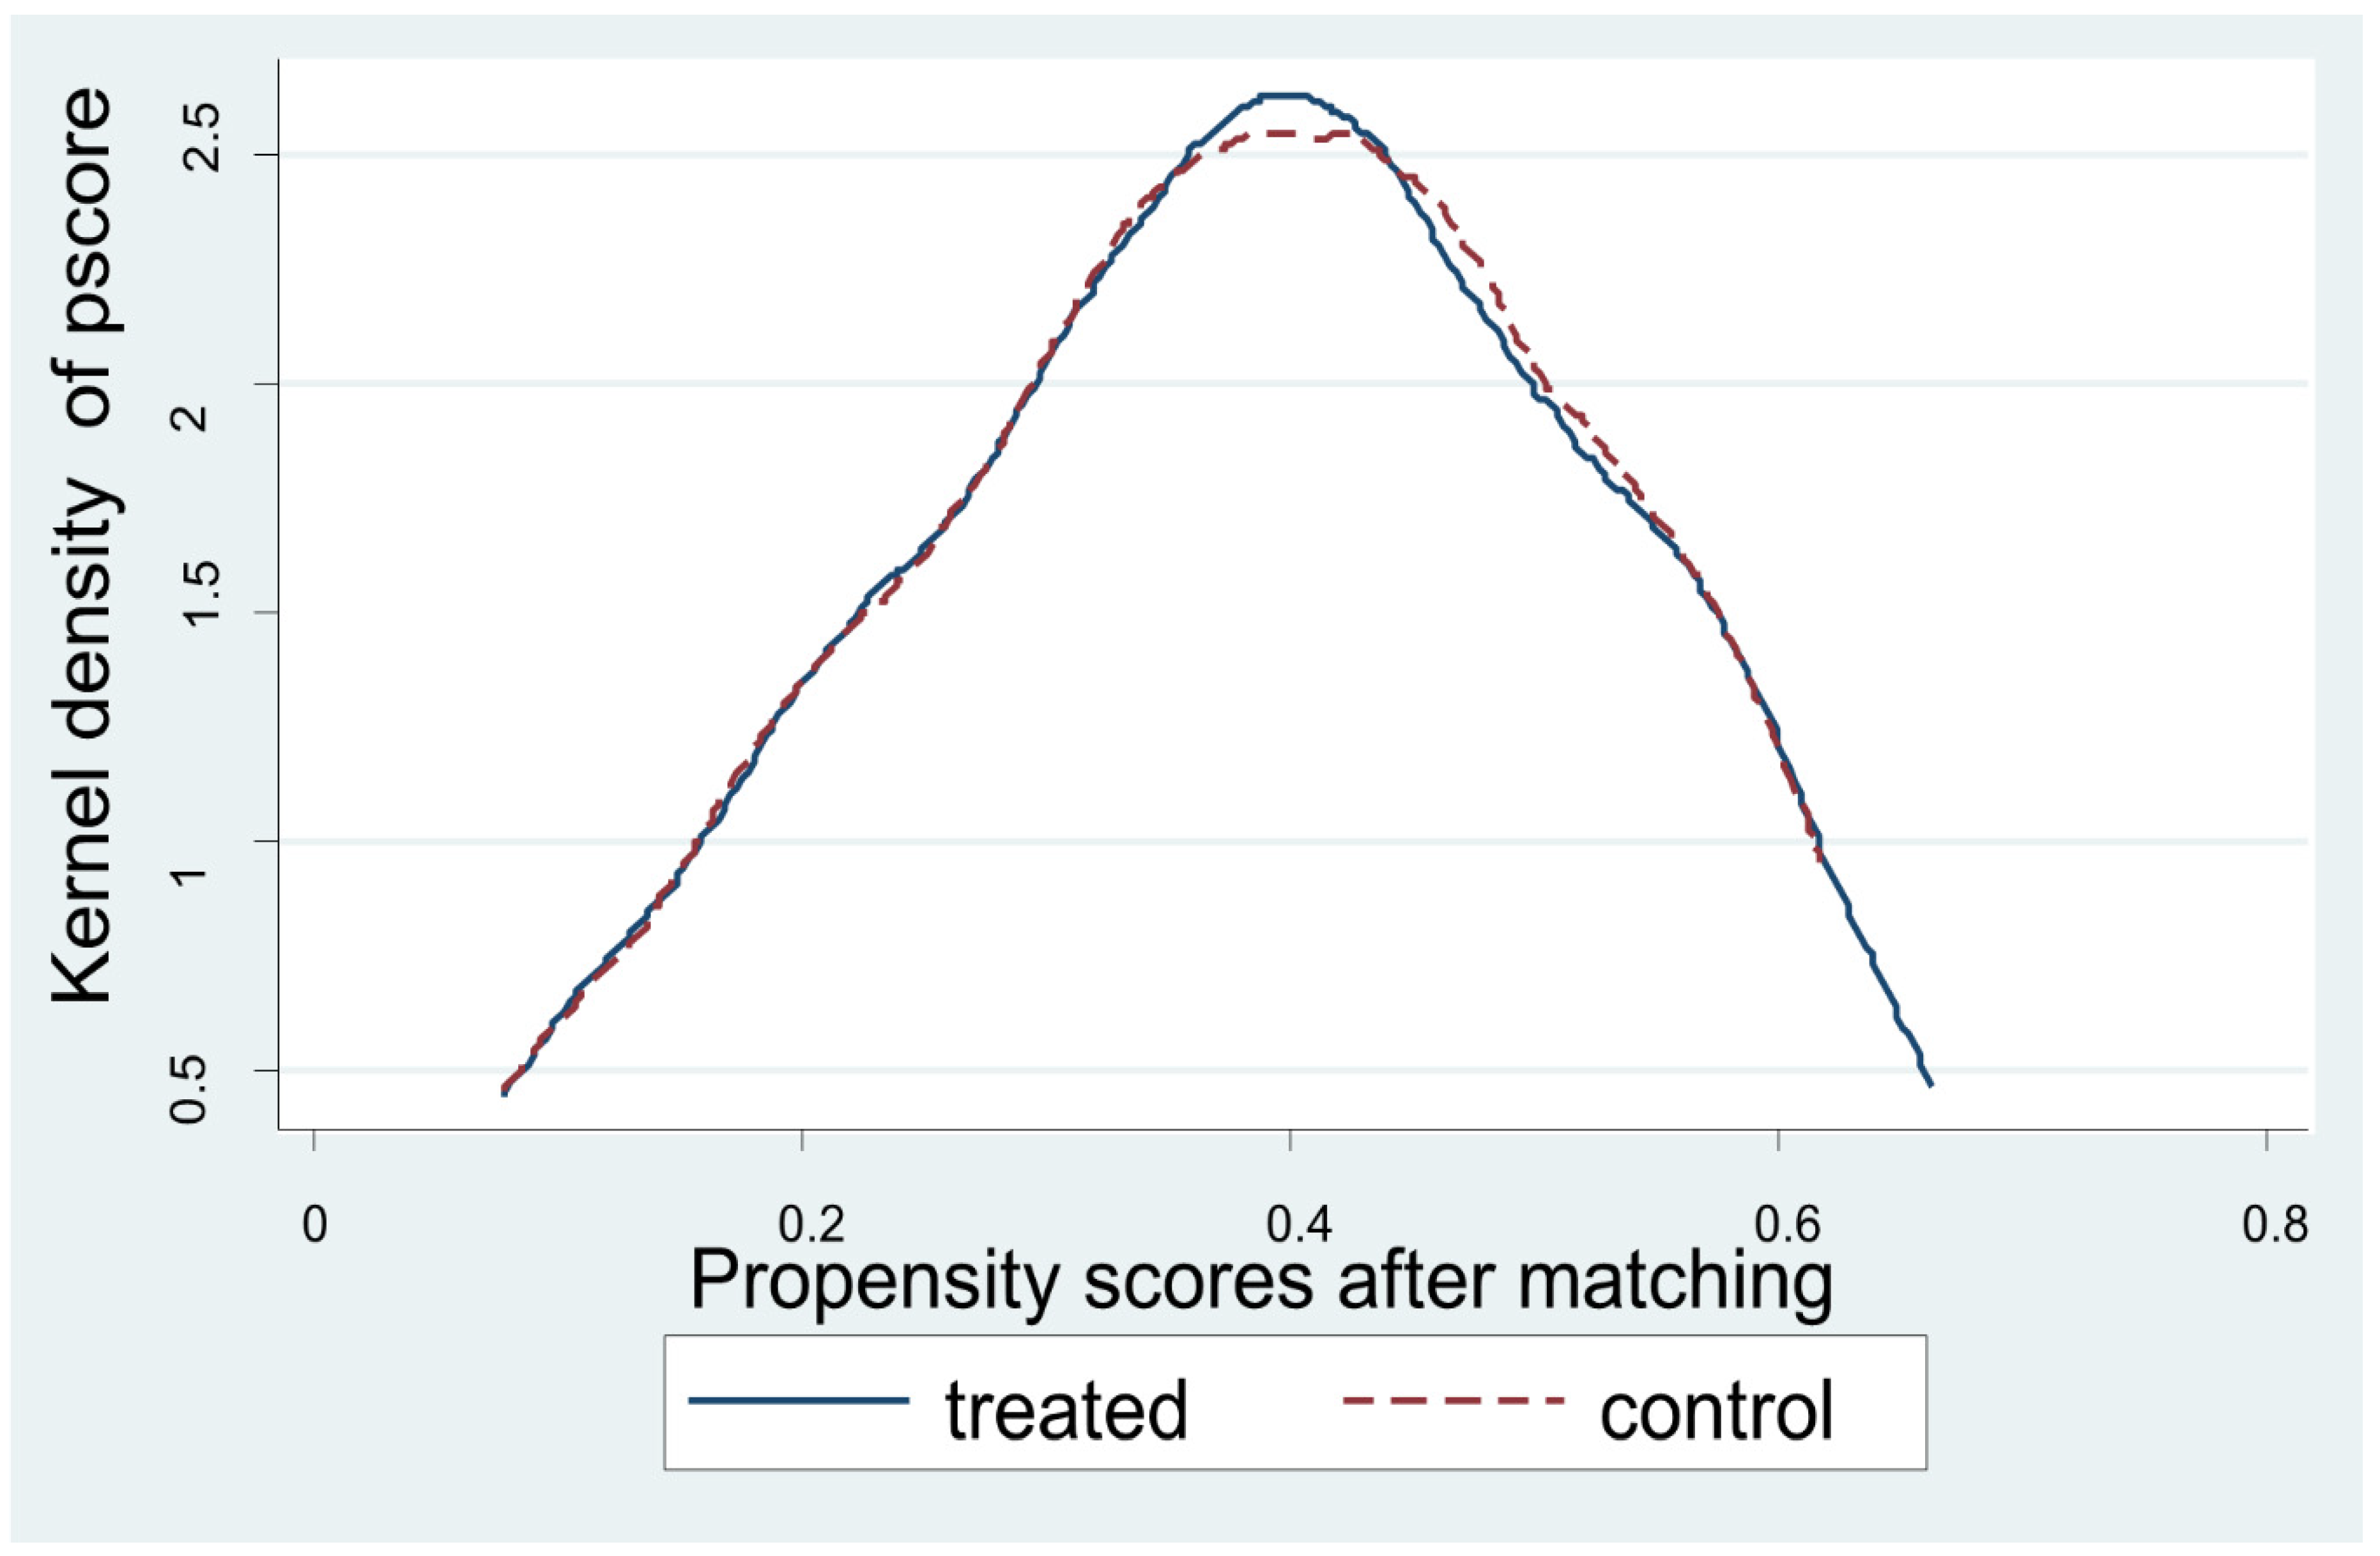

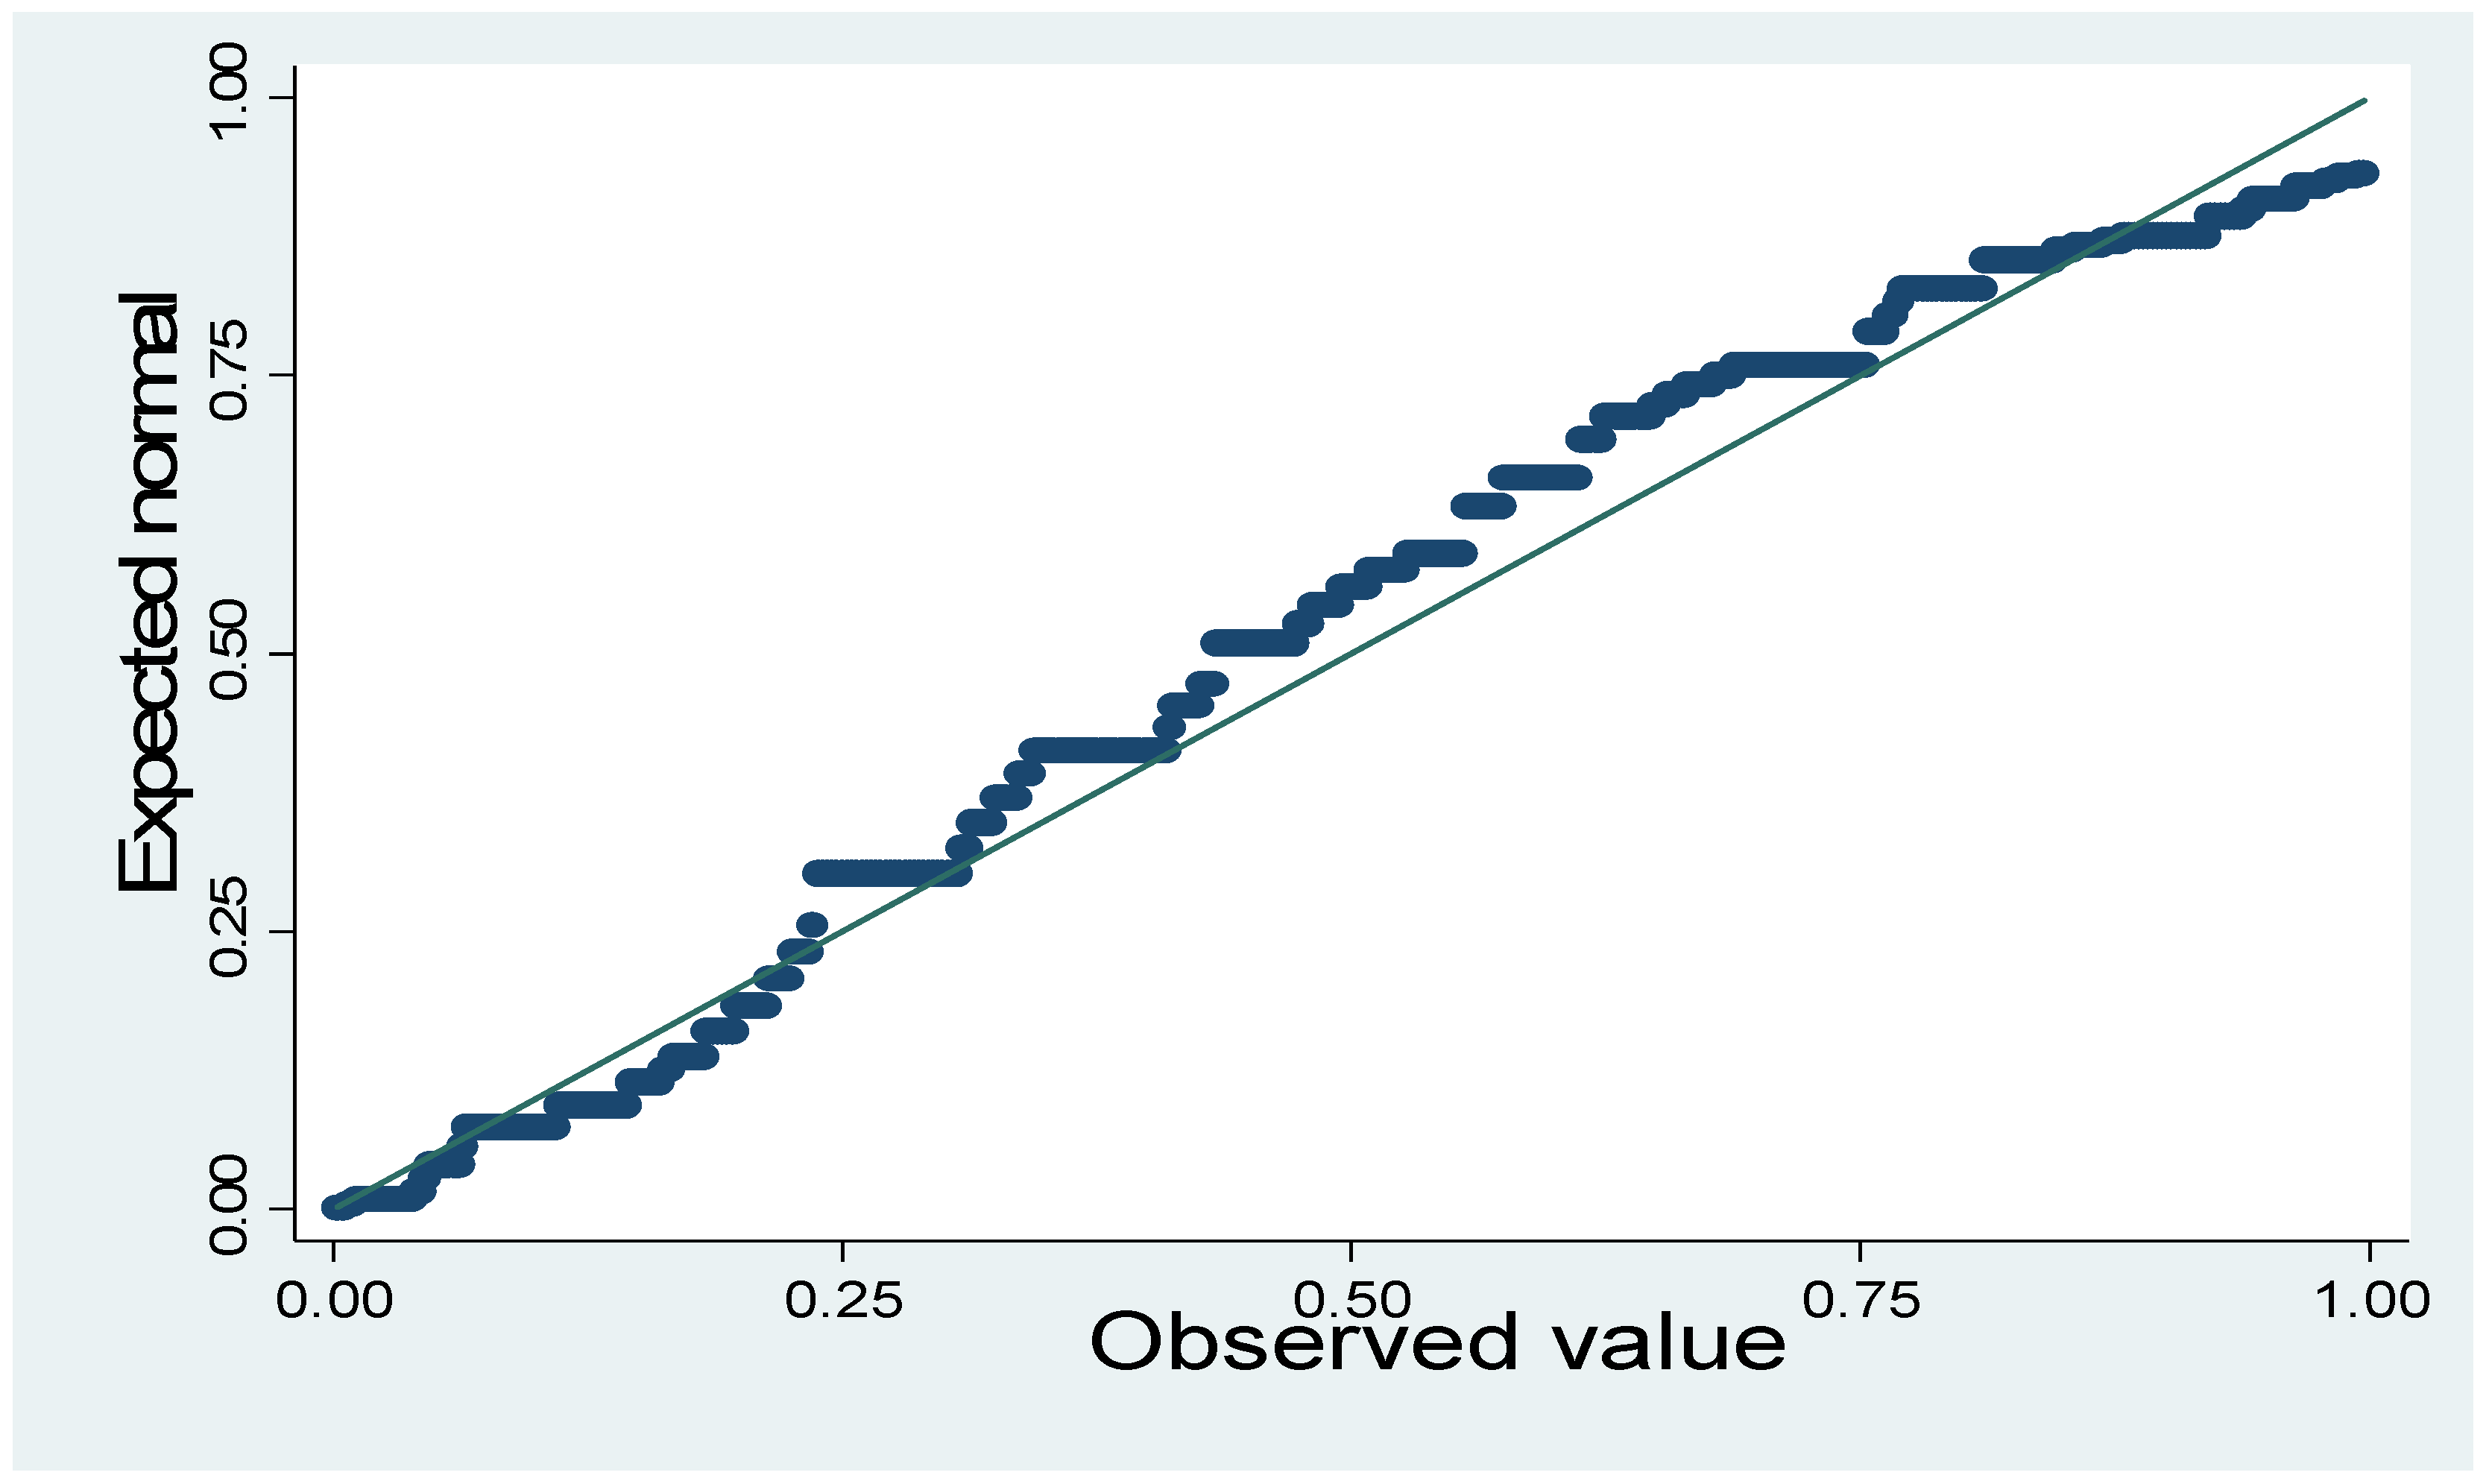
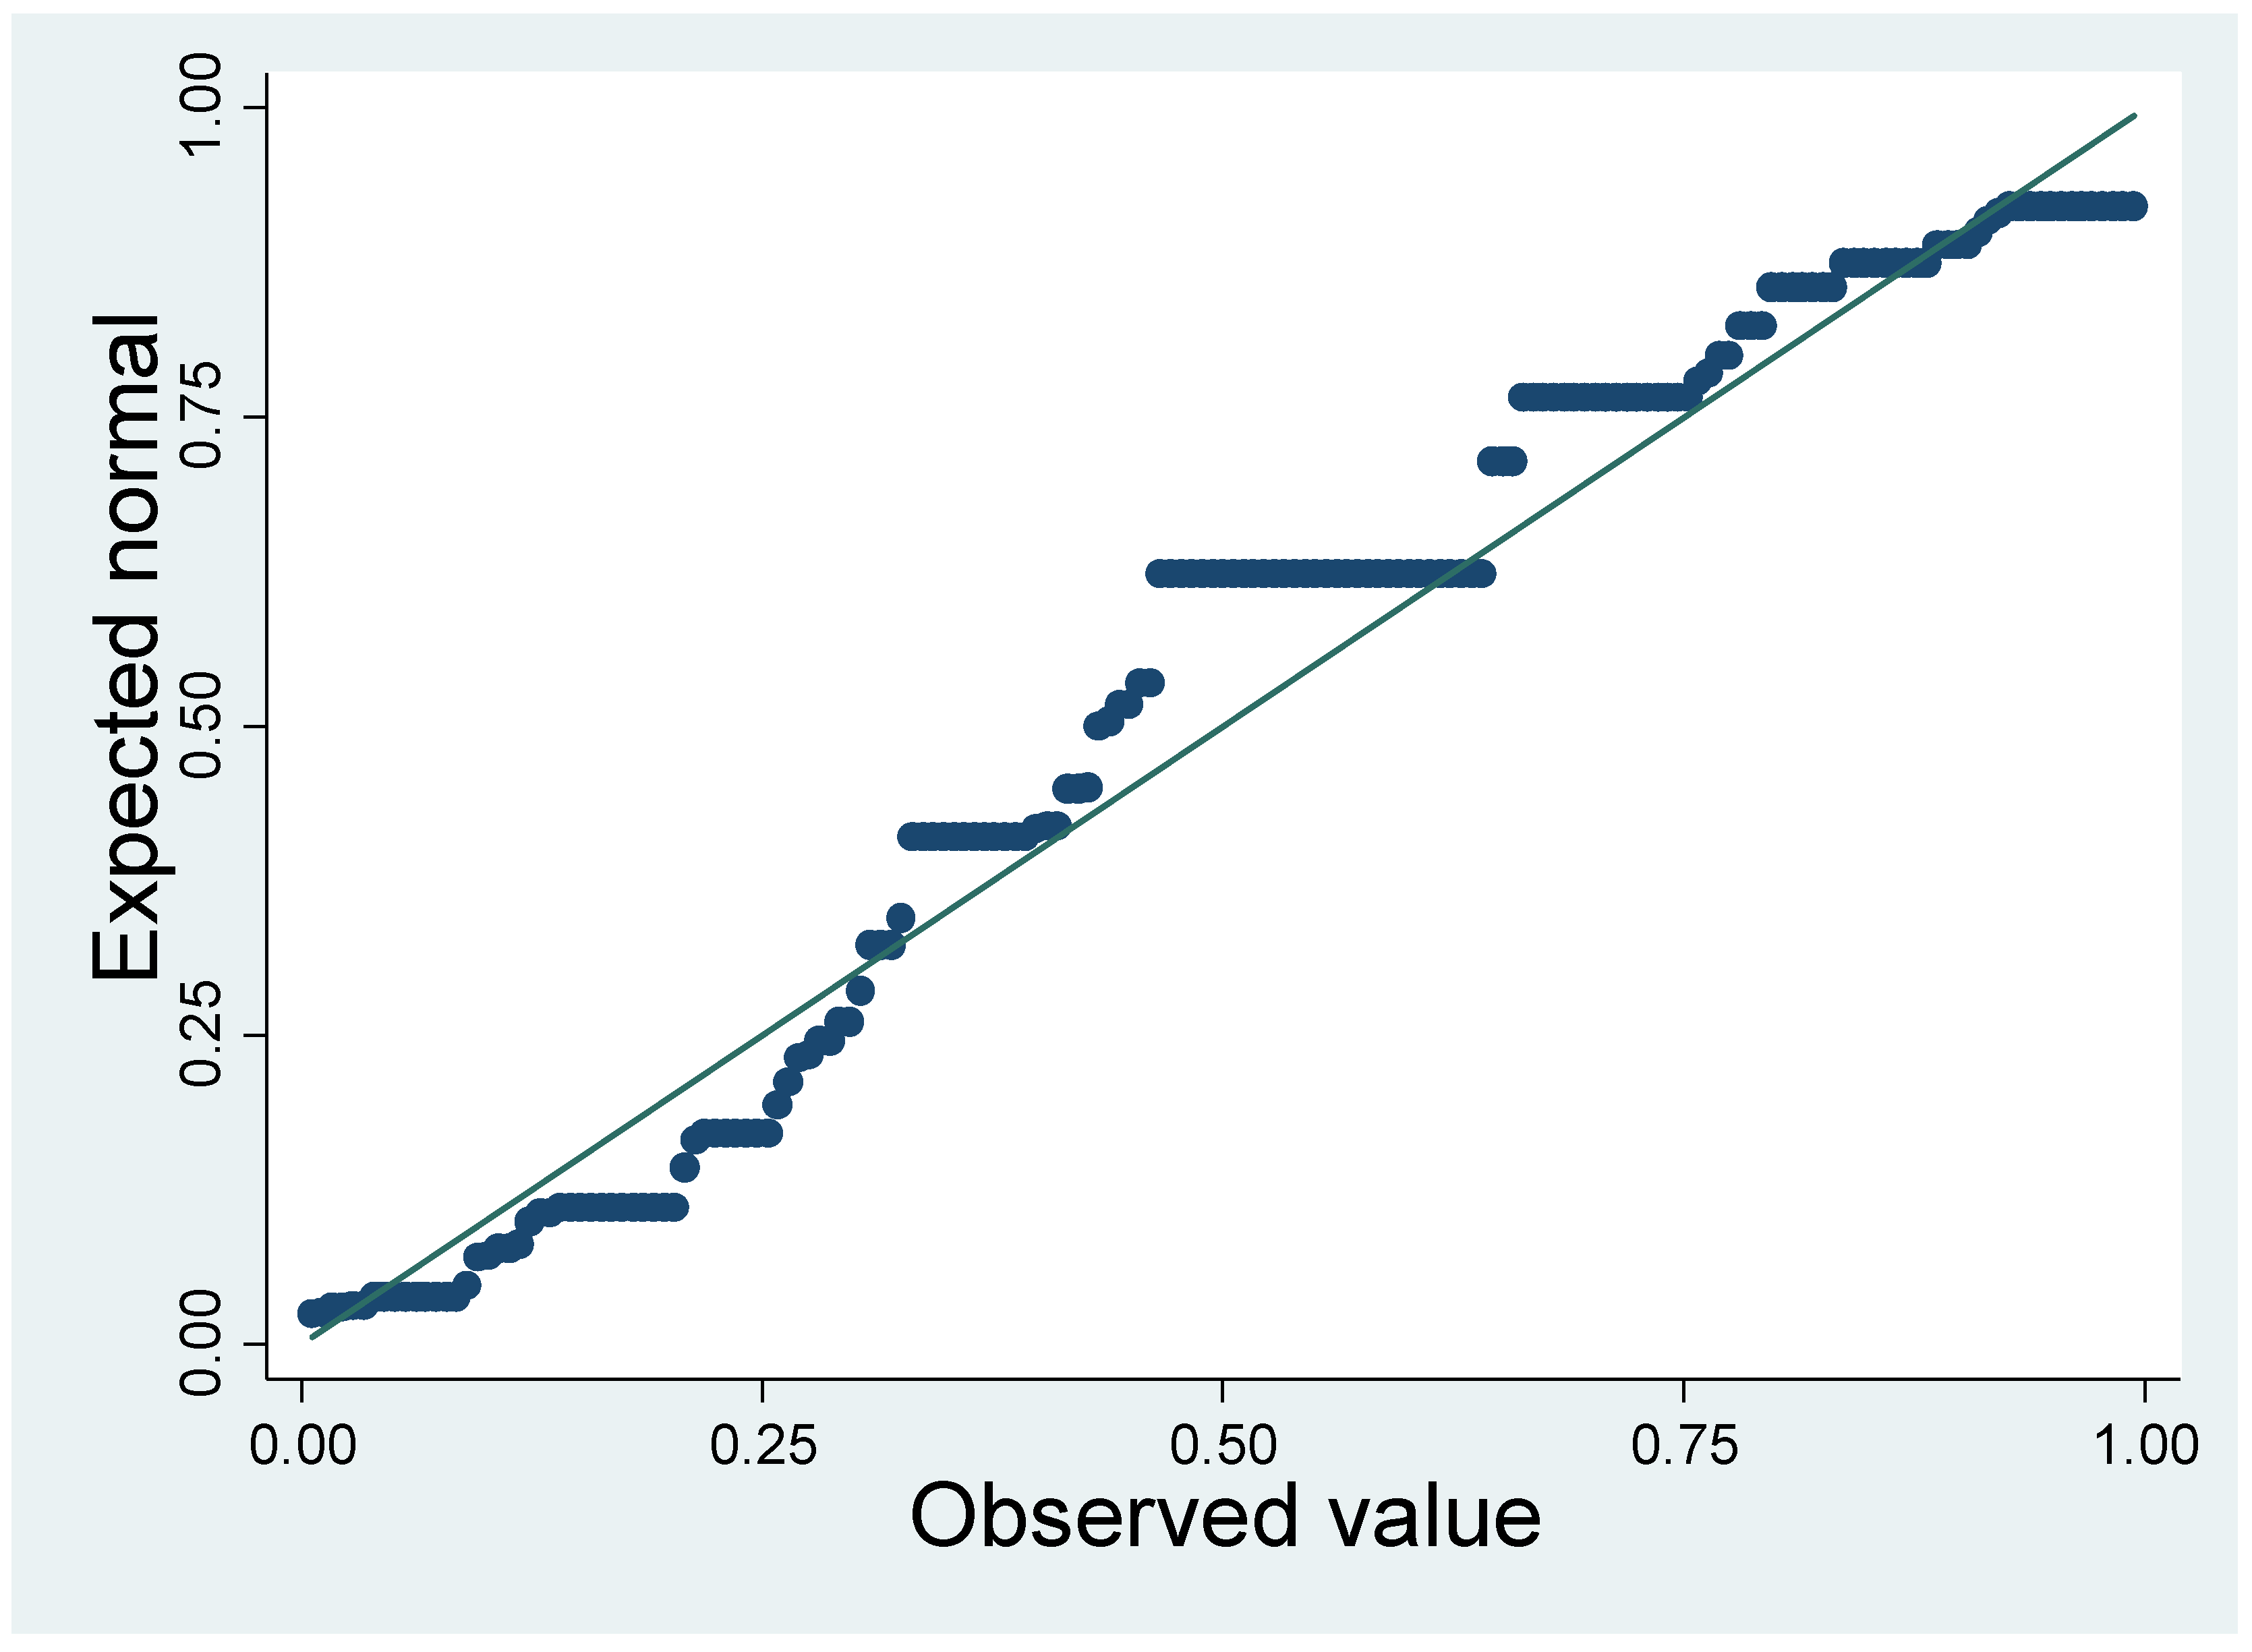
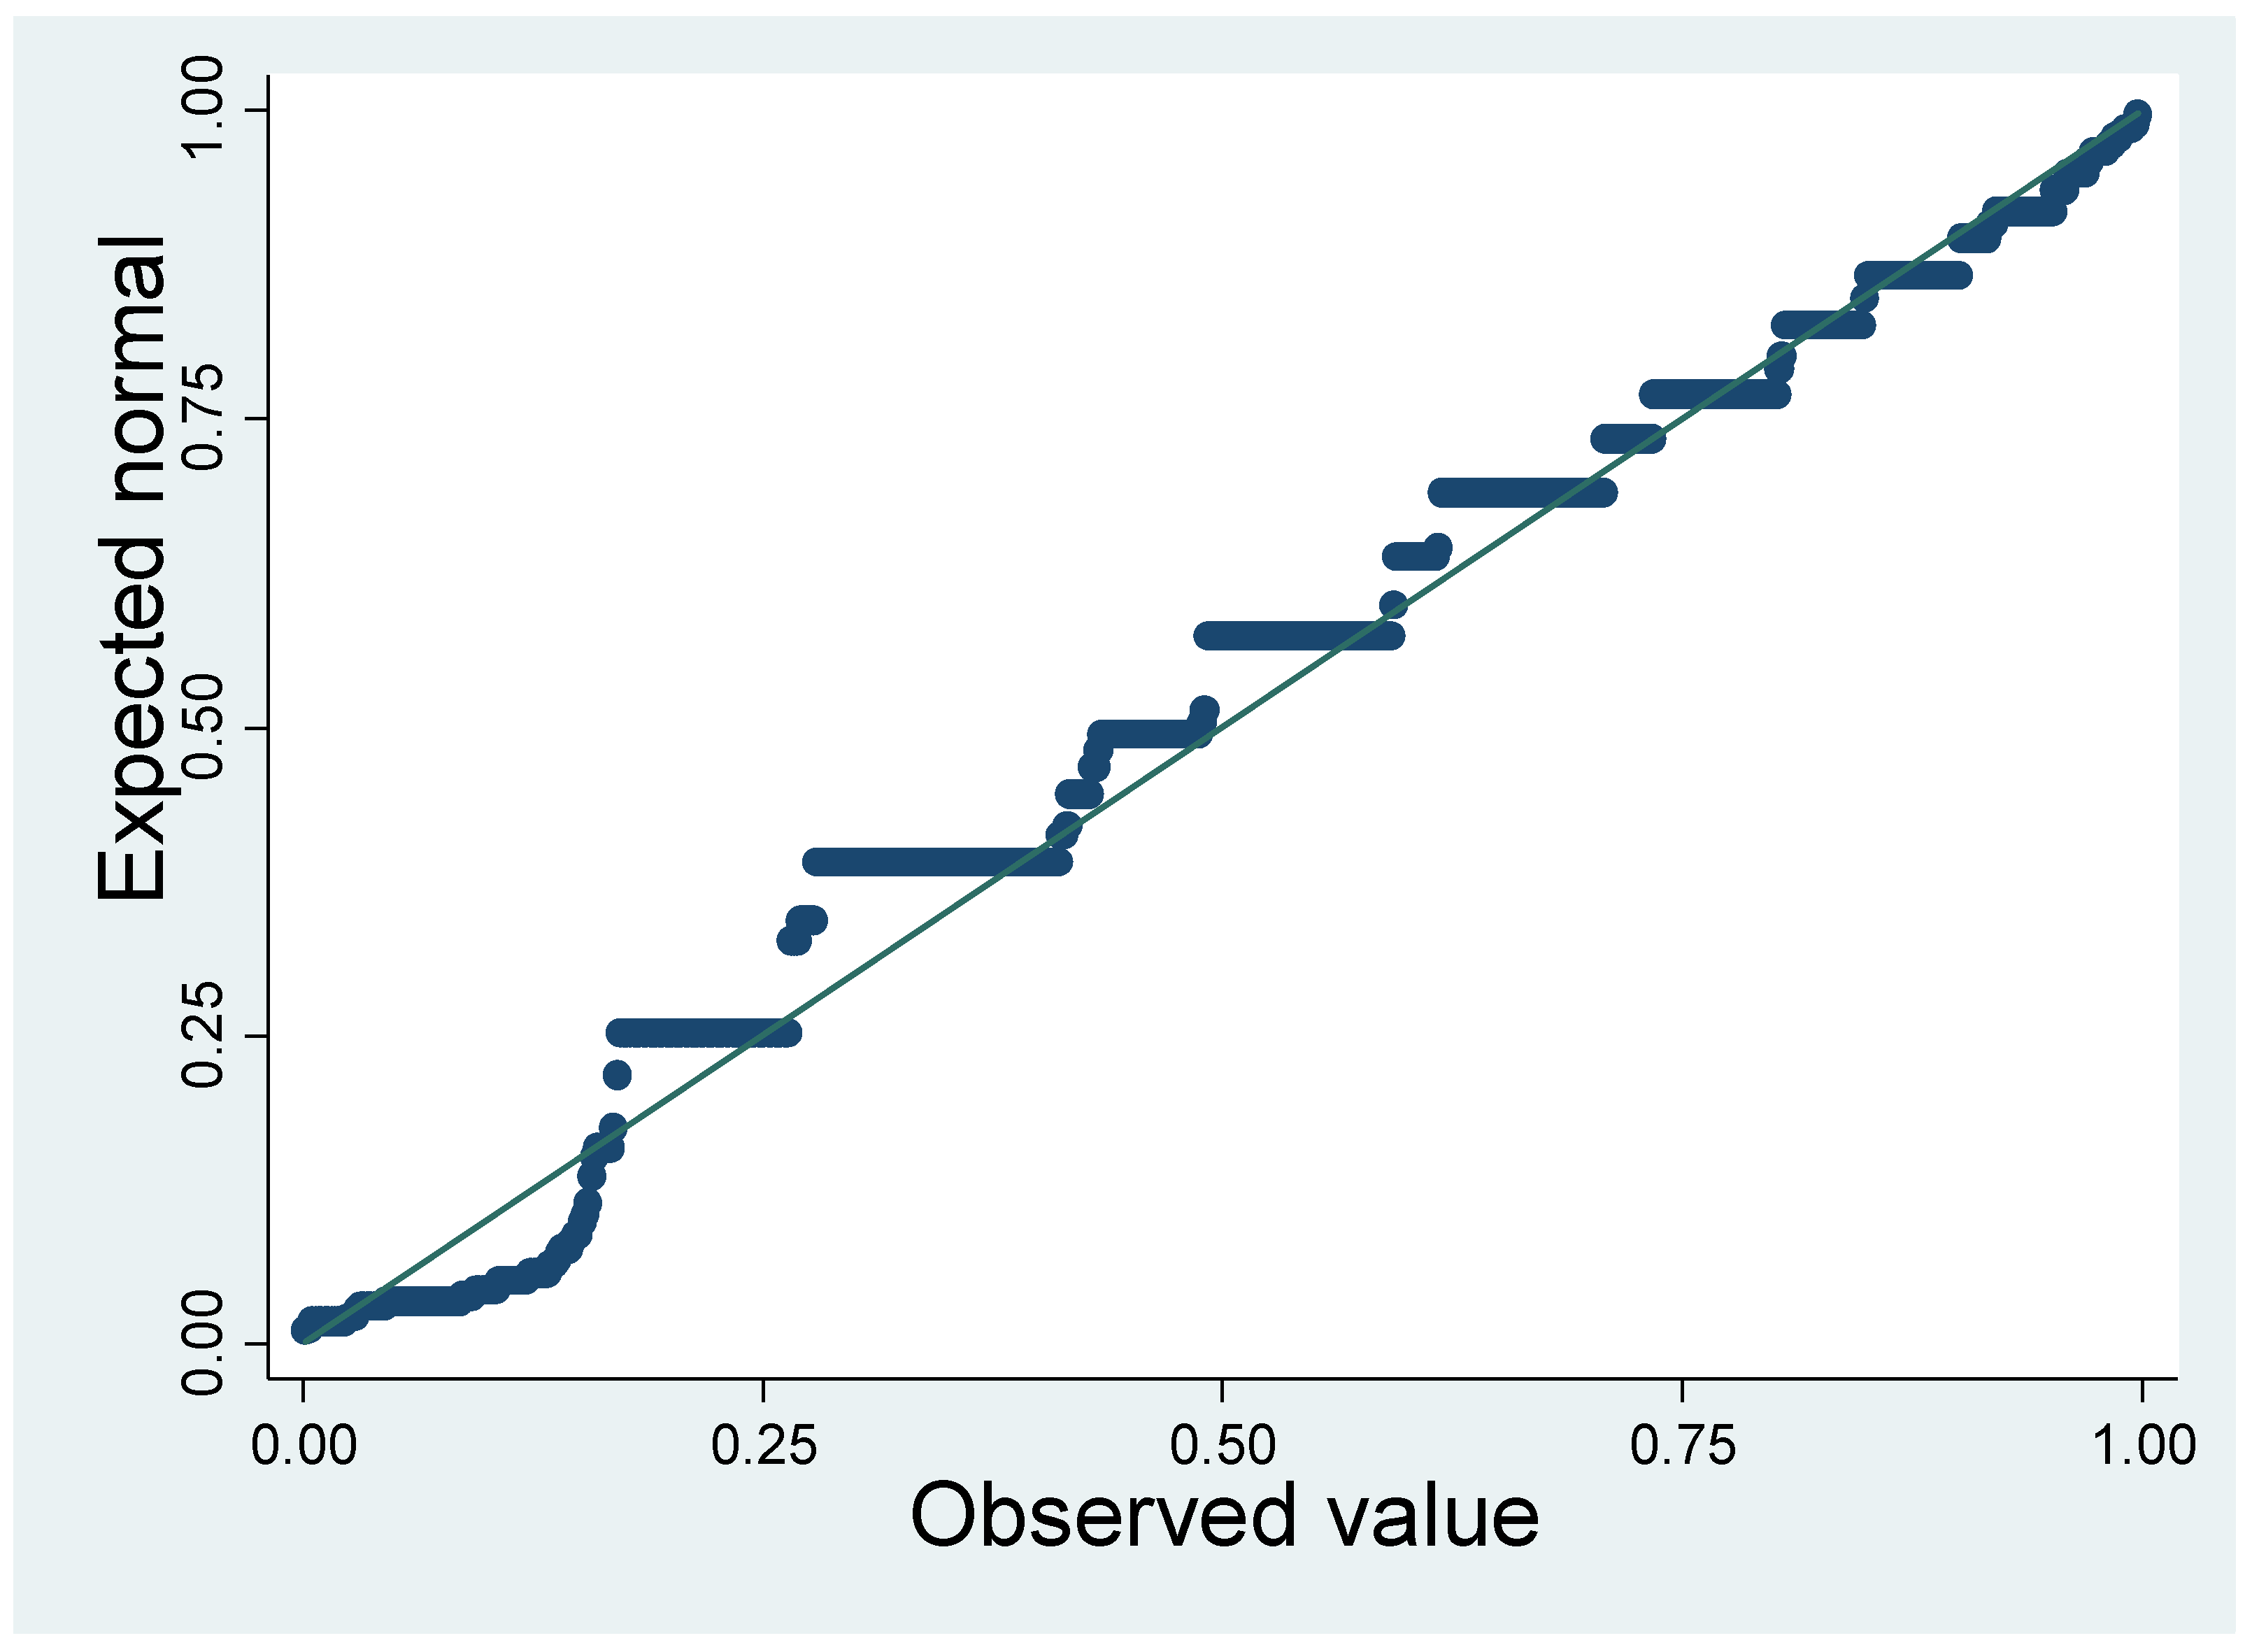
Appendix C. Normality Test
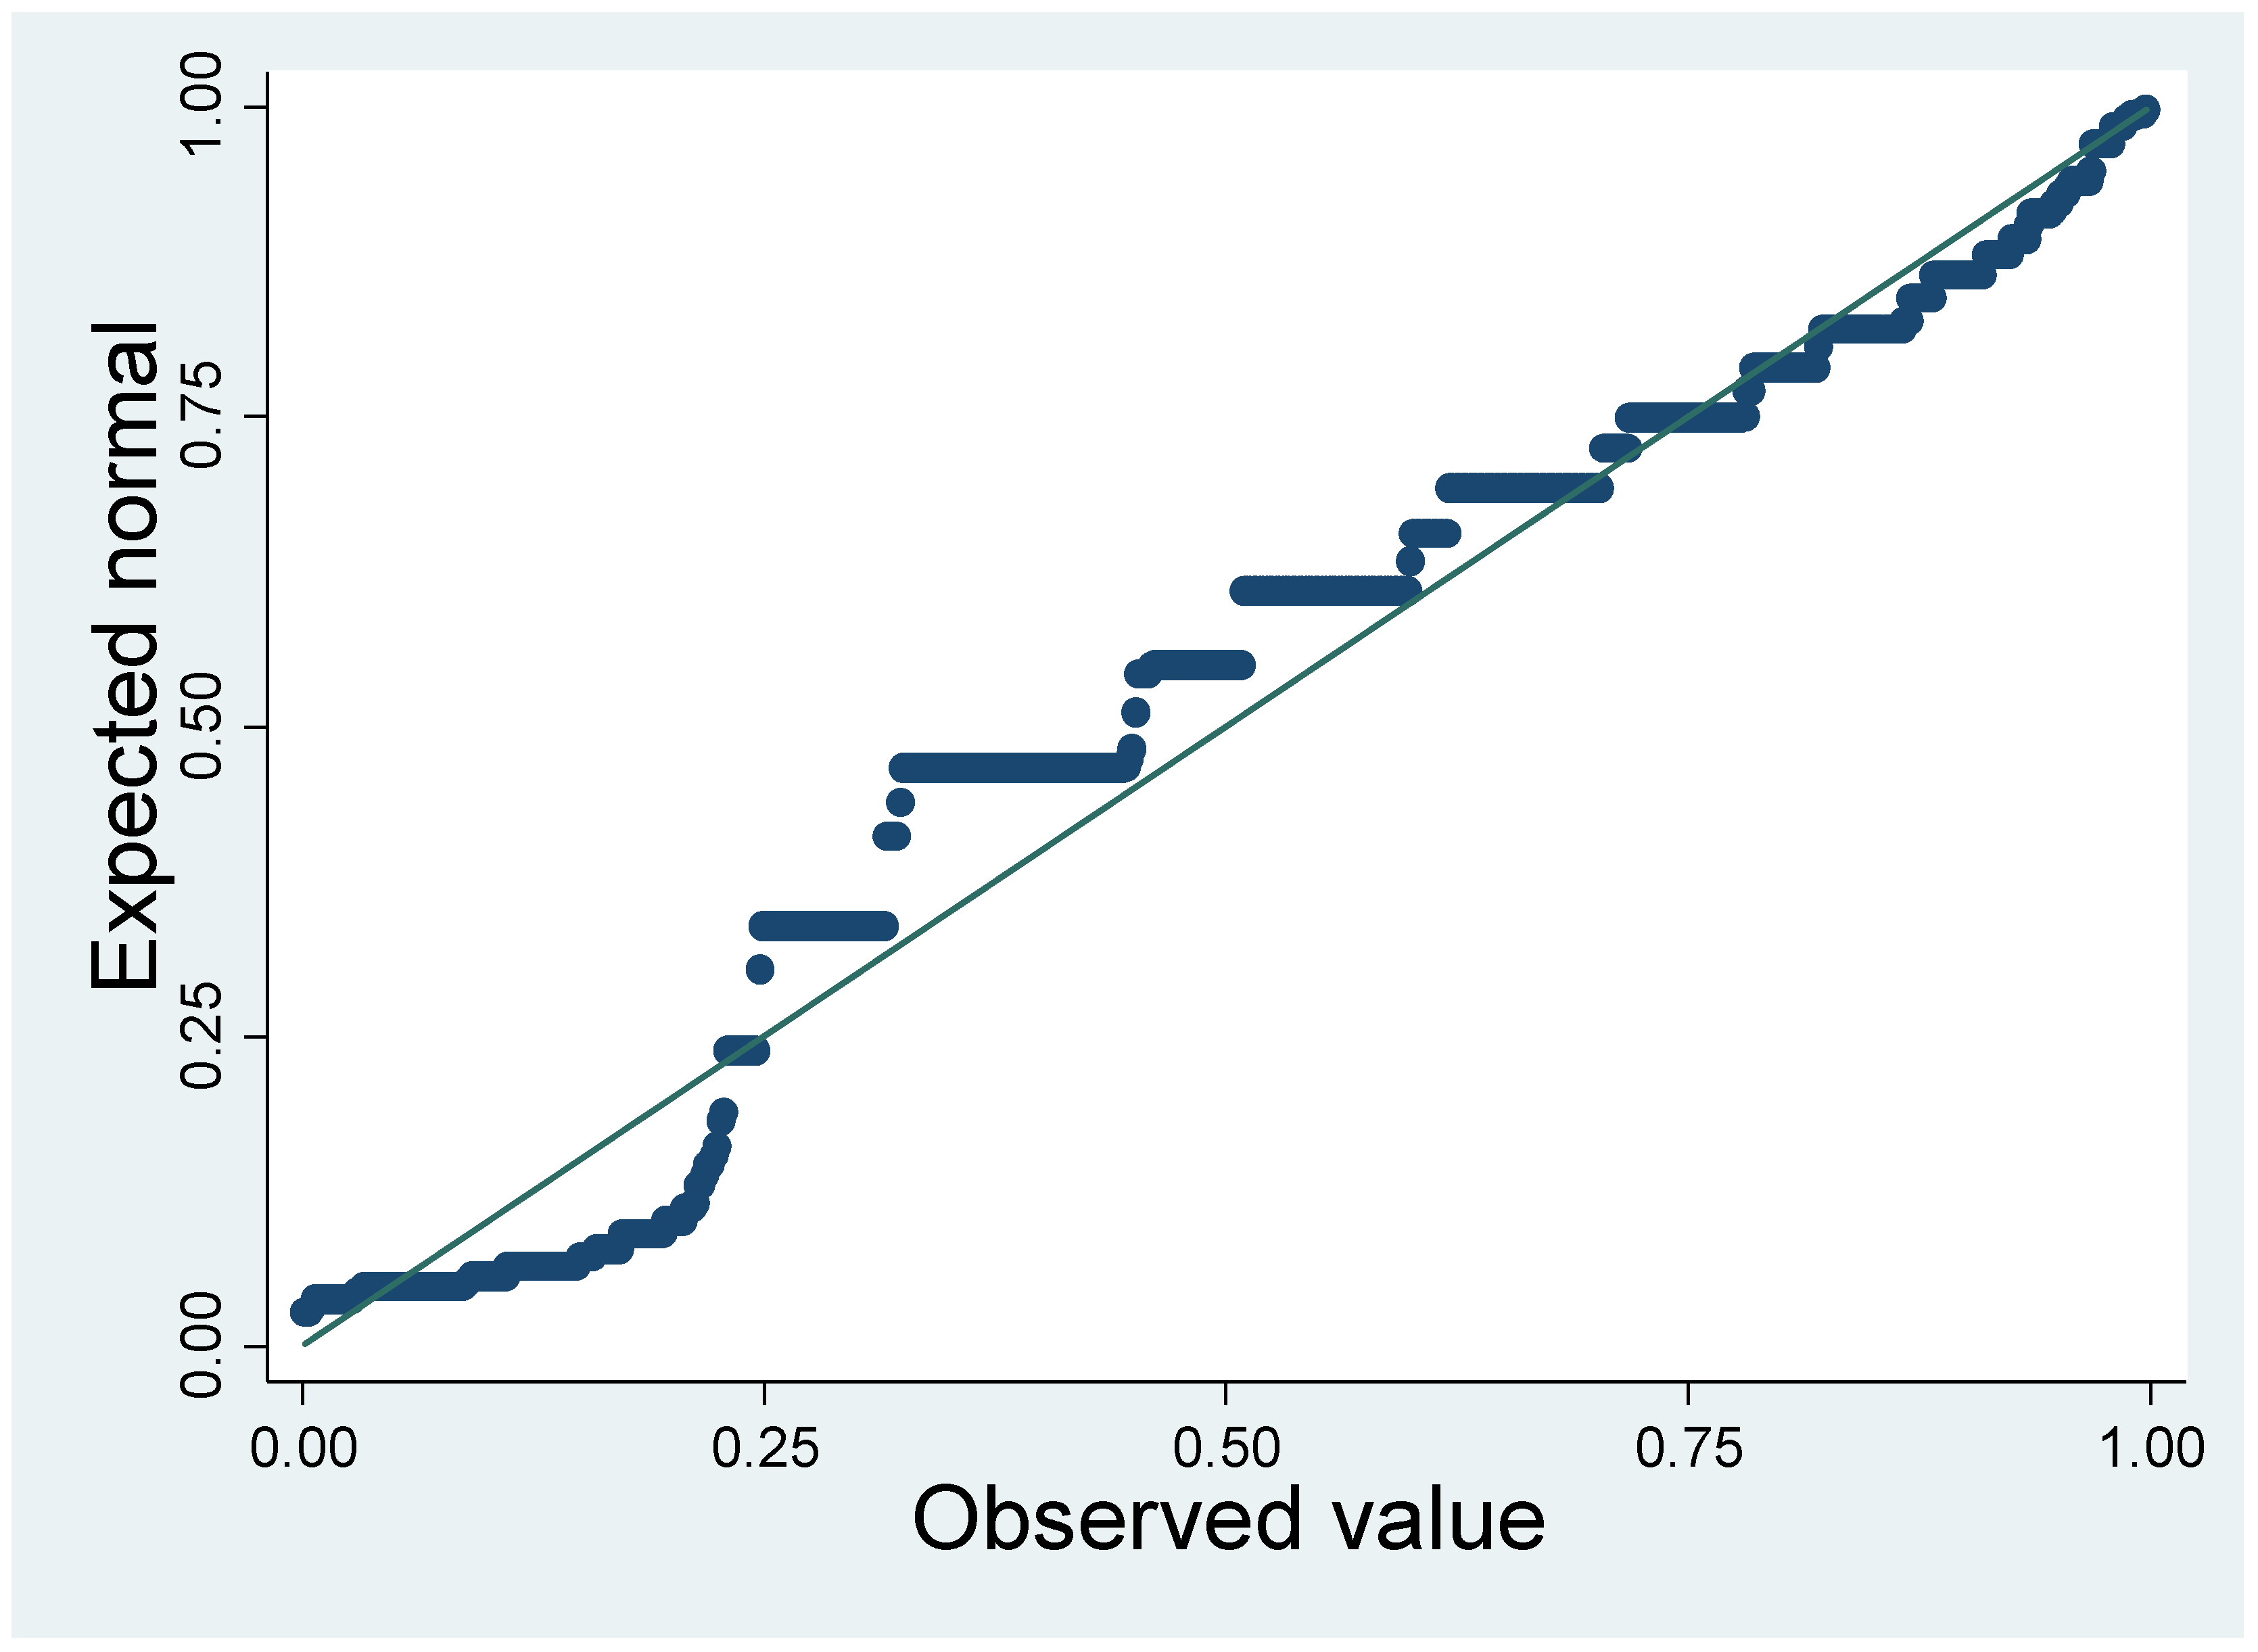
References
- Bachewe, F.N.; Berhane, G.; Minten, B.; Taffesse, A.S. Agricultural Transformation in Africa? Assessing the Evidence in Ethiopia. World Dev. 2018, 105, 286–298. [Google Scholar] [CrossRef]
- FAO. “Ethiopia at a Glance”. Available online: http://www.fao.org/ethiopia/fao-in-ethiopia/ethiopia-at-a-glance/en/ (accessed on 17 January 2019).
- Mersha, A.A.; Van Laerhoven, F. The Interplay between Planned and Autonomous Adaptation in Response to Climate Change : Insights from Rural Ethiopia. World Dev. 2018, 107, 87–97. [Google Scholar] [CrossRef]
- Georgis, K. Dryland Agriculture Production System in Ethiopia; Ethiopian Institute of Agricultural Research: Addis Ababa, Ethiopia, 2015. [Google Scholar]
- Gebru, K.M.; Leung, M.; Rammelt, C.; Zoomers, A.; van Westen, G. Vegetable Business and Smallholders’ Food Security: Empirical Findings from Northern Ethiopia. Sustainability 2019, 11, 743. [Google Scholar] [CrossRef]
- Teshome, A.; Adgo, E.; Mati, B. Impact of Water Harvesting Ponds on Household Incomes and Rural Livelihoods in Minjar Shenkora District of Ethiopia. Ecohydrol. Hydrobiol. 2010, 10, 315–322. [Google Scholar] [CrossRef]
- Recha, C.W.; Mukopi, M.N.; Otieno, J.O. Socio-Economic Determinants of Adoption of Rainwater Harvesting and Conservation Techniques in Semi-Arid Tharaka Sub-County, Kenya. L. Degrad. Dev. 2015, 26, 765–773. [Google Scholar] [CrossRef]
- Xie, H.; You, L.; Wielgosz, B.; Ringler, C. Estimating the Potential for Expanding Smallholder Irrigation in Sub-Saharan Africa. Agric. Water Manag. 2014, 131, 183–193. [Google Scholar] [CrossRef]
- Ndiritu, S.W. Beef Value Chain Analysis and Climate Change Adaptation and Investment Options in the Semi-Arid Lands of Northern Kenya. J. Arid Environ. 2020, 181, 104216. [Google Scholar] [CrossRef]
- Qi, Q.; Marwa, J.; Mwamila, T.B.; Gwenzi, W.; Noubactep, C. Making Rainwater Harvesting a Key Solution for Water Management: The Universality of the Kilimanjaro Concept. Sustainability 2019, 11, 5606. [Google Scholar] [CrossRef]
- Barron, J.; Rockström, J.; Gichuki, F.; Hatibu, N. Dry Spell Analysis and Maize Yields for Two Semi-Arid Locations in East Africa. Agric. For. Meteorol. 2003, 117, 23–37. [Google Scholar] [CrossRef]
- Kifle, W.; Frank, V.S.; Berhane, G.; Taye, A.; Kebede, M.; Marta, A.P. Practices and Hydrological Effects of Road Water Harvesting in Northern Ethiopia: Towards Design of Multi-Functional Infrastructures. Momona Ethiop. J. Sci. 2019, 11, 159–186. [Google Scholar] [CrossRef]
- Muriu-Ng’ang’a, F.W.; Mucheru-Muna, M.; Waswa, F.; Mairura, F.S. Socio-Economic Factors Influencing Utilisation of Rain Water Harvesting and Saving Technologies in Tharaka South, Eastern Kenya. Agric. Water Manag. 2017, 194, 150–159. [Google Scholar] [CrossRef]
- Jha, S.; Kaechele, H.; Sieber, S. Factors Influencing the Adoption of Water Conservation Technologies by Smallholder Farmer Households in Tanzania. Water (Switzerland) 2019, 11, 17. [Google Scholar] [CrossRef]
- Van Steenbergen, F.; Kifle, W.; Perez, M.A.; Manjur, K.; Al-abyadh, M.A. Roads: Instruments for Rainwater Harvesting , Food Security and Climate Resilience in Arid and Semi-Arid Areas. In Rainwater-Smart Agriculture in Arid and Semi-Arid Areas; Gomez, W.L.F., De, T.J., Eds.; Springer: Berlin/Heidelberg, Germany, 2018; pp. 121–144. [Google Scholar]
- Biazin, B.; Sterk, G.; Temesgen, M.; Abdulkedir, A.; Stroosnijder, L. Rainwater Harvesting and Management in Rainfed Agricultural Systems in Sub-Saharan Africa—A Review. Phys. Chem. Earth 2012, 47–48, 139–151. [Google Scholar] [CrossRef]
- Adeoti, A.I. Factors Influencing Irrigation Technology Adoption and Its Impact on Household Poverty in Ghana. J. Agric. Rural Dev. Trop. Subtrop. 2009, 109, 51–63. [Google Scholar]
- Baiyegunhi, L.J.S. Determinants of Rainwater Harvesting Technology (RWHT) Adoption for Home Gardening in Msinga, KwaZulu-Natal, South Africa. Water SA 2015, 41, 33–40. [Google Scholar] [CrossRef]
- Hagos, F.; Jayasinghe, G.; Awulachew, S.B.; Loulseged, M.; Yilma, A.D. Agricultural Water Management and Poverty in Ethiopia. Agric. Econ. (UK) 2012, 43 (Suppl. S1), 99–111. [Google Scholar] [CrossRef]
- Berhane, A.; Hadgu, G.; Worku, W.; Abrha, B. Trends in Extreme Temperature and Rainfall Indices in the Semi-Arid Areas of Western Tigray, Ethiopia. Environ. Syst. Res. 2020, 9. [Google Scholar] [CrossRef]
- Manjur, K. Farmers’ Perception and Determinants of Land Management Practices in Ofla Woreda, Southern Tigray, Ethiopia. Master’s Thesis, Haramaya University, Alemaya, Ethiopia, 2006. [Google Scholar] [CrossRef]
- Hagos, F.; John, P.; Nega, G. Land Degradation in the Highlands of Tigray and Strategies for Sustainable Land Management; Working Paper 25; International Livestock Research Intstitute: Addis Ababa, Ethiopia, 1999. [Google Scholar] [CrossRef]
- Lim, L.C.; Edwards, S.; Scialabba, N.E.H. (Eds.) Climate Change and Food Systems Resilience in Sub-Saharan Africa; FAO: Rome, Italy, 2011. [Google Scholar]
- Demenge, J.; Alba, R.; Welle, K.; Manjur, K.; Addisu, A.; Mehta, L.; Woldearegay, K. Multifunctional Roads. J. Infrastruct. Dev. 2015, 7, 165–180. [Google Scholar] [CrossRef]
- Nyssen, J.; Poesen, J.; Moeyersons, J.; Luyten, E.; Veyret-Picot, M.; Deckers, J.; Haile, M.; Govers, G. Impact of Road Building on Gully Erosion Risk: A Case Study from the Northern Ethiopian Highlands. Earth Surf. Process. Landforms 2002, 27, 1267–1283. [Google Scholar] [CrossRef]
- Rosenbaum, P.R.; Rubin, D.B. The Central Role of the Propensity Score in Observational Studies for Causal Effects. Biometrika 2012, 170–184. [Google Scholar] [CrossRef]
- Becker, S.O.; Ichino, A. Estimation of Average Treatment Effects Based on Propensity Scores Estimation of Average Treatment Effects Based on Propensity Scores. Stata J. 2002, 2, 358–377. [Google Scholar] [CrossRef]
- Das, K.R. A Brief Review of Tests for Normality. Am. J. Theor. Appl. Stat. 2016, 5, 5–12. [Google Scholar] [CrossRef]
- Mishra, P.; Pandey, C.M.; Singh, U.; Gupta, A.; Sahu, C.; Keshri, A. Descriptive Statistics and Normality Tests for Statistical Data. Ann. Card. Anaesth. 2019, 22, 67–72. [Google Scholar] [CrossRef]
- Ghasemi, A.; Zahediasl, S. Normality Tests for Statistical Analysis: A Guide for Non-Statisticians. Int. J. Endocrinol. Metab. 2012, 10, 486–489. [Google Scholar] [CrossRef]
- Loos, T.K.; Zeller, M. Milk Sales and Dietary Diversity among the Maasai. Agric. Econ. 2014, 45, 77–90. [Google Scholar] [CrossRef]
- Shete, M.; Rutten, M. Impacts of Large-Scale Farming on Local Communities’ Food Security and Income Levels—Empirical Evidence from Oromia Region, Ethiopia. Land Use Policy 2015, 47, 282–292. [Google Scholar] [CrossRef]
- Kitchen, C.M. Nonparametric vs Parametric Tests of Location in Biomedical Research. Am. J. Ophthalmol. 2009, 147, 571–572. [Google Scholar] [CrossRef]
- Mao, H.; Li, L.; Yang, W.; Shen, Y. On the propensity score weighting analysis with survival outcome: Estimands, estimation, and inference. Stat. Med. 2018, 37, 3745–3763. [Google Scholar] [CrossRef]
- Rammelt, C.F.; Leung, M.; Gebru, K.M. The Exclusive Nature of Inclusive Productive Employment in the Rural Areas of Northern Ethiopia. Work. Employ. Soc. 2018, 32, 1044–1060. [Google Scholar] [CrossRef]
- Hatibu, N.; Mutabazi, K.; Senkondo, E.M.; Msangi, A.S.K. Economics of Rainwater Harvesting for Crop Enterprises in Semi-Arid Areas of East Africa. Agric. Water Manag. 2006, 80, 74–86. [Google Scholar] [CrossRef]
- Mangisoni, J.H.; Chigowo, M.; Katengeza, S. Determinants of Adoption of Rainwater-Harvesting Technologies in a Rain Shadow Area of Southern Malawi. African J. Agric. Resour. Econ. 2019, 14, 106–119. [Google Scholar]
- Puertas, D.G.L.; Woldearegay, K.; Mehta, L.; Van Beusekom, M.; Peréz, M.A.; Van Steenbergen, F. Roads for Water: The Unused Potential. Waterlines 2014, 33, 120–138. [Google Scholar] [CrossRef]
- Kassie, M.; Zikhali, P.; Manjur, K.; Edwards, S. Adoption of Sustainable Agriculture Practices: Evidence from a Semi-Arid Region of Ethiopia. Nat. Resour. Forum 2009, 33, 189–198. [Google Scholar] [CrossRef]
| Definition of Variable | Measurement | ||
|---|---|---|---|
| Confounding Factors | Household Characteristics | Age of household head | Year |
| Family size | Number | ||
| Dependency ratio | The ratio of dependent and active family | ||
| Livestock size | Size of livestock own in Tropical livestock unit (TLU) | ||
| Frequency of development agent contact | Number of days in contact with development agent per year | ||
| Sex of household head | 1 = male, 0 = female | ||
| Literacy status of household head | 1 = literate, 0 otherwise | ||
| Education level of household head | Years of schooling | ||
| Access to credit | 1 = yes, 0 = no | ||
| Access to rainwater harvesting training | 1 if the household has access to rainwater harvesting training, 0 otherwise | ||
| Distance from home to district market | Minute | ||
| Number of plots owned | Number | ||
| Plot Characteristics | Use of improved seed | 1 = yes, 0 = no | |
| Plot size | Timad (one Timad is 0.25 hectare) | ||
| Plot distance from dwelling | Minute | ||
| Land tenure status | 1 if the plot is owned, 0 if the plot is not owned | ||
| Plot distance from road | Minute | ||
| Outcome Variables | Participation status in road water harvesting | 1 if the household participates with the plot in the use of RWHP, 0 otherwise | |
| Crop yield | Total amount of kilograms of harvest per plot | ||
| Crop productivity | Amount of yield per timad | ||
| Annual crop income | Total income obtained per plot from crop sell in Ethiopian Birr (1 Ethiopian Birr (ETB) is equivalent to 0.027 US dollar (NBE, 10 October 2020) | ||
| Amount of fertilizer used | Amount of kilograms of inorganic fertilizer used per plot | ||
| Amount of farmyard manure used | Amount of kilograms of farm yard manure used per plot | ||
| Household Characteristics | Variable Means by Road Water Harvesting Practice (Mean/Percent) | |
|---|---|---|
| Non-User | User | |
| Age of household head (year) | 51.54 | 50.80 |
| Family size (number) | 6.28 | 5.67 |
| Dependency ratio (number) | 1.51 | 1.27 |
| Livestock size (TLU) | 4.48 | 4.88 |
| Frequency of development agents contact (number of contacts per year) | 3.94 | 4.0 |
| Sex of household head | ||
| Female (%) Male (%) | 54.74 67.13 | 45.26 32.13 |
| Literacy status of household head (%) | 32.13 | 68.63 |
| Education level of household head (years of schooling) | 1.38 | 2.56 |
| Access to credit (%) | 31.86 | 32.08 |
| Access to rainwater harvesting training (%) | 31.94 | 32.16 |
| Distance from home to district market (minutes) | 62.75 | 49.76 |
| Number of plots owned (number) | 2.69 | 2.73 |
| Plot Characteristics | Non-User | User |
| Use of improved seed (%) | 54.2 | 48.8 |
| Plot size (timad) | 1.16 | 1.27 |
| Plot distance from dwelling (minutes) | 25.00. | 16.03 |
| Land tenure status (%) | 16.3 | 83.7 |
| Plot distance from road (minutes) | 10.80 | 2.01 |
| Crop yield (kg/plot) | 240.08 | 317.56 |
| Crop productivity (kg/timad) | 805.93 | 904.89 |
| Annual crop income (Ethiopian Birr/plot) | 5432.58 | 7811.22 |
| Amount of fertilizer used (kg/plot) | 27.03 | 37.53 |
| Amount of farmyard manure used (kg/plot) | 137.51 | 296.80 |
| Sex of the Household Head | Frequency | Percent |
|---|---|---|
| Female | 26 | 16.4 |
| Male | 133 | 83.6 |
| Total | 159 | 100.0 |
| Variable Characteristics | Variables | Coefficients | Marginal Effects | Z-Value |
|---|---|---|---|---|
| Household Characteristics | Age of household head | −0.04 | −0.14 | −0.64 |
| Dependency ratio | −0.24 | −0.08 | −3.56 *** | |
| Livestock size | 0.02 | 0.007 | 1.05 | |
| Frequency of development agent contact | 0.02 | 0.006 | 1.10 | |
| Education level of household head | 0.48 | 0.17 | 3.41 *** | |
| Access to credit | −0.15 | −0.05 | −1.24 | |
| Distance from home to district market | −0.001 | −0.001 | −1.66 * | |
| Plot Characteristics | Use of improved seed | 0.52 | 0.02 | 4.23 *** |
| Plot size | 0.07 | 0.02 | 2.17 ** | |
| Plot distance from dwelling | −0.01 | −0.003 | −2.91 *** | |
| Land tenure status | 0.28 | 0.09 | 1.83 * | |
| Model summery | Constant | −0.44 | −0.84 | |
| Number of observations | 603 | |||
| log likelihood | −343.66 | |||
| LR X2(5) | 68.74 | |||
| Prob > X2 | 0.000 |
| Outcomes | Algorithms | Number of Plots of RWHP Users | Number of Plots of RWHP Non-Users | Average Treatment Effect on Treated (ATT/impact) | Std. Err | T-Value |
|---|---|---|---|---|---|---|
| Amount of fertilizer used | Nearest neighbor matching (NN) | 193 | 138 | 8.109 | 3.457 | 2.35 ** |
| Radius matching (RR) | 193 | 404 | 9.60 | 2.27 | 3.58 | |
| Kernel matching (KK) | 193 | 404 | 5.06 | 3.84 | 1.46 | |
| Stratification matching (SS) | 193 | 404 | 5.36 | 0.84 | 6.35 *** | |
| Amount of farm yard manure used | Nearest neighbor matching (NN) | 193 | 138 | 139.84 | 71.45 | 1.96 * |
| Radius matching (RR) | 193 | 404 | 148.60 | 76.83 | 1.93 * | |
| Kernel matching (KK) | 193 | 404 | 130.28 | 68.31 | 1.91 * | |
| Stratification matching (SS) | 193 | 404 | 119.21 | 61.42 | 1.94 * | |
| Crop yield | Nearest neighbor matching (NN) | 193 | 138 | 106.19 | 36.11 | 2.94 *** |
| Radius matching (RR) | 193 | 138 | 71.92 | 22.73 | 3.21 *** | |
| Kernel matching (KK) | 193 | 404 | 59.84 | 14.84 | 4.03 *** | |
| Stratification matching (SS) | 193 | 404 | 59.56 | 25.27 | 2.36 ** | |
| Annual crop income | Nearest neighbor matching (NN) | 193 | 138 | 3085.81 | 1543.42 | 2.00 ** |
| Radius matching (RR) | 193 | 404 | 2351.56 | 900.79 | 2.61 *** | |
| Kernel matching (KK) | 193 | 404 | 2512.72 | 3337.18 | 0.75 | |
| Stratification matching (SS) | 193 | 404 | 2556.04 | 1.351.20 | 1.89 * |
Publisher’s Note: MDPI stays neutral with regard to jurisdictional claims in published maps and institutional affiliations. |
© 2020 by the authors. Licensee MDPI, Basel, Switzerland. This article is an open access article distributed under the terms and conditions of the Creative Commons Attribution (CC BY) license (http://creativecommons.org/licenses/by/4.0/).
Share and Cite
Gebru, K.M.; Woldearegay, K.; van Steenbergen, F.; Beyene, A.; Vera, L.F.; Tesfay Gebreegziabher, K.; Alemayhu, T. Adoption of Road Water Harvesting Practices and Their Impacts: Evidence from a Semi-Arid Region of Ethiopia. Sustainability 2020, 12, 8914. https://doi.org/10.3390/su12218914
Gebru KM, Woldearegay K, van Steenbergen F, Beyene A, Vera LF, Tesfay Gebreegziabher K, Alemayhu T. Adoption of Road Water Harvesting Practices and Their Impacts: Evidence from a Semi-Arid Region of Ethiopia. Sustainability. 2020; 12(21):8914. https://doi.org/10.3390/su12218914
Chicago/Turabian StyleGebru, Kebede Manjur, Kifle Woldearegay, Frank van Steenbergen, Aregawi Beyene, Letty Fajardo Vera, Kidane Tesfay Gebreegziabher, and Taye Alemayhu. 2020. "Adoption of Road Water Harvesting Practices and Their Impacts: Evidence from a Semi-Arid Region of Ethiopia" Sustainability 12, no. 21: 8914. https://doi.org/10.3390/su12218914
APA StyleGebru, K. M., Woldearegay, K., van Steenbergen, F., Beyene, A., Vera, L. F., Tesfay Gebreegziabher, K., & Alemayhu, T. (2020). Adoption of Road Water Harvesting Practices and Their Impacts: Evidence from a Semi-Arid Region of Ethiopia. Sustainability, 12(21), 8914. https://doi.org/10.3390/su12218914


