Hydropower Case Study Collection: Innovative Low Head and Ecologically Improved Turbines, Hydropower in Existing Infrastructures, Hydropeaking Reduction, Digitalization and Governing Systems

 ,
, 
 , , ,
, , , 

Abstract
1. Introduction
- more flexible turbines to cope with the frequent grid instabilities and flow rate variability [8]: new regulation systems, e.g., the variable speed operation and new governors, is a major topic. Some of these aspects are here discussed with practical case studies (Section 2, Section 3 and Section 4, Section 13 and Section 17);
- the need for pump-as-turbines working also in pumping mode for pumping-storage hydropower plants [9]; the transient operation and the shift from the turbine to pump mode is worth investigation;
- new low head hydropower converters to be used in irrigation canals [10,11]; some of these are here discussed, like the Very Low Head (VLH) turbine, the Hydrostatic Pressure Machine (HPM) and the Vortex turbine, with their strength and limitations. In particular, one of the most important matters in the low head field is the power take-off, since low head converters generally rotate quite slowly;
- more fish-friendly solutions (fish passages and turbines with good ecological behavior), and sustainable solutions to minimize environmental impacts [12]; fish passages alone do not completely avoid fish collision with turbines so that the ecological behavior of the turbines must be improved (Section 6 and Section 16);
- energy recovery from drinking water distribution networks, non-powered dams and from the ecological flow of large dams [13]; this solution avoids new interruptions of the longitudinal connectivity of rivers, and some study cases are here presented (Section 9, Section 10, Section 11, Section 12 and Section 13);
- sustenance of local communities and electrification of rural areas [14]; hydropower sometimes leads to social impacts, e.g., reallocation of residents or alteration of the environment, especially in the case of big hydro plants. On the other side, hydropower can generate social incomes and benefits, like electrification, new roads and services, and local development, as described in Section 7;
- new best practices, strategies and additional reservoirs to minimize hydropeaking, to improve fish habitat. New materials are also under development.
- Better control and governing of hydropower plants:
- Fish-friendly solutions and reduction of environmental impacts:
- -
- Section 5. An innovative solution to reduce the hydropeaking effect of hydroelectric power plants.
- -
- Section 6. Biological Validation of Improved Direct Turbine Survival at Ice Harbor Lock and Dam.
- -
- Section 7. Hydropower as a driving force for Alpine territorial development.
- -
- Section 8. Diamond Bearings for hydrokinetic turbines.
- Recovery of existing structures for hydropower generation:
- -
- Section 9. Hydroelectric development of an existing multiple-use reservoir.
- -
- Section 10. Mini hydro on the environmental flow overflow structures.
- -
- Section 11. Hydropower from the Susa Valley drinking water network.
- -
- Section 12. Implementation of a multipurpose project on an irrigation plant by installation of an innovative counter pressure Pelton turbine.
- -
- Section 13. Variable speed application for energy recovery hydropower in aqueducts.
- New low head hydropower converters:
- -
- Section 14. Study of low-head hydrostatic pressure water wheels for harnessing hydropower of small streams.
- -
- Section 15. The Mariucci turbine as the evolution of the Girard turbine.
- -
- Section 16. Rehabilitation of a low-head gravitational vortex site with an improved vortex turbine.
- -
- Section 17. The Very Low Head turbine in navigation locks.
2. New Speed Governors for Hydropower Plants: Case Study of Hone 1 Power Plant
2.1. RDF12© of CVA Overcomes the Hydrodynamic Limits
2.2. Hone 1 Power Plant
2.3. RDT14© Voltage Governor
3. Digital Twin for Penstock Fatigue Monitoring, Hydro-Clone Real-Time Simulation Monitoring System
3.1. Hydro-Clone
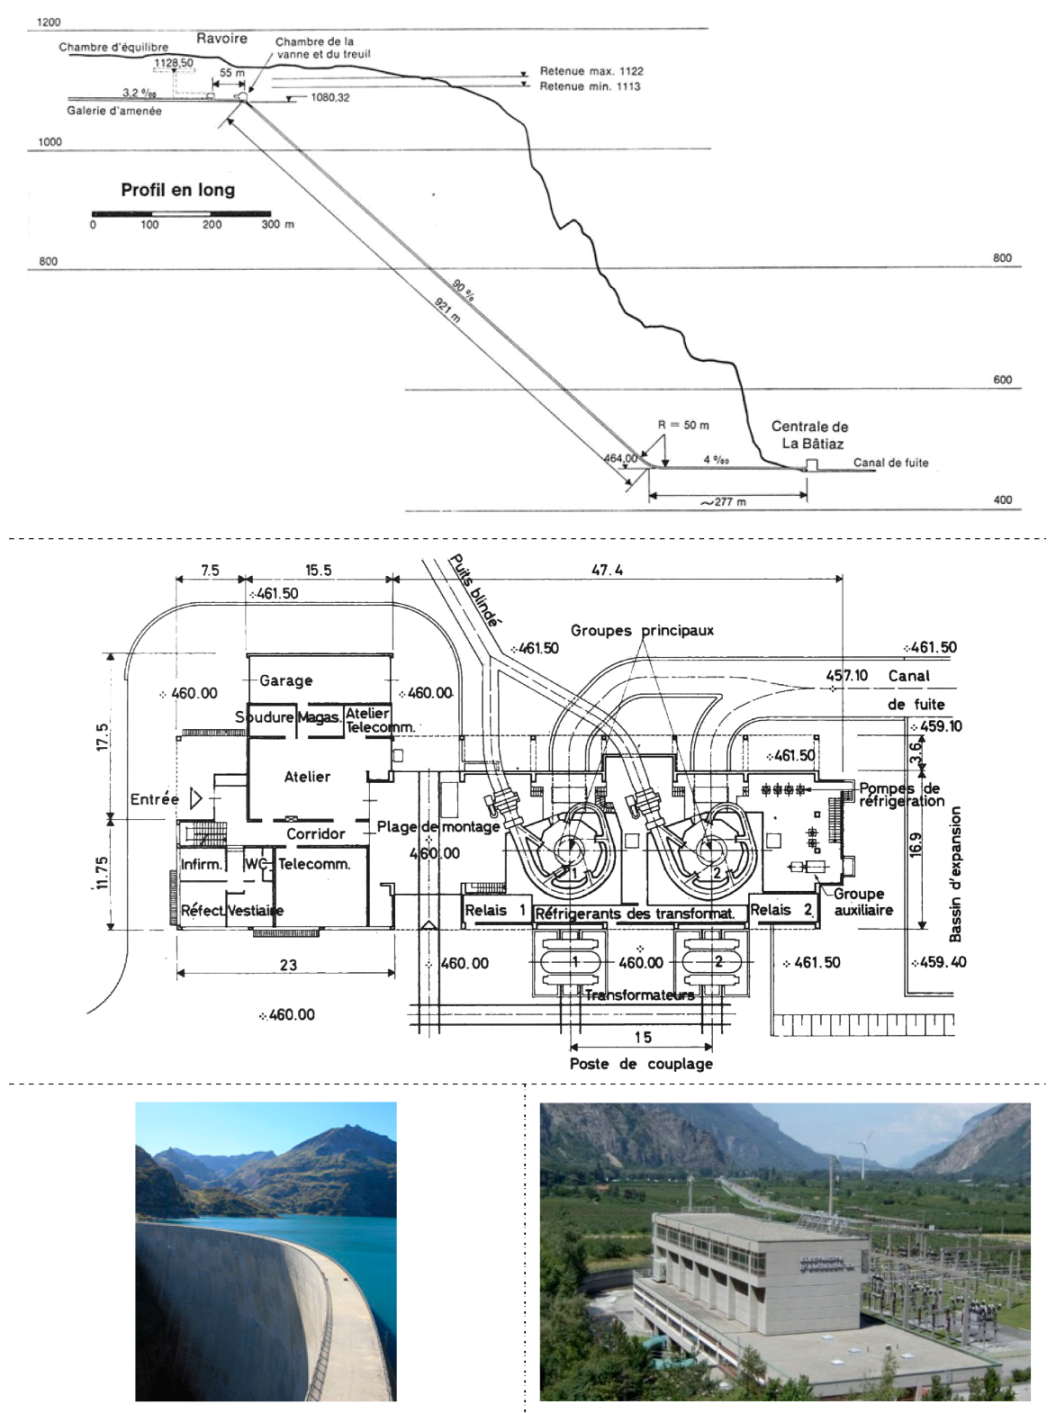
3.2. La Bâtiaz Hydropower Scheme
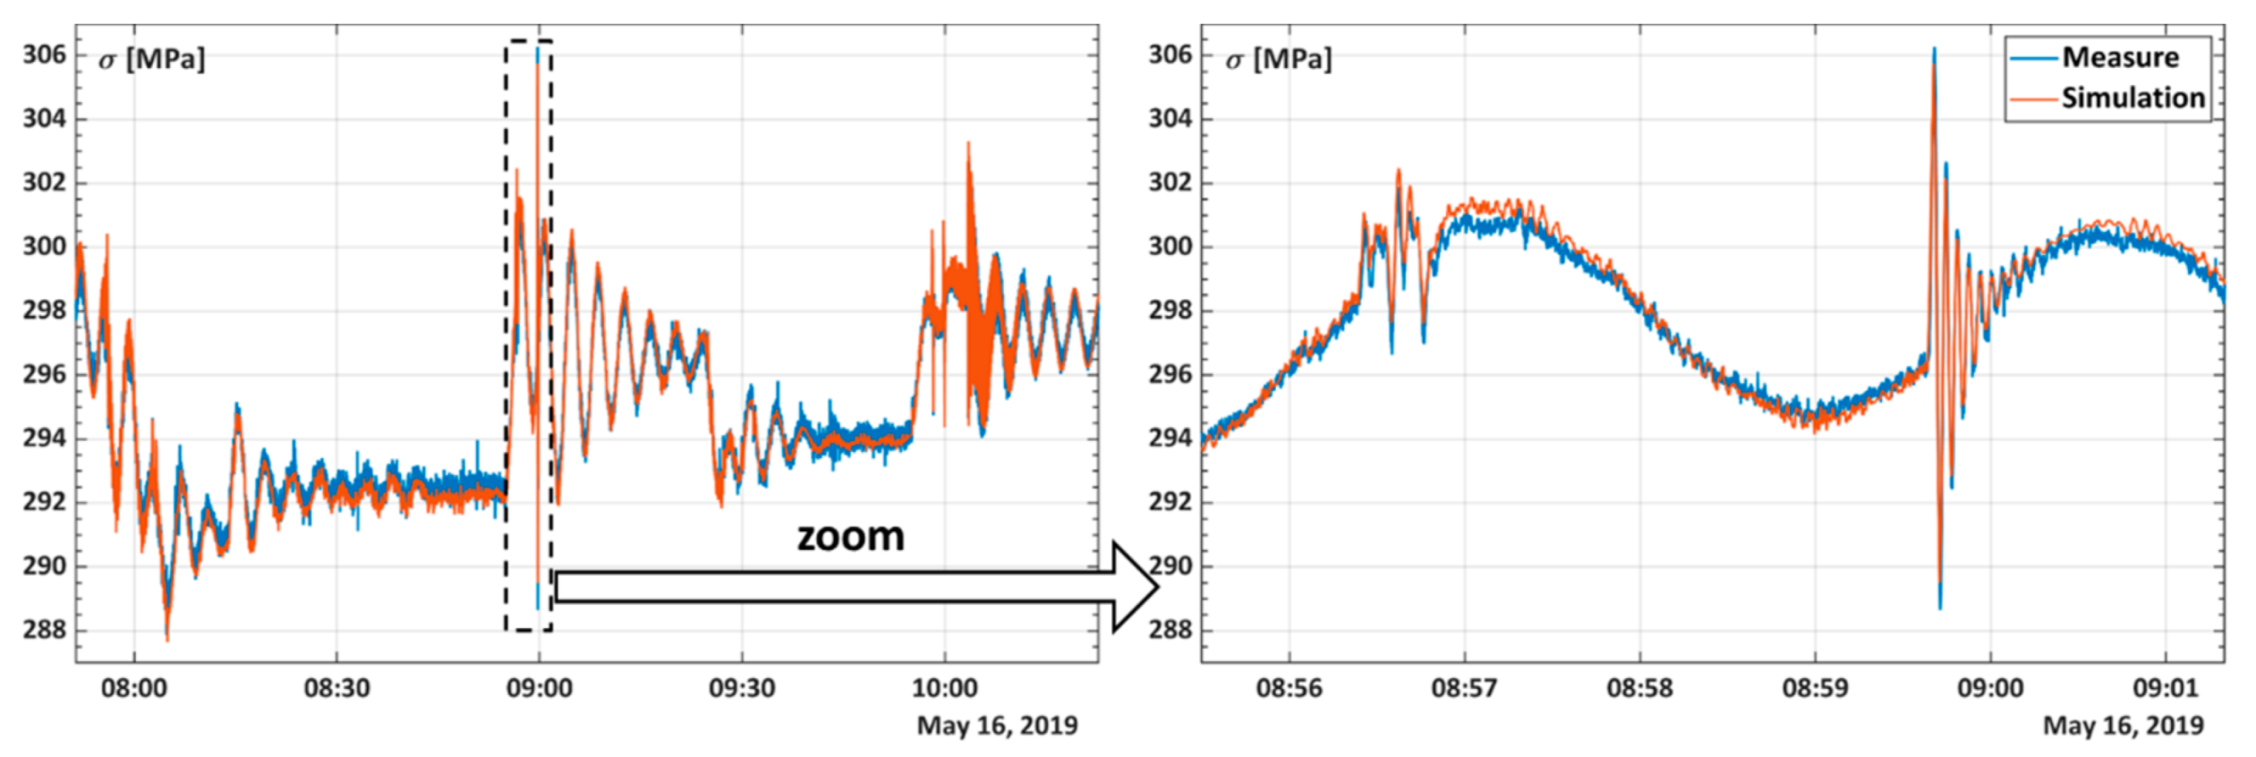
3.3. Real-Time Computation and Validation of Penstock Stress
3.4. Fatigue Assessment
4. Better Management by Digitalization Software and De-Sedimentation Techniques
4.1. HydEA
4.2. Efficiency and Combination Curve Optimization (ECCO)—Sauzalito Plant in Chile
- Annual Energy 2018 = 63 GWh; Additional Energy: 315 MWh (0.5% of greater efficiency).
- Annual Energy 2019 = 54 GWh; Additional Energy: 270 MWh.
4.3. HYDRA—Hydrological Module for GIS Portal
- Modeling hydrographic basins as per an EGP internal hydrological model—Static Calculations Module.
- Calculating at hourly level water resource availability forecasts in hydrographic basins, dams and reservoirs three days ahead—Dynamic Calculations Module.
- Providing insights on prioritization of reservoirs in operation, as per the available resource and stored energy (both in real-time and forecast modality).
- Alerting in case of forecasted Hydraulic Risks—Early Warning Module.
- Calculating the times of dams overflowing, in case of Hydraulic Risk (both in real-time and forecast modality).
4.4. Continuous De-Sedimentation Techniques for Hydro Power Plant Reservoirs
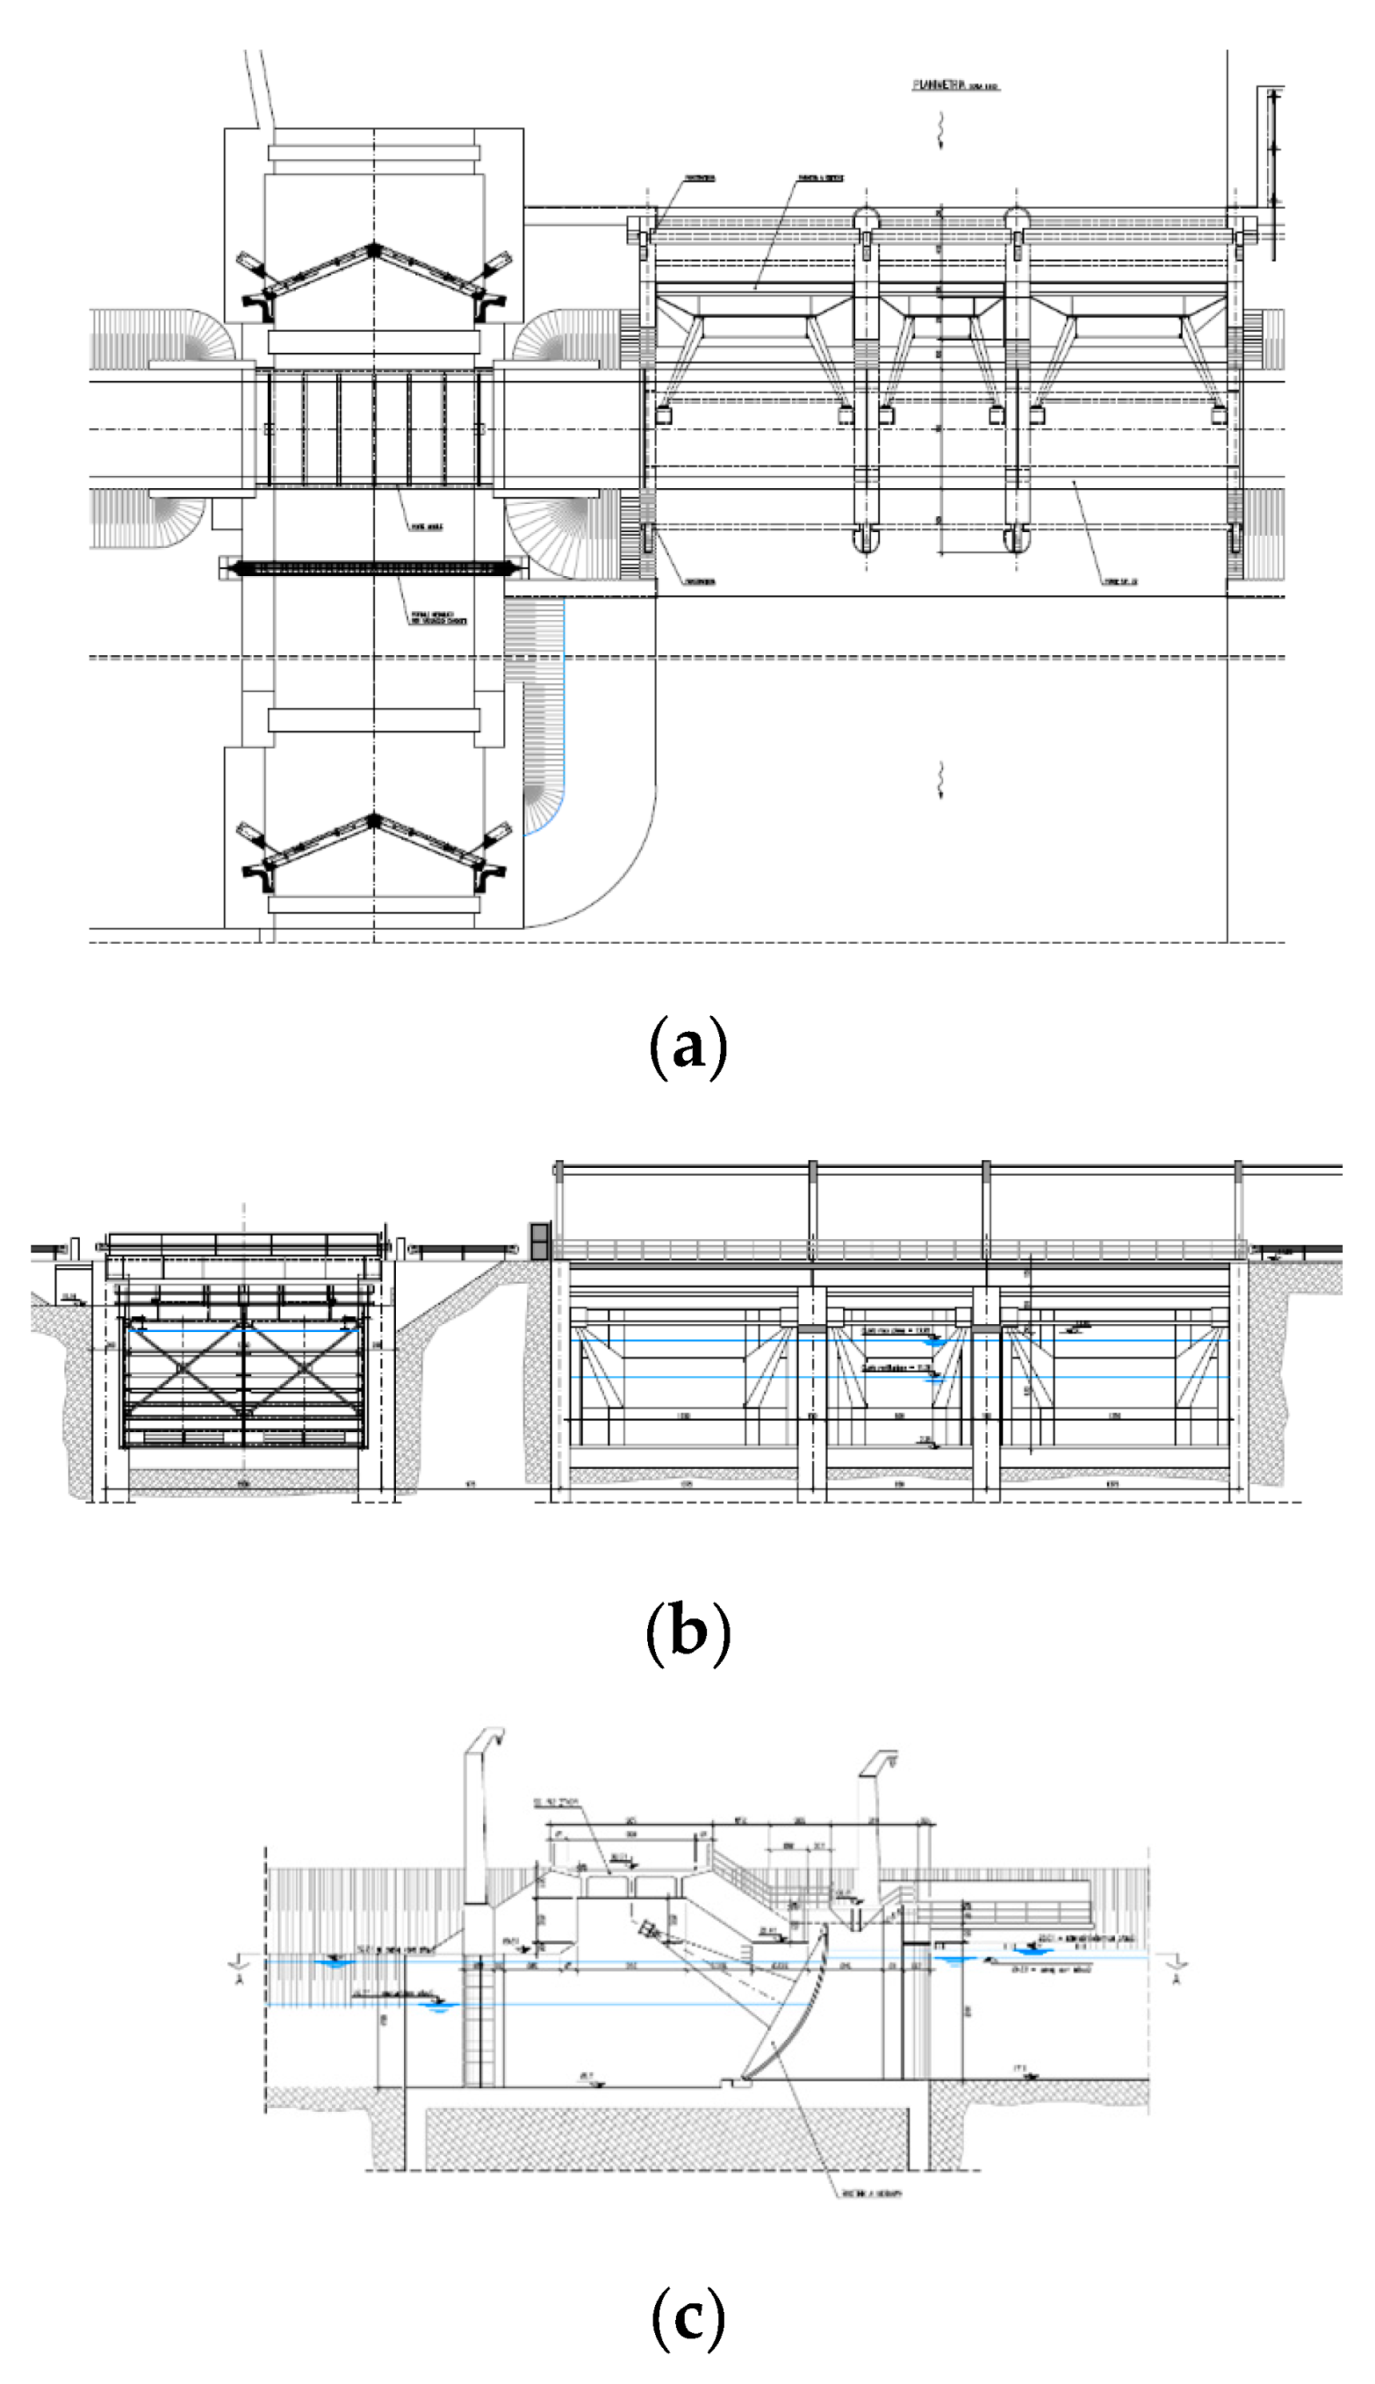
5. An Innovative Solution to Reduce the Hydropeaking Effect of Hydroelectric Power Plants. The Case of the S. Antonio Plant in Bolzano, Italy
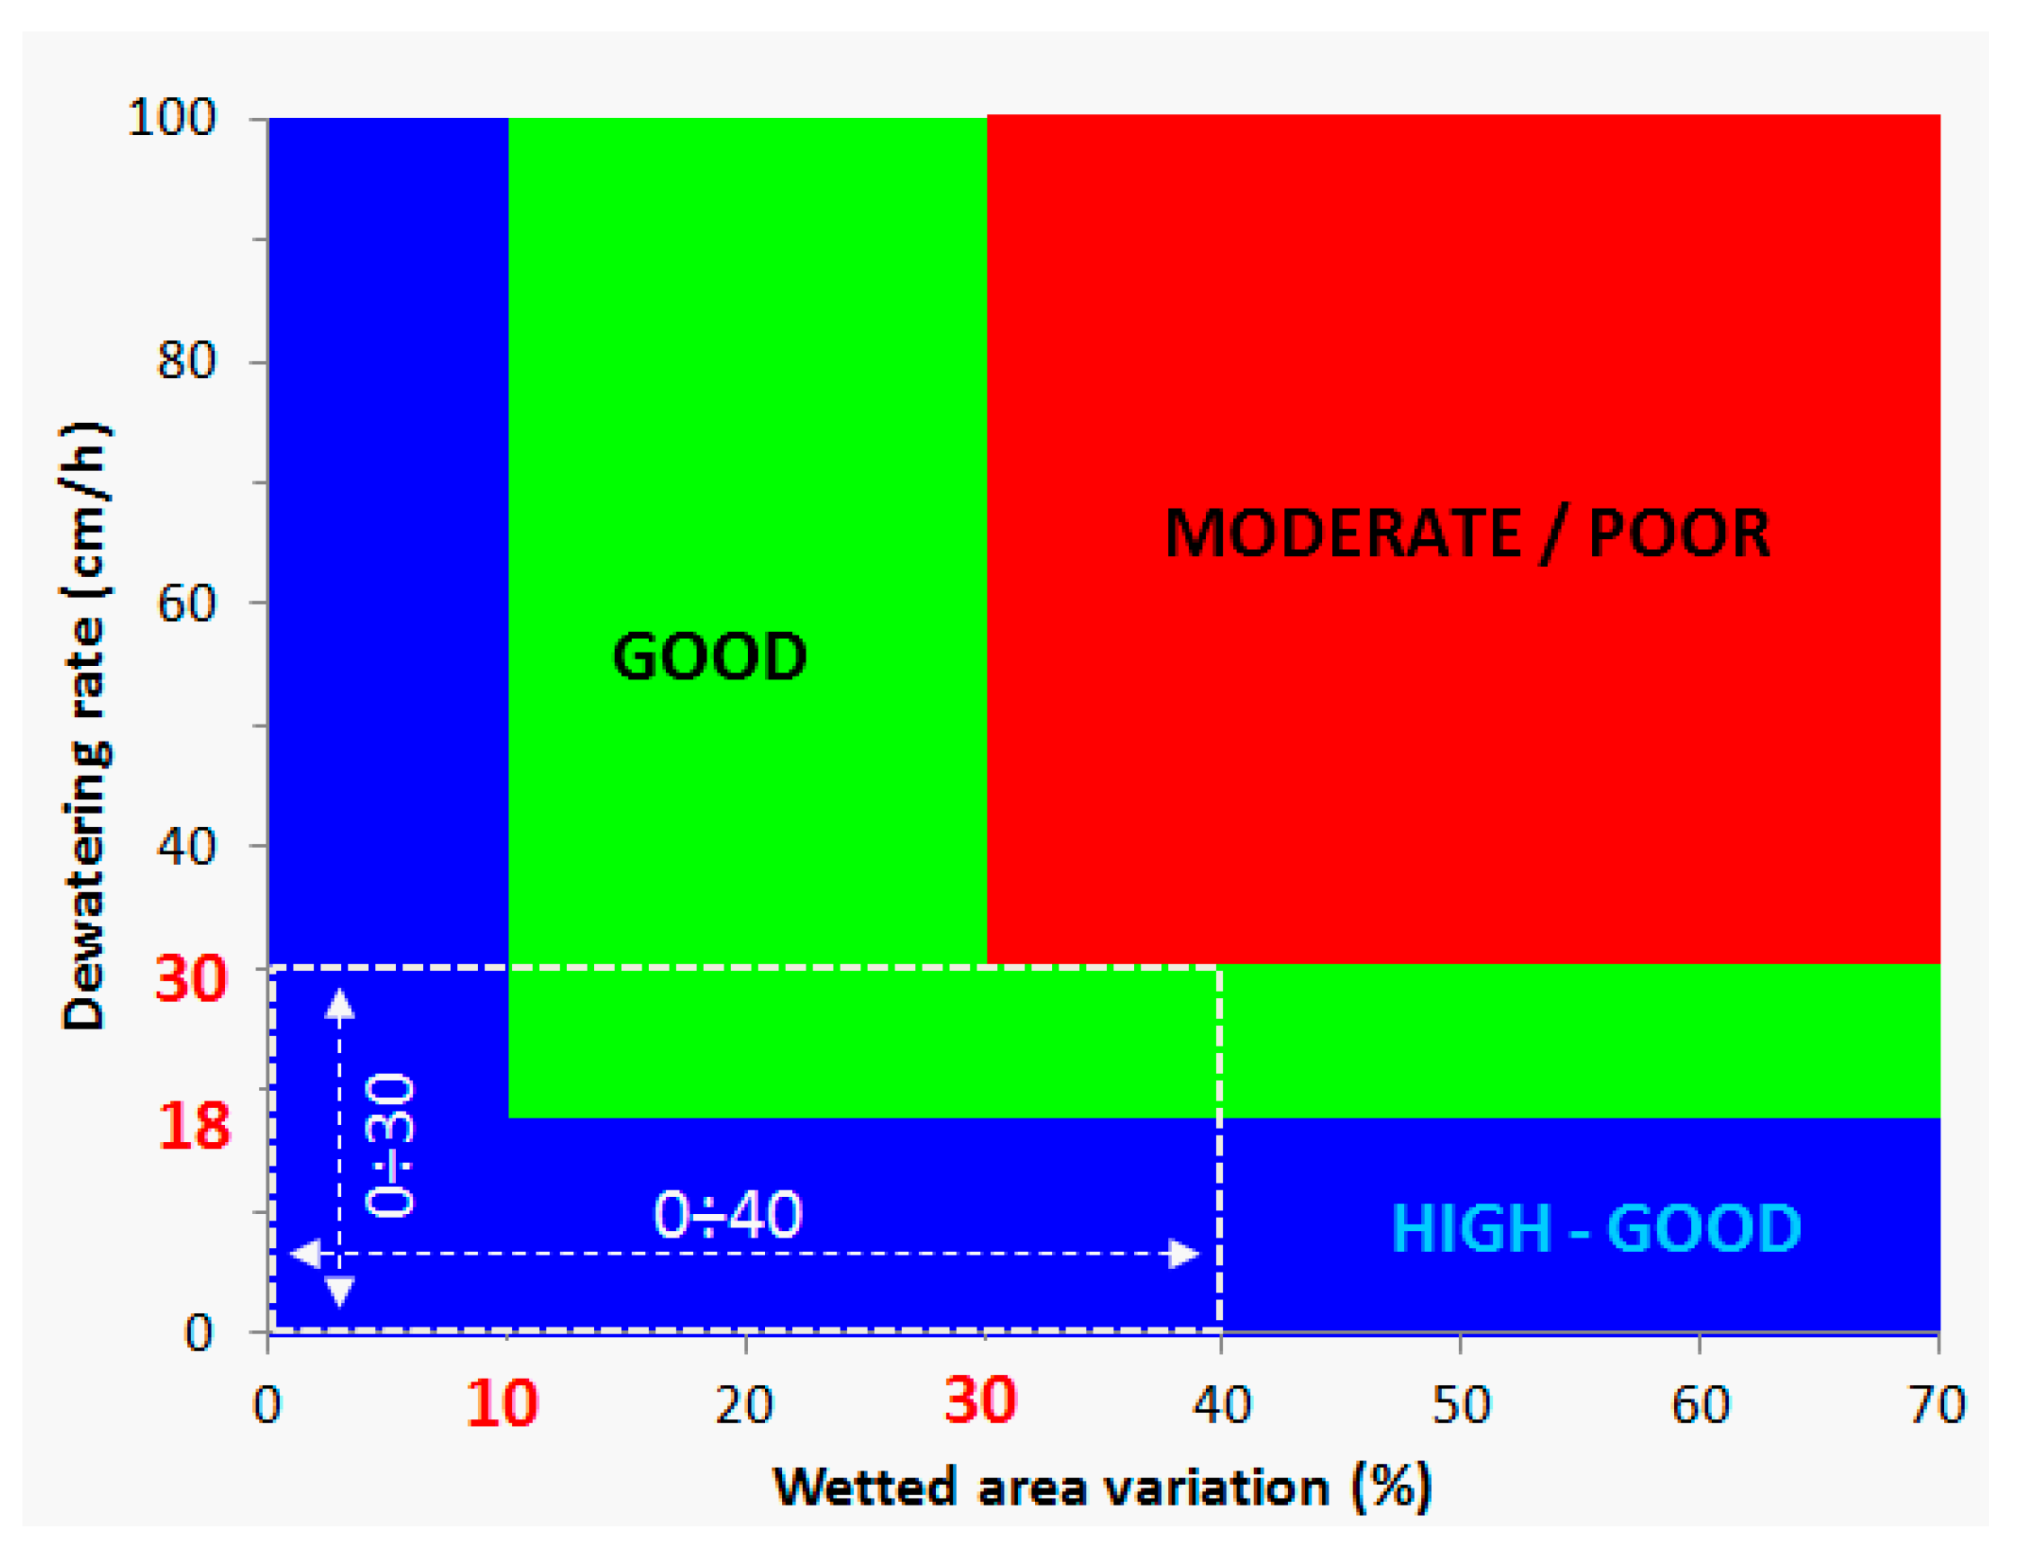
5.1. Environmental Improvements
5.2. Conclusions
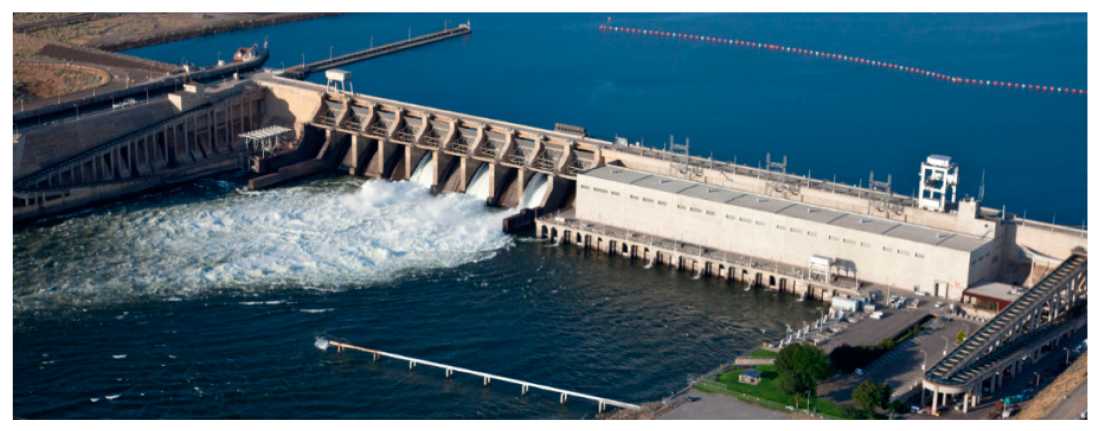
6. Biological Validation of Improved Direct Turbine Survival at Ice Harbor Lock and Dam
6.1. Geometry Development and Evaluation
6.2. Project Schedule
- Project Kick-off, Spring 2010.
- Start of Physical Model Testing, Spring 2011.
- Start of Fixed Blade Prototype Manufacturing.
- Spring 2013.
- Start of Unit 2 Prototype Installation, Winter 2017.
- Biological Testing of Unit 2, Fall 2019, Figure 23.
6.3. Unit 2 Biological Testing
- Estimate direct injury and survival of juvenile Chinook Salmon passing through Ice Harbor turbine Unit 2 at three operating points, as described below in Table 3.
- Determine type, severity and likely cause of injuries incurred to the fish passed through Unit 2.
- Test for significant differences in direct injury and survival estimates among the three turbine operating points.
- Compare the 2019 direct injury and survival results to historical study results from the 2007 evaluation of the existing adjustable blade Ice Harbor turbine Unit 3 [42].
Setup and Methodology
- Control fish were not exposed to the same tailrace predation risk as treatment fish due to water surface releases (none of the control fish were preyed upon).
- The primary goal of the study was to assess survival and injury directly associated with the turbine passage environment.
6.4. Results and Conclusions
7. Hydropower as a Driving Force for Alpine Territorial Development
7.1. The Maira’s Hydropower Plants
- the ability to make available and develop technical-organizational skills.
- the interest in supporting the local socio-economy (“territorial proximity”);
- consequently, the company’s strategy is based on the simultaneity of three specific elements:
- ○
- implementation of industrial interventions primarily aimed at water and environmental resources and renewable energy sources, in the sense of their enhancement.
- ○
- sustainability and respect for the landscape-environmental quality of the territory.
- ○
- generation and effective management of externalities for the benefit of the local community.
7.2. The Territorial Development Strategy
- 2009—M.Air.A., an initiative for a new broadband internet in the upper Maira valley, with free WiFi in the main hamlets.
- 2010—the management of the Campobase refuge (Figure 26), located at 1650 m a.s.l. in a magnificent alpine environment, to offer visitors overnight accommodation, food and assistance and mountain leisure activities and “school of mountain” opportunities.
- 2016—Formaira Srl for the use of local timber in a short and integrated supply chain: forestry activities, production and sale of semi-finished products for work, firewood, packaging, etc., production of wood chips, which is sold to third parties or used in thermal plants manufactured and managed by the company (Figure 27).
7.3. Conclusions
8. Diamond Bearings for Hydrokinetic Turbines
8.1. Problem
- Vesconite—an internally lubricated low friction polymer.
- CIP Marine—a laminated composite material made of textiles impregnated with thermosetting resins and solid lubricants.
- Feroform T814—a composite material made of woven fiber bonded with resin with polytetrafluoroethylene.
8.2. Solution
- a process fluid-cooled bearing-shaft assembly that: (1) completely eliminated seals, (2) reduced excess component weight (3) and removed the need for contaminating lubricants and ongoing maintenance.
- A diamond material—the hardest material on earth—that easily resisted abrasive particles and damaging sediment suspended in the water.
- A sliding-element bearing surface that: (1) handled higher loads, (2) minimized operational wear (3) and delivered a lower coefficient of friction (0.01).
8.3. Results
9. The Complex Process of Hydroelectric Development of an Existing Multiple Use Reservoir
9.1. The Network of Partners
9.2. Technical Characteristics and Environmental Choices
- average flow rate: 10.54 mc/s.
- maximum flow rate: 26 mc/s.
- gross head: 9.66 m.
- nominal concession power: 998.20 KW.
- two Kaplan turbines with a vertical axis of mechanical power equal to 1207 and 603 KW—two synchronous generators with nominal power equal to 1476 and 800 KVA.
- double connection pipes between the lateral basin and the river, which were originally oversized and used to allow the water to get back into the river from the lateral reservoir. This was done by separating one of the two pipes in order to separate the flows. The inlets have been protected on the front by a concrete sill with the function of:
- ○
- stopping of the hydroelectric intake on reaching a minimum water level in the river in order to ensure the level necessary for the irrigation;
- ○
- protection from the phenomenon of silting of the intake.
This design choice, compared to that initially assessed for the construction of independent intake, has allowed a substantial and quantifiable saving of 300,000 euros (300 thousands), avoiding a complex cutting operation of the bank of the lateral reservoir and its restoration of its waterproof structure. - Viability and access: the existing accesses, of adequate size and type, have made it possible to avoid the construction of expensive new roads and trails.
- Embankment of the lateral reservoir: this element ensures protection from the floods of the plant, built on the back of the embankment itself. Costs were avoided for the construction of protection screens, huge stone boulders, walls higher than the two-hundred-year period flood level. A reduction in the costs of the work of 200,000 euro is estimated.
- It is not possible to provide for the entrance with a vehicle inside the building except with a small van; assembly and disassembly interventions need to deal with greater management complexities.
- In order to support the excavations, especially because of the proximity of the downstream face of the weir, it was necessary to adopt secant and tangent poles with higher costs than a traditional solution with a building on the ground floor estimated at € 90,000. The higher cost of the work was largely compensated by a reduction in social costs and acceptance of the intervention. The existing weir is in fact an important point for cycle and pedestrian passage.
9.3. Construction Site Design and Construction Techniques Adopted
- A need to ensure that pedestrians and cyclists could walk through the road over the weir for the entire duration of the works with safe interference management.
- A need to ensure stability both in structural and hydraulic terms of the embankment between the lateral reservoir and the river as well as of the earth shoulder of the weir.
- Maintenance of the existing water supplies for the entire duration of the construction site and identification of a detailed schedule for the construction of the interfering works.
- Temporary works in order to keep the construction area site safe even with respect to flood events with return times of 200 years.
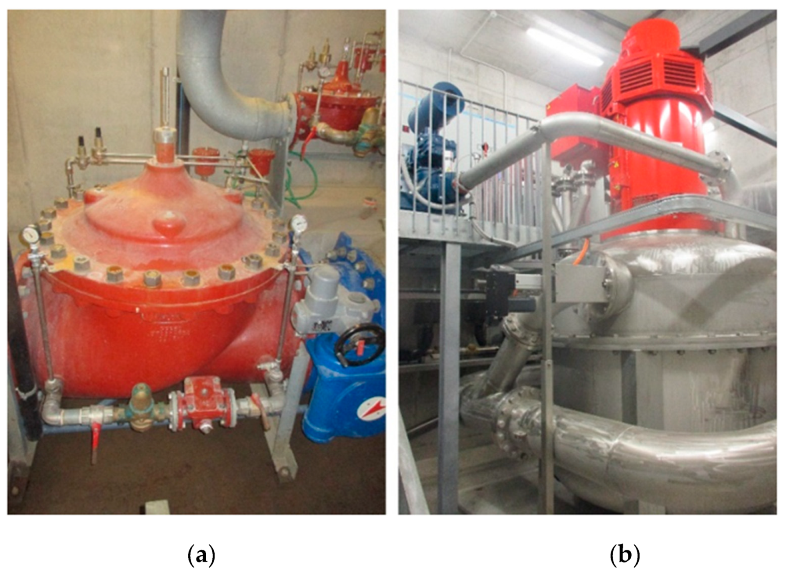
- Micro-tunneling that combines a pipe jacking technique with a remote-controlled shield machine. The thrusting force is distributed by hydraulic jacks located in the MTBM front section and operated by a thrust ring. Final injections of the interspace between pipeline and ground were planned (Figure 33a).
- Tunnel with traditional advancement method and consolidation treatment of the above embankment (Figure 33b).
- Trench excavation with support of the fronts through secant poles and construction of the penstock on site (Figure 33c).
10. Mini Hydro on the Environmental Flow Overflow Structures
- In winter (December–March): 392 L/s.
- In spring (April–July) and autumn (October–November): 549 L/s.
- In summer (August–September): 470.5 L/s.
11. Susa Valley Water System and Energy Generation from the Water Network
11.1. Susa Valley Water System Description
- Bardonecchia—Deveys: 20.85 km.
- Deveys—Chiomonte: 9.41 km.
- Chiomonte—Gravere: 3.42 km.
- the production plant is located at the end of a section fed by a reservoir.
- the water released by the turbines will be collected into another reservoir.
- water discharge will be not constant along the pipe since are present connections with the water distribution networks of the municipalities.
- thanks to an agreement between the hydropower and the water supply companies, the water released from the hydroelectric power plant is constant during the week but varies in the range 250–500 l/s with a monthly timescale.
- it is necessary to guarantee the regular exercise of the system, also in case of production plant failure.Based on the above observations, the planned hydroelectric plants will differ from ordinary plants principally because they must be able to adapt to the different operating conditions of the water supply system. In particular, under ordinary conditions, they must operate in upstream reservoir level regulation but must be able to detect anomalous operating situations by temporarily switching to an adjustment on the downstream reservoir level in order to limit any possible waste of water caused by the maximum level being overcome. Moreover, plants will be equipped with a by-pass valve in order to guarantee pressure dissipation also in case of production plant out of order, allowing managing pipe flow rate carried out routinely by the regulation system.
11.2. Electric Power Productibility
- Qmax: maximum flow rate;
- Zu: upstream altitude;
- Zt: turbine wheel altitude;
- Hg: altitude difference;
- Δh: head loss at the maximum flow rate;
- Havail: available head at maximum flow rate;
- Pmax: maximum electrical power, calculated with an efficiency of 0.85;
- Pn: generator nominal power.
- using the operating data provided for the water infrastructure design, the duration curve of the flow rates derived from the Bardonecchia intake has been calculated;
- the delivery nodes along the line for the supply of the various municipal aqueducts have been identified with an assignment of the operating rules of operation of the branch;
- the head losses in the individual sections of the pipe were estimated as a function of the flow rate determined as the difference between the flow rate derived from Bardonecchia and the flow rates subtracted along the line, by the Darcy–Weisbach equation;
- the effective hydraulic head has been calculated on the production groups;
- turbined flow estimated according to the operating rules assigned to the branches;
- power and energy generated estimation in the reference period of the operating rule and determination of the annual production.
- scenario 1: in this scenario, the water system supplies the municipal distribution networks with the maximum flow;
- scenario 2: in this scenario, the water system supplies the municipal distribution networks with 50% of the maximum flow;
- scenario 3: represents a further refinement of the previous scenario; here the derivation of the maximum flow rates was considered in the periods of maximum water requirement and applying a 20% reduction in the other periods.
11.3. Conclusions
12. Implementation of a Multipurpose Project on an Irrigation Plant by Installation of an Innovative Counter Pressure Pelton Turbine
12.1. Introduction
12.2. Project Enrolment
12.2.1. Feasibility Study and Technical Key Dates of the Hydropower Plant
12.2.2. Authorization Phase
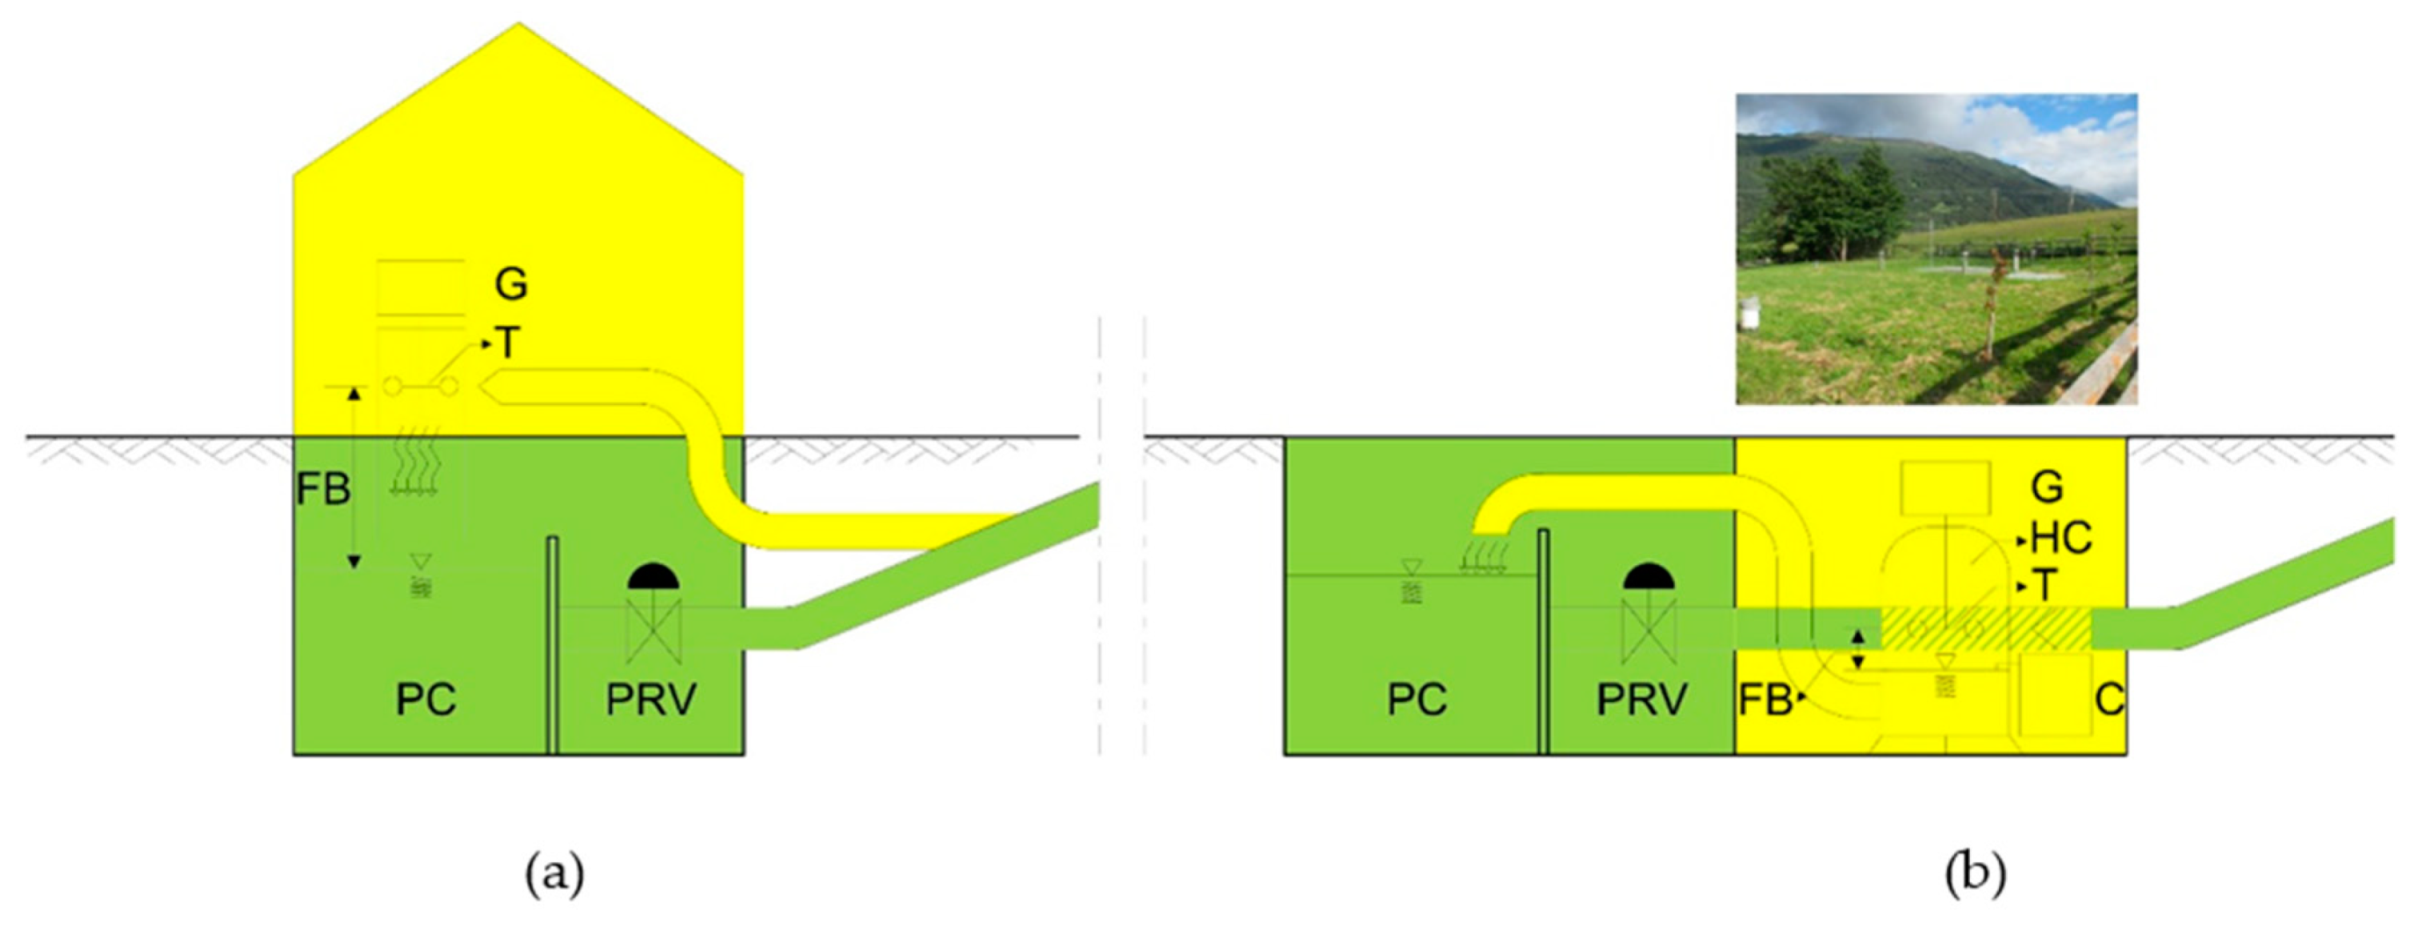
- To shift the powerhouse more upstream along the transport conduit, in order to gain the necessary height difference between the turbine axis and the water level in the pressure interruption chamber with the possibility to build the powerhouse underground;
- to install a reaction turbine (for example a Francis turbine);
- to install a classical Pelton turbine underground and to integrate it with a pump, able to cover the height difference between the tailwater level of the Pelton turbine and the water level of the pressure interruption chamber.
12.2.3. Implementation Phase
12.3. Discussion on Innovative Aspects of the Installed Hydropower Plant
12.3.1. Counter Pressure Turbine
12.3.2. Regulation of the Turbine
12.3.3. Closing Law of Turbine Closing Valve
12.4. Conclusions
13. Variable Speed Application for Energy Recovery Hydropower in Aqueducts
13.1. Hydropower from Aqueducts
13.2. Solcano SHPP
- High centrifugal forces at high-speed operation.
- High sliding speed for bearing, seals.
- Rotor dynamic calculation shall be performed to ensure resonance-free behavior over a wide range of operating speed.
13.3. Drinkable Water Compliance
13.3.1. Drinkability
13.3.2. Continuity
- When only the bypass is operating, the valve is commanded to open to release the flow required by the aqueduct operation.
- When the turbine is also generating power, the bypass can be closed by the quantity corresponding to keep the processed flow constant.
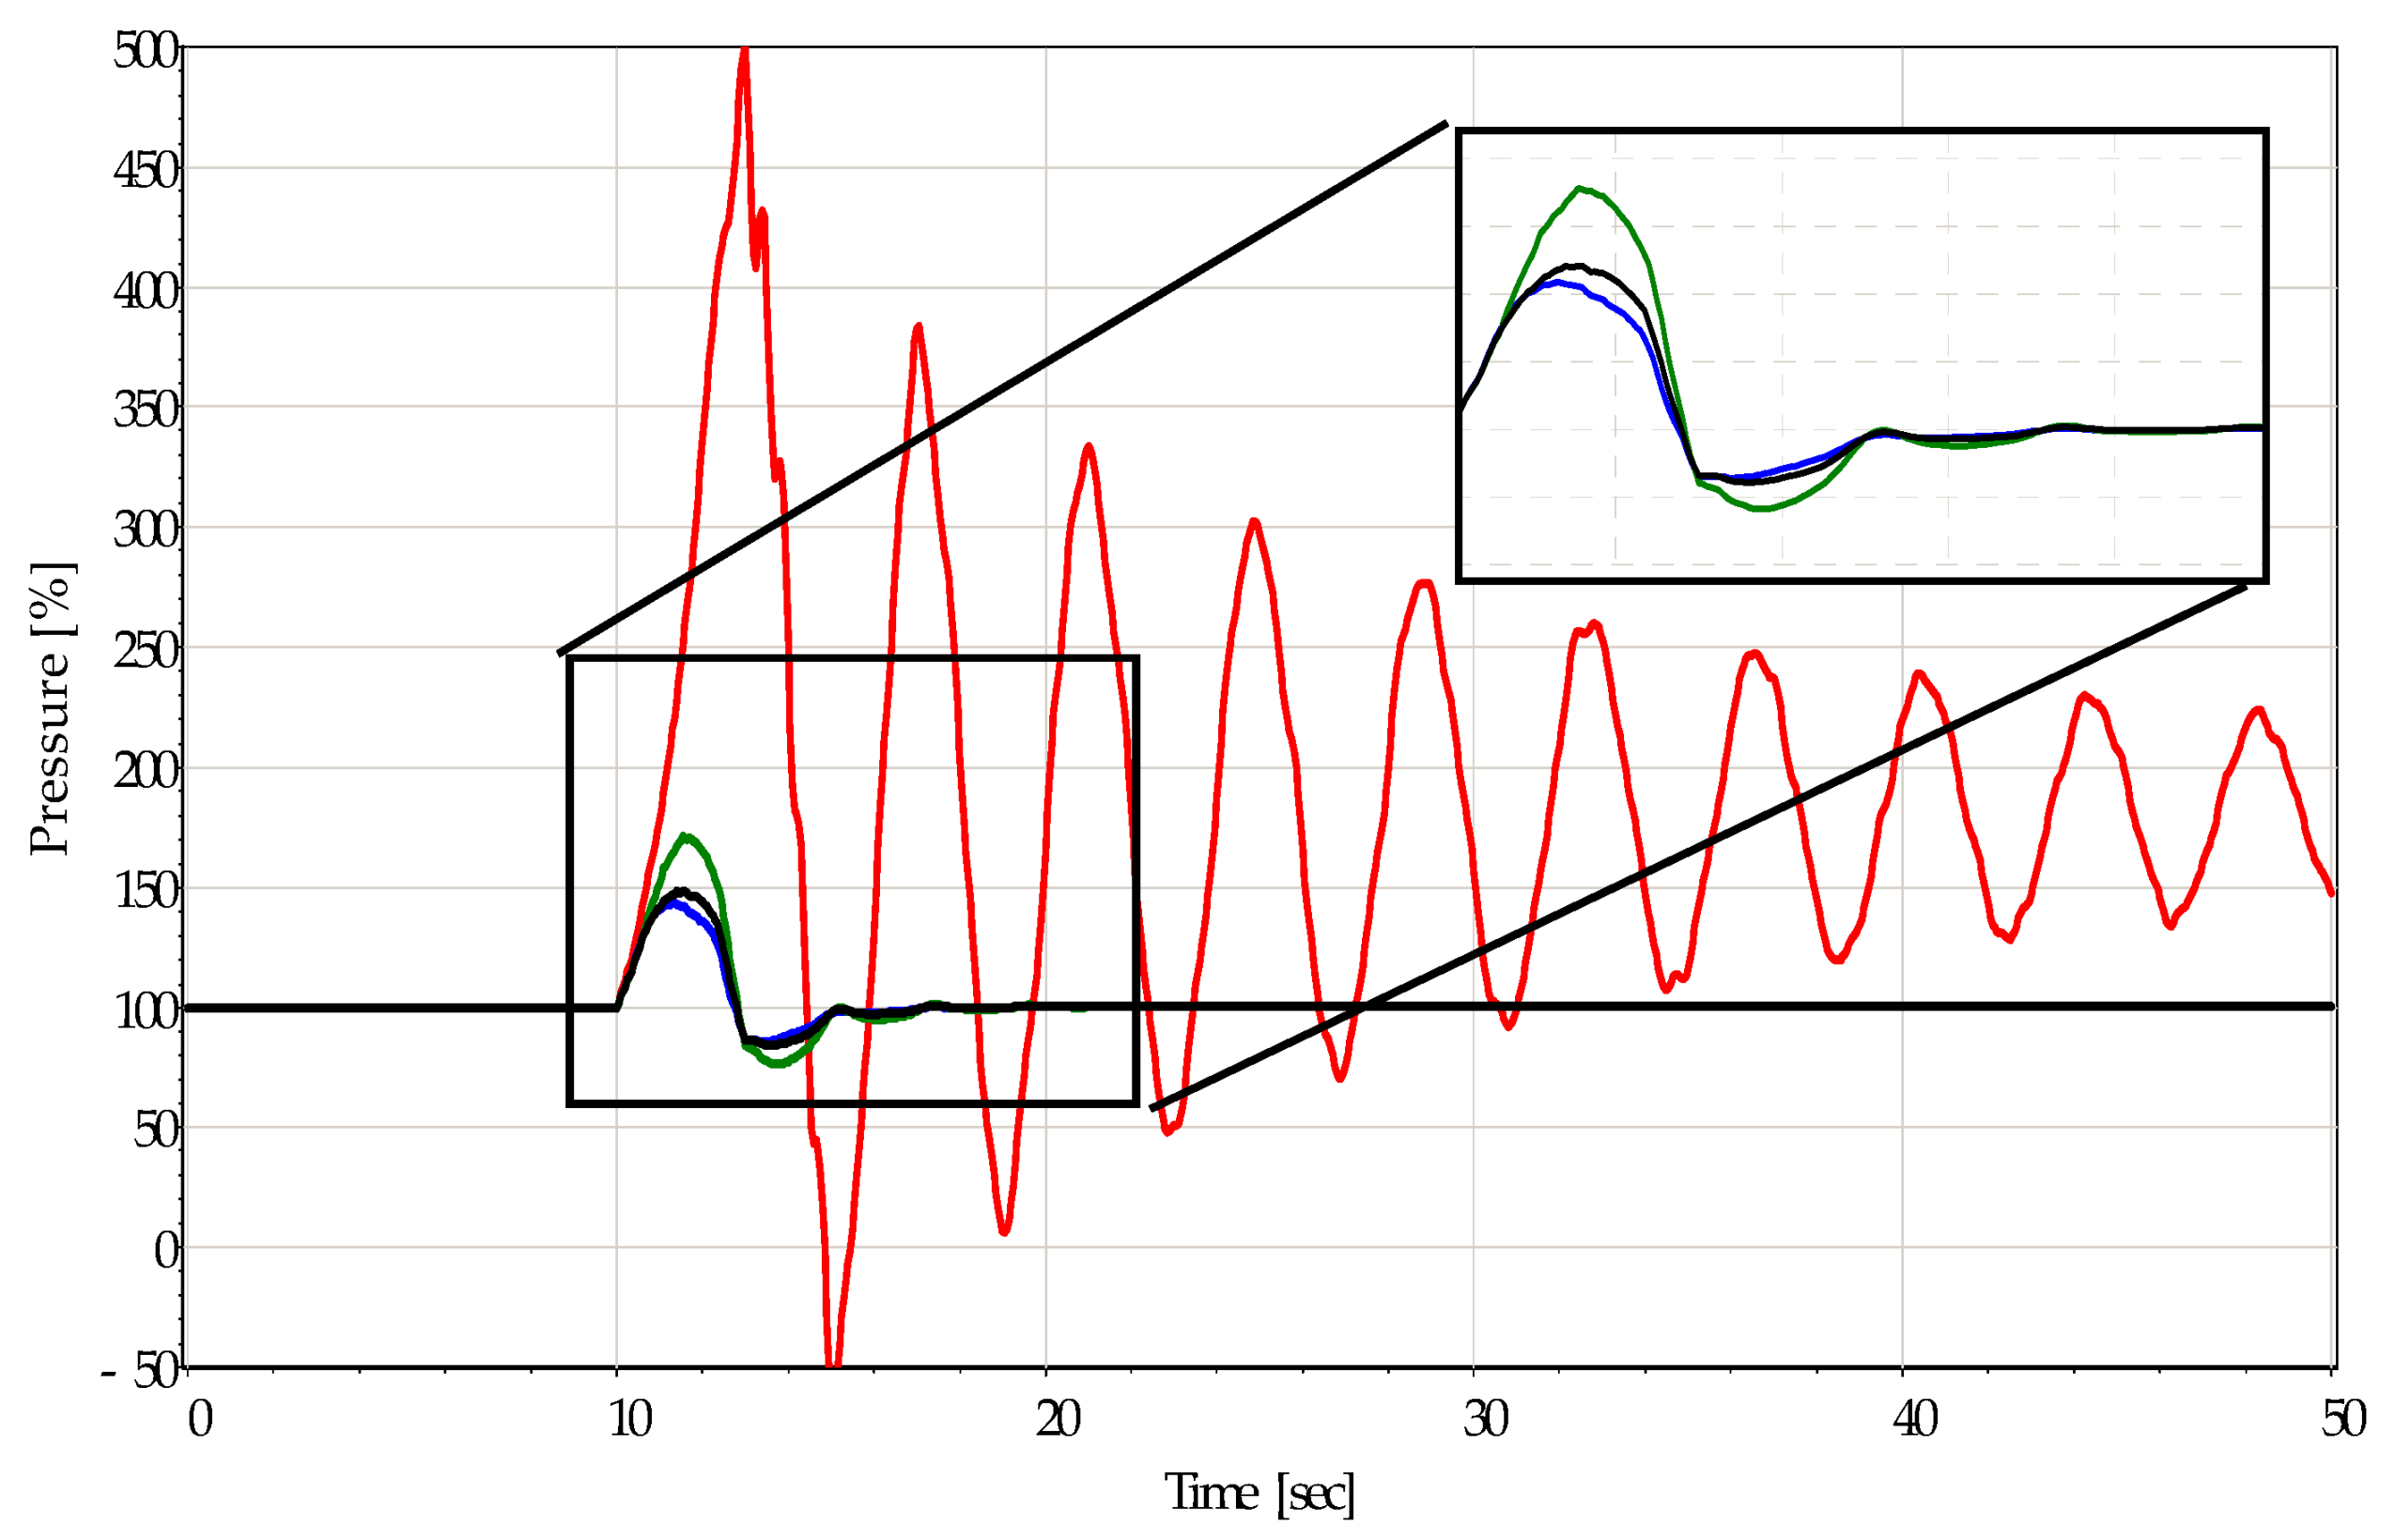
13.4. Governor and Transients
13.5. Conclusions
- Highly variable power plant characteristics: variable speed.
- Water supply and quality: paints and coatings in accordance with regulation.
- The synchronous operation, with bypass branch. Sometimes, given the small size, it is not possible to install a large flywheel, and the characteristic times are very low. The maneuvers must be very rapid.
- The turbine synchronized with bypass through a smart system. Water availability and system safety to be assured.
- Given the small size, attention to returns and production of parts. Solid piece forging, CNC material to be preferred.
- Speed governor system required. Governing system complex, commissioning crucial for optimization.
14. Study of Low-Head Hydrostatic Pressure Water Wheels for Harnessing Hydropower of Small Streams
14.1. Experimental Set-Up and Results
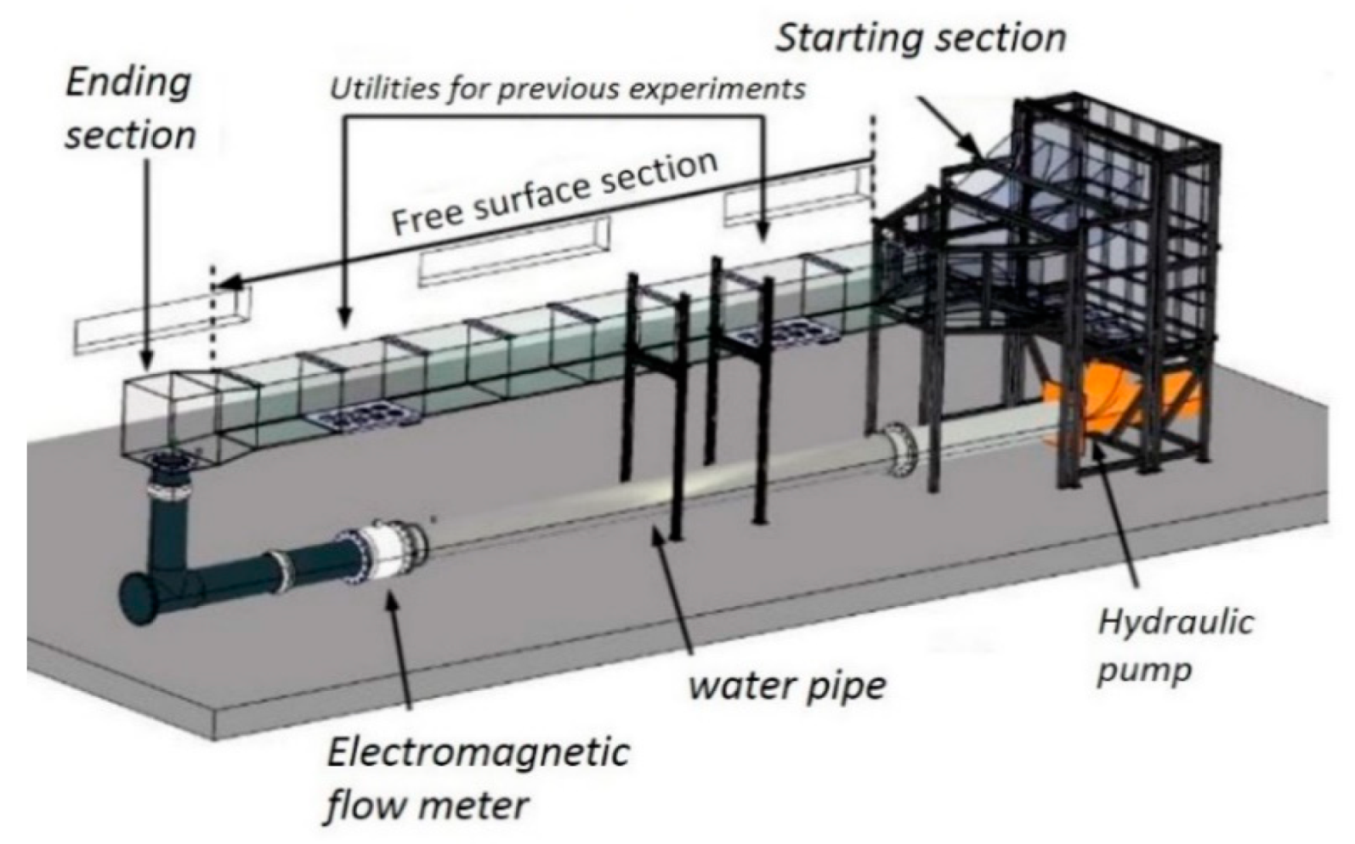
14.1.1. The Herode Hydraulic Channel
14.1.2. PYTHEAS Technology’s Wheel
14.2. Results
14.3. Conclusions and Perspectives
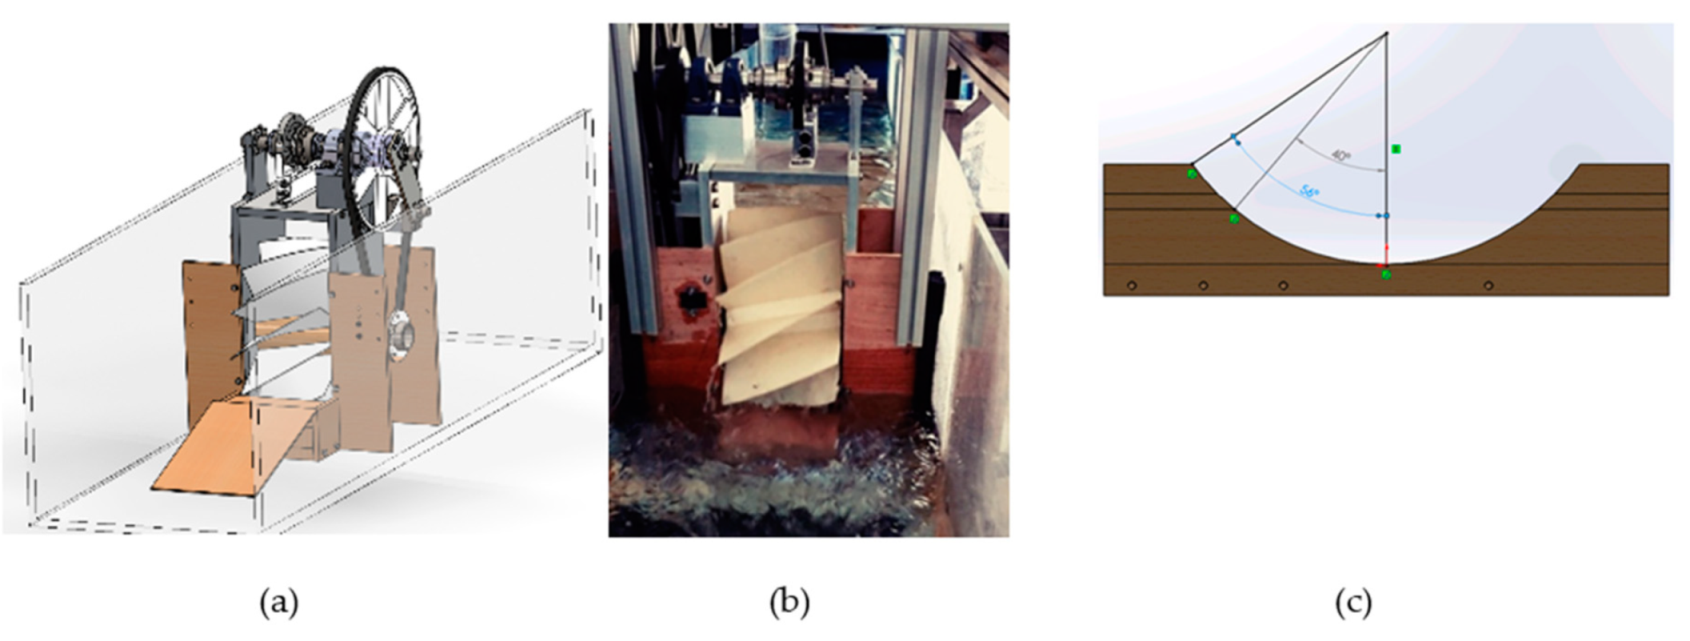
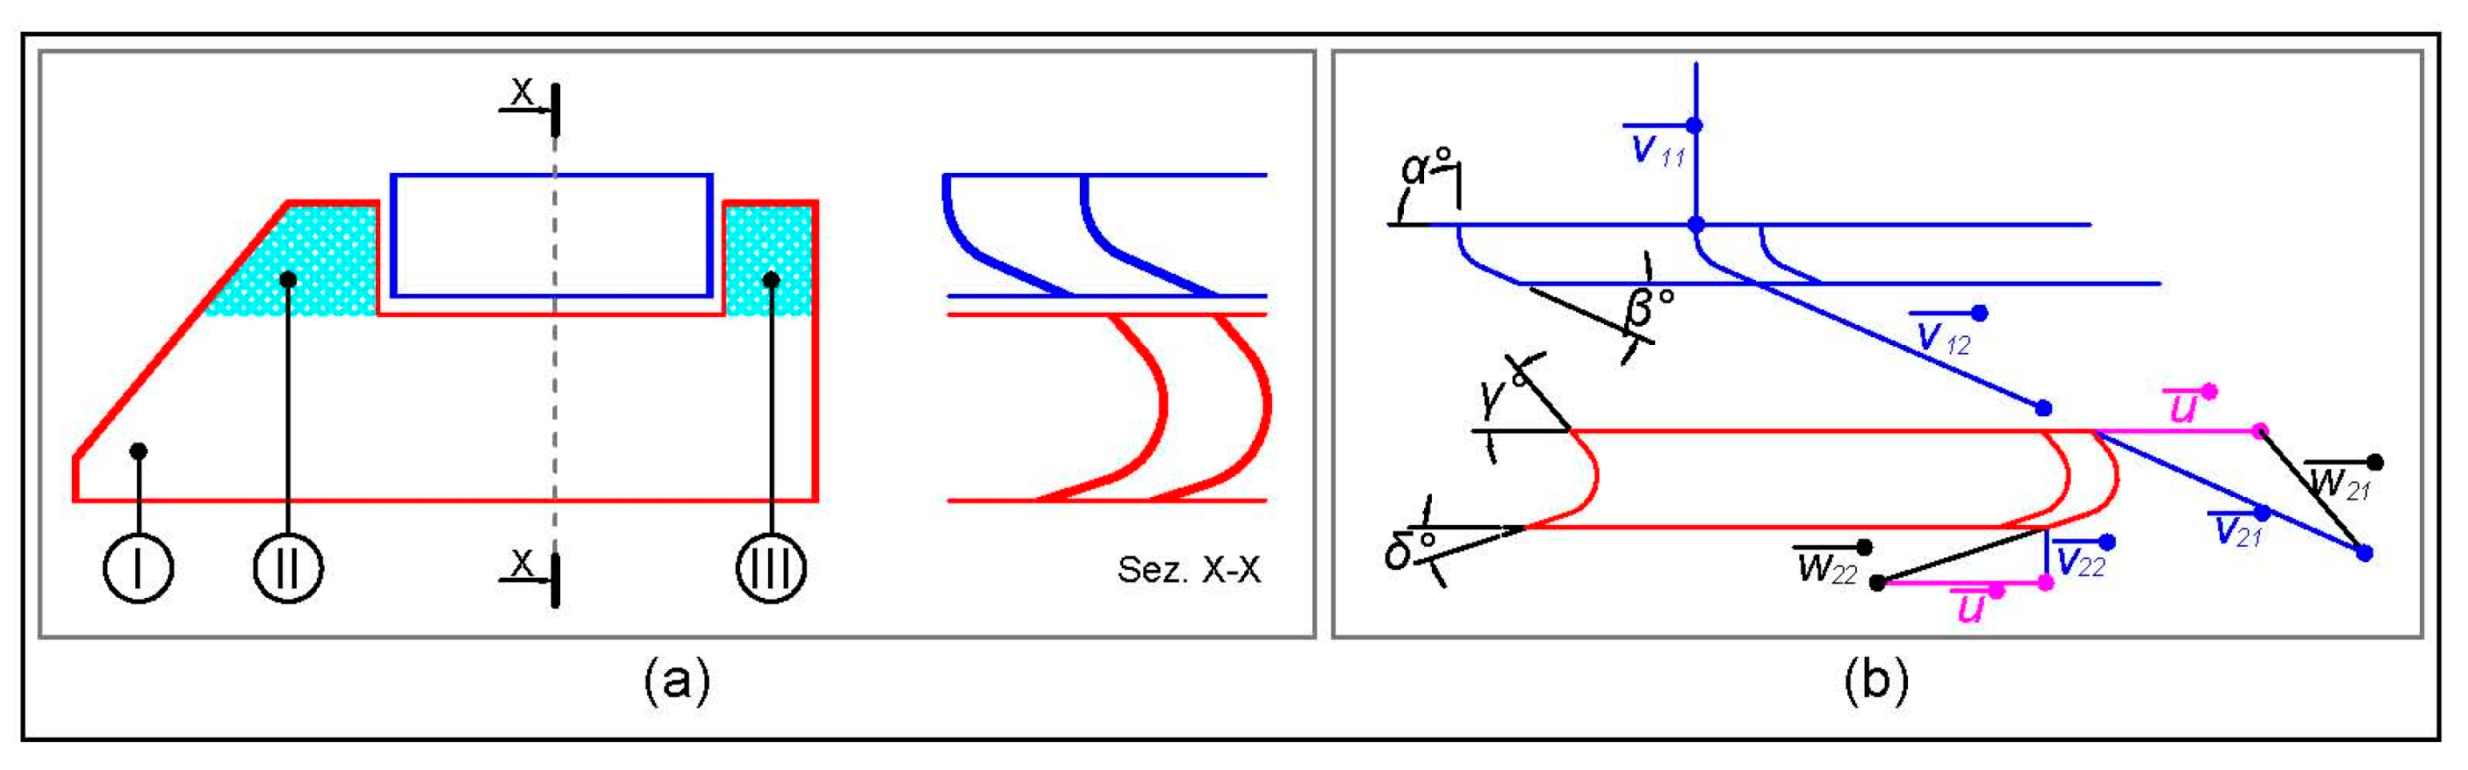
15. The Mariucci Turbine as Optimization of the Girard Turbine
Turbine Description: Working Principle, Flow Regulation and Efficiency
- distributor, nozzles, impeller, valves, rods for opening and closing the valves, sliding bands, templates for openings in the floors, are built with X2CrNi 18 10 steel.
- load-bearing structure is built with galvanized steel.
- transmission shaft, lower and upper supports, are built with S235 JO steel.
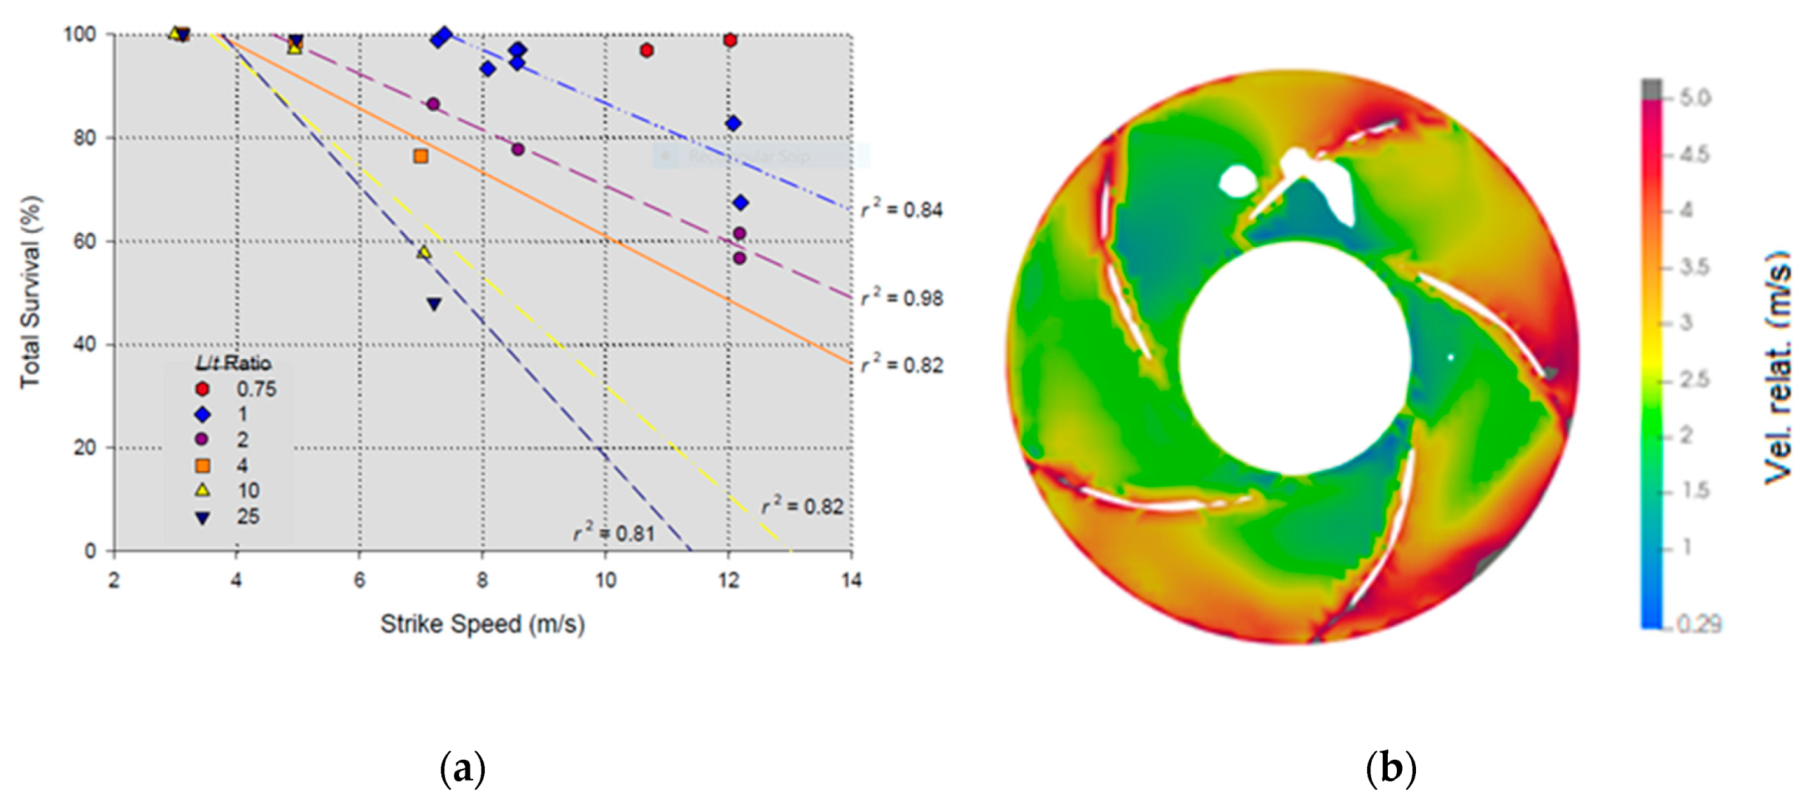
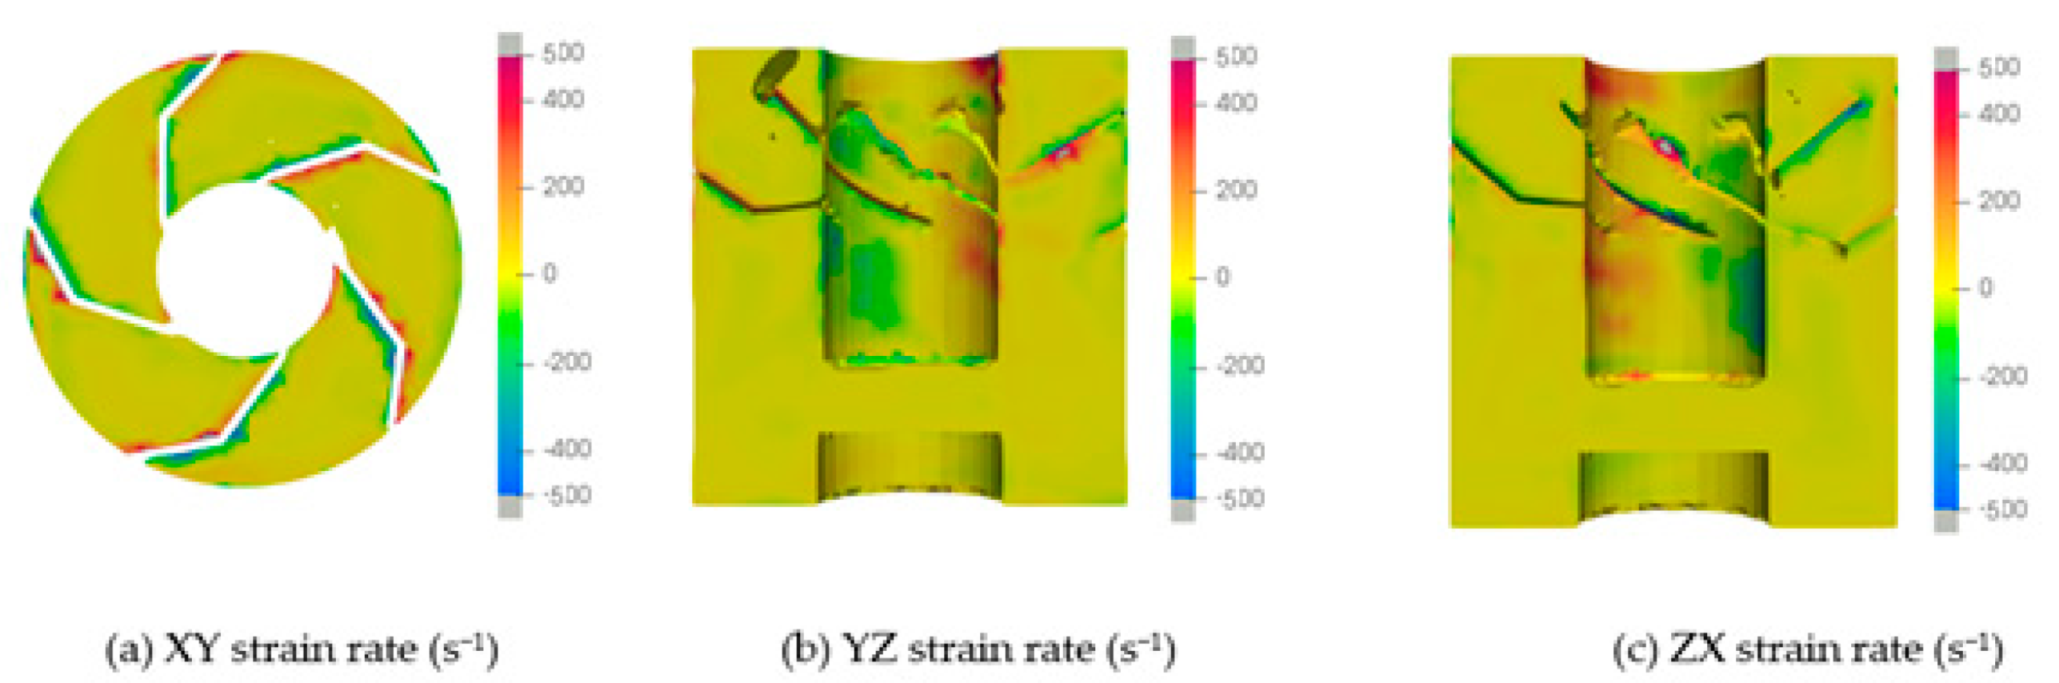
16. Rehabilitation of a Low-Head Gravitational Vortex Site with an Improved Vortex Turbine
16.1. Design Parameters
16.2. Low Ecological Impact
16.2.1. Ecologically Improved Design
16.2.2. Leading Edge Strike
16.2.3. Pressure Decrease
16.2.4. Rate of Pressure Decrease
16.2.5. Shear Strain Rate
16.3. Conclusions
17. Very Low Head Turbines on Navigation Locks
17.1. Steel Structures
17.2. Costs
17.3. Control
17.4. Conclusions
18. Discussion and Conclusions
Author Contributions
- -
- Novel speed governors for hydropower plants, by Compagnia Valdostana delle Acque, Italy.
- -
- Digital twin for penstock fatigue monitoring, by Power Vision Engineering, HES-SO Valais, Electricite d’Emosson Switzerland.
- -
- Better management by digitalization software and de-sedimentation techniques, Enel Green Power, Italy.
- -
- An innovative solution to reduce the hydropeaking effect of hydroelectric power plants, by Eisackwerk, Bioprogramm S.c, Italy.
- -
- Biological Validation of Improved Direct Turbine Survival at Ice Harbor Lock and Dam, by Voith Hydro, and USA Army Corp, USA.
- -
- Diamond Bearings for hydrokinetic turbines, by US Synthetic, USA and ORPC Inc., USA.
- -
- Hydropower as a driving force for Alpine territorial development, by Hydrodata and Intecno, Italy.
- -
- Hydroelectric development of an existing multiple use reservoir, by Consorzio Emilia Centrale, Studio di Progettazione AISE Engineering, Italy.
- -
- Mini hydro in environmental flow, by Ingegneri Consulenti, Italy.
- -
- Hydropower from the Susa Valley drinking water network, by SMAT, Italy.
- -
- Implementation of a multipurpose project on an irrigation plant by installation of an innovative counter pressure Pelton turbine, by Patscheider & Partner Engineers Ltd., Italy.
- -
- Variable speed application for Energy Recovery Hydropower in aqueducts, by ZECO Hydropower, Italy.
- -
- Study of low-head hydrostatic pressure water wheels for harnessing hydropower of small streams, by Pytheas Tecgnology, France.
- -
- The Mariucci turbine as evolution of the Girard turbine, by Teti srl, Italy.
- -
- Rehabilitation of a low-head gravitational vortex site with an improved vortex turbine, by Turbulent, Belgium.
- -
- The Very Low Head turbine in navigation locks, by STE Energy and RNB Hydro, Italy.
Funding
Acknowledgments
Conflicts of Interest
Disclaimer
Acronyms
| RDF12© | speed governor |
| RDT14© | voltage governor |
| FCR | frequency containment reserve |
| FRR | frequency restoration reserve |
| HydEA | Hydro Efficiency Analysis |
| KOOS | Kaplan Online Optimization System |
| O&M | Operation and Maintenance |
| Q | flow rate (m3/s, l/s) |
| H | head (m) |
| P | power (kW, MW) |
| N | rotational speed (rpm) |
| WUA | weighted usable area |
| USACE | U.S. Army Corps of Engineers |
| BPA | Bonneville Power Administration |
| ORPC | Ocean Renewable Power Company |
| PCD | polycrystalline diamond |
| DN | nominal diameter (mm, m) |
| PMG | Permanent Magnet Generator |
| Z | elevation (m) |
| E | energy (GWh) |
| C | cost (€) |
| PRV | pressure reducing valve |
| PRS | Pressure Reduction Stations |
| ERH | Energy Recovery Hydropower |
| SHPP | Small Hydro Power Plant |
| FDC | Flow Duration Curve |
| ESD | Emergency Shut Down |
| HPM | Hydrostatic Pressure Machine |
| CFD | Computational Fluid Dynamics |
| u | runner tangential speed (m/s) |
| v | flow speed (m/s) |
References
- International Hydropower Association. 2020 Hydropower Status Report Sector Trends and Insights; IHA Central Office: London, UK, 2020. [Google Scholar]
- Branche, E. The multipurpose water uses of hydropower reservoir: The SHARE concept. C. R. Phys. 2017, 18, 469–478. [Google Scholar] [CrossRef]
- Frey, G.W.; Linke, D.M. Hydropower as a renewable and sustainable energy resource meeting global energy challenges in a reasonable way. Energy Policy 2002, 30, 1261–1265. [Google Scholar] [CrossRef]
- Moran, E.F.; Lopez, M.C.; Moore, N.; Müller, N.; Hyndman, D.W. Sustainable hydropower in the 21st century. Proc. Natl. Acad. Sci. USA 2018, 115, 11891–11898. [Google Scholar] [CrossRef] [PubMed]
- Acreman, M.C.; Ferguson, A.J.D. Environmental flows and the European water framework directive. Freshw. Biol. 2010, 55, 32–48. [Google Scholar] [CrossRef]
- European Commission. RES Directive 2009/28/EC of the European Parliament and of the Council of 23 April 2009 on the promotion of the use of energy from renewable. Off. J. Eur. Union 2009, 5, 16–62. [Google Scholar]
- Kougias, I.; Aggidis, G.; Avellan, F.; Deniz, S.; Lundin, U.; Moro, A.; Muntean, S.; Novara, D.; Pérez-Díaz, J.I.; Quaranta, E.; et al. Analysis of emerging technologies in the hydropower sector. Renew. Sustain. Energy Rev. 2019, 113, 109257. [Google Scholar] [CrossRef]
- Trivedi, C.; Agnalt, E.; Dahlhaug, O.G. Investigations of unsteady pressure loading in a Francis turbine during variable-speed operation. Renew. Energy 2017, 113, 397–410. [Google Scholar] [CrossRef]
- Jain, S.V.; Patel, R.N. Investigations on pump running in turbine mode: A review of the state-of-the-art. Renew. Sustain. Energy Rev. 2014, 30, 841–868. [Google Scholar] [CrossRef]
- Bozhinova, S.; Hecht, V.; Kisliakov, D.; Müller, G.; Schneider, S. Hydropower converters with head differences below 2·5 m. Proc. Inst. Civ. Eng. Energy 2013, 166, 107–119. [Google Scholar] [CrossRef]
- Quaranta, E.; Revelli, R. Gravity water wheels as a micro hydropower energy source: A review based on historic data, design methods, efficiencies and modern optimizations. Renew. Sustain. Energy Rev. 2018, 97, 414–427. [Google Scholar] [CrossRef]
- Hogan, T.W.; Cada, G.F.; Amaral, S.V. The status of environmentally enhanced hydropower turbines. Fisheries 2014, 39, 164–172. [Google Scholar] [CrossRef]
- Sari, M.A.; Badruzzaman, M.; Cherchi, C.; Swindle, M.; Ajami, N.; Jacangelo, J.G. Recent innovations and trends in in-conduit hydropower technologies and their applications in water distribution systems. J. Environ. Manag. 2018, 228, 416–428. [Google Scholar] [CrossRef] [PubMed]
- Wang, C. A Guide for Local Benefit Sharing in Hydropower Projects; Social Development Working Papers; The World Bank Social Development: Washington, DC, USA, 2012; Volume 128. [Google Scholar]
- International Commission for the Protection of the Danube River (ICPDR). Hydropower Case Studies and Good Practice Examples, ANNEX to “Guiding Principles on Sustainable Hydropower Development in the Danube Basin”; Vienna International Centre: Vienna, Austria, 2013. [Google Scholar]
- International Hydropower Association. Better Hydro: Compendium of Case Studies 2017; IHA Central Office: London, UK, 2017. [Google Scholar]
- Eker, I. Governors for hydro-turbine speed control in power generation: A SIMO robust design approach. Energy Convers. Manag. 2004, 45, 2207–2221. [Google Scholar] [CrossRef]
- Codice di Rete Italiano. Available online: https://www.terna.it/it/sistema-elettrico/codici-rete/codice-rete-italiano (accessed on 20 October 2020).
- Pauletta, G. Sistema di regolazione elettroidraulico Hydroart tipo PR80 per turbine idrauliche—ENEL—1993. Internal Document. (In Italian)
- Sannolo, N.; Bonjean, M.; Cuvato, D.; Pasquettaz, R.; Caretti, P. Innovate to Optimise; International Water Power Dams Construction: Dartford, UK, 2019; pp. 28–31. [Google Scholar]
- CECT. Recommendations for the Design, Manufacture and Erection of Steel Penstocks of Welded Construction for Hydroelectric Installations; European Committee of Boiler, Vessel and Pipe Work Manufacturers: Paris, France, 1980. [Google Scholar]
- Koutnik, J.; Varner, M.; Linhart, V. Service Life Determination of a 50 Years Old Twin Penstock PSPP Stechovice Internationales Seminar Wasserkraftanlagen; TU Wien: Vienna, Austria, 2000. [Google Scholar]
- Duparchy, F.; Chambas, P.A.; Marin, H.; Pereira, F.; Combaz, T. Impact of pressure fluctuation on the fatigue life of high pressure penstocks. In Proceedings of the Conference on High Strength Steels for Hydropower Plants; Graz University of Technology: Graz, Austria, 2013. [Google Scholar]
- Nicolet, C.; Bollaert, E. Hydroelectric Power Plant Real-time Monitoring System and Method, 7.5. European Patent EP 2,801,879 B1, 27 September 2017. [Google Scholar]
- Nicolet, C.; Béguin, A.; Bollaert, E.; Boulicaut, B.; Gros, G. Real-time simulation monitoring system for hydro plant transient surveys. Int. J. Hydropower Dams 2015, 22, 62–69. [Google Scholar]
- Nicolet, C.; Greiveldinger, B.; Hérou, J.-J.; Kawkabani, B.; Allenbach, P.; Simond, J.-J.; Avellan, F. High Order Modeling of Hydraulic Power Plant in Islanded Power Network. IEEE Trans. Power Syst. 2007, 22, 1870–1881. [Google Scholar] [CrossRef]
- Nicolet, C.; Dreyer, M.; Beguin, A.; Bollaert, E.; Torrent, S.; Dayer, J.-D. Hydraulic Transient Survey at Cleuson-Dixence with Real-Time Hydro-Clone Monitoring System. In Proceedings of the HYDRO 2018 Conference, Gdansk, Poland, 15–17 October 2018. [Google Scholar]
- Frequency-Containment-Reserve. Available online: https://www.emissions-euets.com/internal-electricity-market-glossary/793-frequency-containment-reserve (accessed on 20 October 2020).
- Hachem, F.E.; Schleiss, A.J. A review of wave celerity in frictionless and axisymmetrical steel-lined pressure tunnels. J. Fluids Struct. 2011, 27, 311–328. [Google Scholar] [CrossRef]
- Pachoud, A.J. Influence of Geometrical Imperfections and Flaws at Welds of Steel Liners on Fatigue Behavior of Pressure Tunnels and Shafts in Anisotropic Rock. Ph.D. Thesis, EPFL, Lausanne, Switzerland, 2017. [Google Scholar]
- E08 Committee. Practices for Cycle Counting in Fatigue Analysis; ASTM International: West Conshohocken, PA, USA, 2017. [Google Scholar]
- Niesłony, A. Determination of fragments of multiaxial service loading strongly influencing the fatigue of machine components. Mech. Syst. Signal Process. 2009, 23, 2712–2721. [Google Scholar] [CrossRef]
- British Standard. BS 7910 2013 Guide to Methods for Assessing the Acceptability of Flaws in Metallic Structures; British Standard: London UK, 2013; ISBN 0-580-45965-9. [Google Scholar]
- Dreyer, M.; Nicolet, C.; Gaspoz, A.; Biner, D.; Rey-Mermet, S.; Saillen, C.; Boulicaut, B. Digital Clone for Penstock Fatigue Monitoring. In Proceedings of the 8th IAHR International Meeting of the Workgroup on Cavitation and Dynamic Problems in Hydraulic Machinery and Systems, Stuttgart, Germany, 9–11 October 2019. [Google Scholar]
- Cazzaniga, R.; Rosa-Clot, M.; Rosa-Clot, P.; Tina, G.M. Integration of PV floating with hydroelectric power plants. Heliyon 2019, 5, e01918. [Google Scholar] [CrossRef]
- Bruder, A.; Tonolla, D.; Schweizer, S.P.; Vollenweider, S.; Langhans, S.D.; Wüest, A. A conceptual framework for hydropeaking mitigation. Sci. Total Environ. 2016, 568, 1204–1212. [Google Scholar] [CrossRef]
- Heller, P.; Bollaert, E.; Schleiss, A.J. Optimal Reservoir Use of a Multipurpose Run-of-River Powerplant for Hydropeaking Mitigation. In Proceedings of the Hydro2005: Policy into Practice, Villach, Austria, 17–20 October 2005; pp. 1–8. [Google Scholar]
- Bovee, K. A Guide to Stream Habitat Analysis Using the Instream Flow Incremental Methodology; IFIP No. 12. No. 82/26; U.S. Fish and Wildlife Service: Washington, DC, USA, 1982.
- Baumann, P.; Kirchhofer, A.; Schalchli, U. Risanamento Deflussi Discontinui—Pianificazione Strategica. In Un Modulo Dell’aiuto All’esecuzione Rinaturazione Delle Acque; Ufficio federale dell’ambiente: Bern, Switzerland, 2012. [Google Scholar]
- Allen, L.; Conder, T.; Annear, C. Test of Weighted Usable Area Estimates Derived from a Phabsim Model for Instream Flow Studies on Trout Streams. N. Am. J. Fish. Manag. 1987, 7, 339–350. [Google Scholar]
- Trumbo, B.A.; Ahmann, M.L.; Renholds, J.F.; Brown, R.S.; Colotelo, A.H.; Deng, Z.D. Improving hydroturbine pressures to enhance salmon passage survival and recovery. Rev. Fish Biol. Fish. 2014, 24, 955–965. [Google Scholar] [CrossRef]
- Normandeau Associates Inc.; Skalski, J.R.; Townsend, R.L. Turbine Operational Effects on Survival/Condition of Yearling Chinook Salmon at Ice Harbor Dam. March 2007; unpublished. [Google Scholar]
- Martinez, J.J.; Deng, Z.D.; Titzler, P.S.; Duncan, J.P.; Lu, J.; Mueller, R.P.; Tian, C.; Trumbo, B.A.; Ahmann, M.L.; Renholds, J.F. Hydraulic and biological characterization of a large Kaplan turbine. Renew. Energy 2019, 131, 240–249. [Google Scholar] [CrossRef]
- Johnson, P.N.; Nealson, P.; Steig, T.; Sullivan, C.; Miller, J.; Haffey, S.; Gray, M.; Geris, K.; Hitchko, K.; Skalski, J.; et al. Characterization of juvenile salmonid vertical distribution in unit 1, Ice Harbor Dam. 2015; unpublished. [Google Scholar]
- Malerba, C. L’acqua, il Futuro. In Ispirazione Sociologica e Gestione Dell’acqua, Risorsa Primaria; arabAFenice: Cuneo, Italy, 2012. [Google Scholar]
- Giddens, A. The Consequences of Modernity; Polity Press: Cambridge, UK, 1991. [Google Scholar]
- Bromaghin, A.; Ali, M.; Ravens, T.; Petersen, T.; Hoffman, J. Experimental Study of Abrasion Characteristics for Critical Sliding Components for Use in Hydrokinetic Devices. Renew. Energy 2014, 66, 205–214. [Google Scholar] [CrossRef]
- Tyler, R. Commercial Systems at ORPC, personal interview. 17 June 2020. [Google Scholar]
- Khonsar, M.; Booser, E. Applied Tribology: Bearing Design and Lubrication, 3rd ed.; John Wiley & Sons, Ltd.: Hoboken, NJ, USA, 2001; pp. 153–154. [Google Scholar]
- Marnagh, C. Using Tidal Energy to Power Off-the-Grid Towns. NBC News, Mach. 3 April 2019. Available online: https://www.nbcnews.com/mach/video/using-tidal-energy-to-power-off-the-grid-towns-1471394883522 (accessed on 20 October 2020).
- Inoue, K.; Deguchi, K.; Okude, K.; Fujimoto, R. Development of the Water-Lubricated Thrust Bearing of the Hydraulic Turbine Generator. In IOP Conference Series: Earth and Environmental Science; IOP Publishing: Bristol, UK, 2012; Volume 15, p. 072022. [Google Scholar]
- Massarutto, A. Agriculture, Water Resources and Water Policies in Italy. Feem Work. Pap. 2000, 33–99. [Google Scholar]
- Fellini, S.; Vesipa, R.; Boano, F.; Ridolfi, L. Multipurpose Design of the Flow-Control System of a Steep Water Main. J. Water Resour. Plan. Manag. 2018, 144, 05017018. [Google Scholar] [CrossRef]
- Rani, D.; Moreira, M. Simulation-optimization modeling: A survey and potential application in reservoir systems operations. Water Resour. Manag. 2010, 24, 1107–1138. [Google Scholar] [CrossRef]
- Sinagra, M.; Aricò, C.; Tucciarelli, T.; Amato, P.; Fiorino, M. Coupled Electric and Hydraulic Control of a PRS Turbine in a Real Transport Water Network. Water 2019, 11, 1194. [Google Scholar] [CrossRef]
- Viccione, G.; Amato, R.; Martucciello, M. Hydropower Potential from the AUSINO Drinking Water System. Proceedings 2018, 2, 688. [Google Scholar] [CrossRef]
- Van Dijk, M.; Van Vuuren, S.J.; Cavazzini, G.; Santolin, A.; Niebuhr, C.M. Optimization of Cascading Conduit Hydropower Plants in a Water Distribution System. In Proceedings of the Hydro Conference, Porto, Portugal, 14–16 October 2019; Aqua-Media International Ltd.: Wallington, Surrey, 2019. [Google Scholar]
- White, J. Recovering energy from an existing conduit. Int. Water Power Dam Constr. 2011, 3, 18–20. [Google Scholar]
- Penninger, G.; Benigni, H. Numerical Simulation and Design of Spherical Valves for Modern Pump Storage Power Plants. In Proceedings of the 14th International Seminar on Hydropower Plants, Vienna, Austria, 22–24 November 2006. [Google Scholar]
- Quaranta, E. Optimal Rotational Speed of Kaplan and Francis Turbines with Focus on Low-Head Hydropower Applications and Dataset Collection. J. Hydraul. Eng. 2019, 145, 04019043. [Google Scholar] [CrossRef]
- European Commission. HYLOW Project: Development of Hydropower Converters with Very Low Head Differences. European Project Number 212423 Funded under the Framework Program 7—Energy 2007 (FP7-Energy-2007-1-RTD), 2008–2013. Available online: http://www.hylow.eu/ (accessed on 20 October 2020).
- Paish, O. Small hydropower: Technology and current status. Renew. Sustain. Energy Rev. 2002, 6, 537–556. [Google Scholar] [CrossRef]
- Senior, J.; Saenger, N.; Müller, G. New hydropower converters for very low-head differences. J. Hydraul. Res. 2010, 48, 703–714. [Google Scholar] [CrossRef]
- Senior, J.A. Hydrostatic Pressure Converters for the Exploitation of very Low Head Hydropower Potential. Ph.D. Thesis, University of Southampton, Southampton, UK, 2009. [Google Scholar]
- Linton, N.P. Field Trials and Development of A Hydrostatic Pressure Machine. Ph.D. Thesis, University of Southampton, Southampton, UK, 2013. [Google Scholar]
- Paudel, S. Experimental and Numerical Study of Dethridge Wheel for Pico-scale Hydropower Generation. Ph.D. Thesis, Darmstadt University, Darmstadt, Germany, 2015. [Google Scholar]
- Butera, I.; Fontan, S.; Poggi, D.; Quaranta, E.; Revelli, R. Experimental Analysis of Effect of Canal Geometry and Water Levels on Rotary Hydrostatic Pressure Machine. J. Hydraul. Eng. 2019, 146, 04019071. [Google Scholar] [CrossRef]
- Quaranta, E. The Revival of Old Hydraulic Turbines for Innovative Hydropower Generation: Water Wheels, Archimedes Screws, Deriaz and Girard Turbines. Curr. Trends Civ. Struct. Eng. 2020, 5, 1–4. [Google Scholar]
- Audrius, Z.; Aggidis, G. State of the art in numerical modelling of Pelton turbines. Renew. Sustain. Energy Rev. 2015, 45, 135–144. [Google Scholar]
- Müller, G.; Kauppert, K. Performance characteristics of water wheels. J. Hydraul. Res. 2004, 42, 451–460. [Google Scholar] [CrossRef]
- Quaranta, E.; Müller, G. Sagebien and Zuppinger water wheels for very low head hydropower applications. J. Hydraul. Res. 2018, 56, 526–536. [Google Scholar] [CrossRef]
- Metzler, M.; Pelz, P.F. Draft tube design method for operation at optimal coefficient of performance in low head hydropower. Wasserwirtschaft 2015, 105, 13–17. [Google Scholar] [CrossRef]
- Amaral, S.V.; Hecker, G.E.; Dixon, D.A. Designing Leading Edges of Turbine Blades to Increase Fish Survival from Blade Strike. In EPRI-DOE, Conference on Environmentally-Enhanced Hydropower Turbines; EPRI Report, No. 1024609; EPRI: California, CA, USA, 2011. [Google Scholar]
- Cada, G.F.; Coutant, C.C.; Whitney, R.R. Development of Biological Criteria for the Design of Advanced Hydropower Turbines; No. DOE/ID-100578; EERE Publication and Product Library: Washington, DC, USA, 1997.
- Cook, T.C.; Hecker, G.E.; Amaral, S.V.; Stacy, P.S.; Lin, F.; Taft, E.P. Final Report-Pilot Scale Tests Alden/Concepts NREC Turbine; US Department of Energy: Washington, DC, USA, 2003.
- Abernethy, C.S.; Amidan, B.G.; Cada, G.F. Simulated Passage through A Modified Kaplan Turbine Pressure Regime: A Supplement to Laboratory Studies of the Effects of Pressure and Dissolved Gas Supersaturation on Turbine-Passed Fish; No. PNNL-13470-A; Pacific Northwest National Lab. (PNNL): Richland, WA, USA, 2002.
- Sungai Ayung. Available online: https://id.wikipedia.org/wiki/Sungai_Ayung (accessed on 22 June 2020).
- Richmond, M.C.; Serkowski, J.A.; Ebner, L.L.; Sick, M.; Brown, R.S.; Carlson, T.J. Quantifying barotrauma risk to juvenile fish during hydro-turbine passage. Fish. Res. 2014, 154, 152–164. [Google Scholar] [CrossRef]
- Quaranta, E.; Riasi, A.; Revelli, R. The Very Low Head Turbine for hydropower applications: A review. Renew. Sustain. Energy Rev. 2020. submitted. [Google Scholar]
- Fraser, R.; Deschênes, C.; Kueny, J.L.; O’Neil, C.; Leclerc, M. VLH: Development of a new turbine for Very Low Head sites. In Waterpower XV; Hydro Review: Chattanooga, TN, USA, 2007. [Google Scholar]
- Lautier, P.; Ndjana, H.J.N.; Leclerc, M.; O’Neil, C. Improved operation and power production of a Very Low Head hydraulic turbine. In Waterpower XV; Hydro Review: Chattanooga, TN, USA, 2007; Available online: http://www.vlh-turbine.com/DE/PDF/evenements/WaterPower2007_Philippe_Lautier.pdf (accessed on 20 October 2020).
- Leclerc, M. The very low head turbo generator: A new turbine for profitable harnessing of very low head applications. In Hydro 2007; Aqua Media International: Granada, Spain, 2007. [Google Scholar]
- Arquilla, M.; Pasut, F. A Novel MPPT controller for Variable Speed hydro generators. In Proceedings of the Vienna hydro International Conference, Vienna, Austria, 26–28 November 2014; pp. 569–575. [Google Scholar]
- Égré, D.; Senécal, P. Social impact assessments of large dams throughout the world: Lessons learned over two decades. Impact Assess. Proj. Apprais. 2003, 21, 215–224. [Google Scholar] [CrossRef]
- Quaranta, E.; Wolter, C. Sustainability assessment of hydropower water wheels with downstream migrating fish. Sustain. Energy Technol. Assess. submitted.
- Gielen, D. Renewable energy technologies: Cost analysis series. Hydropower 2012, 1, IRENA. [Google Scholar]


| Case | Description |
|---|---|
| A | 24 h without ancillary service, no simultaneous stopping of both units |
| B | 24 h without ancillary service, with two starts and stops of unit 2 |
| C | 24 h with only secondary control service (FRR) |
| D | 24 h with primary and secondary control services (FCR + FRR) |
| Sediment Composition | Upper Part Sediment (Muddy Layer) | Lower Part Sediment | |
|---|---|---|---|
| 30% Solid Mass + 70% Water Mass * | 40% Solid Mass + 60% Water Mass * | ||
| Density of solid | [t/m3] | 2.00 | 2.38 |
| Density of water | [t/m3] | 0.98 | 1.00 |
| Density of sediment | [t/m3] | 1.16 | 1.30 |
| Operating Points * | Head Range ** [m] | Flow Range ** [m3/s] |
|---|---|---|
| Discharge Corresponding to a 1% Efficiency Drop from the Peak Efficiency | 29.78–29.84 | 349.7–353.1 |
| Peak Efficiency | 29.74–29.91 | 365.3–367.3 |
| Generator Limit | 29.73–29.77 | 384.3–385.4 |
| Property Comparison: PCD with Other Engineering Materials | |||||
|---|---|---|---|---|---|
| Thermal Conductivity (W/m K) | Tensile Strength (MPa) | Compressive Strength (GPa) | Modulus of Elasticity (GPa) | Hardness (GPa, Koop) | |
| PCD | 543 | 1300–1600 | 6.9–7.6 | 841 | 49.8 |
| Tungsten carbide | 70 | 334 | 2.68 | 669–696 | 1.8 |
| Silicon nitride | 30 | 520 | 3.45 | 296 | 1.8 |
| Silicon carbide | 85 | 500 | 2.5 | 434 | 2.4 |
| Steel (4140) | 42.6 | 415 | 1.6 | 205 | 0.2 |
| Technique | Penstock | Benefits | Drawbacks | Cost |
|---|---|---|---|---|
| Micro-tunneling | 2 penstock DN 2000/2500 PRFV/ca + 1 concrete channel for discharge DN 2000 | Less interference with above road |
| 910,000 euro/1,300,000 euro |
| Traditional tunnel | 1 concrete penstock. DN 3600 mm 1 concrete channel for discharge DN 2000 | Less interference with above road Low head loss |
| 1,250,000 euro |
| Trench excavation | 1 concrete penstock. DN 3600 mm 1 concrete squared channel for discharge 2.5 × 2.5 m | Low head loss Reduced structural and hydraulic interference with embankment |
| 1,160,000 euro |
| Geometric Feature | Units | Value |
|---|---|---|
| Dam height | m | 105 |
| Maximum retention height | m | 99 |
| Maximum regulation elevation | m a.s.l. | 1458 |
| Minimum regulation elevation | m a.s.l. | 1395 |
| Basin storage volume | million m3 | 29.4 |
| Total head in maximum basin level 1 | m | 114 |
| Total head in minimum basin level | m | 51 |
| Plant | Qmax | Zu | Zt | Hg | Δh | Havail | Pmax | Pn |
|---|---|---|---|---|---|---|---|---|
| [l/s] | [m asl] | [m asl] | [m] | [m] | [m] | [kW] | [kW] | |
| Deveys | 500 | 1261.50 | 1012.00 | 251.50 | 38.90 | 212.60 | 885 | 950 |
| Chiomonte | 500 | 1010.00 | 744.60 | 265.40 | 16.90 | 248.50 | 1035 | 1000 |
| Gravere | 500 | 742.20 | 612.20 | 130.00 | 18.00 | 112.00 | 466 | 500 |
| Scenery | Deveys | Chiomonte | Gravere | Total |
|---|---|---|---|---|
| [kWh] | [kWh] | [kWh] | [kWh] | |
| 1 | 4,094,465 | 4,578,664 | 2,238,775 | 10,911,904 |
| 2 | 4,999,514 | 5,674,226 | 2,785,265 | 13,459,005 |
| 3 | 4,706,430 | 5,288,464 | 2,588,769 | 12,583,663 |
| Variable | Symbol | Unit | Value |
|---|---|---|---|
| Gross head | H | m | 181.95 |
| Net head | H | m | 160.40 |
| Mean flow 1 | Qmean | l/s | 136 |
| Minimum turbine flow 2 | Qmin | l/s | 140 |
| Maximum turbine flow | Qmax | l/s | 580 |
| Gross capacity to be installed | P | kW | 825 |
| Yearly expected power output | E | GWh | ~1.1 |
| Expected costs | C | € | 1 Mio. |
| Type | Unit | Value |
|---|---|---|
| Pelton counter pressure turbine, vertical axis, 4 nozzles | ||
| Rotational speed | min−1 | 750 |
| Number of buckets | 21 | |
| Diameter of runner | mm | 697 |
| Width of bucket | mm | 184 |
| Maximum efficiency of turbine | % | 91.5 |
| Maximum electrical capacity | kW | 803 |
| Installed capacity of generator | kVA | 873 |
| Power need for compressor | kW | 22.6 |
| Freeboard between turbine axis and tail water level | mm | 400 |
| Diameter of casing | mm | 2200 |
| Height of casing | mm | 2400 |
| Parameter | Value |
|---|---|
| Impeller diameter | 1.18 m |
| Blade row height | 0.44 m |
| Speed | 96 rpm |
| Nominal flow | 1.5 m3/s |
| Predicted head | 2.05 m |
| Measured | 1.85 m |
| Net predicted power | 14.1 kW |
| Net Measured power | 13 kW |
| Predicted hydr. efficiency | 54.6% |
| Measured hydr. efficiency | 55.8% |
| Description | Units | Value (Canda) | Value (Bussari) |
|---|---|---|---|
| Rated Power | kW | 256 | 481 |
| Min-Rated-Max speed | rpm | 34.9–55.2–58.6 | 20.3–32.1–34.1 |
| Unit Speed N11 | - | 100 | 100 |
| Unit Discharge Q11 | - | 0.68 | 0.625 |
| dP/dt | dω/dt | Direction | Action |
|---|---|---|---|
| <0 | <0 | Bad | Increase speed |
| >0 | >0 | Good | Increase speed |
| >0 | <0 | Good | Decrease speed |
| <0 | >0 | Bad | Decrease speed |
Publisher’s Note: MDPI stays neutral with regard to jurisdictional claims in published maps and institutional affiliations. |
© 2020 by the authors. Licensee MDPI, Basel, Switzerland. This article is an open access article distributed under the terms and conditions of the Creative Commons Attribution (CC BY) license (http://creativecommons.org/licenses/by/4.0/).
Share and Cite
Quaranta, E.; Bonjean, M.; Cuvato, D.; Nicolet, C.; Dreyer, M.; Gaspoz, A.; Rey-Mermet, S.; Boulicaut, B.; Pratalata, L.; Pinelli, M.; et al. Hydropower Case Study Collection: Innovative Low Head and Ecologically Improved Turbines, Hydropower in Existing Infrastructures, Hydropeaking Reduction, Digitalization and Governing Systems. Sustainability 2020, 12, 8873. https://doi.org/10.3390/su12218873
Quaranta E, Bonjean M, Cuvato D, Nicolet C, Dreyer M, Gaspoz A, Rey-Mermet S, Boulicaut B, Pratalata L, Pinelli M, et al. Hydropower Case Study Collection: Innovative Low Head and Ecologically Improved Turbines, Hydropower in Existing Infrastructures, Hydropeaking Reduction, Digitalization and Governing Systems. Sustainability. 2020; 12(21):8873. https://doi.org/10.3390/su12218873
Chicago/Turabian StyleQuaranta, Emanuele, Manuel Bonjean, Damiano Cuvato, Christophe Nicolet, Matthieu Dreyer, Anthony Gaspoz, Samuel Rey-Mermet, Bruno Boulicaut, Luigi Pratalata, Marco Pinelli, and et al. 2020. "Hydropower Case Study Collection: Innovative Low Head and Ecologically Improved Turbines, Hydropower in Existing Infrastructures, Hydropeaking Reduction, Digitalization and Governing Systems" Sustainability 12, no. 21: 8873. https://doi.org/10.3390/su12218873
APA StyleQuaranta, E., Bonjean, M., Cuvato, D., Nicolet, C., Dreyer, M., Gaspoz, A., Rey-Mermet, S., Boulicaut, B., Pratalata, L., Pinelli, M., Tomaselli, G., Pinamonti, P., Pichler, R., Turin, P., Turrin, D., Foust, J., Trumbo, B., Ahmann, M., Modersitzki, M., ... Bragato, N. (2020). Hydropower Case Study Collection: Innovative Low Head and Ecologically Improved Turbines, Hydropower in Existing Infrastructures, Hydropeaking Reduction, Digitalization and Governing Systems. Sustainability, 12(21), 8873. https://doi.org/10.3390/su12218873