Article

Spray Backstop: A Method to Reduce Orchard Spray Drift Potential without Limiting the Spray and Air Delivery

by
Alireza Pourreza
1,*,
Ali Moghimi
1,
Franz J. A. Niederholzer
2,
Peter A. Larbi
1,3,
German Zuniga-Ramirez
1,
Kyle H. Cheung
1 and
Farzaneh Khorsandi
1
1
Department of Biological and Agricultural Engineering, University of California, Davis, One Shields Ave, Davis, CA 95616, USA
2
University of California Cooperative Extension, 142 Garden Hwy A, Yuba City, CA 95991, USA
3
Division of Agriculture and Natural Resources—Kearney Agricultural Research and Extension Center, University of California, 9240 S. Riverbend Avenue, Parlier, CA 93648, USA
*
Author to whom correspondence should be addressed.
Sustainability 2020, 12(21), 8862; https://doi.org/10.3390/su12218862
Submission received: 14 September 2020 / Revised: 15 October 2020 / Accepted: 21 October 2020 / Published: 26 October 2020

Abstract

:
Unmanaged spray drift from orchard pesticide application contributes to environmental contamination and causes significant danger to farmworkers, nearby residential areas, and neighbors’ crops. Most drift control approaches do not guarantee adequate and uniform canopy spray coverage. Our goal was to develop a spray backstop system that could block drifting from the top without any negative impact on spray coverage and on-target deposition. The design included a foldable mast and a shade structure that covered the trees from the top. We used a continuous loop sampling to assess and quantify the effectiveness of spray backstop on drift potential reduction. We also collected leaf samples from different sections of trees to compare on-target deposition and coverage. The results showed that the spray backstop system could significantly (p-Value < 0.01) reduce drift potential from the top (78% on average). While we did not find any statistical difference in overall canopy deposition with and without the backstop system, we observed some improvement in treetops deposition. This experiment’s output suggests that growers may be able to adjust their air-assist sprayers for a more uniform spray coverage without concern about the off-target movement of spray droplets when they employ the spray backstop system.

Graphical Abstract

1. Introduction

Almond acreage in California has increased to over 1,390,000 acres in the last few years, with Nonpareil remaining the most common variety [1]. Each bearing acre receives at least 4–6 pesticide applications per year to protect the crop and trees from insect, mite, and disease damage. Air-blast sprayers using axial or centrifugal fans to deliver pesticides entrained in diverging air jets are commonly used to apply pesticides [2]. While vigorous unpruned canopies have become more common, challenging uniform spray delivery and pest control, some of the pesticide tools available to growers have also changed. There has been a shift away from the broad-spectrum contact materials to formulations targeting eggs and juvenile life stages of target pests that require excellent coverage to deliver effective control. Obtaining full spray coverage in almond trees is challenging due to their height and dense canopy structure [3]. Li et al. [4] showed that a ground application (bottom-up spray) delivered more spray residue to the lower canopy, while the middle canopy and treetops received inadequate coverage. Siegel et al. [5] reported that insecticide efficacy at 4–4.8 m above ground was 50% less in comparison to lower canopy in an almond orchard. To have a uniform deposition, especially in the treetops, it is regular practice to use nozzles that create smaller droplets (volume median diameter (VMD) of 150–200 microns based on ASABE, S-572.1). However, the excessive airflow and small droplet size required to deliver the spray to the treetops also increase the potential for off-site movement of pesticides through the air [6], which is defined as exo-drift [7]. Spray drift is potentially harmful to human health as well as to ecosystems and wildlife near the agricultural fields. Additionally, unmanaged spray drift may contribute to increased regulation of pest control activities. Therefore, controlling spray drift is a high priority for growers.
California has the strictest pesticide laws and regulations in the United States. Pesticide application is tightly controlled, especially near (but not limited to) schools, playgrounds, hospitals, and residential areas. The California Department of Pesticide Regulation (C.D.P.R.) prohibits spraying pesticides within a quarter-mile (402 m) of school sites, including schools and daycare facilities, on weekdays between 6 AM and 6 PM [8]. Growers are required to notify public K-12 schools, child daycare facilities, and county agricultural commissioners (C.A.C.s) when particular pesticides will be applied in the coming year and also a few days before the applications [8]. Although pesticide sales and application are strongly controlled in California, many of agriculture’s urban neighbors consider these controls inadequate. Primary concerns are about toxic chemicals and the availability of timely notification regarding the type of chemicals and time of spraying [9]. The notification might be helpful, but it does not solve the problem, since it just moves the protection responsibility to parents and school staff [10].
Conventional practices for reducing spray drift in orchards include selecting the appropriate type of nozzle, proper sprayer setting, calibration and operation, defining shelterbelts and buffer zones, and modified application practices in the downwind rows. These methods might be useful in reducing off-target movement to sensitive areas, but they are usually in contrast with techniques that generate significant on-target deposition [6]. For instance, using nozzles that generate larger droplets led to drift reduction in almond orchard spray application but also decreased effectiveness at the upper parts of the canopy [3]. Another experiment in an apple orchard showed that medium-size spray (VMD = 237 μm) generated less drift compared to fine spray (VMD = 198 μm) droplets [11]. Similarly, reducing airflow rate significantly reduced drift; however, it decreased mean target deposition in zones located farther away from the sprayer [12], e.g., treetops. Slower ground speed [13,14] and higher liquid flow rate [15] may decrease drift as well, but the impact is not significant.
An essential step in evaluating spray drift and deposition is selecting the sampling technique. A spray sampler should be capable of intercepting and retaining droplets [16]. Salyani [17] assessed different sampling techniques, such as artificial and natural sampling targets, metallic and fluorescent tracers, colorimetric, and fluorometric tracers for their capabilities and limitations in drift measurement. Fluorometry and the use of trees’ leaves as spray targets presented a reliable, affordable, and natural method for spray deposition assessment. Using a continuous loop extended above and on the sides of tree canopies and also on the orchard floor is a standard method to capture the off-target movement of spray droplets [18]. Ribbons, tapes, and strings are commonly used as passive samplers in the continuous loop method. Salyani [19] showed that both cotton ribbon and polyester string are good targets for capturing drift, while the cotton ribbon (25.4 mm wide) could capture 2.3 times less spray droplets compared to polyester string (2 mm diameter).
In a different approach, Gil et al. [20] used a general-purpose Light Detection and Ranging (LiDAR) system to measure the quantity of spray droplets escaping from the canopy. In this method, a stationary LiDAR device collected 40 s of point cloud data from a single plane (perpendicular to the row), starting 20 s before the sprayer reached the LiDAR location and continuing for another 20 s after the sprayer passed. The results indicated a good correlation between drifts measured by LiDAR and a test bench method when droplets were small, or airflow was low. However, the authors found that LiDAR could not accurately detect drift when the sprayer generated high airflow or large droplets.
In this project, a sprayer attachment system (termed a “Spray Backstop”) is developed and tested in an 11th leaf (i.e., planted 11 years ago, but the trees are at least one year older) almond orchard. The backstop system includes a foldable mast and a screen structure that covers the trees and blocks the spray droplets that are escaping the trees from top or sides. We hypothesize that using a spray backstop system will allow growers to continue to adjust sprayers with more air and fine droplets that improve spray deposition in the hard-to-reach upper canopy area, while effectively reducing drift potential. The specific objectives of this study are to determine the spray cloud pattern; to design and fabricate the Spray Backstop mechanism; and to assess and quantify the impact of spray backstop on reducing drift potential and improving on-target deposition.

2. Materials and Methods

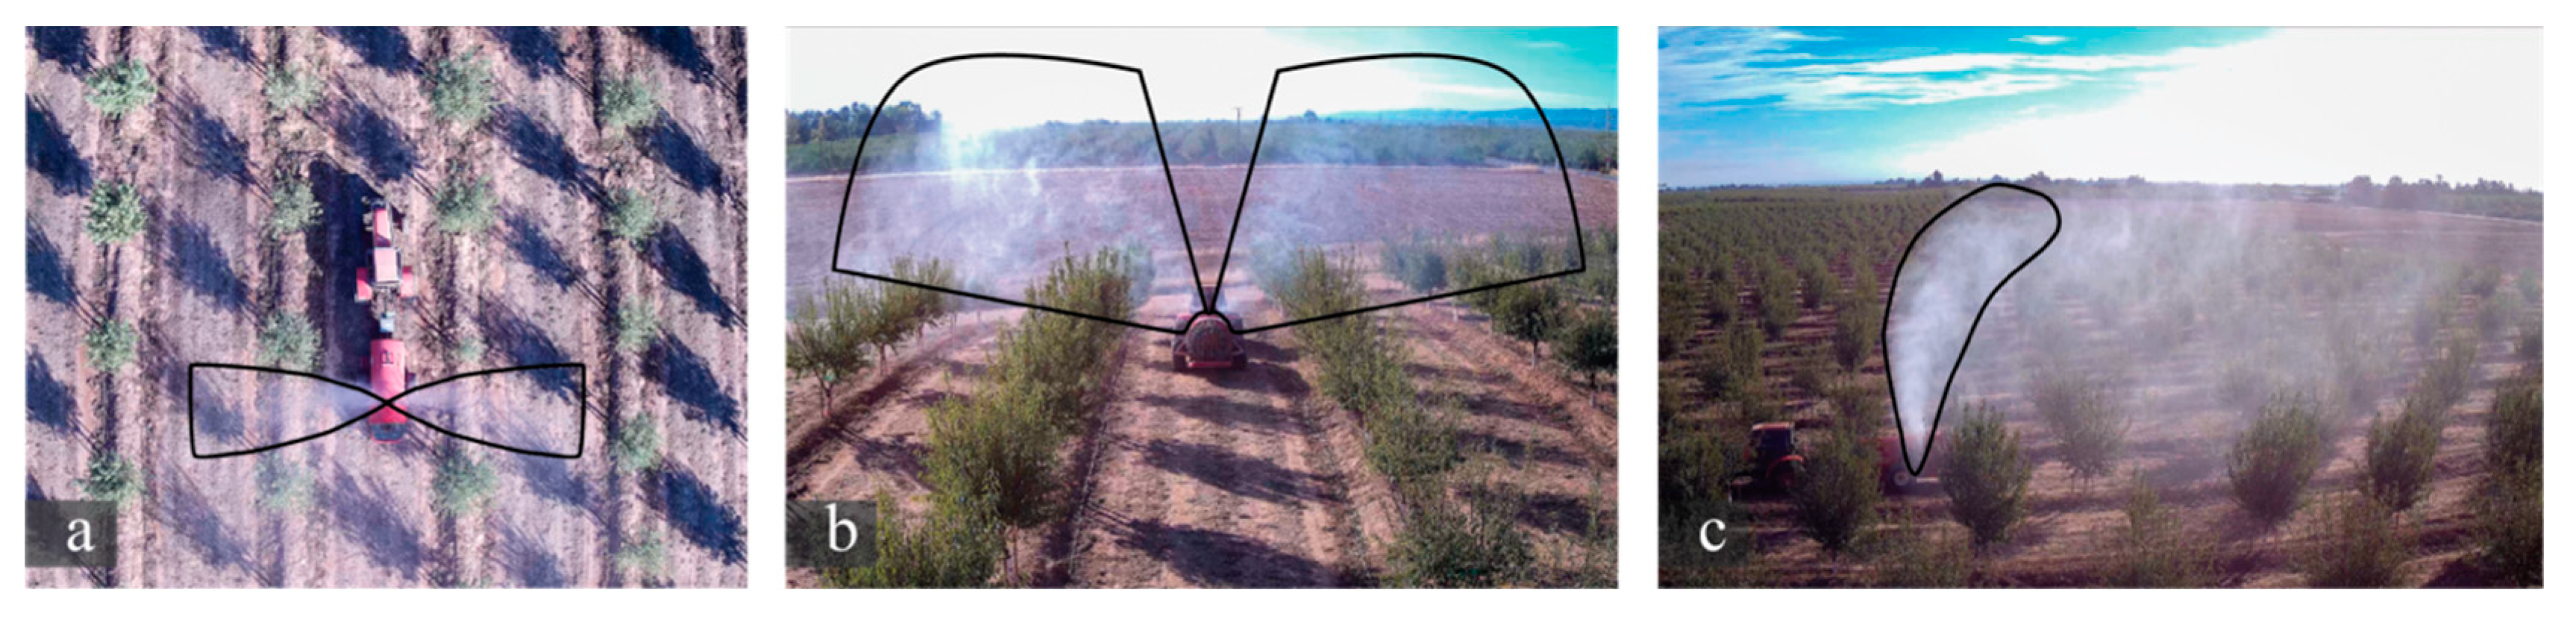
2.1. Aerial Monitoring

We used unmanned aerial systems (a DJI MATRICE 210 equipped with DJI ZENMUSE 2 thermal/RGB camera, and a MAVIC 2 PRO) to capture thermal and visible images and videos of the spray cloud pattern from several angles to the sprayer. We used the photos and videos to observe the movement of the spray cloud and quantify its dimensions. During the on-site test of the backstop, we also employed aerial imaging to monitor the spray cloud and how the backstop system blocked the droplets above the trees from moving upward and potentially becoming drift.

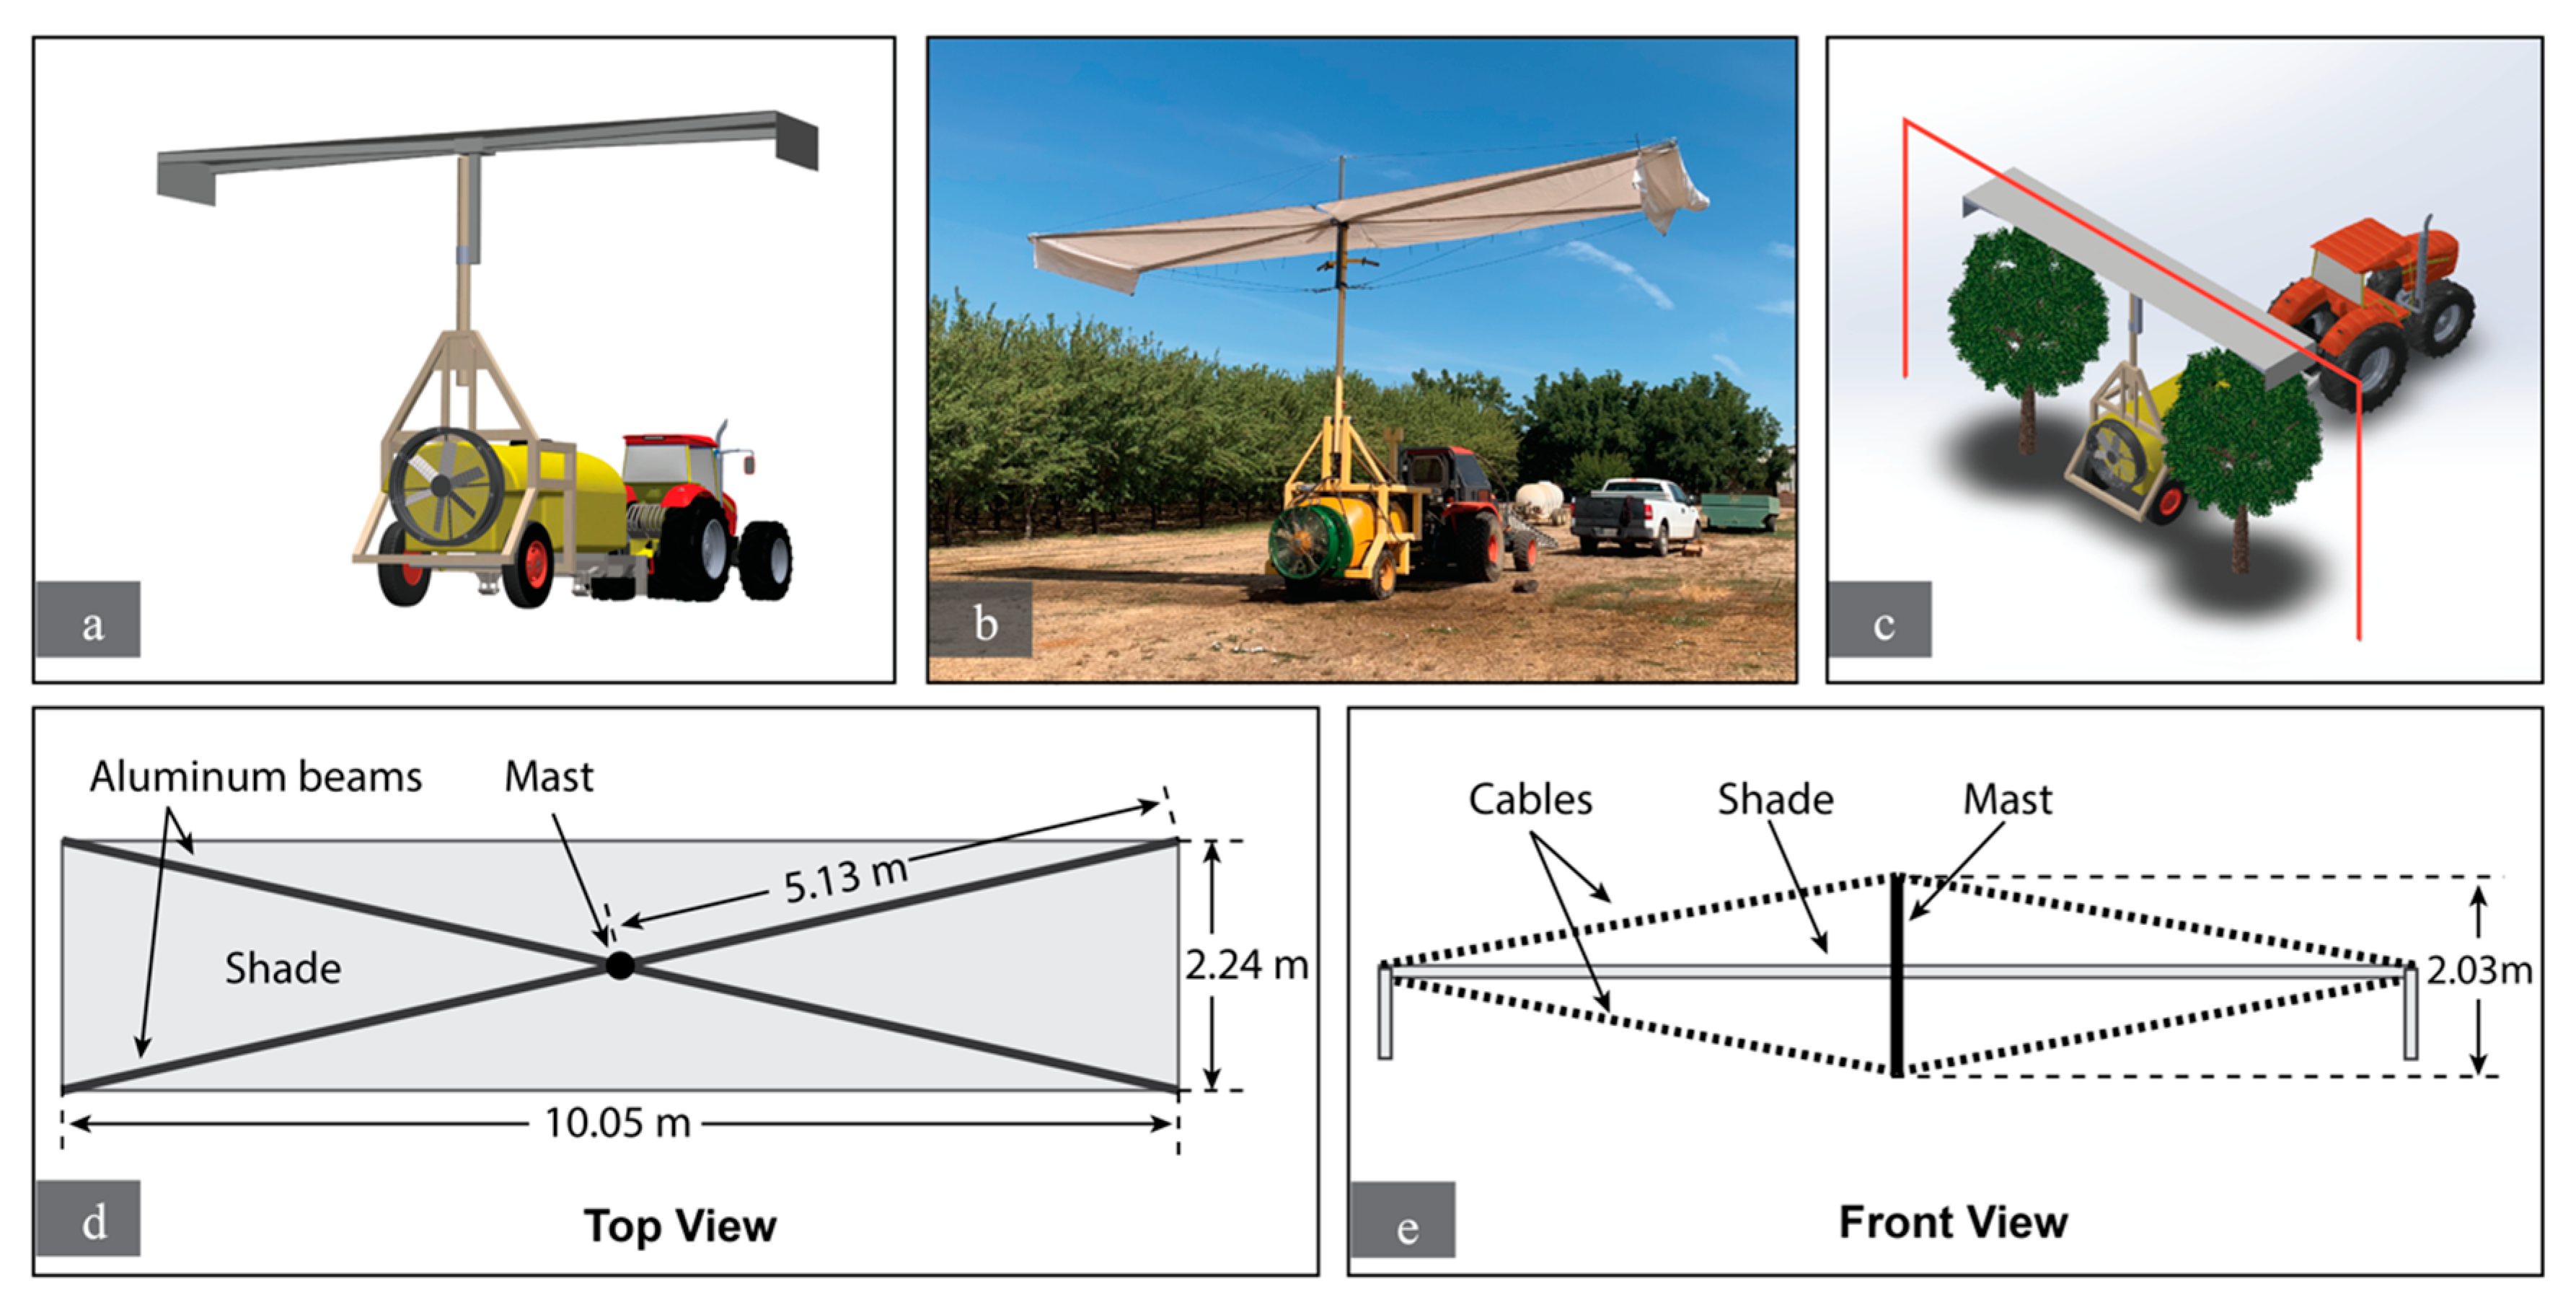
2.2. Design and Fabrication of the Spray Backstop

The backstop structure aimed to cover trees from the top on both sides of the sprayer. Figure 1a shows the design of the backstop system, which included a secure frame structure mounted on the sprayer chassis to hold a foldable hydraulic-powered mast that was used for raising and lowering the shade structure. The frame structure and mast in Figure 1b were previously constructed for a tower spray application [21] and were readily available for this project. The frame included a rest platform, so the fully lowered mast could lean on it. The frame also had a break stop at the pivot point to keep the mast in an upright position. When fully raised, the mast could lift the backstop 5.5 m (18 ft) above ground.
We developed a shade structure that included four aluminum square beams (16 cm2/2.5 in2) each 5-m (16.4 ft) long with 2.16 mm (0.08 in) thickness. The beams were inserted in an x-shaped structure mounted on the mast and firmly fixed using bolts (Figure 1d). The insertion depth and bolt spacing were designed to ensure the locations of the bolts were appropriately distanced so they could handle the loads without slipping, and they were far enough from the critical cross-section. Two tarps (Kotap America Ltd.), with 8 mm thickness and 12 × 12 weave, were attached to the shade structure to block the spray cloud escaping from the top on both sides of the sprayer. We used the grommets located at 18-inch intervals on the edge of the tarp for tying it to the shade structure. The width and total length of the shade structure were 2.24 m (7.35 ft) and 10.05 m (32.97 ft), respectively (Figure 1d). We used two cables for each beam (one from the top and the other from the bottom of the tarp) that connected their end side to the mast to reduce deflection at the end of each beam (Figure 1e). The cables were tensioned using turnbuckles to put the beams into compression. The total weight of the structure attached to the mask was about 86 kg (~190 pounds).

2.3. Test Conditions
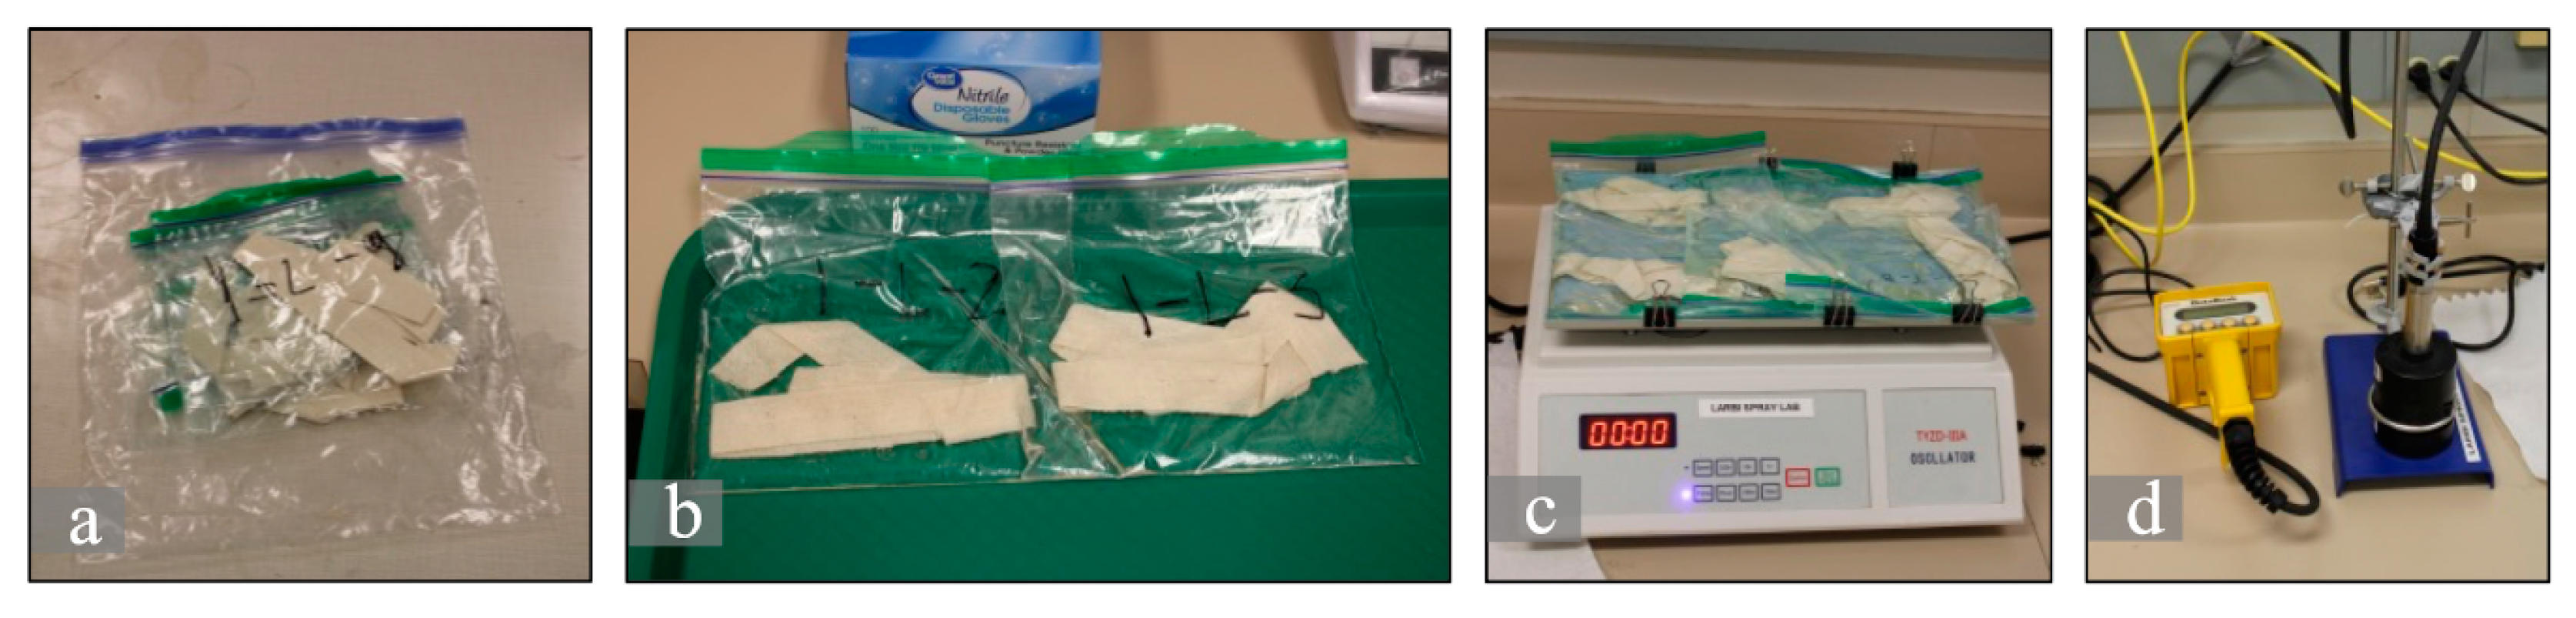
The orchard used for this experiment included 11th leaf almonds planted in 2009 (Lovell peach seedling) and located at the Nickels Soil Lab (Arbuckle, CA, USA). The trees were approximately 5–6 m (16–20 ft) tall. An axial fan (diameter: 81.3 cm/32 in) air blast O.M.A. sprayer (Model TR1500, O.M.A., Bologna, Italy) equipped with the backstop system was attached to a Kubota M108 (Kubota Tractor Corporation, Grapevine, TX, USA) (Figure 1b). The sprayer included an axial fan and fluid pump driven by the tractor P.T.O. and a tank with 1514 L (400 gallons) capacity. The forward speed was at 3.2 Km/h (2 m/h) north to south, and the sprayer’s system pressure was adjusted at 11 bar (160 psi). Four hollow cone nozzles (Spray Systems TXR80049VK Conejet®, Springfield, IL, USA) were used at each side of the sprayer. The spray nozzle volume was calculated at 3.67 L/min (0.97 gallons per minute) per nozzle, and 14.68 L/min (3.88 GPM) per side of the sprayer. The application rate was calculated at 896.2 L/ha (95.8 gallons per acre). Air temperature at the time of the experiment was recorded at 22 °C with 30% relative humidity. Wind speed varied between 0 and 6 MPH (N.W. direction) during the experiment.

2.4. Sampling

A continuous loop sampling method [15] was used to precisely assess the spray backstop performance in reducing the drift potential. A mix of fluorescent dye (8-Hydroxy-1,3,6-pyrenetrisulfonic Acid Trisodium Salt, Spectrum Chemicals & Laboratory Products, New Brunswick, NJ, USA) and water (approximately 54 g of tracer with 492.1 L/130 gallons of water) was used for spraying. Cotton ribbons (2.54 cm/1 in width) were stretched around trees on top and sides of the target trees, as shown in Figure 1c. Two telescopic extension poles (7.3 m, 24 ft) were used to hold the top corners of the ribbon sampling loop. Cotton ribbon samples were collected 1 min after the sprayer passed the ribbon; they were cut into 60 cm pieces. We conducted two spray passes for this experiment, one with backstop and one without backstop. We performed multiple ribbon samplings in each pass; the sprayer stopped after each ribbon sampling and waited until we prepared the next ribbon sampling setup (about 20 min). The orchard orientation was north-south. First, we completed the pass with backstop in the west row, and then we conducted the second pass without backstop three rows east of the first pass. We included two unsprayed rows between the two spray passes to ensure spray droplets from one pass did not deposit on trees from the other pass. Both passes were in the same direction (north to south). In addition, we conducted a preliminary test to examine the impact of spray backstop on tree coverage and leaf deposition. We collected leaf samples from trees on both sides of the row about 10 min after every spraying test. Each canopy was divided into six sections: three heights (top, middle, bottom) and two sides (closer to the sprayer, and the side farther away in the next row); leaf samples were collected from each section separately. The ribbon and leaf samples were placed in pre-labeled bags, kept in a cooler, and transported to the Agricultural Application Engineering Lab at the Kearney Agricultural Research and Extension Center (Parlier, CA, USA) for assessment of fluorescent dye deposition. The samples were stored in a refrigerator until they were analyzed.

2.5. Fluorometry and Analytics

Samples were analyzed by fluorometry technique (Figure 2): 40–100 g of de-ionized water was added to each sample bag and shaken for 30 min on an oscillator. Additional dilutions were done as needed before fluorescence readings (raw fluorescence units unblanked, R.F.U.B.) were taken using a fluorometry system as described by [22]. The readings were first converted to dye concentration based on a calibration curve and then converted to dye deposition. The total leaf area of each leaf sample was measured using a leaf area meter (LI-3000C Portable Area Meter with LI-3050C Transparent Belt Conveyor Accessory, LI-COR, Inc., Lincoln, NE, USA).

2.6. Statistical Analysis of Dye Composition

We performed a one-way analysis of variance (ANOVA) with a significance level of 0.01 to assess the impact of the spray backstop on drift potential and on-target deposition. In total, 204 ribbon samples were analyzed for dye deposition, including 108 samples from the top and 48 samples from each side of the sprayer. Half of the samples were collected when the backstop system was used, and the other half were collected when no backstop system was in place. The difference in means of dye deposition on ribbon samples with and without the backstop was evaluated to determine if the proposed method can significantly reduce drift potential. The tests were conducted separately for the left, top, and right sides of the sprayer. Statistical analysis was performed in Python 3.7.3 using the SciPy library (version 1.4.1). A total number of 120 leaf samples were collected from six different sections of trees on either side of the row. On average, five leaf-samples, collected from similar sections of several trees on the same side of the row, were placed in a bag and combined as one sample for fluorometry assay. The means of dye deposition on leaves with and without backstop were compared to determine if using spray backstop has a significant impact on canopy deposition.

3. Results and Discussion

3.1. Aerial Observation

We used aerial imagery to monitor a spray application at 3.2 km/h (2 MPH) in a young almond orchard and to determine the movement pattern of the spray cloud. Figure 3 shows aerial photos captured from three different views toward the sprayer. We estimated the dimensions of the spray cloud passing the treetops from the aerial photos and used them to design a shade structure that could block the movement of droplets beyond treetop, as shown in Figure 3.
We also used aerial imagery for monitoring the efficiency of the backstop prototype in blocking the spray cloud. Figure 4 shows aerial views of spraying with and without the backstop prototype. Spray cloud could lift the ribbon from its rest position when the backstop system was not used (compare Figure 4a,b). The ribbon, however, remained in its rest position while the sprayer, equipped with the backstop system, was passing under (Figure 4c). A comparison between Figure 4b,c shows that the backstop system could effectively block the spray cloud, so the ribbon did not change position. This observation was validated by the fluorometry analysis of dye deposition on the ribbons.

3.2. Statistical Results

The analysis of dye deposition on the ribbon samples demonstrated a considerable reduction in drift potential, mainly from the top of the trees. We compared means of dye deposition on ribbon samples with and without the backstop system by a one-way ANOVA test. The p-value obtained from the ANOVA test (Table 1) demonstrated that the spray backstop system could significantly reduce spray deposition on ribbon samples located on the top and right side (p-value < 0.01) of the sprayer. These results suggest that the spray backstop system successfully blocked the spray cloud from escaping from the top of the canopy; that was the primary goal of this study. However, there was not enough evidence to make the same conclusion for the ribbon samples located on the left side of the sprayer. Extra movement of spray cloud from sides can be considered as an off-target drift only when the border rows are sprayed while most of the droplets escaping from the top will travel further, may land off-target, and can present a much greater threat.
The comparison of means of dye deposition on leaf samples illustrated no significant change in overall canopy deposition when the backstop system was used. It can be concluded that the backstop system presents the potential for a new drift control approach that does not limit on-target deposition. The details of dye deposition (µg/cm) on ribbons and leaves are provided in Table A1 and Table A2 (Appendix A).

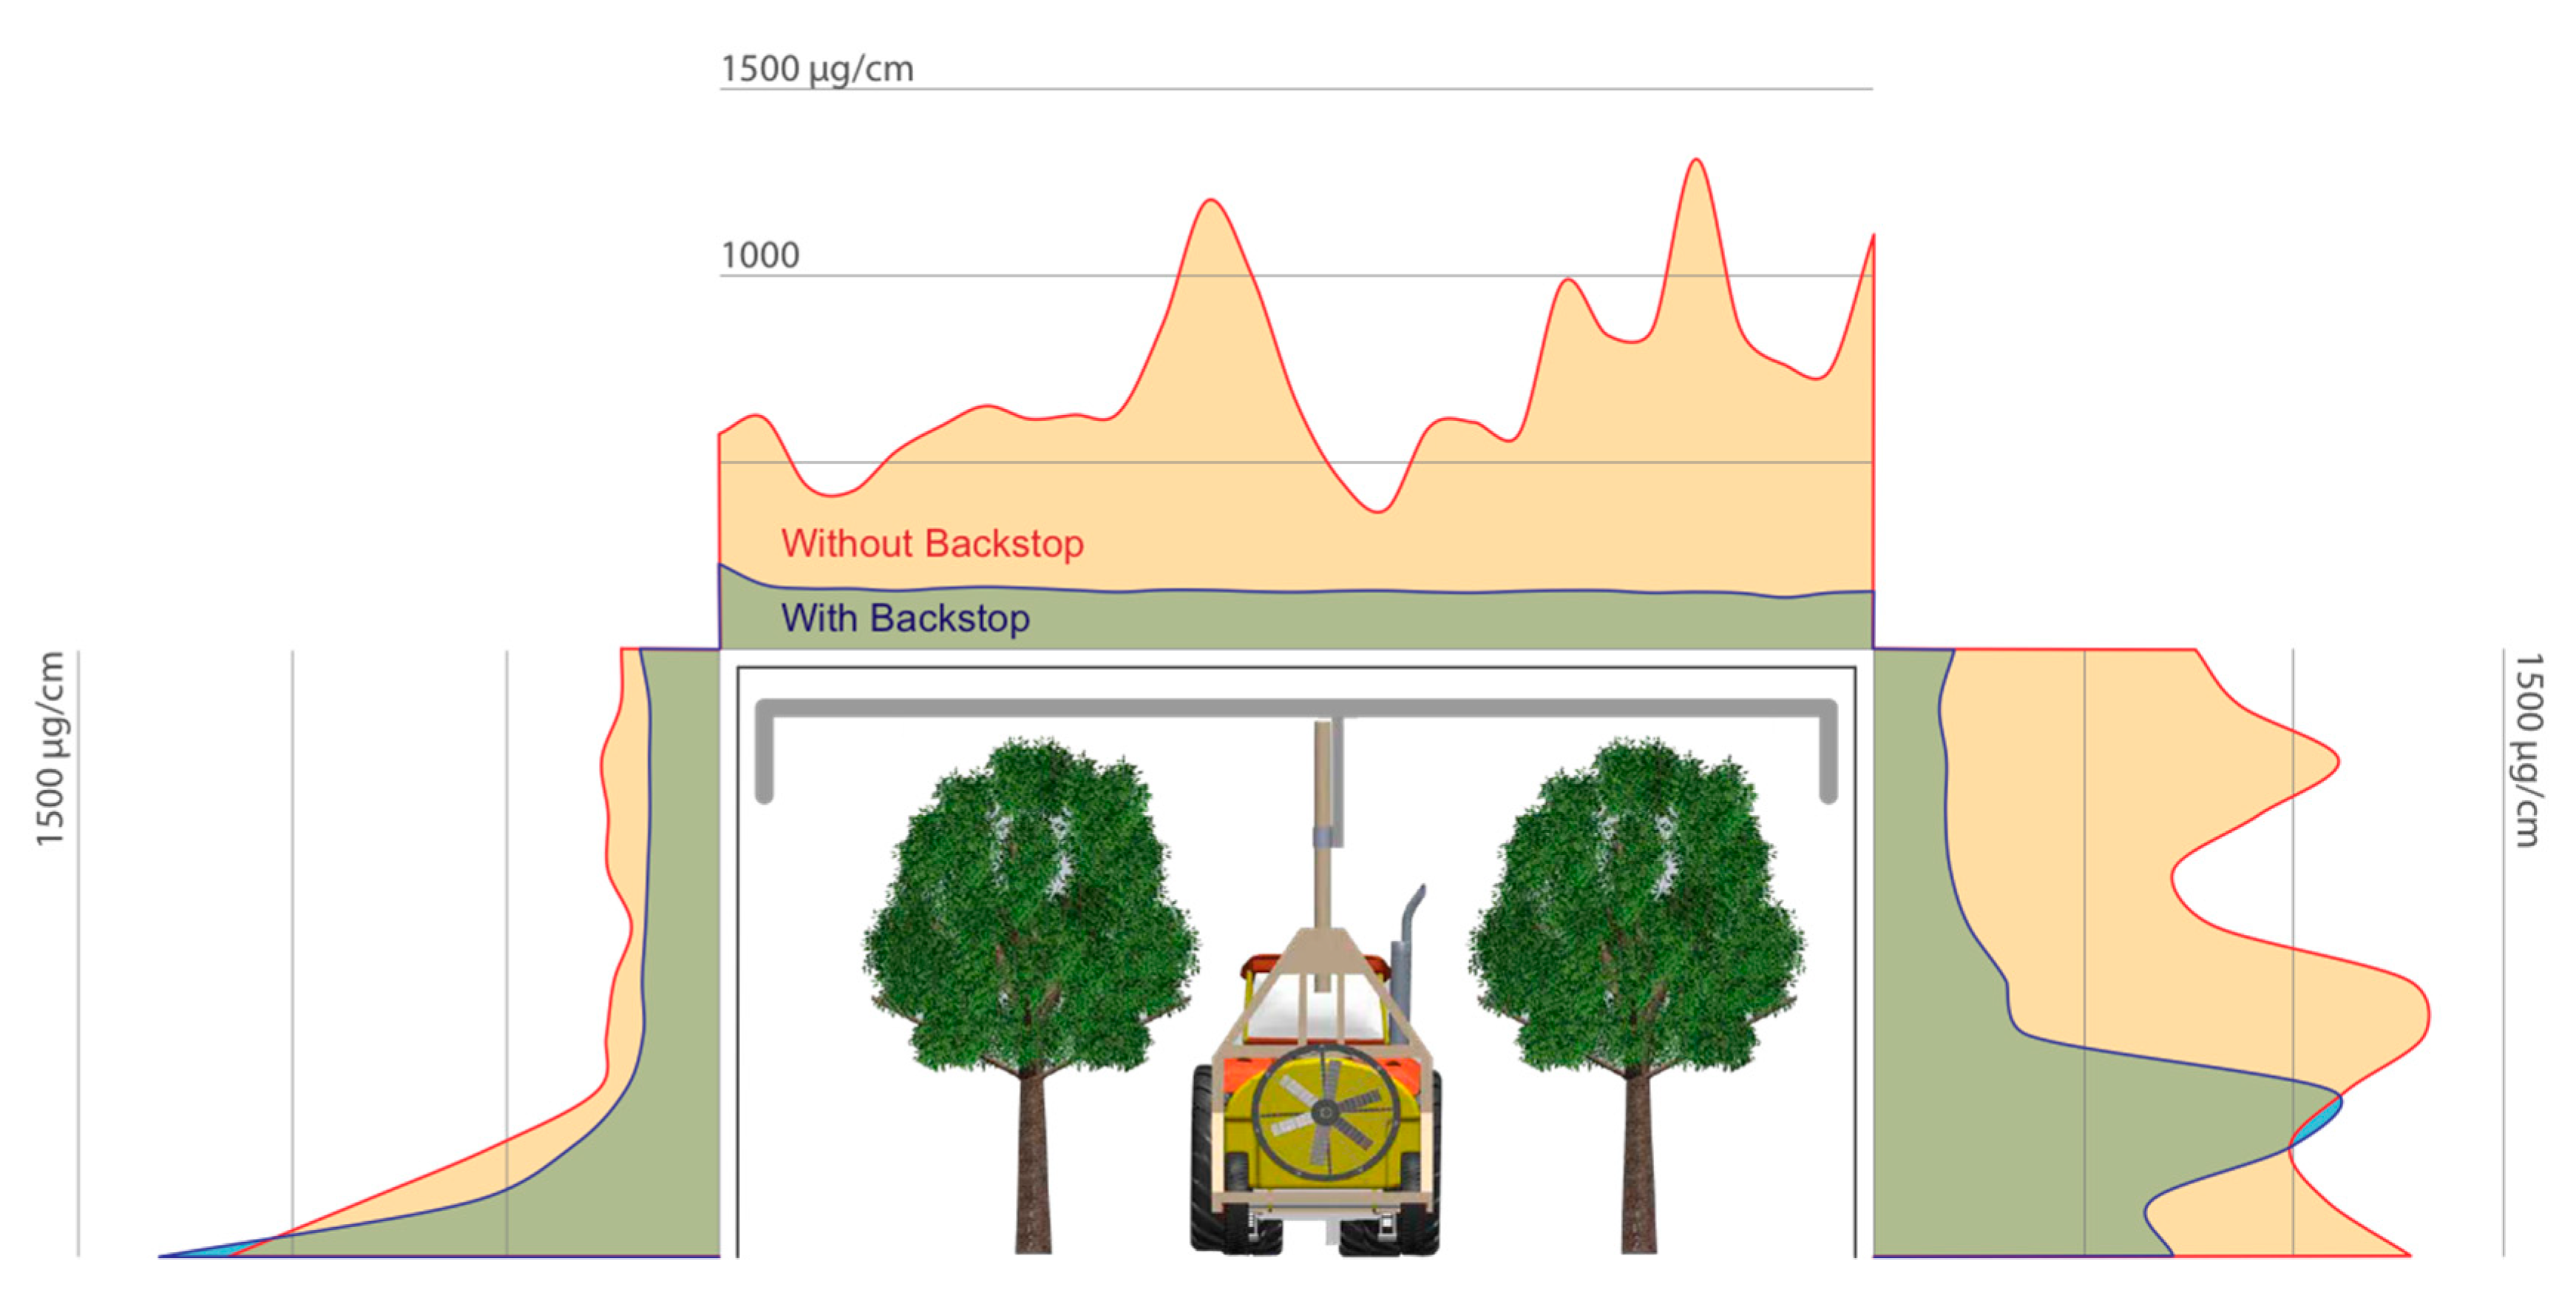
3.3. Drift Potential Pattern

Figure 5 shows the pattern of dye deposition on the ribbon with and without the backstop system. The ribbon samples were analyzed separately to determine the ribbon deposition pattern on top and sides. On average, 78% less dye was deposited on the top ribbon when the spray backstop was used. Deposition on the side ribbons also decreased by 47% (26% reduction on the left and 58% reduction on the right) when the backstop system was used.
The pattern of dye deposition on ribbon indicated more spray delivery in the right and top-right side of the sprayer; this was particularly obvious in the deposition pattern when no backstop was in place. The differences were partially due to the rotation direction of the fan. Most sprayers, especially axial flow systems with low-cost air shaping designs, generate asymmetrical airflow due to the typically clockwise rotation of their fan. The smaller airflow on the left side prevented the spray droplets from traveling far, passing the canopy, and depositing on the left ribbon. Another reason might be the possibility of inconsistent canopy sizes and foliage densities on the two sides of the row. Additionally, the wheatear data showed north-west wind at the time of the experiment that might have contributed to the deposition imbalance on the two sides of the sprayer.

3.4. Treetop Deposition

Figure 6 illustrates dye deposition on leaves sampled from the top third of the trees in the near and far sides of the trees. Although the overall canopy deposition did not significantly change by using the backstop system, an improvement of 9% better deposition on leaves located at treetops was observed. More percent improvements were spotted on the far parts of the trees, although in general, there was less deposition on far sides compared to near sides. The bracket shape of the shade structure might have helped to push droplets back down to the canopy, and particularly on the top-far sections. Since the backstop could effectively block the escaping droplets, sprayers can be calibrated for more air and finer droplets to improve on-target deposition, particularly on treetops, with no concern of drifting.
Using spray backstop, we could cut a significant amount of drift potential and improve deposition on the upper canopy at the same time. This is a substantial improvement in a win-win drift-reducing strategy compared to other drift-reducing approaches. For example, Markle et al. [3] evaluated two alternative applications strategies for reducing drift in almond spraying. Their results showed that using the Inward Only or the Gear Up/Throttle Down (GUTD) strategies could generate 38% and 51% less drift, respectively, compared to conventional treatment. However, both of these drift-reducing strategies resulted in lower deposition on the upper canopy (4.88 m above ground), which might diminish its voluntary utilization by growers. The effectiveness of spray backstop in reducing drift potential and offering a promising on-target deposition would increase the chance of implementation by growers.

3.5. Limitations and Potential Improvements

The results presented in this paper prove that the spray backstop system could significantly reduce airborne drift potential; however, some possible downsides of the system should be noted. The hydraulic-powered mast used in this research was limited to a fixed height and cannot be tested in mature orchards with tall canopies. A variable height mast (e.g., telescopic system) would be a better alternative for the current design, since its height can be adjusted for different orchard systems. Although this prototype showed acceptable stability during tests, working on an orchard with sloping and rough ground might be challenging. Further support for the mast structure would minimize the risk of system instability. The shade structure moves above the trees, where overhead wires or other obstructions may exist. In-advance inspection is required to identify the orchard’s maximum height and to prevent engagement with wires/obstructions. Chemical droplets accumulate on the shade structure, so proper safety precautions should be implemented for disassembling, transportation, and storage of the backstop system, similar to the sprayer itself. Water-resistant fabric for the shade may prevent the accumulation of chemicals below the shade; also, it may help to change the moving direction of the spray cloud back to the canopy.

4. Conclusions

A spray backstop prototype was developed and tested in a young almond orchard, and its effectiveness in reducing drift potential was evaluated. Our primary goal in this project was to craft a backstop prototype for young trees where the scale of the backstop structure could be kept small and to assess its effectiveness in reducing the movement of spray droplets beyond treetop. The movement of spray cloud in an almond orchard was monitored by an unmanned aerial system (UAS), and the optimum dimensions of a screen that could block the spray cloud above the canopy were estimated from the aerial imagery. A foldable mast was equipped with a shade structure and mounted on an air-assist sprayer. A dye solution was used as spray material; the movement of spray droplets beyond treetops was quantified by continuous loop sampling technique, while on-target deposition on tree canopy was quantified by leaf sampling. The results show strong proof of the concept that spray backstop can significantly reduce airborne drift potential. Additionally, using the spray backstop system does not change overall canopy deposition, while it potentially helps to improve deposition on treetops. Further data are required to assess on-target deposition for different applications. The addition of the backstop system to the orchard spray application routine will improve the environmental aspect of orchard production by reducing off-target contamination. Since the backstop system blocks the spray cloud above the trees, the sprayer can be adjusted for finer droplets and more air that will potentially improve deposition on top sections of canopy that would otherwise receive poor spray converge. A uniform spray deposition will reduce the chance of yield loss due to pests and disease. Spray backstop can address the significant public concern about pesticide applications around schools and residential areas. This system can also protect the beneficial insects, parasites or predators, livestock, and other crops, by improving spray deposition while minimizing off-site movement of chemicals. We conclude that the findings of this study present the significance of the proposed system in decreasing spray drift potential in almond and other similar tree crops.

Author Contributions

Conceptualization, A.P.; methodology, A.P. and A.M.; formal analysis, A.P. and A.M.; data curation, P.A.L. and G.Z.-R.; writing—original draft preparation, A.P.; writing—review and editing, A.M., F.J.A.N., F.K. and P.A.L.; visualization, A.P.; supervision, A.P.; project administration, A.M., K.H.C. and F.J.A.N.; funding acquisition, A.P., F.J.A.N. and F.K. All authors have read and agreed to the published version of the manuscript.

Funding

This research was funded by The Almond Board of California, grant number WATER11.

Acknowledgments

We thank the Almond Board of California for financially supporting this research. We also thank Ken Giles for providing technical recommendations, Jedediah Roach for the fabrication of the system, and Bruno Batista and Mario Salinas for their help during the field and lab experiments.

Conflicts of Interest

The authors declare no conflict of interest. The funders had no role in the design of the study; in the collection, analyses, or interpretation of data; in the writing of the manuscript, or in the decision to publish the results.

Appendix A

Table A1. The average dye deposition (µg/cm) on ribbons at the left, top, and right sides of the sprayer.
LeftTopRight
With Backstop318159437
No Backstop3977211019
Table A2. The average dye deposition (µg/cm2) at different parts of the trees on both sides of the sprayer.
Left RowRight Row
Far SideNear SideNear SideFar Side
BS *No BSBSNo BSBSNo BSBSNo BS
Top31724372970911341063253213
Middle3793681031154811581091192154
Bottom2154208711523521772120131
* BS: Backstop.

References

  1. CDFA. 2018 California Almond Acreage Report; California Department of Food and Agriculture: Sacramento, CA, USA, 2019. [Google Scholar]
  2. Fox, R.D.; Derksen, R.C.; Zhu, H.; Brazee, R.D.; Svensson, S.A. A history of air-blast sprayer development and future prospects. Trans. ASABE 2008, 51, 405–410. [Google Scholar] [CrossRef]
  3. Markle, J.C.; Niederholzer, F.J.A.; Zalom, F.G. Evaluation of spray application methods for navel orangeworm control in almonds. Pest Manag. Sci. 2016, 72, 2339–2346. [Google Scholar] [CrossRef] [PubMed]
  4. Li, X.; Giles, D.K.; Niederholzer, F.J.; Andaloro, J.T.; Lang, E.B.; Watson, L.J. Evaluation of an Unmanned Aerial Vehicle as a New Method of Pesticide Application for Almond Crop Protection. Pest Manag. Sci. 2020. [Google Scholar] [CrossRef] [PubMed]
  5. Siegel, J.P.; Strmiska, M.M.; Niederholzer, F.J.; Giles, D.K.; Walse, S.S. Evaluating insecticide coverage in almond and pistachio for control of navel orangeworm (Amyelois transitella) (Lepidoptera: Pyralidae). Pest Manag. Sci. 2019, 75, 1435–1442. [Google Scholar] [CrossRef] [PubMed]
  6. Fox, R.; Derksen, R.; Brazee, R. Drift from spraying orchards. In International Society of Citriculture Proceedings; US Department of Agriculture, Agricultural Research Service: Washington DC, USA, 2000. [Google Scholar]
  7. Matthews, G. Pesticide Application Methods; John Wiley & Sons: Hoboken, NJ, USA, 2008. [Google Scholar]
  8. Department of Pesticide Regulation (DPR). DPR 16-004 Pesticide Use Near Schoolsites Regulation; California Department of Pesticide Regulation, Ed.; California Department of Pesticide Regulation: Sacramento, CA, USA, 2016. [Google Scholar]
  9. Department of Pesticide Regulation (DPR). A Guide to Pesticide Regulation in California—Update, 2017 Regulation; California Department of Pesticide Regulation, Ed.; California Department of Pesticide Regulation: Sacramento, CA, USA, 2017. [Google Scholar]
  10. Benko, K. People need to know! Notification and the regulation of pesticide use near public schools in California. Environ. Plan. E Nat. Space 2020, 3, 164–185. [Google Scholar] [CrossRef]
  11. Cross, J.; Walklate, P.; Murray, R.; Richardson, G. Spray deposits and losses in different sized apple trees from an axial fan orchard sprayer: 2. Effects of spray quality. Crop Prot. 2001, 20, 333–343. [Google Scholar] [CrossRef]
  12. Cross, J.; Walklate, P.; Murray, R.; Richardson, G. Spray deposits and losses in different sized apple trees from an axial fan orchard sprayer: 3. Effects of air volumetric flow rate. Crop Prot. 2003, 22, 381–394. [Google Scholar] [CrossRef]
  13. Salyani, M.; Miller, D.R.; Farooq, M.; Sweeb, R.D. Effects of sprayer operating parameters on airborne drift from citrus air-carrier sprayers. Agric. Eng. Int. CIGR J. 2013, 15, 27–36. [Google Scholar]
  14. Lešnik, M.; Stajnko, D.; Vajs, S. Interactions between spray drift and sprayer travel speed in two different apple orchard training systems. Int. J. Environ. Sci. Technol. 2015, 12, 3017–3028. [Google Scholar] [CrossRef] [Green Version]
  15. Cross, J.; Walklate, P.; Murray, R.; Richardson, G. Spray deposits and losses in different sized apple trees from an axial fan orchard sprayer: 1. Effects of spray liquid flow rate. Crop Prot. 2001, 20, 13–30. [Google Scholar] [CrossRef]
  16. Salyani, M.; Sweeb, R.D.; Farooq, M. Comparison of string and ribbon samplers in orchard spray applications. Trans. ASABE 2006, 49, 1705–1710. [Google Scholar] [CrossRef]
  17. Salyani, M. Methodologies for assessment of spray deposition in orchard applications. In Proceedings of the 2000 ASAE Annual International Meeting, Milwaukee, WI, USA, 9–12 July 2000; pp. 1–11. [Google Scholar]
  18. Salyani, M.; Farooq, M.; Sweeb, R.D. Spray deposition and mass balance in citrus orchard applications. Trans. ASABE 2007, 50, 1963–1969. [Google Scholar] [CrossRef]
  19. Salyani, M.; Sweeb, R.D.; Farooq, M. Spray Capture Efficiencies of Ribbon and String Targets Used in Orchard Applications. In Proceedings of the 2006 ASAE Annual Meeting, Boston, MA, USA, 19–22 August 2006; p. 1. [Google Scholar]
  20. Gil, E.; Llorens, J.; Llop, J.; Fàbregas, X.; Gallart, M. Use of a terrestrial LIDAR sensor for drift detection in vineyard spraying. Sensors 2013, 13, 516–534. [Google Scholar] [CrossRef] [PubMed] [Green Version]
  21. Dasso, A.S. Design, Construction and Evaluation of an Improved Orchard Sprayer for Nut Crops; University of California: Davis, CA, USA, 2012. [Google Scholar]
  22. Larbi, P.A.; Basulto, C. Fluorometer Setup, Calibration, and Pyranine Dye Comparison for Spray Deposit Analysis. Unpublished work.
Figure 1. Spray backstop system; (a) schematic of the design of backstop prototype; (b) backstop system fabricated and installed on a sprayer in an almond orchard; (c) schematic of the continuous loop sampling setup for measurement of drift potential, ribbon (red tape) is extended above and on sides of the row; (d) top view of the shade structure and dimensions; (e) front view of the shade structure.
Sustainability 12 08862 g001
Figure 2. Stages of fluorometric analysis for cotton ribbon samples: (a) ribbon samples in bags before the examination; (b) sample bags with deionized (DI) water added; (c) samples on oscillator; (d) decanted solution being analyzed by fluorometer system.
Sustainability 12 08862 g002
Figure 3. Pattern of spray cloud from three views: (a) top view; (b) back view; (c) side view.
Sustainability 12 08862 g003
Figure 4. Aerial imagery of the sprayer passing the continuous loop sampling point. (a) Spraying without the backstop system before the sprayer reached to the sampling point: the top ribbon was in the rest position; (b) spraying without the backstop system at the sampling point: the spray cloud passed the treetops, lifted the ribbon and became drift potential; (c) spraying with the backstop system at the sampling point: the spray cloud passed the treetops but was blocked by the backstop system before reaching the ribbon; consequently, the ribbon remained in its rest position. The arrows show the north direction, the tractor travels toward the south.
Sustainability 12 08862 g004
Figure 5. Pattern of dye deposition on the sampling ribbon with and without the backstop system. The patterns were illustrated by plotting the amount of dye deposited on sections (60 cm each) of the ribbon samples that were analyzed separately by fluorometry.
Sustainability 12 08862 g005
Figure 6. Results of dye deposition on leaves located on near and far parts of the trees on both sides of the row.
Sustainability 12 08862 g006
Table 1. The one-way analysis of variance (ANOVA) with a significance level of 0.01 for experiments with and without backstop at three locations of the top, left, and right side of the spray.
Source of VariationDegrees of FreedomSum of SquaresMean SquaresF-Statisticp-Value
Deposition on the top ribbonbackstop18.54 × 1068.54 × 10673.980.000
error1061.22 × 1071.15 × 105--
Deposition on the left ribbonbackstop17.54 × 1047.54 × 1040.520.475
error466.69 × 1061.46 × 105--
Deposition on the right ribbonbackstop14.06 × 1064.06 × 10614.460.000
error461.29 × 1072.81 × 105--
Deposition on the leavesbackstop17.21 × 1047.21 × 1040.340.56
error224.61 × 1062.09 × 105--
Publisher’s Note: MDPI stays neutral with regard to jurisdictional claims in published maps and institutional affiliations.

