Abstract
Urban agglomeration is the core area of not only regional economic development and urbanization but also human–land contradiction. Based on the population–economy–society–spatial model and the pressure–state–response model, this study develops an evaluation index system for the urbanization and eco-environment of 13 urban agglomerations in China. The urbanization index and eco-environment index are determined using the coefficient of variation method. The coupled coordination of the two indices is measured with the coupled coordination model, and the influence of the indicator factors is calculated with a geographical detector. The results reveal the following: (1) The urbanization indices of the 13 urban agglomerations in China increase year by year, and the spatial distribution pattern is high in the east and low in the west. (2) The eco-environment index shows an “S-shaped” variation trend, and the spatial difference between urban agglomerations gradually decreases. (3) The coupled coordination is mainly characterized as a mild imbalance, and the spatial distribution pattern is “balance in the east and imbalance in the west”. (4) The coupled coordination degree between urbanization and eco-environment is affected by many factors. Among such factors, economic urbanization, social urbanization, spatial urbanization, and eco-environment response are the main controlling factors. The impact of population urbanization, eco-environment pressure, and eco-environment state presents a gradual increase.
1. Introduction
Since the 20th century, urbanization has played an important role in promoting global economic development and improving the living quality of human beings, so it has become an important symbol by to measure the level of social and economic development of a country [1,2]. In 2020, about 4.2 billion people in the world live in cities, accounting for 55% of the global population, and their GDP accounts for 80% of the global economy [3]. According to the prediction of the United Nations, the global urban population will account for up to 68.4% of the total by 2050 [4]. Population gathering in cities and towns has become an important trend in urbanization development. However, in the rapid urbanization and industrialization process, human activities have an increasing impact on the Earth’s surface’s natural ecosystem. Cities cover about 2% of the surface area, but consume 78% of the world’s energy and emit more than 60% of the greenhouse gases [5]. Relevant studies predict that the urban area will reach 1,210,475 km2 by 2030, doubling compared with the 652,825 km2 in 2000 [6]. The rapid expansion of urban land as well as the rapid development of urbanization increase the risks of cities, including resource shortage, environmental pollution, natural disasters, and so on. How to coordinate the relationship between urbanization and the eco-environment has become a hot spot and preface issue in the field of earth system science and sustainability science [7,8].
Joseph Eugene Stiglitz, an economist who won a Nobel prize, once pointed out that [9] “the high-tech development of the United States and the urbanization of China will be the two major events affecting the world in the 21st century.” As the largest developing country in the world, China has experienced a stage of rapid urbanization. From 1978 to 2016, the number of permanent urban residents increased from 173 million to 793 million, the urbanization rate increased from 17.92% to 57.35%, the number of cities increased from 193 to 657, and the number of megacities with a population of more than 5 million reached 13. The area of urban construction land, urban water consumption, and energy consumption increased from 6720.00 km2, 969,943 × 104 m2, and 59,447 × 104 tons in 1981 to 52,761.00 km2, 5,806,911 × 104 m2, and 436 million tons of standard coal in 2016, respectively. The rapid growth of urban construction land area and energy consumption has led to a rapid increase in the eco-environment pressure, which has seriously threatened the regional ecological security.
In 2014, to coordinate the unmatched contradiction between the development of Chinese cities and the environment’s resource carrying capacity, the CPC Central Committee issued The National New Urbanization Plan (2014–2020), and proposed to construct new urbanization with Chinese characteristics [10]. The 18th and 19th National Congress of the Communist Party of China also attached great importance to the development strategy of “the construction of ecological civilization”, and research on the coupled coordination of urbanization and eco-environment has become an important component of China’s ecological civilization construction. Urban agglomeration is not only the core area of regional economic development and the main area of urbanization, but also the gathering area of human–land contradiction [11]. As the historical development, resource endowment, industrial foundation, and economic structure conditions are different, there are large differences between China’s urban agglomerations and urbanization development level, and the eco-environment and ecological problems are more complex and diverse. Therefore, understanding the different environmental problems faced in the development process of urban agglomerations is of great significance in order for the government departments to formulate reasonable development policies and realize regional sustainable development.
Therefore, this study focuses on the key points of national policies, chooses 13 main urban agglomerations in China as the research areas, analyses the temporal and spatial distribution rules of the coupling and coupled coordination and eco-environment, and then reveals the factors influencing the spatial-temporal differentiation. The objective is to provide a basis for the decisions on urbanization construction and the eco-environment protection of China’s new urban agglomerations, as well as to realize regional sustainable development.
2. Literature Review
In the late 19th century, Howard proposed the concept of “Garden Cities” in his work Garden Cities of To-Morrow and tried to use rational planning methods to prevent and control environmental degradation in cities [12]. In 1962, Carson published Silent Spring, which describes the irreversible harm brought by industrial development to the eco-environment and thus attracted global attention [13]. A series of environmental books, such as The Blueprint for Life, The Limits to Growth, and Only One Region, highlight researchers’ concern about future global environmental degradation, the core of which is caused by excessive resource consumption and the environmental problems brought about by rapid urbanization. Therefore, the relationship between urbanization and the eco-environment has become a hot issue amongst scientists, and relevant scholars have thus carried out extensive research from different perspectives.
Existing qualitative research has enriched the theoretical basis for the study of the relationship between urbanization and the eco-environment. Register proposed the concept of eco-cities in The Development of Eco-City [14]. Howard described garden cities as cities that are aligned with the interests of cities and nations and are capable of balancing the needs of individuals and communities [12]. Grossman and Krueger proposed the environmental Kuznets curve (EKC) theory; using econometric methods and taking 42 developed countries as research objects, they found that environmental pollution is the most severe in the early stage of economic growth and that the trend of environmental degradation slows down with the continuous growth of the economy [15]. Fang constructed a theoretical analysis framework and a technical path for the interactive coupling between urbanization and the eco-environment [16]. Cai et al. proposed the idea of extending the study on a single large city to a study on the urban scale [17].
In the process of empirical research, relevant scholars have applied a variety of methods to the quantitative research on urbanization and the eco-environment. Schneider et al. used MO-DIS 500-M data to draw a regional map of the relationship between global urbanization and the environment [18]. McClintock et al. analyzed the unbalanced value of urban agriculture, ecological agriculture, and social reproduction [19]. Singh et al. used a single-window algorithm, land use change map, and normalized difference index evaluation of vegetation coverage to access the urban eco-environment through satellite thermal data and field investigation [20]. Kong et al. simulated the influence of the construction of a new satellite city and ecological sensitivity on land use change by combining a multiagent system with cellular automata [21]. Lu et al. used a backpropagation artificial neural network to study the response of eco-environment pressure to urbanization development and found a negative correlation between the urbanization level and eco-environment pressure in Yan’an [22].
Meanwhile, relevant scholars have carried out numerous case studies at different spatial scales (e.g., national, provincial, and municipal scales). Gao et al. measured the coupled coordination between urbanization and eco-environment in northwest China and found that urbanization and eco-environment are generally complementary and mutually compatible [23]. Ariken et al. analyzed the coupled coordination relationship between urbanization and eco-environment in typical arid regions, taking Yanqin Basin as an example, and found that, although the eco-environment in Yanqin Basin had been optimized and the urbanization level had been improved, both still showed a moderate imbalance [24]. Ren et al. analyzed the spatial distribution characteristics of the coupled coordination of urbanization and eco-environment in Shandong Province, China, and found that the coupling degree of East Shandong and the central region of Shandong was higher than that of West Shandong [25]. Srinivasan studied the relationship between urbanization and water environment in Chennai, India, and found that water vulnerability is dynamic and that the problem of water shortage could be alleviated through urban planning [26]. Taking Beijing as their research object, Huang et al. found that, before 2011, Beijing’s urbanization level and eco-environment level presented a growing trend, and both were “superiorly balanced”. However, since 2011, Beijing’s eco-environment has been deteriorating [27].
Relevant scholars have taken Chinese urban agglomerations with different scales as research objects. Lin et al. analyzed the relationship between the urbanization quality and eco-environment pressure of the West Taiwan Strait urban agglomeration (WTSUA) and concluded that high-quality urbanization could reduce the eco-environment pressure. Meanwhile, the coupled coordination between the urbanization quality and eco-environment pressure has gradually increased [28]. Liang et al. studied the coordinated development pattern of urbanization and eco-environment in the Beijing–Tianjin–Hebei urban agglomeration (BTHA) and found that the coordinated development type of the BTHA has gradually evolved from lagging urbanization to a lagging eco-environment, indicating that the quality of the eco-environment needs to be further improved [29]. On the basis of an improved EKC model, Zhao et al. discussed the relationship between urbanization and the eco-environment of the urban agglomerations in the Yangtze River Delta and found that the coupled coordination process of these urban agglomerations has entered the stage of “break-in development” from the stage of “low-grade symbiosis” [30]. Zeng et al. compared the relationship between the urbanization level of the Pearl River Delta and the water resource utilization efficiency and concluded that, with the continuous development of urbanization, the water resource utilization efficiency of the Pearl River Delta urban agglomeration (PRDA) has constantly improved [31].
The urbanization process is affected by many factors, and relevant scholars discussed the urbanization process from the perspective of population, economy, industry, science and technology, system, and so on. Lewis, a famous American economist, proposed that urbanization is a process in which the population moves from rural areas to urban areas due to the attraction of high wages in cities [32], so population migration is an important driving force of urbanization development. Cao et al. found that the education level of the rural population played an important role in population urbanization and economic urbanization [33]. Kuzents, an American scholar, pointed out that economic development was the fundamental driving force of urbanization [34]. Guo et al. found that the relationship between the urbanization level and the economic development level is characterized by stages. In the primary stage of economic development, there may be a negative correlation between urbanization and the economy. With economic development and technological progress, there is gradually a positive correlation between the two [35]. Li et al. found that the orderly evolution of the industrial structure would lead to changes in the driving mechanism of urbanization, and cause the urbanization to show different regional patterns [36]. Dewick believed that the progress of science and technology would promote the transformation and upgrading of the industrial structure and have positive effects on the urban economy and environment [37]. Ades and Glaeser discussed the relationship between institutions and city size and found that the capitals of authoritarian countries are generally the primate cities, with a relatively large city size [38]. Ye et al. pointed out that institutional barriers were the main obstacles to China’s urbanization, and institutional innovation (including the household registration system, the social security system, as well as the social system) was conducive to speeding up China’s urbanization process [39].
To sum up, the current research on the relationship between urbanization and eco-environment has three characteristics: First of all, the research theory is becoming mature, and the analytical framework of the interaction and coupling theory between EKC, urbanization, and eco-environment lays a theoretical foundation for follow-up research. Secondly, the research methods are diversified, and technologies such as remote sensing technology, geographic information system technology, and computer technology have been applied to the research. Thirdly, the case studies are multi-scale, and relevant scholars are conducting case studies on countries, provinces, cities, and ecologically fragile areas. However, as the study on China’s urban agglomerations, the following two aspects need to be further strengthened: One is the problem that the Chinese urban development and resource carrying capacity do not match. The existing studies focus on a single city or urban agglomeration and lack a comprehensive comparative study of horizontal scales, which is not conducive to the overall understanding of the development differences in China’s urban agglomeration. Secondly, in the research on the coupled coordination relationship between urbanization and eco-environment, the existing researches only focus on the coupled coordination process and current situation analysis, and lack research cases which cause the driving mechanism of the coupled coordination’s spatial-temporal differentiation.
Compared with the shortcomings of the existing research, this paper improved the following two aspects: On the one hand, 13 Chinese urban agglomerations are selected as the research objects, and a comparative study on the urbanization level, eco-environment level, and coupled coordination degree is conducted from the perspective of time and space, so as to better grasp the development differences between urban agglomerations. On the other hand, 35 indicators are selected to comprehensively consider various factors such as population, economy, society, space, resources, and environmental carrying capacity, so as to more comprehensively and deeply explore the influencing factors that cause the spatial and temporal differentiation of the coupled coordination degree.
Therefore, the research idea of this paper, taking 13 urban agglomerations in China as the research objects and based on the population–economy–society–spatial (PESS) model and pressure–state–response (PSR) model, the evaluation index system of the urbanization system and eco-environment system is constructed, respectively. We also use the coupled coordination model to determine the coupled coordination situation of urbanization and eco-environment and adopt a geographical detector to calculate the influence of index factors. The spatial distribution pattern and genesis mechanism are also studied. The results of this work are expected to provide a theoretical basis and scientific support for the realization of the sound interaction between the urbanization and eco-environment of urban agglomerations, as well as sustainable development (Figure 1).
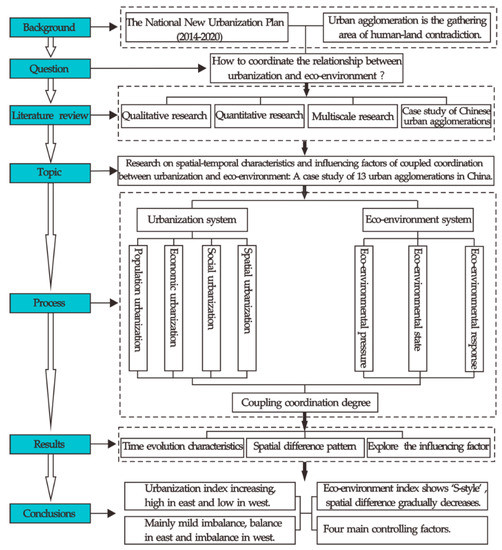
Figure 1.
Research framework of this study.
3. Materials and Methods
3.1. Study Area
To solve the mismatch between China’s urban development and the resources environment carrying capacity, the CPC Central Committee issued The National New Urbanization Plan (2014–2020) [10] and proposed to cultivate and develop 19 urban agglomerations across the country. Among them, the administrative areas of 13 urban agglomerations including the PRDA, BTHA, Yangtze River Delta urban agglomeration (YRDA), Middle Reaches of Yangtze River urban agglomeration (MRYRA), Chengdu–Chongqing urban agglomeration (CCA), Herbing–Changchun urban agglomeration (HCA), Shandong Peninsula urban agglomeration (SPA), Central–Southern Liaoning urban agglomeration (CSLA), Central Plain urban agglomeration (CPA), Guanzhong Plain urban agglomeration (GZPA), WTSUA and Hohhot–Baotou–Ordos–Yulin urban agglomeration (HBOYA), and Beibu Gulf urban agglomeration (BGA) account for 22.86% of the country; the population accounts for 64.17%; the GDP accounts for 83.44%; the total retail sales of social consumers account for 75.3%; the total imports of goods account for 95.76%; and the total exports account for 93.56%. Therefore, they are the regions with the most active economic activity and the densest population. Six urban agglomerations, including the Northern Slope of Tianshan Mountains urban agglomeration, the Lanzhou-Xining urban agglomeration, the Ningxia region along the Yellow River urban agglomeration, the central Guizhou urban agglomeration, the central Yunnan urban agglomeration, and the central Shanxi urban agglomeration, are ethnic minority areas which are currently in the stage of cultivation and development. Meanwhile, the scale of these urban agglomerations is relatively small, and the statistical data sources are different from the other 13 urban agglomerations, with a lot of lost indexes. Therefore, by comprehensively considering the regional importance, data accessibility, and integrity, in this paper the previous 13 urban agglomerations are selected as the research objects. The scope of urban agglomeration is determined according to the development plan (Figure 2).
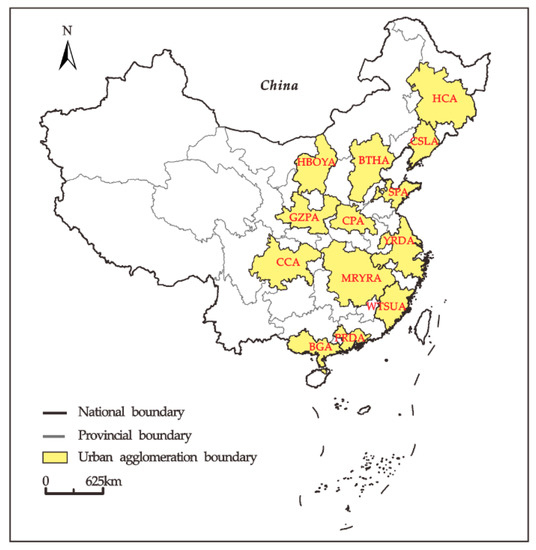
Figure 2.
Spatial scope of 13 urban agglomerations in China.
The 13 urban agglomerations in the research area have different strategic development positions. The BTHA is the economic core and cultural center of China and the embodiment of national competitiveness [11]. The YRDA is not only an important intersection of the “One Belt and One Road” and the “Yangtze River economic belt” but also one of the most economically dynamic regions in China [40]. The PRDA is one of the regions with the highest degree of marketization in China and serves as an important economic growth pole of China. The MRYRA is the core region that promotes the rise of the central region, and it is rich in natural resources [41]. The CCA is not only an important platform for China to promote the development of the western region but also a strong support for the promotion of the Yangtze River economic belt and the “belt and road” initiative [42]. The HCA is located in the network location of the northeast economic circle, which is the region with the closest trade connection between China and Russia [43]. The CSLA, located near the Bohai Sea, is an important region revitalizing the industry of northeast China. The SPA is an important location connecting north and south and China and foreign countries; thus, it is an important gateway for China to the sea [44]. The CPA is not only an important carrier that promotes the rise of the central region but also a core node which promotes the coordinated development of the east and central regions [45]. The GZPA is the most economically developed and the most densely urbanized region in northwest China, and it is strategically positioned as a new highland for inland reform and development [46]. The WTSUA is separated from Taiwan by the sea and is thus a frontier platform and link to strengthen the cooperation and exchange between the two sides [44]. The BGA, which is adjacent to the lands and seas of the Association of Southeast Asian Nations (ASEAN), is an important gateway for China to open up to member countries [47]. The HBOYA is a regional key urban agglomeration and plays an important role in improving China’s development and opening up the layout along the border areas [48].
3.2. Data Sources
The index data of 167 prefecture-level cities belonging to the 13 urban agglomerations in the study area come from the China City Statistical Yearbook [49,50,51,52], the China Urban-Rural Construction Statistical Yearbook [53,54,55,56], and the China Library Yearbook [57,58,59,60]. Some of the missing data are obtained from the statistical yearbooks of various provinces and cities and the statistical bulletins for the national economic and social development of various regions. China’s social and economic development is obviously influenced by policy. As the years 2005, 2010, and 2015 are the ending year of The Tenth Five-Year Planning Outline for China’s National Economy and Social Development (2001–2005), The Eleventh Five-Year Planning Outline for National Economic and Social Development (2006–2010), and The Twelfth Five-Year Planning Outline for National Economic and Social Development (2011–2015), the statistical data has a policy significance which forms a connecting link between the preceding and the following; the year 2017 is the latest year when complete survey data are available from the National Bureau of Statistics. Therefore, we select the data for these four-time sections for this research.
3.3. Variable Coefficient
As the urbanization and eco-environment systems are comprehensive complex systems, we use a variable coefficient to determine the weight of each index. The coefficient of variation method can maximize the information provided by the indices themselves to prevent the influence of different dimensions of the indices on the weights. In this way, the method can effectively reflect the relative importance of the indices. The calculation steps are as follows:
Step 1: Standardize the original index by applying range standardization.
Step 2: Determine the variable coefficient Vi of the indicator; in the equation, σi is the standard deviation of the ith indicator and is the mean value of the ith indicator.
Step 3: Calculate the weight of each indicator Wi.
3.4. Coupled Coordination Model
The concept of coupling comes from physics, and it refers to the phenomenon when two or more systems interact with each other through interaction [25]. The quantitative indexes which measure the coupling degree include the coupling degree and the coupled coordination degree. The coupled degree is a degree index to describe the mutual influence of systems or elements. Coordination is a sound interaction that reflects the harmonious and healthy relationship between systems. The coupled coordination degree measures the harmony between systems or elements within the system in the development process, and it also reflects the trend when the system transforms from disorder to order and from a low level to a high level [61].
There is a complex interactive stress relationship between the urbanization system and the eco-environment system, and the two interact with each other through human flow, logistics, energy flow, as well as information flow, thus forming an organic whole. The eco-environment restricts the urban development, and the urbanization process stresses the eco-environment. Eco-environment is the foundation of urban development and needs to be conducted by human beings within the eco-environmental bearing threshold; otherwise, the original coordination will be broken, and a series of eco-environment problems will be produced, thus directly leading to a decrease in the urban residents’ living environmental quality, a backward level of economic development, as well as reduced happiness, so that the urbanization development process will be constrained. Urbanization is the only means for the development of human society. If the urbanization system is expanded randomly, it will inevitably lead to a shortage of the urban land area, a shortage of natural resources, as well as the deterioration of the eco-environment, which will lead to an increase in eco-environment pressure.
Therefore, the urbanization index U(x) and the eco-environment index E(y) are calculated, and the coupling degree functions of the two indices are constructed. The expression is as follows:
where C is the coupling degree between the urbanization system and the eco-environment system. C ∊ [0,1]; the greater the C value is, the higher the coupling degree will be. α and β are the weight coefficients—i.e., α + β = 1. Given that the urbanization system and eco-environment system are interactive, α = β = 0.5. θ is the adjustment factor with a value of 2.
When the development levels of both subsystems are relatively low, the coupling degree will be high and cannot objectively reflect the stress–interaction relationship between the two systems [22]. To accurately judge the degree of their coordinated development, one should calculate the coupled coordination degree through the following expression:
where D is the coupled coordination degree between the urbanization system and the eco-environment system. The greater the value is, the higher the consistency between the elements of the two systems will be, and vice versa. T is the comprehensive evaluation index of the two systems, and a and b are the contribution weights. As urbanization development is as important as eco-environment protection, a = b = 0.5. The degree of coupled coordination is classified, as shown in Table 1.

Table 1.
Classification of the coupled coordination degree.
3.5. Geographical Detector
The geographical detector is a statistical method to reveal the driving forces behind geographical objects [62,63]. Its advantage is that it has no excessive assumptions, the scope of its application is relatively wide, and the physical meaning is clear. In this work, the factor detection of the geographical detector is used to analyze the main influencing factors that cause the coupling and coordination of the urbanization of urban agglomerations and the spatial–temporal differentiation of the eco-environment system. The formula is as follows:
where q is the measurement value of indicator differentiation, which is used to express the degree of interpretation of an independent variable to a dependent variable; N is the number of indicators; σ2 is the variance of the indicators; and h = 1 ..., L, L denotes the number of categories or partitions. q ∊ [0,1]; the greater the value is, the greater the influence of this indicator on the coupled coordination degree will be.
3.6. Construction of Index System
Urbanization includes the changes and transformations of factors such as population, industry, society, space, and ecology [64,65]. According to the PESS model, 22 indicators are selected from the four subsystems—namely, population urbanization, economic urbanization, social urbanization and spatial urbanization—to evaluate the urbanization development level (Table 2). Population urbanization is the basic content and important index of urbanization. Economic urbanization is the core content and internal thrust of the urbanization process. Social urbanization is the standard by which to measure the level of urban civilization and people’s living standards. Spatial urbanization can directly reflect the process of urbanization.
Table 2.
Evaluation index system for urbanization and the eco-environment.
The carrying capacity threshold of the eco-environment system is closely related to human activities [66,67]. The PSR model was jointly proposed by the Organization for Economic Cooperation and Development and the United Nations Environment Programme, and it has been widely used in the assessment of ecological system health. Pressure reflects the direct load brought by human activities to the ecosystem, that is, ecological stress. State reflects the health of the ecosystem, that is, the status of natural resources, environmental quality and the ecosystem. Response refers to the measures and countermeasures taken by human beings in the face of environmental problems, such as ecological system degradation—that is, the sustainable development ability of the eco-environment system [68]. According to the PSR model, 13 indicators are selected from three subsystems (i.e., eco-environment pressure, eco-environment state, and eco-environment response) to evaluate the eco-environment quality of the research area (Table 2).
4. Results
According to Table 2, the urbanization and eco-environment indices of the 13 urban agglomerations are calculated, and then cluster analysis is performed. The urbanization index and eco-environment index are divided into four grades: high, relatively high, medium, and low. Later, the coupled coordination degree between the urbanization system and the eco-environment system is calculated, and the spatial and temporal distribution characteristics are analyzed.
4.1. Time Evolution Characteristics of the Coupled Coordination between Urbanization and Eco-Environment in China’s Urban Agglomerations
4.1.1. Urbanization Index
From 2005 to 2017, the urbanization indices of the 13 Chinese urban agglomerations showed a growing trend, and the urbanization level gradually improved (Figure 3). The urbanization index of the PRDA was always maximum across all time sections (0.254 in 2005, 0.269 in 2010, 0.310 in 2015, and 0.394 in 2017), thus indicating that the PRDA has the highest level of urbanization development. The urbanization index of the BGA was the lowest (0.068 in 2005, 0.075 in 2010, 0.092 in 2015, and 0.128 in 2017), and it is the urban agglomeration with the lowest urbanization level. The BGA had the fastest urbanization development speed, with an urbanization index growth rate of 88.24%. The urbanization speed of the CSLA was the slowest, with an urbanization index of only 29.20%.
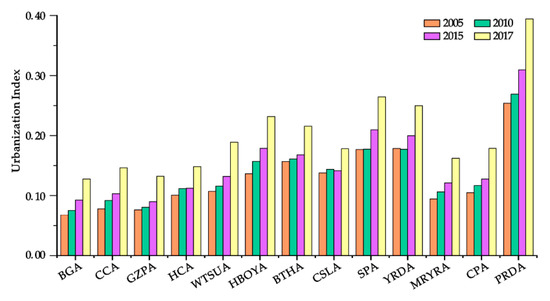
Figure 3.
Evolution characteristics of the urbanization indices of 13 urban agglomerations in China.
In the urbanization subsystem, the average growth rate of social urbanization is the highest at 108.61%, which indicates that the government increases the investment in medical care, education, and public facilities (Table 3). Spatial urbanization comes in second, with an average growth rate of 106.94%. The average growth rate of economic urbanization is the lowest at 22.49%, followed by population urbanization, with an average growth rate of 37.45%. Among the urban agglomerations, the social urbanization growth rate of the BGA and the spatial urbanization growth rate of the CCA are the largest, increasing from 0.014 and 0.012 in 2005 to 0.042 and 0.036 in 2017, respectively, with a growth rate of 200.00%. The economic urbanization of the CSLA showed the largest reduction from 0.047 in 2005 to 0.036 in 2017, resulting in a decrease rate of −23.40%.
Table 3.
Urbanization subsystem indices of 13 urban agglomerations in China.
4.1.2. Eco-Environmental Index
From 2005 to 2017, the eco-environmental indices of the 13 urban agglomerations in China showed an “S-shaped” variation trend, which can be divided into three stages: decline from 2005 to 2010, increase from 2010 to 2015, and decline from 2015 to 2017 (Figure 4). In 2005, the eco-environmental index of the SPA was the largest at 0.517, and that of the GZPA was the smallest at 0.315. In 2010, the eco-environmental indices of all the urban agglomerations reached the lowest value in the last 12 years, and the eco-environment pressure was the highest. In 2015, the eco-environmental indices of all urban agglomerations increased slightly, and the eco-environment pressure was relieved to some extent. The eco-environment pressure of the PRDA was the largest (0.402), and that of the BGA was the smallest (0.283). In 2017, the eco-environmental indices declined slightly. The eco-environmental index of the PRDA remained the largest (0.469), and that of the HBOYA was the smallest (0.332). The eco-environmental indices of the BGA, CCA, GZPA, HCA, and CPA showed a growth trend, and the eco-environment improved. Meanwhile, the eco-environmental index of the GZPA had the highest growth rate of 11.49%. The eco-environmental indices of the WTSUA, HBOYA, BTHA, CSLA, SPA, YRDA, MRYRA, and PRDA showed a downward trend, and the eco-environmental pressure increased. Moreover, the eco-environmental index of the SPA decreased the most, showing a decrease rate of −28.73%.
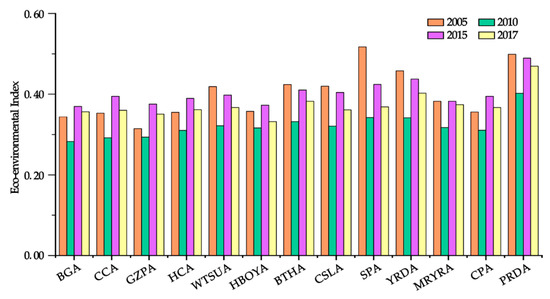
Figure 4.
Evolution characteristics of the eco-environmental indices of 13 urban agglomerations in China.
In the eco-environment subsystem, the average growth rate of the eco-environment pressure was the highest (32.07%), indicating that the industrial technology was improved and that the environmental pressure was alleviated to some extent (Table 4). The eco-environmental state came in second, with an average growth rate of 15.42%. The overall eco-environmental response showed a downward trend, with an average reduction rate of −35.44%, which indicated that the government strengthened its environmental protection measures. Amongst the urban agglomerations, the BGA had the largest increase in eco-environment pressure from 0.074 in 2005 to 0.109 in 2017, resulting in a growth rate of 47.30%. The eco-environmental response in the SPA decreased the most from 0.300 in 2005 to 0.129 in 2017, resulting in a decrease rate of −57.00%.
Table 4.
Indices of the eco-environment subsystems of 13 urban agglomerations in China.
4.1.3. Coupled Coordination Degree
From 2005 to 2017, the coupled coordination degree of the 13 urban agglomerations in China showed a “U-shaped” growth trend, and it could be divided into two stages: slow decline between 2005 and 2010 and rapid growth between 2010 and 2017. Mild imbalance was the main feature of the coupled coordination between urbanization and eco-environment (Figure 5). In 2005, seven urban agglomerations—namely, CCA, HCA, WTSUA, HBOYA, CSLA, MRYRA, and CPA—showed a mild imbalance, accounting for 53.85%. The urbanization and eco-environment in the BGA and GZPA were seriously unbalanced, accounting for 15.38%. The urbanization and eco-environment of the four urban agglomerations (YRDA, PRDA, BTHA, and SPA) were moderately coordinated, accounting for 30.77%.
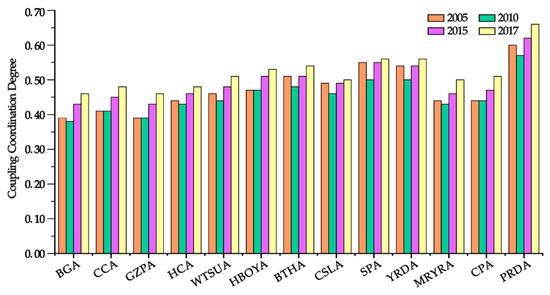
Figure 5.
Evolution characteristics of the coupled coordination degree of 13 urban agglomerations in China.
In 2010, the number of urban agglomerations with mild and severe imbalance increased. Nine urban agglomerations—namely, BTHA, YRDA, SPA, HCA, WTSUA, HBOYA, CSLA, MRYRA, and CPA—showed a mild imbalance, accounting for 69.23%. Three urban agglomerations—namely, BGA, CCA, and GZPA—showed a severe imbalance, accounting for 23.08%. Only the coupled coordination degree of the PRDA showed moderate coordination.
In 2015, urbanization and eco-environment tended to have a coordinated development, and no urban agglomeration showed a severe imbalance. The coupled coordination characteristics of the BGA, CCA, GZPA, HCA, WTSUA, CSLA, MRYRA, and CPA were slightly unbalanced, accounting for 61.54%. The HBOYA, BTHA, YRDA, and SPA mainly presented a mild coordination, accounting for 30.77%. The PRDA had the best coupled coordination degree—that is, it showed a good coordination.
In 2017, the number of urban agglomerations with mild imbalance decreased, and they included the BGA, CCA, GZPA, HCA, CSLA, and MRYRA, accounting for 46.15%. The number of urban agglomerations with moderate coordination increased, and they included the WTSUA, HBOYA, BTHA, MRYRA, SPA, and CPA, accounting for 46.15%. The PRDA remained the only one to achieve the level of good coordination.
4.2. Spatial Pattern of the Coupled Coordination between Urbanization and Eco-Environment in China’s Urban Agglomerations
4.2.1. Urbanization Index
The spatial difference in the urbanization indices was significant, showing a distribution pattern of “high in the east and low in the west” (Figure 6). The urban agglomerations with high and relatively high urbanization indices were mainly distributed in the eastern coastal region, and they mainly included the PRDA, YRDA, BTHA, and SPA. Given the small number of cities in the HBOYA, the urbanization index could be kept within a relatively high range. The urban agglomerations with a moderate urbanization index gradually expanded in scope, increasing from 30.77% in 2005 to 38.46% in 2017. They included the CSLA, CPA, MRYRA, and WTSUA. Their spatial locations were distributed in the central region, and their spatial form changed from “patch shape” to “strip shape”. The urban agglomerations with low urbanization indices gradually shrunk in scope, with the proportion dropping from 38.46% in 2005 to 30.77% in 2017. The agglomerations were mainly distributed in western China, and they included the BGA, CCA, and GZPA.
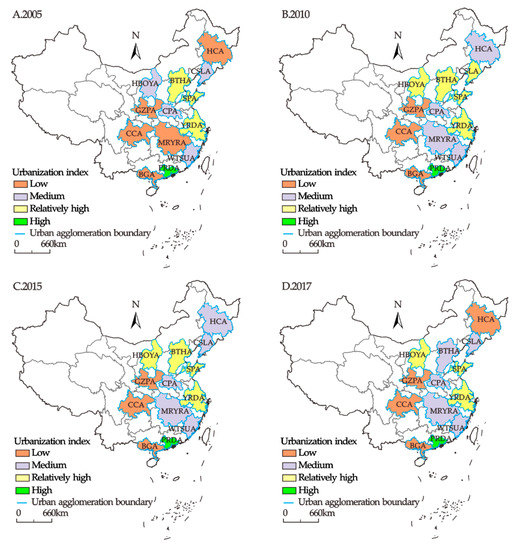
Figure 6.
Spatial pattern of the urbanization indices of 13 urban agglomerations in China. (A) urbanization indices in 2005; (B) urbanization indices in 2010; (C) urbanization indices in 2015; (D) urbanization indices in 2017.
4.2.2. Eco-Environmental Index
The spatial difference in the eco-environmental indices gradually shrunk, and the overall eco-environment of the urban agglomerations improved (Figure 7). The range of the urban agglomerations with a moderate eco-environment level expanded, gradually expanding from the central and western regions to the eastern coastal areas, including eight urban agglomerations—namely, HCA, CSLA, BTHA, SPA, CPA, CCA, MRYRA, and WTSUA—accounting for 61.54%. The urban agglomerations with a low eco-environment level were distributed in the south and north sides of those with a moderate eco-environment level, and they included the HBOYA and GZPA in the north and the BGA in the south; these regions have shown the most serious environmental problems in China. The range of urban agglomerations with high and relatively high eco-environment levels decreased from 46.15% in 2005 to 15.38% in 2017. In 2017, only the PRDA and YRDA maintained a high eco-environment level.
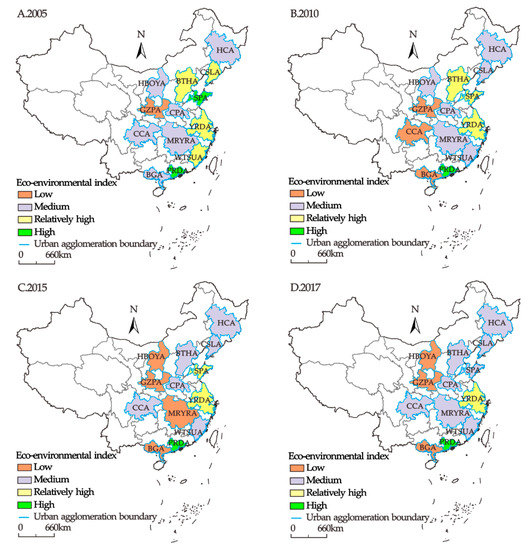
Figure 7.
Spatial pattern of the eco-environmental indices of 13 urban agglomerations in China. (A) Eco-environmental indices in 2005; (B) eco-environmental indices in 2010; (C) eco-environmental indices in 2015; (D) eco-environmental indices in 2017.
4.2.3. Coupled Coordination Degree
The coupled coordination degree presented a spatial pattern of “coordination in the east and imbalance in the west” (Figure 8). In 2005, the characteristics of the coupled coordination were mainly unbalanced. Except for the BTHA, the YRDA, PRDA, and SPA reached moderate coordination, and the other urban agglomerations were in a mildly unbalanced state. In particular, the coordination degree of the GZPA and BGA was the lowest, showing a severe imbalance. In 2010, the economic, population, and social urbanization processes exerted great stress on the eco-environment, and all the 12 urban agglomerations, except for the PRDA, were in an imbalanced stage. This condition made the contradiction between urban development and eco-environmental protection increasingly prominent. From 2015 to 2017, the coupled coordination degree of the eastern urban agglomerations rose, and the PRDA achieved good coordination. The BTHA, YRDA, CSLA, HBOYA, CPA, SPA, and BGA presented a moderate coordination, and the urbanization and eco-environment tended to have a coordinated development. However, the GZPA, CCA, MRYRA, BGA, and HCA presented a slight imbalance and outstanding eco-environmental problems in the urban development process; they thus formed a spatial pattern of “coordination in the east and imbalance in the west”.
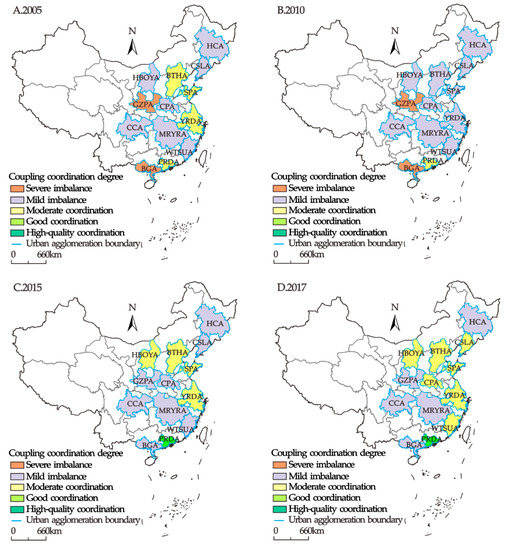
Figure 8.
Exponential spatial pattern of coupled coordination degree of 13 urban agglomerations in China. (A) Coupled coordination degree in 2005; (B) coupled coordination degree in 2010; (C) coupled coordination degree in 2015; (D) coupled coordination degree in 2017.
5. Discussion
The interactive coupling process between urbanization and eco-environment is influenced by a number of factors, including natural conditions, population quality, urban civilization, industrial technology, and system resilience. Seven index factors in the subsystem—namely, population urbanization (U1), economic urbanization (U2), social urbanization (U3), spatial urbanization (U4), eco-environment pressure (E1), eco-environment state (E2), and eco-environment response (E3)—were selected in this study. The geographical detector was used to quantify the influence of each index factor (q) and explore its influence on the spatial variation in the coupled coordination between the urbanization and eco-environment of urban agglomerations.
Through factor detection, the influence of seven index factors affecting the coupled coordination degree between urbanization and eco-environment was determined, and the value range of each index q was distinct (Figure 9). In 2005, the descending sequence of q was E3 > U3 > U4 > U2 > U1 > E1 > E2, and the values were 0.803, 0.798, 0.722, 0.716, 0.469, 0.203, and 0.049, respectively. In 2010, the descending sequence of q was E3 > U4 > U3 > E2 > U2 > U1 > E1, and the values were 0.829, 0.766, 0.755, 0.630, 0.604, 0.523, and 0.081, respectively. In 2015, the descending sequence of q was U3 > E3 > U4 > U1 > E1 > U2 > E2, and the values were 0.872, 0.826, 0.753, 0.601, 0.525, 0.472, and 0.039, respectively. In 2017, the descending sequence of q was U3 > E3 > U4 > U1 > U2 > E1 > E2, and the values were 0.891, 0.845, 0.805, 0.723, 0.675, 0.620 and 0.228, respectively. Economic urbanization (U2), social urbanization (U3), spatial urbanization (U4), and eco-environment response (E3) were the main controlling factors, and the average value of q was always greater than 0.758. Population urbanization (U1), eco-environment pressure (E1), and eco-environment state (E2) were the three indices with the greatest changes in influence. Economic urbanization (U2), social urbanization (U3), spatial urbanization (U4), and eco-environment respond (E3) were the indices with relatively small changes in influence.
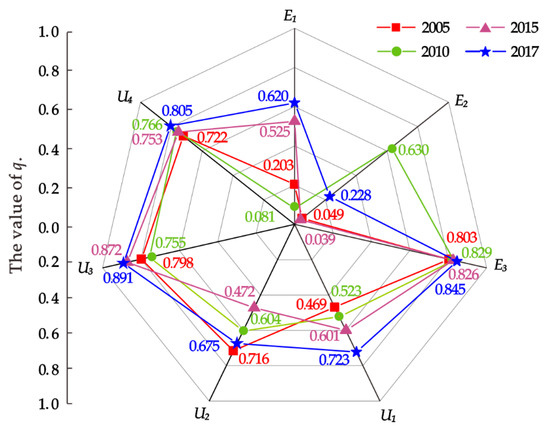
Figure 9.
Influence of the index factors of coupled coordination degree between the urbanization and eco-environment of 13 urban agglomerations in China.
Economic urbanization (U2), social urbanization (U3), spatial urbanization (U4), and eco-environment response (E3) are the main controlling factors influencing the degree of coupled coordination. The q value is always kept at a high level and has an important impact on the coupling and coordinated development of the urbanization and eco-environment of urban agglomerations. Take the PRDA as an example. As the base of scientific and technological innovation and technology research and development in China, the PRDA is of great significance in the process of economic globalization competition. Meanwhile, as the engine of urban development, economic development will inevitably lead to changes in land use types. By the end of 2017, the per capita GDP of the PRDA reached 115,817.33 Yuan, which ranked it first among all the urban agglomerations. At the end of 2018, the per capita arable land area of the agricultural population in Guangzhou was only 0.03 ha, and the cultivated land area was reduced by 1387.00 ha in the same year. Meanwhile, spatial urbanization occupied a large amount of farmland, the cultivated land resources decreased, and the food production security became endangered. At present, although the PRDA is the only agglomeration to show a good coupled coordination degree amongst China’s urban agglomerations, its land contradiction remains an urgent problem.
The impact of population urbanization (U1) on the coupled coordination degree rises year by year. The q value gradually increased from 0.469 in 2005, 0.523 in 2010, and 0.601 in 2015 to 0.723 in 2017, with a growth rate of 54.16%. Population urbanization is the process in which the population concentrates in urban areas. Urban agglomeration, as the core area of regional economic development, forms a huge attraction for population flow. The urbanization rate of the BTHA increased from 29.21% in 2010 to 57.99% in 2017, resulting in a growth rate of up to 98.53%. As China’s political and cultural center, the BTHA attracts a large number of people. As a large population gathers to urban areas, some stress affects the eco-environment, thereby causing a number of environmental problems, including traffic jams, housing tensions, haze, and water resource shortages. Therefore, correctly evaluating the environmental population capacity and improving the urban eco-environment have become important factors influencing the sustainable development of the urbanization and eco-environment of urban agglomerations.
Herein, the influence of eco-environment pressure (E1) and eco-environment state (E2) on the coupled coordination degree greatly fluctuated. As for the value of eco-environmental pressure (E1), the q value was 0.203 in 2005, 0.081 in 2010, 0.525 in 2015, and 0.620 in 2017, indicating a growth rate of 205.42%. As for the eco-environment state (E2), the q value was 0.049 in 2005, 0.630 in 2010, 0.039 in 2015, and 0.228 in 2017, thereby indicating a growth rate of 365.31%. Take the CSLA as an example. As the largest heavy industry base in China, the CSLA always showed a large eco-environment pressure, with the per capita consumption of natural gas reaching 69.34 m3 and the per capita water consumption reaching 76.00 m3. The degree of coupled coordination between urbanization and eco-environment was in a slightly unbalanced state. Since 2000, due to the unreasonable industrial structure, the proportion of new industries and high-tech industries has always been low. At the same time, China’s economic development mode has entered the transition period, and the demand for energy, raw materials, and traditional industries has decreased. As a result, the industrial growth rate of the CSLA has dropped rapidly, resulting in the “Northeast Phenomenon”. Aiming to overcome the development dilemma, the CSLA has recently upgraded the industrial structure. It has vigorously promoted the development of new and high-technology industries, and it has gradually formed the industrial pattern of the equipment manufacturing and aerospace industries, with Shenyang as the center. In this way, the pressure of industrial development on the eco-environment is reduced, and the environmental status is gradually improved. In 2017, the coupled coordination degree achieved moderate coordination for the first time.
In general, the advantages of the geographical probe and coupled coordination degree model are that it can accurately quantify the influence value of index factors and the degree of interaction between urbanization and eco-environment stress, and when the data information is complete and the index selection is reasonable, the method is also applicable to the research on the relationship between the urbanization and eco-environment of other areas. Based on the above two methods, we found that the coupled coordination of urbanization and eco-environment of 13 Chinese urban agglomerations presents the spatial pattern characteristics of “balance in the east and imbalance in the west”, and the conclusion is basically consistent with the major problems in the face of the development of Chinese cities judged by the government [10], as well as the predecessors’ research results [29,69,70], so it is proved that the research results of this paper conform to the regional actual situation, and the suggestions put forward according to these conclusions are reliable. Besides this, due to the lack of research on the coupled coordination driving mechanism in the existing papers, in this paper geographic probes are used to quantify each index factor, and it is found that economic urbanization, social urbanization, spatial urbanization, and eco-environment response are the main controlling factors affecting the spatial differentiation of coupled coordination between urbanization and the eco-environment. Based on the above results, we put forward the following suggestions for the future development of each urban agglomeration.
The urban agglomerations with relatively high urbanization levels, including the PRDA, YRDA, and BTHA, should pay attention to optimizing the industrial structure, changing the extensive use of land and resources, and seeking an intensive and sustainable development model to fundamentally reduce the pressure on the natural environment. They should also focus on the coordination and division of labor among cities at all levels; strengthen the mobility of people, logistics, information flow, and capital flow; and maximize the “trickle-down effect” of Beijing, Shanghai, Guangzhou, Shenzhen, and other core cities so as to drive the development of regions with low urbanization levels around them. The urban agglomerations with moderate urbanization levels, including the MRYRA, WTSUA, and CPA, can learn from the development experience of regions with high urbanization levels and explore a new urbanization model that accords with regional characteristics from the perspectives of population, economy, society, and space. At the same time, they should speed up the construction of urban infrastructure and develop competitive industries by closely following the national development strategic opportunities of “the Belt and Road” and the Yangtze River economic belt.
The urban agglomerations with good eco-environmental protection, including the YRDA and PRDA, should have a strong development concept in which lucid waters and lush mountains are invaluable assets. Moreover, they should always maintain crisis awareness of eco-environment protection, check erroneous ideas at the outset. and identify high-risk industries in the region. They should also focus on high-risk objects, formulate emergency plans, and avoid major environmental pollution incidents. The urban agglomerations with outstanding eco-environmental problems, such as the GZPA and BGA, should increase investment in manpower, material resources, and financial resources. Moreover, the environmental protection concept should be transformed from “soft constraints” to “hard constraints” to set up a legal system of energy conservation and emission reduction rules. The environmental protection department should launch social supervision power, exert efforts to find root causes, and take concrete measures to precisely protect the eco-environment.
The urban agglomerations with a low coupled coordination degree, such as the CSLA and HCA, should focus on technological innovation and institutional innovation. Resource-based cities, such as Anshan and Daqing, should actively explore green industries that can support the urban economy whilst focusing on resource extraction so as to reduce the impact of the “resource curse” on urban development. The urban agglomerations with relatively high coupled coordination, such as the PRDA and YRDA, should accelerate the innovation of population policy and actively cope with the problem of “demographic dividend” exhaustion. Moreover, they should explore intensive land use forms, strengthen eco-environment protection, create a liveable urban atmosphere, and realize the sound interaction between urbanization and the eco-environment.
6. Conclusions
The urbanization index shows a trend of increase year by year, and the spatial distribution pattern is “high in the east and low in the west”. The PRDA has the highest urbanization level in China, the BGA has the lowest urbanization level, and social urbanization is the subsystem with the most obvious changes. The urban agglomerations with high and relatively high urbanization levels are mainly the PRDA, YRDA, BTHA, and SPA along the east coast. The urban agglomerations with low urbanization levels are mainly the GZPA, CCA, and BGA in the west region.
The eco-environment index shows an “S-shaped” variation trend, and the spatial difference between urban agglomerations gradually decreases. The eco-environmental indices of the BGA, CCA, GZPA, HCA, and CPA gradually increase, and the eco-environment improves. The eco-environmental indices of the WTSUA, HBOYA, BTHA, CSLA, SPA, YRDA, MRYRA, and PRDA show a downward trend, and the eco-environmental pressure increases. In the subsystem, the change in eco-environmental response is the most obvious. In terms of spatial distribution, the range of city clusters with medium and low eco-environment levels and the range of urban agglomerations with moderate eco-environment levels expand, whilst that of the agglomerations with low eco-environment levels becomes narrow. The overall eco-environment improves.
Coupled coordination is mainly characterized as mild imbalance, and the spatial distribution pattern is “coordination in the east and imbalance in the west”. In terms of time variation, the proportion of moderately and highly coordinated urban agglomerations increases, whereas that of severely and mildly imbalanced urban agglomerations decreases. In terms of spatial distribution, the PRDA, BTHA, YRDA, CSLA, HBOYA, CPA, and SPA in the east are dominated by good and moderate coordination; in the west, the GZPA, CCA, MRYRA, BGA, and HCA show mainly mild imbalance.
The population urbanization, economic urbanization, social urbanization, spatial urbanization, eco-environment pressure, eco-environment state, and eco-environment response are the main factors influencing the coupled coordination between urbanization and the eco-environment. Amongst them, economic urbanization, social urbanization, spatial urbanization, and eco-environment response are the main controlling factors, and the average influence is always greater than 0.758. The influence of population urbanization, eco-environment pressure, and eco-environment state gradually increases, whilst that of economic urbanization, social urbanization, spatial urbanization, and eco-environment response on the coupled coordination degree changes slightly.
The reason why China promotes ecological civilization construction and new urbanization construction is to realize the coordinated development of urbanization and the eco-environment. Due to the different natural background factors and economic basis of each urban agglomeration, there are different problems faced by the human–land relationship. This paper focuses on the differences in coupled coordination among urban agglomerations and the main reasons for these differences from the perspective of the time dimension and the space dimension, so as to provide a theoretical basis for the formulation of policies for regional sustainable development. However, there are still some limitations in this study. Considering the consistency of the statistical caliber as well as the integrity of the data, the smallest unit of index data statistics is prefecture-level cities, so the research unit is not exquisite enough. In future studies, we will try to narrow down the minimum statistical units of index data (such as counties), refine the research on the coupled coordination relationship between urbanization and the eco-environment, and find out the deeper reasons for the spatial and temporal differences between them. Meanwhile, with the rapid development of social economy, a more complex coupling relationship has been formed between urbanization and eco-environment. Therefore, how to measure the coupling relationship between various elements within the two systems is also an issue worth discussing in future research.
Author Contributions
J.W. analyzed the data and wrote the manuscript; L.Z. designed research and proofread the manuscript; J.Y. reviewed logic and put forward suggestions; X.W. and T.W. collected the data. All authors have read and agreed to the published version of the manuscript.
Funding
This research was supported by the National Natural Science Foundation of China (NO. 41871187; NO. 41877519).
Conflicts of Interest
The authors declare no conflict of interest.
References
- Zhou, Y.X. Urban Geography; The Commercial Press: Beijing, China, 1995. [Google Scholar]
- Gu, C.L. Enlightenment from the main experience of urbanization abroad. City 2010, 10, 6–8. [Google Scholar]
- The World Bank. Available online: https://www.worldbank.org/en/topic/urbandevelopment/overview (accessed on 20 April 2020).
- United Nations. Available online: https://population.un.org/wup/Download/ (accessed on 14 January 2018).
- United Nations. Available online: https://www.un.org/en/climatechange/cities-pollution.shtml (accessed on 9 December 2014).
- Seto, K.C.; Güneralp, B.; Hutyra, L.R. Global forecasts of urban expansion to 2030 and direct impacts on biodiversity and carbon pools. Proc. Natl. Acad. Sci. USA 2012, 109, 16083–16088. [Google Scholar] [CrossRef] [PubMed]
- Fang, C.L.; Bao, C.; Qiao, B. Urbanization Process and Urban Eco-environment Effect; Science Press: Beijing, China, 2008. [Google Scholar]
- Huang, J.C.; Fang, C.L. Analysis of coupling mechanism and rules between urbanization and eco-environment. Geogr. Res. 2003, 22, 211–220. [Google Scholar]
- Renmin Website. Available online: http://en.people.cn/200505/12/eng20050512_184776.html (accessed on 12 May 2005).
- National Development and Reform Commission; Ministry of Housing and Urban-Rural Development. The National New Urbanization Plan (2014–2020); National Development and Reform Commission & Ministry of Housing and Urban-Rural Development: Beijing, China, 2014. [Google Scholar]
- Huang, J.C.; Lin, H.X. Spatial evolution analysis and multi-scenarios simulation of Beijing-Tianjin-Hebei Urban Agglomeration. Geogr. Res. 2015, 25, 1003–1024. [Google Scholar]
- Howard, E. Garden Cities of To-morrow; Routledge: London, UK, 2013. [Google Scholar]
- Carson, R. Silent Spring; Houghton Mifflin Harcourt: Boston, MA, USA, 2002. [Google Scholar]
- Register, R. Ecocities: Rebuilding Cities in Balance with Nature; New Society Publishers: New York, NY, USA, 2006. [Google Scholar]
- Grossman, G.M.; Krueger, A.B. Economic growth and the environment. Q. J. Econ. 1995, 110, 353–377. [Google Scholar] [CrossRef]
- Fang, C.L.; Zhou, C.H.; Guo, C.L.; Chen, L.D.; Li, S.C. Theoretical analysis of interactive coupled effects between urbanization and eco-environment in mega-urban agglomerations. J. Geogr. Sci. 2016, 71, 531–550. [Google Scholar] [CrossRef]
- Cai, D.L.; Fraedrich, K.; Guan, Y.N.; Guo, S.; Zhang, C.Y. Urbanization and the thermal environment of Chinese and US-American cities. Sci. Total Environ. 2017, 589, 200–211. [Google Scholar] [CrossRef] [PubMed]
- Schneider, A.; Friedl, M.A.; Potere, D. Mapping global urban areas using MODIS 500-m data: New methods and datasets based on ‘urban ecoregions’. Remote Sens. Environ. 2010, 114, 1733–1746. [Google Scholar] [CrossRef]
- McClintock, N. Cultivating (a) sustainability capital: Urban agriculture, ecogentrification, and the uneven valorization of social reproduction. Ann. Am. Ass. Geogr. 2018, 108, 579–590. [Google Scholar] [CrossRef]
- Singh, P.; Kikon, N.; Verma, P. Impact of land use change and urbanization on urban heat island in Lucknow city, Central India, a remote sensing-based estimate. Sust. Cities Soc. 2017, 32, 100–114. [Google Scholar] [CrossRef]
- Kong, L.Q.; Tian, G.J.; Ma, B.R.; Liu, X.J. Embedding ecological sensitivity analysis and new satellite town construction in an agent-based model to simulate urban expansion in the Beijing metropolitan region, China. Ecol. Indic. 2017, 82, 233–249. [Google Scholar] [CrossRef]
- Lu, C.Y.; Wei, H.Y.; Bai, J.Y. Response research of eco-environment stress and urbanization based on BP artificial neural network: Yan’an. J. Arid Land Resour. Environ. 2012, 26, 61–66. [Google Scholar]
- Gao, X.C.; Yang, F. The coupling coordination development between urbanization and ecological environment in northwest China. Urban Probl. 2016, 12, 26–33. [Google Scholar]
- Ariken, M.; Zhang, F.; Liu, K.; Fang, C.; Kung, H.T. Coupling coordination analysis of urbanization and eco-environment in Yanqi Basin based on multi-source remote sensing data. Ecol. Indic. 2020, 114, 106331. [Google Scholar] [CrossRef]
- Ren, M.; Cheng, Y.; Ren, J.L. Identification of non-coordination between urbanization and ecological environment in Shandong province. World Reg. Stud. 2016, 25, 58–68. [Google Scholar]
- Srinivasan, V.; Seto, K.C.; Emerson, R.; Gorelick, S.M. The impact of urbanization on water vulnerability: A coupled human-environment system approach for Chennai, India. Glob. Environ. Chang. 2013, 23, 229–239. [Google Scholar] [CrossRef]
- Huang, Y.; Qiu, Q.Q.; Sheng, Y.H.; Min, X.Q.; Cao, Y.W. Exploring the relationship between urbanization and the eco-environment: A case study of Beijing. Sustainability 2019, 11, 6298. [Google Scholar] [CrossRef]
- Lin, X.Q.; Lu, C.Y.; Song, K.S.; Su, Y.; Lei, Y.F.; Zhong, L.X.; Gao, Y.B. Analysis of coupling coordination variance between urbanization quality and eco-environment pressure: A case study of the West Taiwan Strait Urban Agglomeration, China. Sustainability 2020, 12, 2643. [Google Scholar] [CrossRef]
- Liang, L.W.; Wang, Z.B.; Fang, C.L.; Sun, Z. Spatiotemporal differentiation and coordinated development pattern of urbanization and the ecological environment of the Beijing-Tianjin-Hebei urban agglomeration. Acta Ecol. Sin. 2019, 39, 1212–1225. [Google Scholar]
- Zhao, Y.B.; Wang, S.J.; Zhou, C.S. Understanding the relation between urbanization and the eco-environment in China’s Yangtze River Delta using an improved EKC model and coupling analysis. Sci. Total Environ. 2016, 571, 862–875. [Google Scholar] [CrossRef]
- Zeng, H.; Yan, C.H.; Huang, W.B.; Lin, Q.Y.; Yu, L.Y.; Qiu, G.Y. A Case Study on the relationship between urbanization level and water use efficiency in the Pearl River Delta Urban Agglomeration. Acta Sci. Nat. Univ. Pek. 2020, 56, 561–570. [Google Scholar]
- Lewis, W.A. Economic Development with Unlimited Supplies of Labour. Manch. Sch. 1954, 22, 139–191. Available online: https://onlinelibrary.wiley.com/doi/10.1111/j.1467-9957.1954.tb00021.x (accessed on 1 May 1954).
- Cao, S.; Yu, N.; Wu, Y.; Wang, Z.; Mi, J. The educational level of rural labor, population urbanization, and sustainable economic growth in China. Sustainability 2020, 12, 4860. [Google Scholar] [CrossRef]
- Kuznets, S. Economic growth and income inequality. Am. Econ. Rev. 1995, 45, 1–28. [Google Scholar]
- Guo, Y.; Zhao, Y.Q. Review on the relationship between urbanization evolution and economic growth. Econ. Perspect. 2009, 1, 109–114. [Google Scholar]
- Li, T.L.; Li, C.G. Response and feedback urbanization to the development of industrial strcture. Urban Probl. 2003, 5, 50–55. [Google Scholar]
- Dewick, P.; Green, K.; Fleetwood, T.; Miozzo, M. Modelling creative destruction: Technological diffusion and industrial structure change to 2050. Technol. Forecast. Soc. Chang. 2006, 73, 1084–1106. [Google Scholar] [CrossRef]
- Ades, A.F.; Glaeser, E.L. Trade and circuses: Explaining urban giants. Q. J. Econ. 1995, 110, 195–227. [Google Scholar] [CrossRef]
- Ye, Y.M. System obstacles and improvement to urbanization in China. J. Renmin Univ. China 2001, 5, 32–38. [Google Scholar]
- National Development and Reform Commission; Ministry of Housing and Urban-Rural Development. The Development Plan for Yangtze River Delta Urban Agglomeration; National Development and Reform Commission & Ministry of Housing and Urban-Rural Development: Beijing, China, 2016. [Google Scholar]
- National Development and Reform Commission; Ministry of Housing and Urban-Rural Development. The Development Plan for the middle reaches of the Yangtze River Urban Agglomerations; National Development and Reform Commission & Ministry of Housing and Urban-Rural Development: Beijing, China, 2015. [Google Scholar]
- National Development and Reform Commission; Ministry of Housing and Urban-Rural Development. The Development Plan for Chengdu-Chongqing Urban Agglomerations; National Development and Reform Commission & Ministry of Housing and Urban-Rural Development: Beijing, China, 2016. [Google Scholar]
- National Development and Reform Commission; Ministry of Housing and Urban-Rural Development. The Development Plan for Harbin-Changchun Urban Agglomerations; National Development and Reform Commission & Ministry of Housing and Urban-Rural Development: Beijing, China, 2016. [Google Scholar]
- Yao, S.M.; Zhou, C.S.; Wang, D.; Xiu, C.L.; Wang, C.X.; Chen, M.X. New Perspectives on Urban Agglomerations in China; Science Press: Beijing, China, 2016. [Google Scholar]
- National Development and Reform Commission; Ministry of Housing and Urban-Rural Development. The Development Plan for Central Plain Urban Agglomeration; National Development and Reform Commission & Ministry of Housing and Urban-Rural Development: Beijing, China, 2016. [Google Scholar]
- National Development and Reform Commission; Ministry of Housing and Urban-Rural Development. The Development Plan for City Agglomerations in the Guanzhong Plain; National Development and Reform Commission & Ministry of Housing and Urban-Rural Development: Beijing, China, 2018. [Google Scholar]
- National Development and Reform Commission; Ministry of Housing and Urban-Rural Development. The Development Plan for Beibu Gulf Urban Agglomeration; National Development and Reform Commission & Ministry of Housing and Urban-Rural Development: Beijing, China, 2017. [Google Scholar]
- National Development and Reform Commission; Ministry of Housing and Urban-Rural Development. The Development Plan for the Hohhot-Baotou-Ordos-Yulin Urban Agglomeration; National Development and Reform Commission & Ministry of Housing and Urban-Rural Development: Beijing, China, 2018. [Google Scholar]
- Urban Social and Economic Investigation Department of National Bureau of Statistics. China City Statistical Yearbook 2006; China Statistics Press: Beijing, China, 2007. [Google Scholar]
- Urban Social and Economic Investigation Department of National Bureau of Statistics. China City Statistical Yearbook 2011; China Statistics Press: Beijing, China, 2011. [Google Scholar]
- Urban Social and Economic Investigation Department of National Bureau of Statistics. China City Statistical Yearbook 2016; China Statistics Press: Beijing, China, 2016. [Google Scholar]
- Urban Social and Economic Investigation Department of National Bureau of Statistics. China City Statistical Yearbook 2018; China Statistics Press: Beijing, China, 2019. [Google Scholar]
- Ministry of Housing and Urban-Rural Development of the People’s Republic of China. China Urban-Rural Construction Statistical Yearbook 2005; China Statistics Press: Beijing, China, 2006. [Google Scholar]
- Ministry of Housing and Urban-Rural Development of the People’s Republic of China. China Urban-Rural Construction Statistical Yearbook 2010; China Statistics Press: Beijing, China, 2011. [Google Scholar]
- Ministry of Housing and Urban-Rural Development of the People’s Republic of China. China Urban-Rural Construction Statistical Yearbook 2015; China Statistics Press: Beijing, China, 2016. [Google Scholar]
- Ministry of Housing and Urban-Rural Development of the People’s Republic of China. China Urban-Rural Construction Statistical Yearbook 2017; China Statistics Press: Beijing, China, 2018. [Google Scholar]
- Library Society of China. China Library Yearbook 2005; Modern Press Co., Ltd.: Beijing, China, 2006. [Google Scholar]
- Library Society of China; National Library of China. China Library Yearbook 2010; National Library of China Publishing House: Beijing, China, 2010. [Google Scholar]
- Library Society of China; National Library of China. China Library Yearbook 2015; National Library of China Publishing House: Beijing, China, 2016. [Google Scholar]
- Library Society of China; National Library of China. China Library Yearbook 2017; National Library of China Publishing House: Beijing, China, 2018. [Google Scholar]
- Li, Y.L.; Hu, M.; Ma, Y.F. Analysis on coupling degree of coordination between flow of inbound tourism in Xinjiang and regional economic. Resour. Dev. Mark. 2013, 29, 418–421. [Google Scholar]
- Wang, J.F.; Zhang, T.L.; Fu, B.J. A measure of spatial stratified heterogeneity. Ecol. Indic. 2016, 67, 250–256. [Google Scholar] [CrossRef]
- Wang, J.F.; Xu, C.D. Geodetector: Principle and prospective. J. Geogr. Sci. 2017, 72, 116–134. [Google Scholar]
- Ma, Y.M.; Wu, Y.M.; Wu, B.J. Comprehensive evaluation of sustainable urban development of Yangtze river delta based on entropy method and quadrant method. Econ. Geogr. 2015, 35, 47–53. [Google Scholar]
- Chen, M.X.; Lu, D.D.; Zhang, H. Comprehensive evaluation and the driving factors of China’s urbanization. J. Geogr. Sci. 2009, 64, 387–398. [Google Scholar]
- Zhu, J.W.; Xie, X.T.; Li, X.H. A solution to the problem of ecological environmental carrying capacity evaluation: A case study of Henan province. Acta Ecol. Sin. 2017, 37, 7039–7047. [Google Scholar]
- Yu, Y.; Zhao, W.; Martinez-Murillo, J.F.; Pereira, P. Loess Plateau, from degradation to restoration. Sci. Total. Environ. 2020, 738, 140206. [Google Scholar] [CrossRef]
- Peng, J.; Wu, J.S.; Pan, Y.J.; Han, Y.N. Evaluation for regional ecological sustainability based on PSR model: Conceptual framework. Prog. Geogr. 2012, 31, 933–940. [Google Scholar]
- Ren, Y.W.; Cao, W.D.; Zhang, Y.; Su, H.F.; Wang, X.W. Temporal and spatial coupling characteristics of urbanization and ecological environment of three major urban agglomerations in the Yangtze river economic belt. Resour. Environ. Yangtze Basin. 2019, 28, 2586–2600. [Google Scholar]
- Cui, M.H. The relationship of coupling coordination between urbanization and ecological environment: A case of urban cluster in the central plains. Econ. Geogr. 2015, 35, 72–78. [Google Scholar]


Publisher’s Note: MDPI stays neutral with regard to jurisdictional claims in published maps and institutional affiliations. |
© 2020 by the authors. Licensee MDPI, Basel, Switzerland. This article is an open access article distributed under the terms and conditions of the Creative Commons Attribution (CC BY) license (http://creativecommons.org/licenses/by/4.0/).