Abstract
This study developed a comprehensive framework for vulnerability assessment as a tool to measure vulnerability at three levels of geopolitical units in the Philippines. This is a comprehensive multi-disaster framework that can provide information to a decentralized type of government system like the Philippines. The vulnerability assessment framework (VAF) that has been developed was anchored upon the IPCC model and used the integration of community-based monitoring system (CBMS) data, expert inputs, and a series of community-based activities such as consultative fora, focus group discussions, workshops, and risk reduction immersion activities. The developed VAF for the assessment of vulnerability indices (VIs) is a system framework composed of a vulnerability scoping diagram (VSD) and an expanded vulnerability assessment model (VAM). The VSD is composed of three dimensions (e.g., exposure, sensitivity, resiliency), seven identified hazards, with 26, 27, and 29 sub-indicators for household, barangay, and municipal levels, respectively. Measuring vulnerability can be an effective strategy for assessing the potential impact/s of natural disasters on society. The continuous occurrence of natural disasters in the Philippines requires enhancement of public understanding of vulnerability. This would provide transparent understanding and enhance community competency leading to the development of methodologies and tools to assess various factors and indicators of vulnerability. The information extracted from using the VAF and VSD are helpful to the local government units, especially in preparing budgets, strategies, and programs for disaster risk reduction.
1. Introduction
The Philippines is one of the most disaster-prone countries in the world. It has endured a total of 283 natural disasters over the past two decades (i.e., 1995–2015) [1]. According to the Global Climate Index, the Philippines is considered as the fifth most affected country in terms of extreme weather events from 1998–2017 and ranked third among 172 countries on its risk level to disasters [2,3]. In 2017 alone, the country experienced 22 major natural events and disasters, which affected 850,000 families and destroyed almost 12,000 houses, resulting in 7.3 billion pesos in damage costs [4]. In light of these recorded disasters and damage costs in the Philippines, measuring community vulnerability is a crucial task towards developing effective risk reduction strategies and the promotion of a culture of disaster resilience [5]. Several frameworks have been developed over the past years to measure vulnerabilities to climate change. However, these were conceptualized from its geography roots and natural disasters research to a variety of other research contexts such as ecology, public health, poverty and development, sustainability science, and related others [6,7]. Thus, the risks and vulnerability reduction framework of a certain country is anchored upon specific disaster event/s, geographical location, and regional conditions [8].
The risks and vulnerability reduction framework can also be described by four dimensions [9] such as the government system, attribute of concern, hazard, and temporal reference. This type of framework is used to describe the system of analysis that refers to the coupled human–environment system, a population group, an economic sector, a geographical region, or a natural system. The attribute of concern, which is defined as the valued attribute of the vulnerable system, may be affected by the hazard, which could potentially damage the system of analysis. The vulnerability assessment should clearly define the temporal reference, which is the point in time or time period of interest [9]. Using this nomenclature, one can fully describe a vulnerable situation. An example of fully qualified descriptions of vulnerability is the vulnerability of the agriculture sector in a specific mountain region to climate change over the next 20 years [9,10,11] and the framework that utilizes various vulnerability factors [11] that are relevant in disaster risk reduction. These factors are: (a) physical, economic, social, and environmental. The physical factors describe the effects of exposure to hazard/s of tangible vulnerable elements. The economic factors focus on the description of economic resources of individuals, population groups, and communities that are or would be adversely affected during a disaster. The social factors are those non-economic factors that describe the well-being of individuals, population groups, and communities, such as the level of education and access to basic human rights. The environmental factors describe the state of the environment within the region.
Another framework of vulnerability was developed by Moss et al., [12] which used three dimensions of vulnerability to climate change. These are (a) physical–environmental dimension; (b) socio-economic; and (c) external assistance. The physical–environmental dimension refers to the climatic conditions in the region and to the biophysical impacts of climate change. The socio-economic dimension refers to the region’s capacity to recover from extreme events and adapt to change over the longer term. The external assistance refers to the degree to which a region may be associated in its attempts to adapt to change through its allies and trading partners, diasporic communities in other regions, and international arrangement to provide aid [12].
The hazard vulnerability assessment is another framework that is composed of three distinct elements namely: exposure, impact, and damage assessments. Exposure assessment involves the identification of the risk source including magnitude, frequency of occurrence, and spatial impact. The impact assessments look at the consequences of a particular hazard or stressor on a population, while damage assessment tries to define the direct and indirect losses associated with a particular event [13]. On the other hand, the environmental vulnerability index (EVI) and environmental sustainability index (ESI) were developed to understand the vulnerability and sustainability competency, respectively, of a certain area. The EVI was developed to examine vulnerability to environmental change based on 50 biophysical or natural environment indicators, which are grouped into three indices, namely, hazards, resistance, and damage. The scale of analysis is at country level, with the emphasis on small island developing states [14,15], whereas the ESI assesses the sustainability of nations based on five core components, namely, environmental systems, environmental stresses, human vulnerability to environmental stresses, social and institutional capacity, and global stewardship [16]. The ESI uses 76 variables reduced to 21 sub-indices to create an overall sustainability score by summing each sub-index, then taking the average. Another index that was developed was the prevalent vulnerability index (PVI). The PVI is a social vulnerability index that focuses on social, economic, institutional, and infrastructural capacity to recover from natural hazards or the lack thereof [17]. The PVI recognizes 24 indicators ranging from the percentage of population that lives in poverty to the amount of insured infrastructure and built environment expressed as a percentage of the GDP. Further, a vulnerability–resilience indicator (VRI) prototype model was developed by Moss et al. [12] to assess the ability of different groups to adapt and cope with climate change in 38 different countries using environmental and social indicators.
In the study of Garcia et al. [18], different types of vulnerability framework, which are attributed to a variety of causes, have been derived, such as social or social-demographic; economic or socio- economic; and environmental or biophysical. In the latter category, numerous contributions since the 1980s have focused on natural disasters and resulting food shortages, which was also reviewed in the work of Campos-Vargas et.al [19]. In terms of measuring vulnerability, Mateos [20] developed a new methodology by identifying only eight categories of variables, namely demography, identity, economic capital, human capital, social capital, material conditions, urban environment, and governance.
Another research area expanding around the world is the environmental justice framework, where the vulnerability of the disadvantaged groups such as poor, minority, and disenfranchised populations was analyzed with respect to environmental hazards like toxic chemicals, contaminated air and water, unsafe workplaces, and other environmental hazards [21]. In particular, the study of Moreno-Jimenez et al. [22] found that there are worrying levels of over-exposure to high concentrations of NO2 in both Madrid and Barcelona, a situation that is totally unacceptable. In Madrid, the elderly, Latin Americans, and Asians suffer from environmental injustice; while in Barcelona, all the groups of immigrants suffer disproportionate exposure. The disproportionate effect on the weakest or most vulnerable populations should be avoided [23], and the environmental “burdens” (hazards, degradation, discomfort, unhealthy conditions, etc.) should be borne equally by a diversity of socio-demographic groups across space in a nondiscriminatory manner.
The Intergovernmental Panel for Climate Change (IPCC) Third Assessment Report provides another framework for vulnerability, which is defined as the degree to which a system is susceptible to, or unable to cope with, the adverse effects of climate change, including climate variability and extremes [24]. In this framework, vulnerability is a function of the character, magnitude, and rate of climate variation to which a system is exposed, its sensitivity, and its adaptive capacity [25]. This framework has been adopted by a number of studies, because the notions of exposure, sensitivity, and adaptive capacity have been considered as the key pragmatic aspects/parameters of vulnerability studies [26]. Although some assessments based on IPCC vulnerability framework have proliferated, the application of those vulnerability aspects still varies depending on the focus and scope of analysis. For instance, the eco-environmental vulnerability assessment studies focus on identifying priority regions where natural environments, ecosystems, and biophysical systems are threatened [27,28,29]. On the other hand, the assessment of socio-economic vulnerability focuses more on quantifying physical structures, economic sectors, or affected social communities [8]. This framework seeks to define ranges of community adaptive capacity or adaptability, so that the levels of potential damages can be estimated and plans can be designed to minimize those damages [30,31,32,33].
The application of the IPCC model is significant for overall vulnerability assessment, since it can present the exact level of vulnerability. In fact, the 2016 World Risk Report adopted the components of the IPCC model, namely, the exposure, sensitivity, and adaptive capacity for the creation of a world risk index, which classified countries based on the composite index [34]. Thus, this study is adopting the IPCC model to develop a comprehensive framework to assess the continuous occurrence of natural disasters in the Philippines, where people are constantly exposed to the possibility of death, and their livelihoods and economic bases are highly susceptible to harm. There have been attempts to measure vulnerability in the Philippines, but the framework focused on the factors that determine the vulnerability of a system to a specific disaster. In addition, most vulnerability frameworks failed to incorporate the internal or external properties of the vulnerable system, which typically reflect the geographical boundaries or the power to influence [9]. Specifically, this refers to the local or national level of assessment, which was not explicitly defined in the IPCC model. Therefore, this study would develop a framework that can measure vulnerability caused by major natural disasters and is assessed at the local and national levels. The framework for vulnerability assessment presented here is intended to be a useful tool for local and national governments engaged in vulnerability assessments and disaster risk reduction. In addition, this framework can provide information on the impacts of various natural disasters to the community and how these impacts can be mitigated.
2. Materials and Methods
This comprehensive multi-disaster framework is intended for a decentralized type of government system.
2.1. The Study Area
The study area is the Philippines, which is composed of small islands and a decentralized form of government system. This study covers the three geopolitical units: household, barangay, and municipality/city. The household is the smallest geopolitical unit described in this study. It is composed of the head of the family and its family members, averaging to 3–5 members. A barangay is a small territorial and administrative district in the Philippines lead by a Barangay Chairman with 15 officials. Under the Local Government Code of 1991, the barangay is the basic political unit and serves as the primary planning and implementing unit of government policies, plans, programs, projects, and activities in the community [35]. Hence, barangays and local government unit (LGU) officials are the first responders in every disaster event. Table 1 summarizes studies according to exposure to disasters at geopolitical level.

Table 1.
Various studies on disasters and community exposure to hazards.
A barangay is a forum where collective views of the people may be expressed, crystallized, and considered and where disputes may be amicably settled. These activities are covered under the Local Government Code of 1991. This same code states that the municipality, consisting of a group of barangays, serves primarily as a general purpose government for the coordination and delivery of basic, regular, and direct services and effective governance of the inhabitants within its territorial jurisdiction. The city, consisting of more urbanized and developed barangays, serves as a general-purpose government for the coordination and delivery of basic, regular, and direct services and effective governance of the inhabitants within its territorial jurisdiction. In some cases, certain higher income cities are autonomous (independent) and classified as highly urbanized cities, whereas the rest are component cities that, like municipalities, are under the provincial supervision [63]. With the implementation of the local government code, local government units (LGUs) have been given the authority to make vital decisions in governing their local communities and assumed new and wider roles in local governance through innovation and changes in the local structures including disaster governance [64].
2.2. The Vulnerability Assessment
A five-phase research methodology was performed for vulnerability assessment in the Philippines, as shown in Figure 1. Phase 1 starts with problem definition and identification of the system boundary. Phase 2 is the expansion of the adopted Intergovernmental Panel on Climate Change (IPCC) Model [24] that defines vulnerability as a function of exposure, sensitivity, and resiliency. The expansion includes the three levels of assessment in the conceptual model for vulnerability assessment. In Phase 3, the different indicators including the sub-indicators per vulnerability dimension were identified. In Phase 4, the source data were identified, and the availability of the data for the indicators and sub-indicators were validated. Phase 5 focused on the process, such as consultative fora and workshops, to assess additional data and determine the weights distribution for the vulnerability indicators and sub-indicators. The subsequent sections explore the details of the five-phases of the vulnerability assessment.
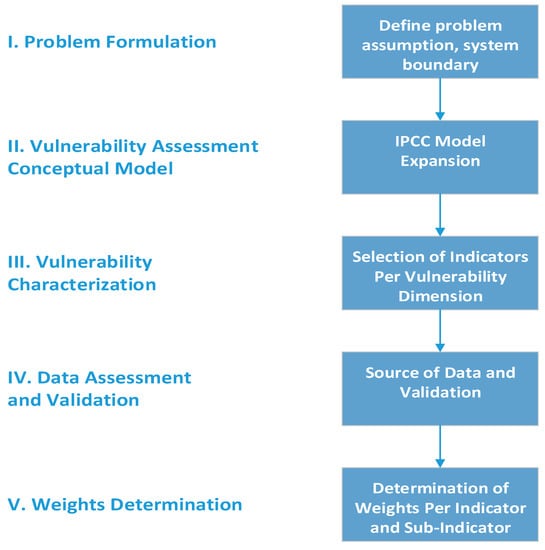
Figure 1.
The five-phase research methodology for vulnerability assessment.
2.2.1. Phase 1—Problem Formulation
The “problem formulation” process utilized the information/data in the related literature, collating the insights from experts working on vulnerability assessment and assessing the needs and requirements of the local community in the Philippines. This was carried out to identify the issues that were relevant and critical in developing the vulnerability assessment framework of the Philippines based on exposure to disasters and geopolitical levels.
2.2.2. Phase 2—The Conceptual Model
The IPCC Model was adopted, and the scope and details of each dimension component were expanded to provide the vulnerability context. The exposure of the Philippines to natural disaster was classified as hydrometeorological and geological. This is due to the geographical location of the Philippines, which is at the West Pacific Basin and Circum-Pacific Seismic Belt. The disasters caused by atmospheric disturbances such as typhoons, tornadoes, and water spouts together with its secondary phenomena such as floods and storm surges were considered as meteorological disasters. The geologic disasters considered were those described by Balce and Ramos [65]. These are disasters that involve the energy transformation of masses of soils, rocks, and water such as earthquakes and volcanic eruptions. Tsunamis and landslides were considered subsequent events of earthquakes or volcanic eruptions.
2.2.3. Phase 3—Vulnerability Characterization
Sets of indicators and sub-indicators were identified and listed for each vulnerability dimension (i.e., exposure, sensitivity, and resilience). The selection of these indicators and sub-indicators followed the Deressa et al. [66] approach. This was based on criteria such as relevance, representativeness, availability, and replicability.
Exposure Indicators
Consultative fora, meetings, various focus group discussions, and workshops were carried out in small islands and big cities in the Philippines to assess the actual experiences of the population to natural hazards as representative of the various small and big islands in the Philippines. The hazards experienced by the population were listed, summarized, and compared with the past relevant studies on natural disasters such as those of Rothenberger [67], Toda et al. [36], De los Reyes et al. [68], and Atienza et al. [69]. Information from these studies was used to validate and finalize the list of exposure indicators.
Sensitivity Indicators
A dose-response approach was adopted to determine the sensitivity indicators of households to natural disaster. In this study, demographics and livelihood were considered as sensitivity indicators, as they reflect the degree of population [57] and income [37] structure of the households. These indicators were considered to potentially and significantly affect the households.
Resiliency Indicators
The determination of resiliency indicators followed the approach of Hallegatte et al. [70] and Bolletinno [71] and was coupled with the secondary assessment of data. The resiliency indicators were identified as types and numbers of resources such as soft skills, social security, physical/tangible assets (real properties), appliances, vehicles, insurance coverage, cooperative membership, and social organization membership. These are resources that the household could utilize in case of a disaster that adversely affects their normal life to help them recover, prepare for future shocks or disasters, and adapt to changes in the environment. Hence, the process includes the secondary data assessment from the community-based monitoring system (CBMS) information and the derived data during community-based activities, which are elaborated by Section 2.2.4.
2.2.4. Phase 4—Data Assessment and Validation
The data assessment and validation were carried out using the Philippines CBMS. This was used as the primary source of information due to its nationwide household level coverage. CBMS captures the multi-dimensional aspects of poverty and welfare status of the population. Some of the household coordinates were retrieved from CBMS and some were assessed and validated using the GPS Garmin Montana 650 model. Household proximity to rivers, fault lines, coastlines, and volcanoes was determined using the equidistant and/or centerline method with the aid of ArcMap 10.7.1.
Consultative meetings, focus group discussion (Figure 2), and immersion in the provincial interagency local disaster risk reduction and management council meeting/s during an actual natural disaster event were carried out. This was to assess additional data and identify as well as determine the process of coordination and flow of information in the three levels of geopolitical units. Further, it helped determine how the information was disseminated to regional and national risk reduction and civil defense offices. It was also a venue where stakeholders expressed their real-world experiences, which added on to data collected from CBMS.
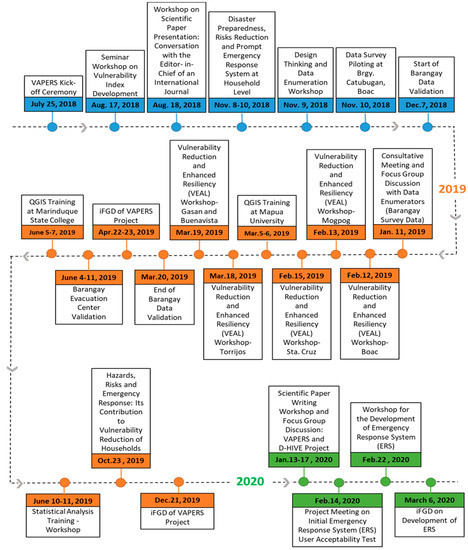
Figure 2.
The series of focus group discussions and workshops carried out within July 2018–March 2020 as part of the development of the vulnerability assessment framework at three geopolitical units in the Philippines.
2.2.5. Phase 5—Weights Determination
Two major approaches for weights determination are being used, namely the unequal weighting (also referred as differential weighting) and the equal weighting. Unequal weighting is used when there is sufficient knowledge and understanding of the relative importance of index components, whereas equal weighting is typically applied when the differences in component significance or the trade-offs between dimensions are poorly understood [72,73,74]. Most studies utilized unequal weighting methods such as the application of statistical procedures like principal component analysis (PCA) and factor analysis, the use of regression coefficients, data envelopment analysis (DEA), the benefit-of-the-doubt (BOD) method, multiple criteria decision analysis (MCDA), and the participatory-based method [74,75,76].
In this study, the participatory-based method was applied, by which opinion of experts and key stakeholders were considered. This method was adopted as it fosters multi-stakeholder participation, which can generate information and insights that can help build consensus among key sectoral stakeholders and can promote collaborative formulation of coordinated development and disaster risk adaptation strategies. The process employed was a combination of 11 focus group discussions (FGDs) and 13 workshops (WSs) at the study sites shown in Figure 2. The FGDs and WSs were used as venue to explain the concept of vulnerability, its dimensions, and indicators using the local dialect.
To compute for the weights, participants were given a questionnaire to rank the level of importance of each indicator based on the participants’ perception and actual experiences. Then, they were instructed to rate the possible effect/s of the indicator (i.e., exposure, sensitivity, resiliency) to the overall vulnerability level. Table 2 was used as template questionnaire elaborating indicators and sub-indicators with the level of effects ranging from 1–5 with the number 5 as the highest score. The weight for each vulnerability indicator was obtained by computing first the total score, which is the number of participants that choose the level of effects multiplied by its corresponding rating score. Then, the weight was computed by taking the total score of a particular indicator over the aggregated total score for all indicators. Table 3 shows how the weights for the vulnerability indicators were computed. In computing the weights for the sub-indicators, the same procedure was adopted.
Table 2.
Questionnaire template.
Table 3.
Weights computation for the vulnerability indicators.
Where E1, E2, E3, S1, S2, S3, R1, R2, R3 = number of participants that choose a specific level of effects H, M, N = rating score
To place all data on the same scale and normalize the values of all indicators and sub-indicators within the range 0 to 1, linear scale transformation of data was carried out following Nguyen et al. [8] and Mendoza et al. [77] and using Equation (1).
where:
- Nij = the normalized value of indicator i of household j in the case of the household vulnerability analysis;
- Xij = the original value of indicator i of household j in the case of the household vulnerability analysis;
- Ximin = the lowest value among all households;
- Ximax = the highest value among all households.
3. Results
This section presents the results obtained from the research methodology described in Section 2. In the process of problem formulation (Phase 1), Figure 3 elaborates the data gathered on the human cost of natural disasters and the various hazards affecting the three levels of geopolitical units. Evidently, as shown in Figure 3, the continuous occurrence of natural disasters has been associated with deaths and heavy economic loss. The cost of these natural disasters during the period of 2000–2016 reached more than 23,000 deaths, affected roughly 125 million people, and caused almost $20 billion in economic losses. Results elaborated in the subsequent sections are useful in similar small island states experiencing similar disaster events.
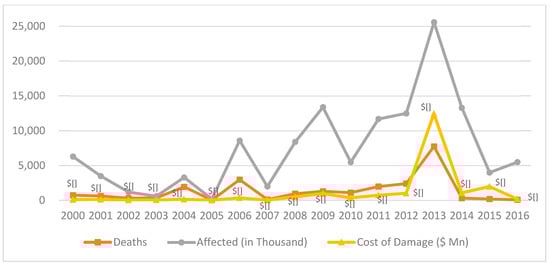
Figure 3.
Human cost of natural disasters (Note: Natural disasters covered include drought, earthquakes, epidemics, floods, mass movements (dry and wet), storms, and volcanic eruptions [43]) in the Philippines, 2000–2016.
Various studies, in Table 1 of Section 2, showed that the analysis of vulnerability was mostly based on the IPCC Model, disaster specific, and assessed at a particular geopolitical level. For instance, Mendoza [77] adopted the IPCC framework to analyze the community and household vulnerability in Kanpong Speu in Cambodia, Laguna province in the Philippines, and Thua Thien Hue in Vietnam. In this study, vulnerability was analyzed based on exposure to five (5) climate-related disasters, namely typhoon, flood, drought, flash flood, and extreme cold. The study by Solin et al. [38] assessed the household vulnerability to flood hazards in the six villages of the upper Myjava basin in Slovenia. They analyzed vulnerability using the three basic aspects of vulnerability, namely (1) susceptibility of the household’s property to damage, (2) propensity of the household members to suffer physical and mental harm, (3) the household’s ability to cope with the negative impacts of flood. In the study by Ado et al. [39], they analyzed household vulnerability to climate change in Aguie district in Niger by measuring exposure index using the principal component analysis method to summarize natural disasters’ proxies into one index. The climate sensitivity index was constructed using dryness and soil degradation indices, while the biophysical and socio-economic factors that influence household production were used to construct the adaptive capacity index.
The study by Ignacio et al. [40] analyzed the effects of Tropical Storm Washi in southern Philippines that occurred in 2011. Social vulnerability indices were developed to establish relationships between the derived vulnerability measurements, the flood exposure, and the impacts of coastal flash floods triggered by Tropical Storm Washi. Another study developed a modified social vulnerability index using socioeconomic data drawn from the census and was computed from 11 indicators influencing exposure, sensitivity, and adaptive capacity [36]. This study used geographic information system (GIS) tools to characterize the social vulnerability to climate-related hazards of barangays in Tacloban City and Ormoc City. In addition, Balica et al. [41] developed a Coastal City Flood Vulnerability Index (CCFVI) in nine cities around the world based on hydro-geological, socio-economic, and political–administrative indicators. The development of CCFVI is to create a readily understandable link between the theoretical concepts of flood vulnerability and the day-to-day decision making process. The abovementioned scale of analysis was mostly in the village or barangay level, with some going into municipal or regional levels. This scenario places certain level of government units blind on the vulnerability situation at household level, which affects their area of governance such as the effectiveness of the decisions for prompt emergency response. The landscape of literature suggests that studies about flood are more prevalent among researchers, which was rationalized by the 6.8 million deaths in the 20th century that made flood the leading cause of natural disaster deaths [78,79]. In the Philippines, typhoons surpass all disasters in the country in terms of highest number of fatalities, people affected, and economic damage. In particular, Typhoon Yolanda (or Haiyan), which is one of the strongest ever recorded, made landfall in central Philippines in 2013, resulting in more than 7000 deaths and an economic loss of over US$13 billion dollars [36,69]. However, aside from typhoons, other natural disasters are continuously occurring and affecting the lives and livelihoods of Filipinos. The recent eruption of Taal Volcano affected 736,802 people, destroyed 14,082 houses, and caused 3.4 billion pesos worth of damage to infrastructure and agriculture [80]. Hence, the developed VAF can play a significant role in assessing the impact of multiple disasters in a decentralized government system.
Information gathered showed that some empirical considerations about the Philippines’ vulnerability are as follows: (a) cities and municipalities are affected by more than one disaster risk; (b) local government units are decentralized and have their own requirement for vulnerability information; (c) there are a potentially limitless number of indicators and sub-indicators for each vulnerability dimension; and (d) there are different methodologies for weight identification and aggregation of indicators. This includes the flow of information and how data have been cascaded from household to national level.
3.1. The Expanded Vulnerability Assessment Model
The IPCC model was expanded based on the results of activities elaborated in Section 2.2. This incorporates the three vulnerability dimensions (i.e., exposure, sensitivity, and resiliency) and the need for the inclusion of a data framework and data flow through different levels of local geopolitical units as it reaches the national agencies, as illustrated in Figure 4. It was also cited in the work of Fussel [9] that the IPCC model lacks the integration of a sphere or the scale of assessment. The sphere refers to the internal or external geographical boundaries or the power to influence, which in this case are the three levels of geopolitical units. These geopolitical units follow the political structure of the local government, starting at the village-level barangays, then followed by the cities or municipalities, and finally the provincial level. The expanded vulnerability assessment model follows the three levels of geopolitical units as seen in Figure 4, which represent the scale of vulnerability assessment starting at the household level.
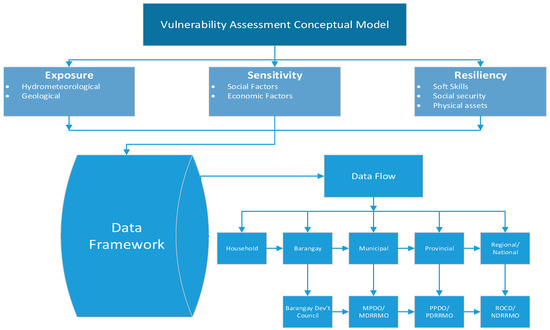
Figure 4.
The vulnerability assessment conceptual model designed for the Philippines. This is an expanded vulnerability assessment model (VAM), which is anchored upon the IPCC model, which elaborates the inclusion of three dimensions, i.e., exposure, sensitivity, and resiliency. The VAM is designed for multi-hazards with various geopolitical levels.
Household level data were consolidated to obtain the barangay level data. Then, the consolidated barangay level data were submitted to the city or municipality office, e.g., the municipal disaster risk reduction and management office and the municipal planning and development office, for monitoring and proper intervention whenever necessary. The information curated at municipal or city level is then cascaded to the provincial, regional, then national level through the regional office of the civil defense (ROCD). The ROCD does the consolidation of data that are being transmitted to the National Defense Office, and the National Disaster Risks Reduction and Management Office. These are then made available to the disaster risk reduction officers and macro-economic planners to serve as inputs in their design of disaster risk reduction policies, strategies, and programs. The vulnerability assessment process describes the components of each vulnerability dimension with explicit inclusion of influencing powers in a geopolitical unit, and provides a comprehensive flow of information dissemination through all levels of geopolitical units.
3.2. The Vulnerability Frameworks
The three dimensions, i.e., exposure, sensitivity, and resiliency, of vulnerability elaborate the major potential factors directly affecting every dimension. Hence, a data framework was created, shown in Figure 5, and labelled as the vulnerability scoping diagram (VSD). The VSD is composed of 15 indicators of which seven, two, and six are for exposure, sensitivity, and resilience, respectively. It contains 27 sub-indicators for the exposure dimension, 21 for sensitivity, and 34 for resilience. It has 26 and 29 sub-indicators for the barangay and municipal levels, respectively. Therefore, the VAM with VSD could be a comprehensive vulnerability assessment framework (VAF), illustrated in Figure 6, which is a multi-hazards with multi-levels of geopolitical units type of framework. The adoption of VAF by local government units generates local vulnerability indices, which could help in the program implementation to mitigate the effects and impacts of natural disaster in their respective areas, prepare for programs that would reduce the risks, and improve the adaptation capability that would enhance the resiliency of the communities. The VAF clearly includes exposures of the country to multiple hazards such as typhoons, tornadoes, earthquakes, volcanic eruptions, floods, storm surges, and landslides. The inclusion of these hazards in the VAF captures the effects of these hazards on the households and the community. The responsiveness of the households and the community is captured by the sensitivity dimension of vulnerability. Figure 5 (with Table 4) shows that sensitivity is divided into two components, namely, demographic and livelihood. The demographic component addresses the household/community relationship through identified indicators. The target data sets that could be extracted would illustrate the effects of having vulnerable members who usually are senior citizens, people with disability, infants and children, and pregnant and lactating mothers.
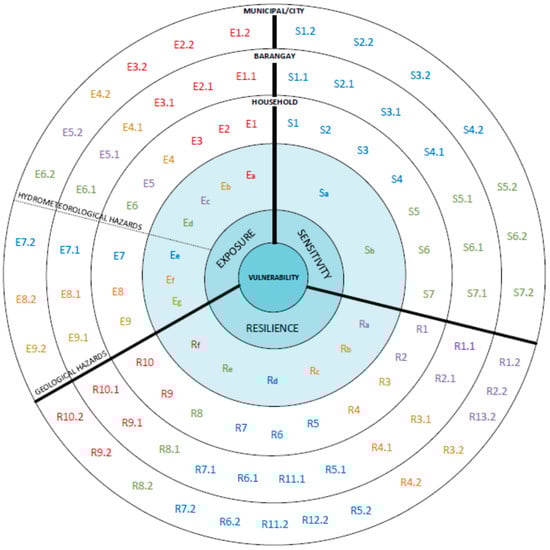
Figure 5.
The VSD that contains the indicators per natural hazard per geopolitical level in the Philippines. Definition of variables/codes is illustrated below as Table 4.
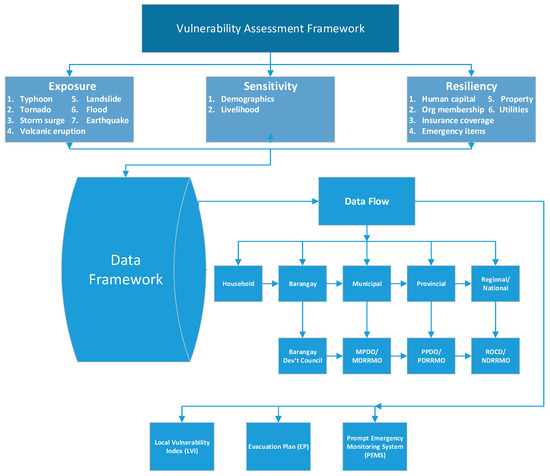
Figure 6.
The total composition of the vulnerability assessment framework designed for multi-hazards and a decentralized type of government.
Table 4.
The Legend: Definition of Codes and Variables for Vulnerability Scoping Diagram.
The livelihood component addresses the amount of income of the household based on the source/s, which can be classified as nature-based and non-nature based income. Nature-based income is those activities that rely on the use of natural resources such as crop farming, gardening, livestock, poultry raising, fishing, forestry, and hunting. These activities are significantly affected during disasters. The non-nature based income is those activities that do not rely on natural resources such as trading, wholesale, retailing, manufacturing, transportation, construction, among other similar activities.
The third dimension of vulnerability is resiliency, which is a coping mechanism to sensitive sectors who, when exposed to natural hazards, would need physical and economic assistance. Hence, community support system/s, household capabilities, household member/s competencies, available assets, insurance coverage, and social security of the household members are considered. The household member competencies refer to skills that are capable of making decisions and emergency assistance during disaster. Furthermore, the VAF provides insights on the interrelationship between disaster indicators and the affected population, which is then embedded into a risk reduction tool and becomes focal for local government officials, rescuers, emergency planners, and managers. This comprehensive framework for vulnerability assessment in the Philippines is an initiative to improve approaches for comparing and aggregating the identified impacts of disasters with multiple dimensions of indicators covering environmental, social, and economic aspects.
3.3. Data and Characterization of Indicators
The availability of data was a major consideration in the development of VAF in the Philippines. The CBMS was used among the primary sources of information on basic needs and the 14 core poverty indicators (Table 5). This information captured the multidimensional aspects of poverty and welfare status of the population including health, nutrition, housing, water and sanitation, basic education, income, employment, and peace and order.
Table 5.
The CBMS Core Poverty Indicators.
The identification of different indicators, shown in Figure 5, for each vulnerability dimension has provided the foundation for the development of VAF. These indicators were used to generate measurable variables that can aid in the assessment of vulnerabilities at three geopolitical levels such as household, barangay, and municipal.
3.3.1. The Exposure Indicators
At the household level, the exposure to typhoon and tornado can be measured based on the number of times a household has been exposed to the hazard/s. Additionally, the household vulnerability to typhoons and other disasters is also measured in terms of the construction materials in which the house was built. On the other hand, the exposure of the household to earthquakes, volcanic eruptions, storm surges, floods, and landslides is based on its proximity to fault lines, volcanoes, coastlines, bodies of water, and landslide prone areas, respectively. In the study by Nazmfar et al. [81], they used proximity to fault lines as one of the indicators to determine the vulnerability of the population and the urban buildings to various earthquake intensities in the municipality of Tehran. In fact, Sen and Ekinci [82] suggested that the population and the structure should be positioned as far as possible from the danger point in order to decrease the risk of disaster.
The exposure of the barangay to typhoons was determined using the weighted mean of the household based on their type of roof and wall materials. Unequal weights distribution for each sub-indicator was determined from various activities elaborated in Section 2 and shown on Table 6. The barangay exposure to landslides and tornadoes was determined by obtaining the weighted sum of the number of household exposures to these hazards. The same weighted mean process was used for the barangay exposure to earthquakes, volcanic eruptions, storm surges, floods, and landslides, but based on the household proximity instead of the number of exposures.
Table 6.
Categories for the types of wall/roof materials and their assigned weights.
The exposure indicators at the municipal level were determined using the weighted sum of the barangay. A similar process to the barangay level was carried out for the municipal level, should one aspire to determine the vulnerability of the municipality. The details of exposure indicators at three levels are illustrated in Figure 7. This is an aggregation of exposure indicators to multiple hazards at several levels of geopolitical units.
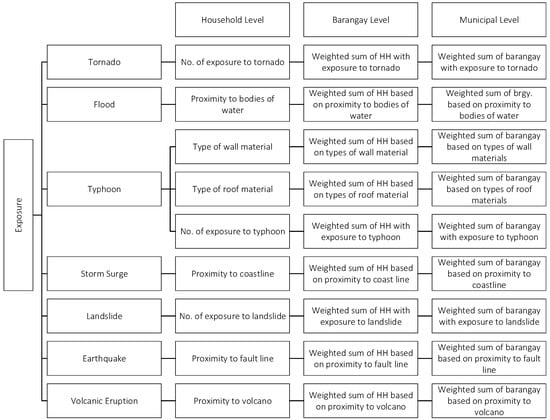
Figure 7.
The summary of the exposure indicators at household, barangay, and municipal levels.
3.3.2. The Sensitivity Indicators
The overall sensitivity indicators at household, barangay, and municipal levels are summarized and illustrated in Figure 8. These are composed of seven indicators each for household, barangay, and municipal levels. The seven household indicators to sensitivity for seven hazards are categorized into two (a) the demography that is composed of the number of senior citizens, infants and children, people with disability, pregnant and lactating mothers; and (b) livelihood composed of the income from agriculture and fishery, employment/business, and other sources such as donation/support. The indicators under demography are calculated on its weighted sum for barangay level and aggregated to municipal level. The indicators under livelihood for barangay and municipal level are the barangay/municipal income, barangay/municipal internal revenue allotment (IRA), and barangay/municipal income from other sources.
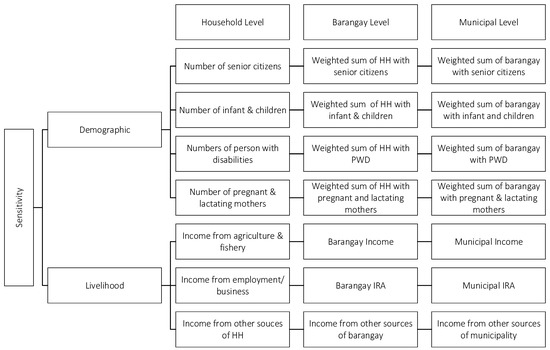
Figure 8.
The summary of the sensitivity indicators at household, barangay, and municipal levels.
3.3.3. The Resiliency Indicators
There are six primary indicators under the resiliency dimension with 10, 11, and 13 sub-indicators for household, barangay, and municipal levels, respectively, as shown as Figure 9. The six primary indicators for resiliency are human capital, insurance coverage, organization membership, property, emergency items/kits, and utilities. The sub-indicators under the household category are the highest educational attainment of the head of the family (which symbolizes the capability to make decisions), the type of potable water supply (PWS) and emergency power supply (EPS), the number of household members with emergency response skills, insurance coverage, membership to social/cooperative organizations, appliances, vehicles, emergency items, and communication devices. The indicators for barangay level are the number of educational facilities within the barangay area and the weighted sum of the aggregated information of the household level. The resiliency indicators at municipal level are the number of emergency facilities and protected areas and the weighted sum of the aggregated information of the barangay’s level of professionals, emergency responders and items, insurance coverage, membership to social/cooperative organization/s, appliances, vehicles, potable water supply, emergency power supply, communication devices, and educational facilities.
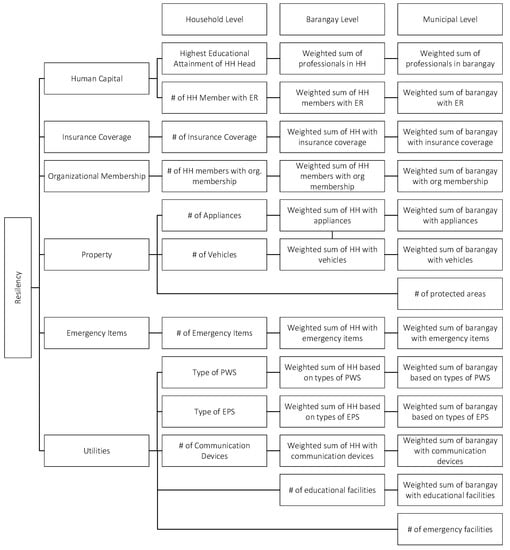
Figure 9.
The summary of the resiliency indicators at household, barangay, and municipal levels.
3.4. Weight Factor Distribution
The results of weight factor determination (Table 7) for the three vulnerability dimensions showed that exposure was recorded the highest, followed by sensitivity and then resiliency. The unequal weights for exposure, sensitivity, and resiliency are 35.19, 33.35, and 31.46 percent, respectively. The weights for the indicators and sub-indicators per vulnerability dimension are also presented in Table 6. Currently, there are no available data for storm surges and tornadoes as well as for the municipality income from other sources. The number of respondents is 346.
Table 7.
Weights per vulnerability dimension, n = 346.
3.5. Disaster Management in the Philippines
In the Philippines, disaster management started from a purely disaster response approach by focusing on the provision of assistance or intervention during or immediately after a disaster [83]. However, in an effort to improve these practices, the Philippines passed Republic Act 10121 (RA 10121) also known as the Philippine Disaster Risk Reduction and Management Act in May 2010 to provide for a strong legal and institutional basis for disaster risk reduction and management (DRRM) in the country. RA 10121 requires local government units to develop policies, plans, and implementation measures pertaining to all aspects of DRRM. The national disaster risk reduction and management (NDRRM) framework (See Figure 10) developed RA 10121 to provide a common understanding of the different aspects of DRRM and related elements and/or factors that need to be considered in developing national and local plans and programs. Furthermore, the NDRRM framework also showed the overall direction and set of priorities to delineate the fundamental elements and components of disaster risk reduction and disaster risk management in the country. In fact, the NDRRM framework indicates the paradigm shift towards a proactive and preventive approach to disaster management [84]. Although the NDRRM framework was developed to provide for a comprehensive, all hazards, multi-sectoral, interagency, and community-based approach to disaster risk reduction and management, it did not provide the mechanism on how these varied issues can be addressed. Thus, the development of VAF can complement the existing NDRRM framework by addressing the needs of the vulnerable groups in the community before, during, and after the disaster. Furthermore, the developed VAF addresses two important challenges identified in the impact assessments of the IPCC [38]. First, the VAF provides a comprehensive approach in comparing and aggregating disaster impacts across diverse sectors, population, and geopolitical units. Second, it identifies indicators and sub-indicators for use in modeling and observation, which enables sophisticated vulnerability analysis that integrates environmental, social, and economic perspectives. Thus, the developed VAF identified a comprehensive set of coherent and significant indicators and sub-indicators that can assess multiple disasters, which can be monitored over time, and which can be disaggregated to the level of the relevant geopolitical units. Assessing vulnerabilities can help governments, societies, and communities know their present condition and adapt strategies to strengthen areas where they are found to be most vulnerable in order to prepare better for the future [62].
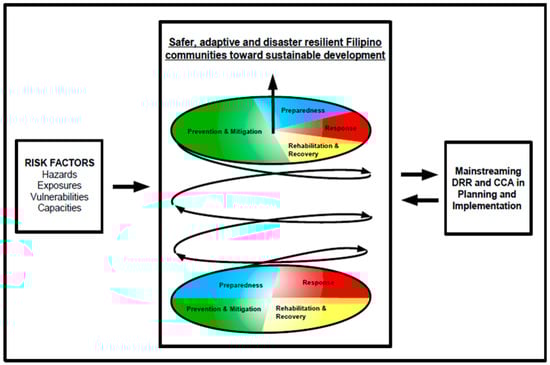
Figure 10.
National Disaster Risk Reduction and Management Framework. (Source: NDRRM Plan 2011–2028).
The VSD and VAF provide insights on the interrelationship between disaster indicators and the affected population [73], which is important to government officials due to the need for evidence-based study to support policy decisions. It provides information to better understand disaster risk through the snapshot of vulnerabilities produced by the three dimensions which integrate the potential effects/impacts of disaster. The indicators defined by social, economic, and environmental factors can help in identifying ways to reduce vulnerability to disaster by increasing people’s capacity to plan for, cope with, and recover from disasters. This approach was also emphasized by the Sendai Framework that was established in 2015. This could strengthen the LGU’s disaster risk governance because of the accountability at each level of government unit. Furthermore, having this set-up, the local government units can implement a constant dialogue with communities, especially those living in risk-prone areas, to make them fully aware of the hazards they are exposed to, and how they can best prepare for the adaptation measures.
The VAF depends heavily on the availability of data, especially at the household level, which significantly affect the implementation of the VAF. Hence, regular updating of CBMS and LGU’s households’ database plays a significant role. The bottom-up approach of the VAF strengthens the disaster risk management and governance because of the accountability at each level of local government unit (LGU).
The bottom up approach of VAF can be implemented and make local government units accountable to strengthen the disaster risk management and governance. In addition, each LGU can implement a constant dialogue with communities, especially those living in risk-prone areas, conduct awareness programs, design and implement relevant disaster governance plans [8,83], and carry out capacity building activities. The outcomes of these activities could lead to the shifting of focus in making strategies from the traditional reactive actions of disaster response and recovery to more proactive actions of risk reduction, preparedness, and mitigation [42]. The VAF can serve as a practical example of how science can provide information to stakeholders that would assist them in making guidelines for disaster risk reduction and improved disaster management [28].
3.6. The Use of Local Vulnerability Indices
When assessing the vulnerability of a social system, the assessment subject is usually the household. More recently, there has been greater emphasis on adaptation measures that are well-targeted and site-specific because of limited financial resources to implement disaster risk reduction programs [56]. One way to do geographic targeting is to determine the vulnerability level of the household, which can be measured using vulnerability indices through the developed VAF. Although geographic targeting can be done using the household level data, the main novelty of this study is that the developed VAF starts its assessment at the household level and then is consolidated at the barangay, municipal, and provincial levels, which follows the local government administrative system in the Philippines. With the developed VAF, data collected at the household level can be fully utilized at different geopolitical levels. When vulnerability of the household is determined, these can answer the following questions: (1) Who is vulnerable? (2) Where are they? (3) Why they are vulnerable? (4) What is the extent of their vulnerability? (5) How do they respond to shocks? [85]. This information can be used by the Barangay Development Council together with the Municipality/City Disaster Risk Reduction and Management Office to design, develop, and implement disaster risk and reduction management activities that are consistent with the national disaster risk and reduction management program.
3.7. The Role of the Household and the Government in Reducing Vulnerability
The set of exposure, sensitivity, and resiliency indicators provide the integrative concepts [12] that are transparent, understandable, and quantitative for the evaluation of the potential effects/impacts of disaster. The indicators defined by social, economic, and environmental factors can help in identifying ways to reduce vulnerability to disaster by increasing people’s capacity to plan for, cope with, and recover from disasters. This approach was also emphasized by the Sendai Framework that was established in 2015. This could strengthen the LGU’s disaster risk governance because of the accountability at each level of government unit. Furthermore, having this set-up, the local government units can implement a constant dialogue with communities, especially those living in risk-prone areas, to make them fully aware of the hazards they are exposed to and how they can best prepare for them. Active roles can also be assigned to all stakeholders and encourage even those vulnerable such as those persons with disabilities to participate in the development of policies that will affect them, including disaster risk evaluation and the design and implementation of relevant disaster governance plans [83]. The VSD serves as an effective vehicle for facilitating vulnerability assessment comparisons [86] and allows all indicators to be viewed at one time, which is also discussed in the work of Tuler et al. [87]. Aggregating the indicators into useful information and providing the weights for each indicator are critical requirements for vulnerability assessment. The weighting of variables takes into account their relative effects on the vulnerability level with other variables. This is also the same as the work of Malczewski [88]. Having this information, the government units can properly design and implement programs that could effectively be implemented before, during, and after disaster.
Even before the occurrence of a disaster, government can use this vulnerability information in building resilience by making an extensive investment in barangay and municipal infrastructures and services. These could be preparation for well-planned evacuation programs, well-organized shelter facilities, well-stocked relief inventories, which enable governments to prepare for the catastrophic effects of natural events [42], and people competency preparedness to manage themselves during extreme events. In fact, an emergency plan can be developed using optimization modelling in order to define the optimal evacuation policies for the population from areas under risk and uncertainty [89] to cope and respond during disaster. The proposed emergency plan can also identify the sequence of prioritization of response actions. Specifically, this plan can also develop fixed routes or destinations for the evacuation and transfer of people affected by the disaster to healthcare centers and shelters safety and rapidly. Furthermore, a route for the transportation of first-aid materials, food, equipment, and rescue personnel can also be planned to reduce casualty during the disaster. An emergency monitoring system such as a mobile application can also be created to provide the LGU prompt response action. This mobile application system can be designed and created to get real-time data to provide critical information to decision makers for systematic and appropriate interventions during disasters and to conduct rapid assessment right after disaster. This is to carry out relief operations and prepare for rehabilitation and reconstruction, with the tool to aid in making decisions as to which rehabilitation components shall be given priority.
4. Conclusions and Proposals
The development of the vulnerability assessment framework for risk reduction was designed to address multi-disasters and at three levels of decentralized geopolitical forms of government, such as in the Philippines. The five-phase research methodology of vulnerability assessment, the VAF and VSD, are useful in the implementation of disaster risk reduction programs by various municipalities, cities, and provinces not only in the Philippines but also in similar small island states experiencing similar disaster events.
The VAF was built upon the IPCC model and expanded based on the actual scenario in the Philippines. The Philippines is a small island state that has been considered as the fifth country in the world that is affected by extreme weather events and is ranked 3rd among the 172 countries for disaster risks. The VAF has three dimensions and seven identified hazards as indicators for exposure, two for sensitivity, and six for resiliency. It has 26 and 29 sub-indicators for barangay and municipal levels, respectively. It contains VSD with the data flow aggregating from household to national agency. Having the VAF as a tool for vulnerability assessment that leads to the calculation of vulnerability indices would provide the LGUs with a support system for disaster risk reduction. The VAF depends heavily on the availability of data, especially at the household level; hence, regular updating of CBMS and LGU’s households becomes necessary in the effective and accurate implementation of the VAF as a disaster risk reduction tool.
The bottom-up approach of VAF can be implemented and make local government units accountable to strengthen disaster risk management and governance. Having the available information on vulnerability, the government units can properly design and implement programs that could effectively be implemented before, during, and after disaster. Even before the occurrence of a disaster, government can use this vulnerability information in building resilience by making an extensive investment in barangay and municipal infrastructures and services.
Another research area that can be pursued is the analysis of vulnerability based on the individual effect of the disaster. Although the current study focused on the consolidated effects of the various disasters to vulnerability, the VAF is organized in such a way that it can easily identify the relevant indicators associated to a particular disaster. Furthermore, the proposed additional study could also look into the potential exposures of the vulnerable groups (children, senior citizens, pregnant women, disabled persons) to the overall vulnerability index.
In the long term, when vulnerability data from different provinces are already available, a statistical analysis on the relevance and significance of the various indicators can be performed. In this way, indicators can be reduced to only reflect those that are significant and relevant to the system.
Author Contributions
Conceptualization: R.A.C.R. and D.B.S.; methodology: R.A.C.R., D.B.S. and F.P.N.; validation: R.A.C.R., D.B.S. and F.P.N.; formal analysis: R.A.C.R. and D.B.S.; investigation: R.A.C.R., D.B.S. and F.P.N.; data curation: R.A.C.R., D.B.S. and F.P.N.; writing—original: R.A.C.R. and D.B.S.; writing—review and editing: R.A.C.R., D.B.S. and C.J.L.; visualization: R.A.C.R. and D.B.S.; supervision: D.B.S. and C.J.L.; project administration: D.B.S. and R.A.C.R.; funding acquisition: R.A.C.R. and D.B.S. All authors have read and agreed to the published version of the manuscript.
Funding
This research was funded by the Commission on Higher Education and the Department of Science and Technology–Philippine Council for Health Research and Development.
Acknowledgments
This work is part of the “Vulnerability Assessment and Prompt Emergency Response System (VAPERS) for LGU’s Disaster Risk Reduction in the Philippines” and “Development of Health Index: Vulnerability to Extreme Environmental Events for Marinduque Island” projects funded by the Commission on Higher Education (CHED) under the K to 12 Discovery-Applied Research and Extension for Trans/Inter-disciplinary Opportunities (DARE-TO) Program, and Department of Science and Technology—Philippine Council for Health Research and Development, respectively.
Conflicts of Interest
The authors declare no conflict of interest.
References
- Kreft, S.; Eckstein, D.; Melchior, I. Global Climate Index; Germanwatch: Berlin, Germany, 2017. [Google Scholar]
- Eckstein, D.; Kunzel, V.; Schafer, L. Global Climate Index; Germanwatch: Berlin, Germany, 2018. [Google Scholar]
- United Nations University—Institute for Environment and Human Security. Measuring Vulnerability to Natural Hazards: Towards Disaster Resilient Societies, 2nd ed.; United Nations University Press: New York, NY, USA, 2013. [Google Scholar]
- National Disaster Risk Reduction and Management Council. Major Natural Extreme Events and Disasters 2008 to 2017; National Disaster Risk Reduction and Management Council: Quezon City, Philippines, 2017.
- Kasperson, R.E.; Gow, K. Vulnerable Peoples and Places. In Ecosystems and Human Well-Being: Current State and Trends; Norgaard, R., Rapport, D., Eds.; Island Press: Washington, DC, USA, 2005; pp. 143–164. [Google Scholar]
- O’Brien, K.; Eriksen, S.; Schjolen, A.; Nygaard, L. What’s in a Word? Conflicting Interpretations of Vulnerability in Climate Change Research; CICERO Working Paper 2004:04; CICERO, Oslo University: Oslo, Norway, 2004. [Google Scholar]
- Gow, G.A. Policymaking for Critical Infrastructure—A Case Study on Strategic Interventions in Public Safety Telecommunications; Ashgate Publishing: Farnham, UK, 2005. [Google Scholar]
- Nguyen, K.-A.; Liou, Y.-A.; Terry, J.P. Vulnerability of Vietnam to typhoons: A spatial assessment based on hazards, exposure and adaptive capacity. Sci. Total Environ. 2019, 682, 31–46. [Google Scholar] [CrossRef] [PubMed]
- Füssel, H.-M. Vulnerability: A generally applicable conceptual framework for climate change research. Glob. Environ. Chang. 2007, 17, 155–167. [Google Scholar] [CrossRef]
- Downing, T.E.; Patwardhan, A. Assessing vulnerability for climate adaptation. In Adaptation Policy Frameworks for Climate Change: Developing Strategies, Policies, and Measures; Lim, B., Spanger-Siegried, E., Eds.; Cambridge University Press: Cambridge, UK, 2004; Chapter 3. [Google Scholar]
- United Nations. Living with Risk: A Global Review of Disaster Reduction Initiatives; United Nations International Strategy for Disaster Reduction: Geneva, Switzerland, 2004. [Google Scholar]
- Moss, R.H.; Malone, E.L.; Brenkert, A.L. Vulnerability to Climate Change: A Quantitative Approach; Joint Global Change Research Institute: College Park, MD, USA, 2001. [Google Scholar]
- Cutter, S.; Emrich, C.; Webb, J.; Morath, D. Social Vulnerability to Climate Variability Hazards: A Review of the Literature. Final. Rep. Oxfam Am. 2009, 5, 1–44. [Google Scholar]
- Kaly, U.; Briguglio, L.; Mcleod, H.; Schmall, S.; Pratt, C.; Pal, R. Environmental Vulnerability Index (EVI) to Summarize National Environmental Vulnerability Profiles; SOPAC Technical Report 275; South Pacific Applied Geoscience Commission: Suva, Fiji, 1999. [Google Scholar]
- South Pacific Applied Geoscience Commission (SOPAC) and United Nations Environment Programme. Building Resilience in SIDS: The Environmental Vulnerability; South Pacific Applied Geoscience Commission: Suva, Fiji, 2005. [Google Scholar]
- Esty, D.C.; Levy, M.; Srebotnjak, T.; de Sherbinin, A. 2005 Environmental Sustainability Index: Benchmarking National Environmental Stewardship; Yale Center for Environmental Law and Policy: New Haven, CT, USA, 2005. [Google Scholar]
- Cardona, O.D. Indicators of Disaster Risk and Risk Management: Summary Report; Inter-American Development Bank: Washington, DC, USA, 2008. [Google Scholar]
- Garcia, A.P.; Mateos, P.; Giralt, C.H. A theoretical and methodological essay on the concept of vulnerability. Sociology 2018, 13, 109–122. [Google Scholar]
- Campos-Vargas, M.; Toscana-Aparicio, A.; Campos-Alanís, J. Riesgos socionaturales: Vulnerabilidad socioeconómica, justicia ambiental y justicia espacial. Cuadernos de Geografía: Revista Colombiana de Geografía 2015, 24, 53–69. [Google Scholar] [CrossRef]
- Cuadernos de Geografía: Revista Colombiana de Geografía. Cuadernos de Geografía: Revista Colombiana de Geografía 2014, 24, 53–69. [CrossRef]
- Mateos, P. La doble segregación urbana: Desigualdades socio-espaciales y justicia ambiental. In Proceedings of the Actas del III Congreso Internacional de Desarrollo Local, Universidad de La Habana, Havana, Cuba, 6–9 December 2013; pp. 3488–3510. [Google Scholar]
- Landrigan, P.J.; Rauh, V.A.; Galvez, M.P. Environmental justice and the health of children. Mt. Sinai J. Med. A J. Transl. Pers. Med. 2010, 77, 178–187. [Google Scholar] [CrossRef]
- Moreno-Jiménez, A.; Cañada-Torrecilla, R.; Vidal-Domínguez, M.J.; Palacios-García, A.; Martínez-Suárez, P. Assessing environmental justice through potential exposure to air pollution: A socio-spatial analysis in Madrid and Barcelona, Spain. Geoforum 2016, 69, 117–131. [Google Scholar] [CrossRef]
- Intergovernmental Panel on Climate Change. Climate Change 2001: Synthesis Report. A Contribution of Working Groups I, II, and III to the Third Assessment Report of the Intergovernmental Panel on Climate Change; Watson, R.T., the Core Writing Team, Eds.; Cambridge University Press: Cambridge, UK; New York, NY, USA, 2001; p. 398. [Google Scholar]
- McCarthy, J.J.; Canziani, O.F.; Leary, N.A.; Dokken, D.J.; White, K.S. (Eds.) Climate Change 2001: Impacts, Adaptation, and Vulnerability; Cambridge University Press: Cambridge, UK, 2001. [Google Scholar]
- Karunarathne, A.Y.; Lee, G. Developing a multi-facet social vulnerability measure for flood disasters at the micro-level assessment. Int. J. Disaster Risk Reduct. 2020, 49, 101679. [Google Scholar] [CrossRef]
- Smit, B.; Pilifosova, O.; Burton, I.; Challenger, B.; Huq, S.; Klein, R.J.T.; Yohe, G. Adaptation to climate change in the context of sustainable development and equity. In Climate Change 2001: Impacts, Adaptation and Vulnerability. Contribution of the Working Group II to the Third Assessment Report of the Intergovernmental Panel on Climate Change; McCarthy, J.J., Canziani, O., Leary, N.A., Dokken, D.J., White, K.S., Eds.; Cambridge University Press: Cambridge, UK, 2001; pp. 877–912. [Google Scholar]
- Nguyen, A.K.; Liou, Y.-A.; Li, M.-H.; Tran, T.A. Zoning eco-environmental vulnerability for environmental management and protection. Ecol. Indic. 2016, 69, 100–117. [Google Scholar] [CrossRef]
- Liou, Y.-A.; Nguyen, A.K.; Li, M.-H. Assessing spatiotemporal eco-environmental vulnerability by Landsat data. Ecol. Indic. 2017, 80, 52–65. [Google Scholar] [CrossRef]
- Kitano, H. Systems Biology: A Brief Overview. Science 2002, 295, 1662–1664. [Google Scholar] [CrossRef] [PubMed]
- Berkes, F.; Colding, J.; Folke, C. (Eds.) Navigating Social Ecological Systems: Building Resilience for Complexity and Change; Cambridge University Press: Cambridge, UK, 2003. [Google Scholar]
- Turner, A.L., II; Kasperson, R.E.; Matson, P.A.; McCarthy, J.J.; Corell, R.W.; Christensen, L.; Eckley, N.; Kasperson, J.X.; Luers, A.; Martello, M.L.; et al. A framework for vulnerability analysis in sustainability science. Proc. Natl. Acad. Sci. USA 2003, 100, 8074–8079. [Google Scholar] [CrossRef] [PubMed]
- Adger, W.N. Vulnerability. Glob. Environ. Chang. 2006, 16, 268–281. [Google Scholar] [CrossRef]
- United Nations University. 2016 Annual Report; UNU Centre: Tokyo, Japan, 2016. [Google Scholar]
- Republic Act No. 7160. An Act Providing the Local Government Code of 1991. Eight Congress, Congress of the Philippines: Metro Manila, Philippines, 1991. Available online: https://www.lawphil.net/statutes/repacts/ra1991/ra_7160_1991.html (accessed on 23 October 2020).
- Toda, L.; Orduna, J.R.; Lasco, R.; Santos, C.T. Assessing and mapping barangay level social vulnerability of Tacloban City and Ormoc City to climate-related hazards. Clim. Disaster Dev. J. 2015, 1, 25–40. [Google Scholar] [CrossRef]
- Evariste, F.F.; Jean, S.D.; Victor, K. Assessing climate change vulnerability and local adaptation strategies in adjacent communities of the Kribi-Ocampo coastal ecosystems, South Cameroon. Urban Clim. 2018, 24, 1037–1051. [Google Scholar] [CrossRef]
- Solín, Ľ.; Madajová, M.S.; Michaleje, L. Vulnerability assessment of households and its possible reflection in flood risk management: The case of the upper Myjava basin, Slovakia. Int. J. Disaster Risk Reduct. 2018, 28, 640–652. [Google Scholar] [CrossRef]
- Ado, A.M.; Leshan, J.; Savadogo, P.; Koivogui, S.K.; Pesha, J.C. Households vulnerability to climate change: Insights from a Farming Community in Aguie District of Niger. J. Environ. Earth Sci. 2018, 8, 3. [Google Scholar]
- Ignacio, J.A.F.; Cruz, G.T.; Nardi, F.; Henry, S. Assessing the effectiveness of a social vulnerability index in predicting heterogeneity in the impacts of natural hazards: A case study of the Tropical Storm Washi flood in the Philippines. Vienna Yearb. Popul. Res. Jan. 2015, 13, 91–129. [Google Scholar]
- Balica, S.F.; Wright, N.G.; Van Der Meulen, F. A flood vulnerability index for coastal cities and its use in assessing climate change impacts. Nat. Hazards 2012, 64, 73–105. [Google Scholar] [CrossRef]
- Jha, S.; Martinez, J.A.; Quising, P.; Ardaniel, Z.; Wang, L. Natural Disasters, Public Spending, and Creative Destruction: A Case Study of the Philippines. SSRN Electron. J. 2018. [Google Scholar] [CrossRef]
- Ahamed, M. Community based Approach for Reducing Vulnerability to Natural Hazards (Cyclone, Storm Surges) in Coastal Belt of Bangladesh. Procedia Environ. Sci. 2013, 17, 361–371. [Google Scholar] [CrossRef]
- De Andrade, M.M.N.; Szlafsztein, C.F. Vulnerability assessment including tangible and intangible components in the index composition: An Amazon case study of flooding and flash flooding. Sci. Total Environ. 2018, 630, 903–912. [Google Scholar] [CrossRef] [PubMed]
- Chen, S.; Zha, X.; Bai, Y.; Wang, L. Evaluation of soil erosion vulnerability on the basis of exposure, sensitivity, and adaptive capacity: A case study in the Zhuxi watershed, Changting, Fujian Province, Southern China. Catena 2019, 177, 57–69. [Google Scholar] [CrossRef]
- Cong, P.T.; Manh, D.H.; Huy, H.A.; Phuong, T.T.L.; Tuyen, L.T. Livelihood Vulnerability Assessment to Climate Change at Community Level Using Household Survey: A Case Study from Nam Dinh Province, Vietnam. Mediterr. J. Soc. Sci. 2016, 7, 358. [Google Scholar] [CrossRef]
- Debortoli, N.S.; Camarinha, P.I.M.; Marengo, J.A.; Rodrigues, R.R. An index of Brazil’s vulnerability to expected increases in natural flash flooding and landslide disasters in the context of climate change. Nat. Hazards 2017, 86, 557–582. [Google Scholar] [CrossRef]
- Duan, M.; Gao, Q.; Wan, Y.; Li, Y.; Guo, Y.; Ganzhu, Z.; Wu, Y. Assessing vulnerability and adaptation responses to rain-fall related landslides in China, a case study of Enshi Prefecture in Hubei province. Procedia Environ. Sci. 2011, 11, 1379–1385. [Google Scholar] [CrossRef][Green Version]
- Fernandez, P.; Mourato, S.; Moreira, M.; Pereira, L.G. A new approach for computing a flood vulnerability index using cluster analysis. Phys. Chem. Earth Parts A/B/C 2016, 94, 47–55. [Google Scholar] [CrossRef]
- Liu, X.; Wang, Y.; Peng, J.; Braimoh, A.K.; Yin, H. Assessing vulnerability to drought based on exposure, sensitivity and adaptive capacity: A case study in middle Inner Mongolia of China. Chin. Geogr. Sci. 2012, 23, 13–25. [Google Scholar] [CrossRef]
- Michellier, C.; Kervyn, M.; Barette, F.; Syavulisembo, A.M.; Kimanuka, C.; Mataboro, S.K.; Hage, F.; Wolff, E.; Kervyn, F.; Michellier, C.; et al. Evaluating population vulnerability to volcanic risk in a data scarcity context: The case of Goma city, Virunga volcanic province (DRCongo). Int. J. Disaster Risk Reduct. 2020, 45, 101460. [Google Scholar] [CrossRef]
- Murthy, C.S.; Laxman, B.; Sai, M.V.R.S. Geospatial analysis of agricultural drought vulnerability using a composite index based on exposure, sensitivity and adaptive capacity. Int. J. Disaster Risk Reduct. 2015, 12, 163–171. [Google Scholar] [CrossRef]
- Mwangi, K.K.; Mutua, F. Modeling Kenya’s Vulnerability to Climate Change—A Multifactor Approach. Int. J. Sci. Res. 2015, 3, 9. [Google Scholar]
- Omerkhil, N.; Chand, T.; Valente, D.; Alatalo, J.M.; Alatalo, J.M. Climate change vulnerability and adaptation strategies for smallholder farmers in Yangi Qala District, Takhar, Afghanistan. Ecol. Indic. 2020, 110, 105863. [Google Scholar] [CrossRef]
- Ortega, J.; Vasconcelos, G.; Rodrigues, H.; Correia, M.; Ferreira, T.M.; Vicente, R. Use of post-earthquake damage data to calibrate, validate and compare two seismic vulnerability assessment methods for vernacular architecture. Int. J. Disaster Risk Reduct. 2019, 39, 101242. [Google Scholar] [CrossRef]
- Weis, S.W.M.; Agostini, V.N.; Roth, L.M.; Gilmer, B.; Schill, S.R.; Knowles, J.E.; Blyther, R. Assessing vulnerability: An integrated approach for mapping adaptive capacity, sensitivity, and exposure. Clim. Chang. 2016, 136, 615–629. [Google Scholar] [CrossRef]
- Yang, W.; Xu, K.; Lian, J.; Bin, L.; Ma, C. Multiple flood vulnerability assessment approach based on fuzzy comprehensive evaluation method and coordinated development degree model. J. Environ. Manag. 2018, 213, 440–450. [Google Scholar] [CrossRef]
- Yusuf, A.A.; Francisco, H.A. Climate Change Mapping for Southeast Asia; Economy and Environment Program for Southeast Asia (EEPSEA): Singapore, 2009. [Google Scholar]
- Zhang, S.; Li, C.; Zhang, L.; Peng, M.; Zhan, L.; Xu, Q. Quantification of human vulnerability to earthquake-induced landslides using Bayesian network. Eng. Geol. 2020, 265, 105436. [Google Scholar] [CrossRef]
- Zhang, W.; Xu, X.; Chen, X. Social vulnerability assessment of earthquake disaster based on the catastrophe progression method: A Sichuan Province case study. Int. J. Disaster Risk Reduct. 2017, 24, 361–372. [Google Scholar] [CrossRef]
- Holden, W.N. Mining amid typhoons: Large-scale mining and typhoon vulnerability in the Philippines. Extr. Ind. Soc. 2015, 2, 445–461. [Google Scholar] [CrossRef]
- PEP-Asia CBMS Network Office. Climate Change Vulnerability Mapping in the Philippines: A Pilot Study; Angelo King Institute for Economic and Business Studies (AKI), De La Salle University: Manila, Philippines, 2007. [Google Scholar]
- Atienza, M. Local governments and devolution in the Philippines. In Philippine Politics and Governance: An Introduction; University of the Philippines: Manila, Philippines, 2006. [Google Scholar]
- Legaspi, P. The Changing Role of Local Government under a Decentralized State: The Case of the Philippines. Public Manag. Rev. 2013, 3, 131–139. [Google Scholar] [CrossRef]
- Balce, G.R.; Ramos, E.G. Geologic Hazards in the Philippines; A Definition and an Overview. Saf. Reliab. 1988, 8, 31–46. [Google Scholar] [CrossRef]
- Deressa, T.T.; Hassan, R.M.; Ringler, C. Assessing Household Vulnerability to Climate Change: The Case of Farmers in the Nile Basin of Ethiopia; International Food Policy Research Institute: Washington, DC, USA, 2009. [Google Scholar]
- Rothenberger, B. Disaster Risk Reduction and Management in the Philippines: A desk Study Conducted by the Swiss NGO DRR Platform; Global Risk Forum: Davos, Switzerland, 2014. [Google Scholar]
- Reyes, P.J.D.; Bornas, M.A.V.; Dominey-Howes, D.; Pidlaoan, A.C.; Magill, C.R.; Solidum, J.R.U.; Solidum, R.U. A synthesis and review of historical eruptions at Taal Volcano, Southern Luzon, Philippines. Earth-Sci. Rev. 2018, 177, 565–588. [Google Scholar] [CrossRef]
- Atienza, M.E.; Eadie, P.; Tan-Mullins, M. Urban Poverty in the Wake of Environmental Disaster: Rehabilitation, Resilience and Typhoon Haiyan (Yolanda); Routledge: New York, NY, USA, 2019. [Google Scholar]
- Hallegatte, S.; Bangalore, M.; Vogt-Schilb, A.; Rozenberg, J. Unbreakable: Building the resilience of the poor in the face of natural disasters. In Climate Change and Development Series; International Bank for Reconstruction and Development, The World Bank Group: Washington, DC, USA, 2016. [Google Scholar]
- Bolletinno, V.; Alcayna, T.; Enriquez, K.; Vinck, P. Perceptions of Disaster Resilience and Preparedness in the Philippines; Harvard Humanitarian Initiative, Harvard University: Cambridge, MA, USA, 2018. [Google Scholar]
- Belhadj, B. New weighting scheme for the dimensions in multidimensional poverty indices. Econ. Lett. 2012, 116, 304–307. [Google Scholar] [CrossRef]
- Decancq, K.; Lugo, M.A. Weights in Multidimensional Indices of Wellbeing: An Overview. Econ. Rev. 2013, 32, 7–34. [Google Scholar] [CrossRef]
- Tate, E. Social vulnerability indices: A comparative assessment using uncertainty and sensitivity analysis. Nat. Hazards 2012, 63, 325–347. [Google Scholar] [CrossRef]
- Blancas, F.J.; Contreras, I.; Ramírez-Hurtado, J.M. Constructing a composite indicator with multiplicative aggregation under the objective of ranking alternatives. J. Oper. Res. Soc. 2013, 64, 668–678. [Google Scholar] [CrossRef]
- Baptista, S.R. Design and Use of Composite Indices in Assessment of Climate Change Vulnerability and Resilience; United States Agency International Development: Washington, DC, USA, 2014; p. 53.
- Mendoza, M.E.T.; The, B.D.; Naret, H.; Ballaran, V.; Arias, J.K. Assessing Vulnerability to Climate Change Impacts in Cambodia, the Philippines and Vietnam: An Analysis at the Commune and Household Level. J. Environ. Sci. Manag. 2014, 17, 78–91. [Google Scholar]
- Doocy, S.; Daniels, A.; Murray, S.; Kirsch, T.D. The Human Impact of Floods: A Historical Review of Events 1980-2009 and Systematic Literature Review. PLoS Curr. 2013, 5. [Google Scholar] [CrossRef]
- Jonkman, S.N.; Kelman, I. An Analysis of the Causes and Circumstances of Flood Disaster Deaths. Disasters 2005, 29, 75–97. [Google Scholar] [CrossRef]
- National Disaster Risk Reduction and Management Council. Situational Report No. 87—Re Taal Volcano Eruption; National Disaster Risk Reduction and Management Council: Quezon City, Philippines, 2020.
- Nazmfar, H.; Saredeh, A.; Eshgi, A.; Feizizadeh, B. Vulnerability evaluation of urban buildings to various earthquake intensities: A case study of the municipal zone 9 of Tehran. Hum. Ecol. Risk Assess Int. J. 2019, 25, 455–474. [Google Scholar] [CrossRef]
- Şen, A.; Ekinci, V. Realization of Earthquake Vulnerability Analysis in Structure Scale with Fuzzy Logic Method in GIS: Kadikoy, Maltepe and Prince Islands Sample. Int. J. Environ. Geoinformatics 2016, 3, 40–56. [Google Scholar] [CrossRef]
- Lee, H.-C.; Chen, H. Implementing the Sendai Framework for disaster risk reduction 2015–2030: Disaster governance strategies for persons with disabilities in Taiwan. Int. J. Disaster Risk Reduct. 2019, 41, 101284. [Google Scholar] [CrossRef]
- National Disaster Risk Reduction and Management Council. The National Disaster Risk Reduction and Management Plan 2011 to 2028; Final Version; National Disaster Risk Reduction and Management Council: Quezon City, Philippines, 2011.
- Moret, W. Vulnerability Assessment Methods; United States Agency for International Development Cooperative Agreement No. AID-OAA-LA-13-00001; FHI 360 Headquarters: Durham, NC, USA, 2014. [Google Scholar]
- Polsky, C.; Neff, R.; Yarnal, B. Building comparable global change vulnerability assessments: The vulnerability scoping diagram. Glob. Environ. Chang. 2007, 17, 472–485. [Google Scholar] [CrossRef]
- Tuler, S.; Webler, T.; Polsky, C. A rapid impact and vulnerability assessment approach for commercial fisheries management. Ocean Coast. Manag. 2013, 71, 131–140. [Google Scholar] [CrossRef]
- Malczewski, J. GIS and Multicriteria Decision Analysis; Wiley: New York, NY, USA, 1999. [Google Scholar]
- Stepanov, A.; Smith, J.M. Multi-objective evacuation routing in transportation networks. Eur. J. Oper. Res. 2009, 198, 435–446. [Google Scholar] [CrossRef]


Publisher’s Note: MDPI stays neutral with regard to jurisdictional claims in published maps and institutional affiliations. |
© 2020 by the authors. Licensee MDPI, Basel, Switzerland. This article is an open access article distributed under the terms and conditions of the Creative Commons Attribution (CC BY) license (http://creativecommons.org/licenses/by/4.0/).