Article

Technological Opportunity Analysis: Assistive Technology for Blind and Visually Impaired People

1
Department of Industrial Management Engineering, Korea University, Seoul 02841, Korea
2
New Transportation Innovation Research Center, Korea Railroad Research Institute, Gyeonggi 16105, Korea
*
Author to whom correspondence should be addressed.
Sustainability 2020, 12(20), 8689; https://doi.org/10.3390/su12208689
Submission received: 24 September 2020 / Revised: 15 October 2020 / Accepted: 15 October 2020 / Published: 20 October 2020
(This article belongs to the Special Issue Technologies and Innovations for Sustainable Growth)

Abstract

:
As life expectancy increases, the number of people who suffer from blind and visual impairment due to presbyopia is gradually increasing. Assistive device systems have been used to overcome various physical, social, infrastructure, and accessibility barriers. As technology has advanced, the scope of assistive technologies has been expanded. Therefore, we explored technological opportunities in assistive technology for the blind and visually impaired to establish a strategy for the technology competition in the near future. Firstly, the patent vacuum is detected by generating the patent map based on generative topographic mapping (GTM). Secondly, social network analysis is applied to identify the relationship between patent vacuums and occupied grid points in the patent map. Finally, the technology activity index and technology impact index are considered at quantitative and qualitative levels. Consequently, it was identified that wearable devices, including the road situation signal acquisition module and data acquisition process control module, could be occupied in the future. This study can provide practical ideas for research and development (R&D) in the field of assistive devices for the blind and visually impaired. In addition, this study can be an ample source for decision/policy makers to project new contents.

1. Introduction

The World Health Organization (WHO) reported that at least 2.2 billion people worldwide have a visual impairment or blindness [1]. Unlike congenital blindness, acquired visual impairment has often been diagnosed due to aging, lifestyle factors, or heredity effects [2]. Presbyopia caused by aging has had the greatest impact on visual impairment and has been the second most common cause of blindness worldwide [3]. 1.09 billion people, over the age of 35, suffer from visual impairment due to presbyopia, and as life expectancy increases, the rate of acquired blindness is expected to increase more and more significantly [4].
Blind and visually impaired people have encountered a lot of challenges when performing most of the natural activities performed by non-disabled people [5]. In particular, many dangerous situations occur in environments that are unfamiliar to them. Assistive devices have been used for the blind and visually impaired people to overcome various physical, social, infrastructural, and accessibility barriers to independence and to live active, productive, and independent lives as equal members of the society [6,7]. The use of assistive devices has been increasing, and several electronic aid devices have been introduced over the past few years, called electronic travel aids (ETAs), which can replace with existing aid apparatus, such as white canes [8]. ETAs combining different types of sensors, cameras, or feedback channels can work with different implementation approaches and improve mobility for the visually impaired [9]. Assistive systems based on computer vision or machine learning methods have been emerging, and assistive technology has been expanded according to technological advancement [10,11,12].
The concept of technological opportunity analysis (TOA) has been recognized as an important activity to remain competitive and lead the industry in the future [13,14]. Technological opportunity analysis is related to technology forecasting and must consider technical characteristics of technology based on the overall structure of technological advancement [15]. Patent databases have been employed as representative sources of information to identify technological trends and anticipate new technological opportunities [16,17]. Patents have been regarded as the output of the research and development (R&D) activities that simultaneously fulfill technical and legal requirements, as well as explicit criteria for originality, technical feasibility, and commercial value [18,19]. In particular, a patent must be assigned at least one international patent classification (IPC) code developed by the World Intellectual Property Organization (WIPO) [20,21]. Thus, it is possible to discovery technological opportunities using IPC information in the patent documents since patents can be classified into specific technology fields by IPC. Consequently, classified patents can be considered technically relevant.
As modern technology has advanced, industries have been characterized by complexity, volatility, and radicalness [22]. Under such an environment, the competition for survival has intensified in the industry. The recent global technological competition can be summarized as the process of discovering and leveraging technological opportunities before competitors [23]. In order to be competitive and survive, it is necessary to develop innovative strategies. Patent analysis based on mining tools, such as text mining and bibliometric analysis, can be applied so that technology trends can be identified and technological opportunities can be extracted from the amount of patent data [24]. More recently, patent maps or patent networks have been employed to quantitatively discover technological opportunities in the patent documents. These methods present informative results in visual form when analyzing the characteristics of patents. Thus, researchers can intuitively interpret the valuable significance in the complicated patent data.
This study aims to explore the technological opportunities that are considered possibilities in the technology field of assistive devices for blind and visual impairment in the near future. In order to identify reliable technological opportunities, we employ patent maps and patent networks based on the IPC system. We can identify the patent vacuum regarded as a field of technological opportunities by generating a patent map that analyzes the patent characteristics based on the IPC. Technological innovations tend to be influenced by existing stable technologies and proceed with the emergence of new technologies. Based on these trends, patent networks can be employed to identify the relationships between technologies. Therefore, the results can provide useful information for interpreting technology opportunities corresponding to assistive device technologies for the blind and visually impaired people. This research can be a practical source for researchers and developers to apply insights in planning R&D for new technologies.

2. Theoretical Background

Technological opportunities refer to the potentiality or possibility for technological advancement and determine the productivity of R&D in general or within a particular field [25,26]. Technological opportunity analysis can excavate innovative ideas by identifying technological trends and predicting future industry scenarios from technological literatures, such as patents and publication [27]. In this regard, technological opportunity analysis can be defined as part of technology forecasting. In previous literature, qualitative methods depending on experts’ knowledge, such as the Delphi and brainstorming methods, have been applied when exploring technological opportunities [28]. However, not only did these require excessive time and social costs, but they rarely provided reliable results for decision-making in determining target technologies to plan practical R&D [15,29]. As data analytical techniques have advanced, patent-based technological opportunity analysis has applied various data mining methods. In particular, visualization tools, such as patent maps and networks, are mainly applied, since they can make it easy to understand and interpret patent documents intuitively [30,31].

2.1. Patent Map

Patent maps have been employed to identify patent vacuums that are worth detecting for new technology development [32,33]. In particular, the concept of forecasting vacant technology by applying patent maps, such graphs and charts, has become popular, since researchers can simply detect patent vacuums based on patent information [34]. Patent maps are useful vehicles for graphically getting invaluable idea to explore technological opportunities, considering the relationship between technologies [32]. Patent maps can present patent vacuums, regarded as technological opportunities, that deserve intensive research for the development of new technologies [17,26,35]. In previous literature, most patent maps were developed with keywords extracted from the patent documents by text mining [17,30,32,33,35,36]. Each keyword corresponded to a dimension, and a keyword vector was generated. Patent documents were located on the two-dimensional map by analyzing, classifying, and arranging the keyword vectors based on the existence of a keyword in each of the patent documents. Consequently, patent maps make the documents more informative and constructive [33].
The vacant area in the map has been proposed as a patent vacuum that has not yet been developed. Patent vacuums have been identified by applying data mining methods, such as principal component analysis (PCA), the self-organizing map (SOM), and generative topographic mapping (GTM) [15,17,31,32,33]. PCA can reduce multi-dimensional data to two or three dimensions and represent data on an informative plot [37]. PCA looks for the significant principal components through a linear combination of the multi-variables, which can account for the most significant variations within the database [17,38]. The SOM, an artificial intelligence technique, visualizes data as neurons from multi-dimensional neurons into two-dimensional neurons [39]. In SOM-based patent maps, patents can be located on discrete nodes and visualize the similarities and differences of nodes by color contrast [33]. Location of patent vacuums can be judged by color scale in the SOM-based map. However, there are some limitations in interpreting the patent vacuums. PCA plots can display groups and outliers associated in the data, but there are no rules to help detect outliers. In order to detect patent vacuums in the PCA-based patent map, researchers’ opinions are required. The results can vary between researchers, since each researcher will have different experience, knowledge, and judgment criteria. It is also hard to detect the patent vacuums and explicitly interpret the potential of technological opportunities on SOMs, leading to problems or analogies that cannot be interpreted or given in detail. In addition, it takes a lot of time to understand the significance of patent vacuums and evaluate the value of technological opportunities for practical R&D planning because the feature of the vacuums cannot be grasped. In order to provide a principled alternative SOM, Bishop et al. [39] introduced GTM, which can overcome the aforementioned limitations. GTM can project multi-dimensional data space into low-dimensional latent space and vice versa, unlike SOM, which is not only quantified but also requires empirical processes to confirm the results. GTM-based patent maps can also present patent documents to the discrete distribution. More importantly, vectors for patent vacuums in a map can be estimated due to the inverse mapping algorithm based on Bayes’ theorem. Thus, GTM-based patent maps can automatically detect and interpret the patent vacuums in an objective way [15,31]. Son et al. [31] applied GTM to construct patent maps and discussed the character of each model by comparing a GTM-based patent map with a PCA-based patent map and a SOM-based patent map. As a result of comparison, the GTM-based patent map was suitable for quantitatively generating patent maps, since the PCA-based patent map and SOM-based patent map has to be manually investigated by researchers for interpretation of a patent vacuum.
In previous literature, keyword-based approaches have had some limitations in the analysis process and interpretation of the results. First, even if text mining were applied, a noise filtering from domain experts was required to extract elaborate and robust keywords when generating keyword vectors in the patent databases [40,41]. Keywords play a critical role, since patent vacuums are generated by analyzing the characteristics of patents for keyword vectors. However, it is apprehended that keyword vectors can be generated differently depending on expert opinions [32]. The results therefore depend on the experience and knowledge of experts, which is a very serious problem. Second, despite the process of analysis operating in a quantitative way, subjective points of experts are involved in interpreting the result. It is difficult to specifically define what vacant technologies are and which ones will be the most practical.

2.2. Patent Network

Any network consists of nodes joined together in pairs by links or edges [42]. The application of a network can serve as a quantitative technique to represent the relationship between structure and behavior of nodes [43,44]. Integration and recombination of existing knowledge coming from different sources lead to the creation and the diffusion of ideas for new technology R&D [45]. Based on these ideas, patent citation information has been used for network analysis, since citation-based techniques can evaluate knowledge diffusion and link of patents in a patent database [31,46]. While patent citation analysis makes it easy to understand the relationships between patents and is simple to use, it has several disadvantages. First, the citation network merely demonstrates individual links between two particular patents, which interferes with the comprehension of the overall relationships among all of the patents. Second, citation analysis makes it difficult to deal with internal relationships between patents or technological characteristics. Because it only considers frequency of citations, superficial or even misleading indexes can be detected [44]. Finally, the average time-lag between citing and cited patents is over 10 years [47]. Recognizing the shortcomings, network-based alternative methods have been applied, such as keyword-based co-word analysis and IPC-based co-classification analysis, to identify technological relationship sin patent databases [48,49,50]. In particular, co-classification information is based on the fact that patents are classified to specific technological fields, considering their technological characteristics [51]. Therefore, the co-classification scheme assumes the existence or frequency of two IPC codes, jointly assigned to the patent document as a signal indicating the strength of the relationship with technical knowledge [52]. Furthermore, the limitations due to the time-lag problem are relatively improved, since the time of patent registration and patent classification information are equal [22].
Thus, we empirically explored the technological opportunities in the field of assistive technology for the visually impaired through the patent map and network analysis based on the IPC system. This study suggests that we need to provide practical ideas for researchers to plan new technology R&D by applying various data mining techniques. Results can be clearly interpreted from an overall perspective on technologies.

3. Methodology

3.1. Generative Topographic Mapping

The patent map can be applied to detect the patent vacuum, generally represented as vacant areas in the map, by reducing the dimension of multivariable data through information analysis in the patent documents [53]. In the GTM-based patent map, patent documents are mapped by the GTM to a grid point with a two-dimensional space using several parameters, such as the number of latent grid points and the number of basic functions. In particular, the GTM-based patent map can visualize patent documents in the discrete grid points by applying the delta function. The grid points are represented as circle symbols or vacant areas to a rectangular planar surface (Figure 1). A circle symbol in the map represents an occupied area, whereas vacant areas indicate patent vacuums, according to vacant technology fields. Thus, researchers can detect patent vacuums automatically without additional time or effort.
In addition, the GTM-based patent map can identify characteristics of patent vacuums through Equation (1), which is applied by reversing the transformation from a latent grid point to new data points [40].
y ( x ;   W ) = W φ ( x )
Equation (1) serves to extract the reverse characteristics corresponding to the patent document in the patent vacuum, where W is an initial weighting matrix and φ ( x ) is the activation of basis functions when supplying a latent variable sample x in the reduced data space. The function y ( x ;   W ) maps x onto corresponding points y ( x ;   W ) in the data space and vice versa [40]. Thus, we can estimate the characteristics of patent vacuum and specify the signification of the prominent attribute as vacant technologies. The best advantage of the GTM-based patent map is that it can be interpreted specifically and easily through the inverse function (Equation (1)) [15]. If detailed information of patent vacuums is extracted, the interpretation can be facilitated objectively. Therefore, we applied GTM when generating a patent map to anticipate technological opportunities.

3.2. Social Network Analysis

A social network analysis (SNA), based on the concept of sociology, related to the way social relationships between people constitute a distinct reality, was referenced [54]. It has been regarded as an appropriate tool to understand inter-organizational interaction. It is also possible to empirically assess the structure of a network in a more quantitative manner [55]. In the SNA method, the people or groups are called actors (nodes) and the relationships between actors are expressed as a link (edge). The centrality is used as an indicator to estimate the influence of actors [56,57]. There are three methods to measure centrality of a network: (1) degree centrality, (2) closeness centrality, and (3) betweenness centrality [57,58].
Degree centrality ( i ) = i j c o n n ( i , j ) ,    i , j = 1 , 2 , , n
Closeness centrality ( i ) = n 1 i j d i s t ( i , j ) ,    i , j = 1 , 2 , , n
Betweenness centrality ( i ) = i k ,   i j k j d i s t ( i , k , j ) d i s t ( i , j ) ,   i , j , k = 1 , 2 , , n
For n actors, the degree centrality of actor i is defined as Equation (4), where c o n n ( i , j ) is the tie incident between actor i and j, which measures how an actor connects with other actors. The closeness centrality is calculated by Equation (5), where d i s t ( i , j ) is the shortest distance between actor i and j, which measures how an actor gets closer with the most important actor. The betweenness centrality is calculated by Equation (6), where d i s t ( i , k , j ) is the shortest distance from i to j through k, which measures how an actor bridges with other actors in a network [59,60,61].

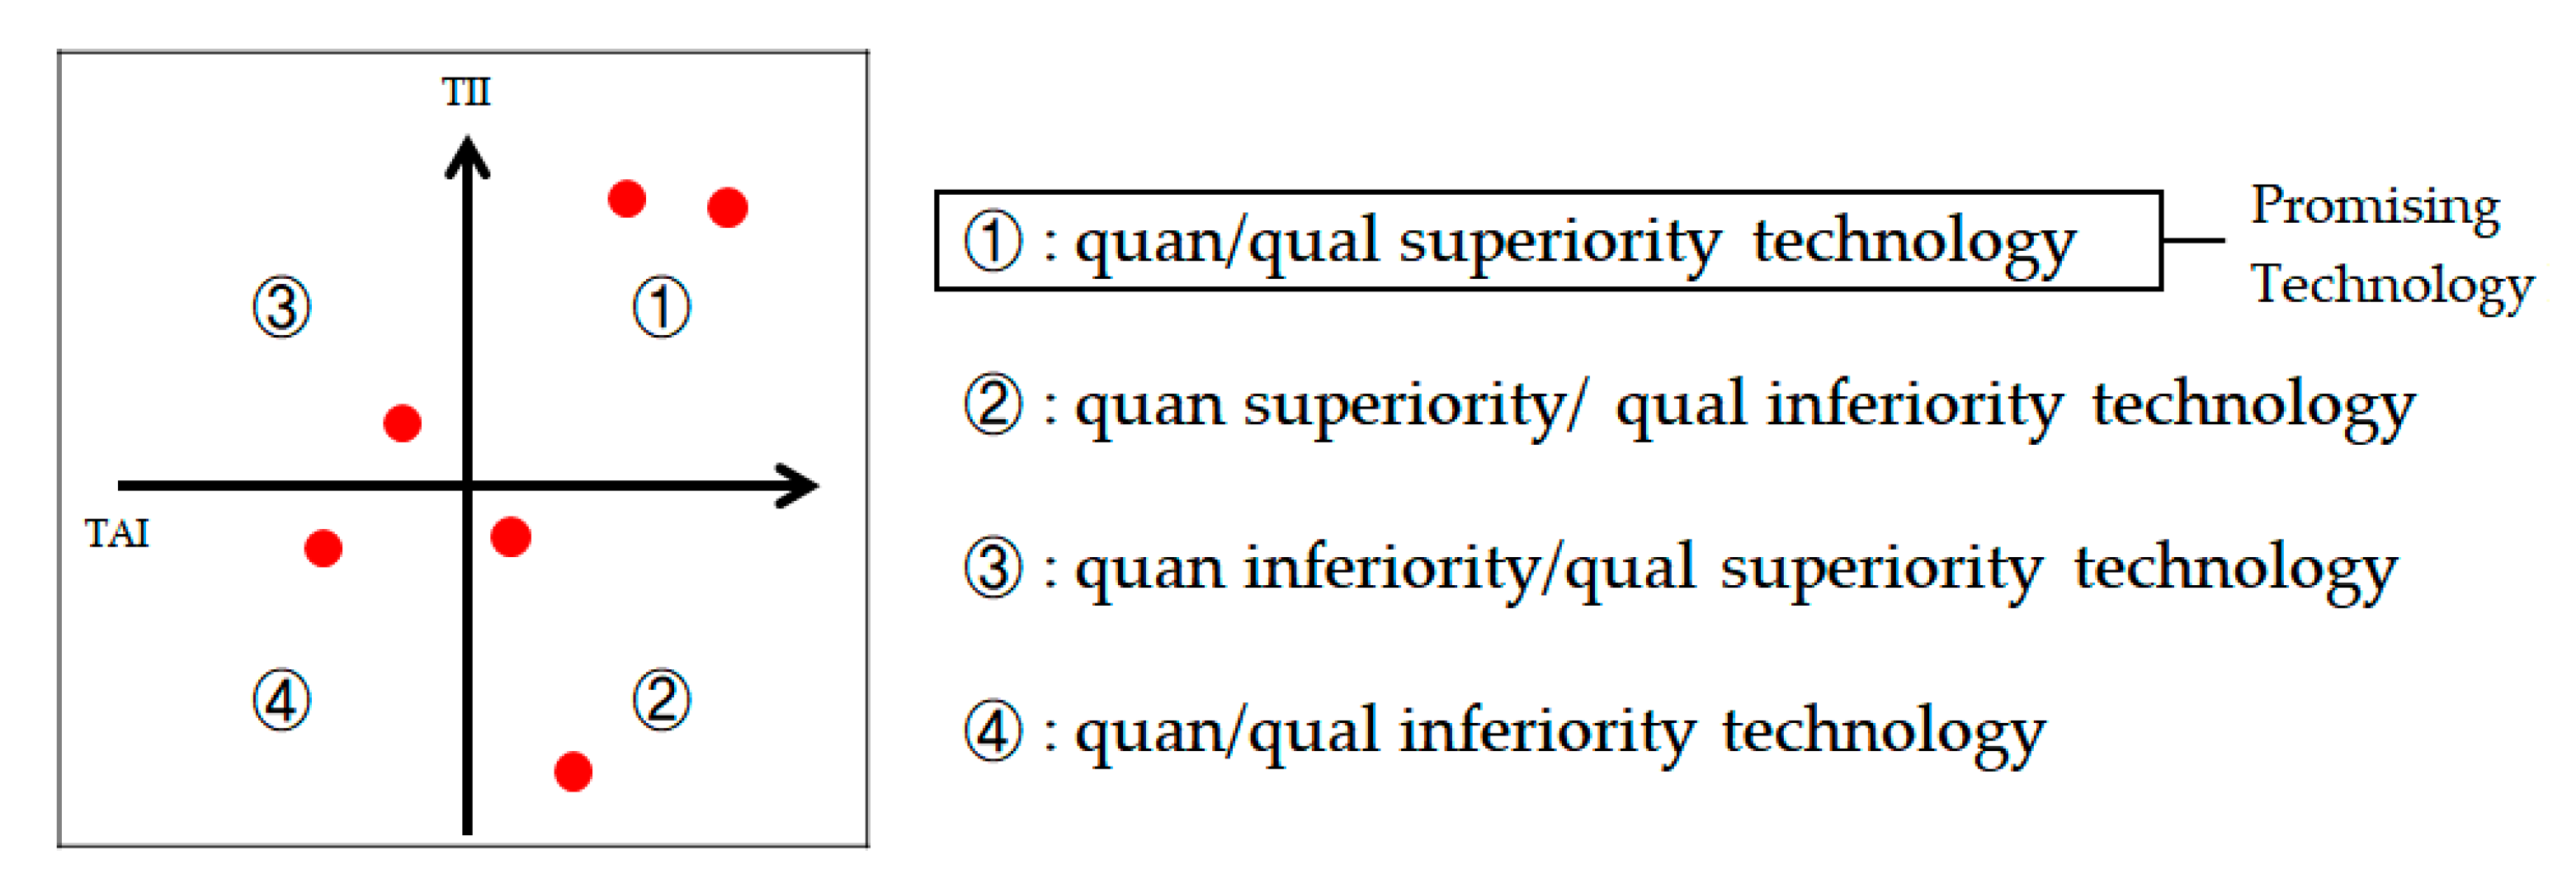
3.3. Technology Level Map

In order to contrive practical R&D planning, it is necessary to specify the prominent characteristics of vacant technology. A technology level map can assess the relative level of technologies. Figure 2 depicts the technology level map by applying the quantitative and qualitative indexes [62].
A technology level map is presented in two-dimensional space with X and Y axes. The X axis represents the technology activity index (TAI) for the relative quantitative valuation of technology by using Equation (2), where p i is the number of patent applications, according to specific technology i, and P is the number of total patent applications. TAI stands for the relative growth of the technology, and as more patents are applied, the technology is considered to be growing rapidly [63].
T e c h n o l o g y   a c t i v i t y   i n d e x = p i P
The Y axes use the technology impact index (TII) for the relative qualitative valuation of technology by using Equation (3), where c i is the citation number of the patent, according to technology i, and C is the number of total patent citations. TII is applied to assess the technological impact because citations are often associated with inventions of economic and technical importance [64]. Technology with a higher number of citations can be considered more advanced because new technologies are developed based on previous technologies.
T e c h n o l o g y   i m p a c t   i n d e x = c i C
Whether technology is promising or not is evaluated by emergence of the technology. Emergence is characterized as follows: (i) radical novelty or newness, (ii) relatively fast growth, increasing number of papers, such as patent and publications, (iii) technological convergence, (iv) prominent impact, which exerts much enhanced economic influence, (v) and uncertainty, which involves ambiguity regarding potential applications of the technology [65,66,67,68,69,70]. In this regard, a quantity measurement (TAI) can be employed to determine relatively grown specific technology on a technological field, and quality measurements (TII) can be used to determine specific technologies that have a relatively large impact on the technological field. We assume that all points with positive values in the technology level map correspond to superior technology levels and emerging technology. Thus, we can interpret superiority technologies with high technological growth and influence as potential and feasibilities technologies for R&D.

4. TOA in the Field of the Assistive Technology for Blind and Visually Impaired People

4.1. Overall Research Framework

This research aims to empirically explore technological opportunities in the field of assistive technology for blind and visually impaired people. Figure 3 demonstrates an overall framework with several stages. Firstly, patent documents related to assistive technology for blind and visual impairment were collected from the US Patent and Trade Office (USPTO) database and extracted IPC information included in the patent documents. Using the IPC information, an IPC vector that can explain the characteristics of each patent documents was generated. Secondly, a GTM-based patent map was developed to detect the vacant area regarded as the patent vacuum. Lastly, technological opportunities were investigated based on the result of GTM-based inverse mapping. For this, SNA was applied to interpret the relationship between technologies and a technology level map was also applied to assess each technology level by calculating TAI and TII.

4.2. Data Collection and Preprocessing

The USPTO database represents the data source to collect patent documents. Each country is equipped with databases, respectively. However, it takes a lot of time to collect and preprocess patent data from each database, because each patent database has different processes for collecting and classifying patents. Therefore, it is effective to use the USPTO, which has housed the largest amount of patent data issued in several countries [71]. Thus, we collected patent documents related to assistive technologies for blind and visual impairment. In addition, it is necessary to set up relevant keywords to retrieve patents because valid data can be collected according to research keywords and by deriving appropriate results for technology forecasting. In this regard, related keywords are set by utilizing technology research related to assistive technology for the blind and visually impaired in the patent [72]. Through the patent search formula derived in this way, 1728 patent documents from 1974 to 2020 were collected for TOA. The USPTO housed full texts for patents issued from 1976 to the present, but only had images for patents issued from 1790 to 1975. Patents issued since 1976 could be retrieved by text search, whereas searches for patents prior to 1976 were limited to patent numbers or classification codes. We could only collect patents after 1976 based on patent search formula; therefore, 1974 was the first year according to the application year criteria. In addition, the core strategies and infrastructure of each country developed, according to the advancement of ICT technology, since 1990. The field of assistive technology for the blind and visually impaired was also enhanced. Thus, it was sufficiently possible to identify technological opportunities based on patent documents patented since 1974.
A patent document has many descriptions regarding applied technology, such as abstract, title, claims, IPC codes, etc. In particular, IPC codes can describe different technologies depending on the field of the technology [73]. Thus, we regarded the IPC as individual technologies in this research. A majority of patents do not have a single main IPC code, and it is obligatory to assign more than one category to a patent document [74]. Thus, all IPC codes corresponded to each patent document extracted. The IPC codes has hierarchical structures at the levels of sections, classes, subclasses, main groups, and subgroups. We used the subclass levels to roughly explain the amount of detailed information about the IPC. Consequently, 160 subclasses were acquired, but only 25 subclasses, which was higher than the average frequency of each subclass in the patent documents, which were then used for analysis. Thus, a vector was created for each of the 25 subclasses, corresponding to the 1510 patent documents. A total of 218 patent documents were excluded because no subclasses were in existence. As a subclass is equivalent to a dimension, the patent documents were transformed into dimensions for the vector space. Table 1 shows a small portion of the 1510 by 25 matrix constructed for analysis. If the patent 1 had G08B (subclass), the fields were filled with “1”.

4.3. Identifying Vacant Technology Fields

Subsequently, the GTM-based patent map was developed by analyzing patent documents for subclass vectors. Patent vacuums could also be detected. Prior to developing GTM-based patent maps, parameters must be defined. Although several parameters should be set, the number of latent points is very important, since it determines the map size. According to the map size, the number of vacant grid points were determined. If there are few vacant grid points, it is difficult to detect valid patent vacuums in a map. However, there is no rule to decide the parameters. Thus, we conducted a sensitivity experiment to select the relevant numbers of latent grid points by changing the map size. We conducted a test with three size options: (1) 6 × 6 , (2) 8 × 8 , (3) 10 × 10 . As a result, the 6 × 6 size map was appropriated to visualize, but the 8 × 8 map and 10 × 10 map were too sparse to define patent vacuums. Figure 4 shows the developed GTM-based patent map. As shown in Figure 4, the patent vacuums could be discovered more clearly and automatically since all patent documents were mapped at each latent grid point in the map. A total of seven latent grid points were detected as patent vacuums.
The patent vacuums can be transformed into new subclass vectors in data space by inversely mapping (Equation (1)). The new vector generated through the inverse mapping should consist of the binary values as the original vector. However, there is no definitive method in determining a threshold value to generate new vectors in data space. The threshold value should be decided based on the purpose of the research. We set the threshold value at 0.4, considering the variance of the data. Therefore, each subclass vector field was filled with a “0” or “1”, based on the threshold value. If the field value for the subclass was above 0.4, they were represented by 1, and the rest were represented by 0, shown as Table 2. The subclasses corresponding to the vacant technology in the patent vacuums were sorted, as shown in Table 3.

4.4. Investigation into Technology Opportunities

Patent vacuum can be automatically detected through the GTM-based patent map and objectively interpreted as the vacant technology fields in the patent documents. In order to derive new technological content, evaluating identified patent vacuums is necessary to reflect their technological characteristics and the potentiality. For this, we applied SNA for identifying the relationships between the grid points in the GTM-based patent map and technology level map to compare the relative development levels of technologies in the patent vacuums.

4.4.1. Social Network Analysis

Co-classification has more frequently been used for measuring technological distances to indicate the similarity between technologies [21]. One subclass represents one technological field, so if two subclasses are jointly assigned to the same patent document, it can be considered that they are technically relevant to each other. Since the subclass vector was created based on co-classified information in the patent documents, the characteristics of each patent could be described by the subclass vector. The grid points in the GTM-based patent map were also derived by analyzing characteristics of patent documents based on the subclass vector; therefore, the relationship between the grid points in the GTM-based patent map could be explained through a new subclass vector, derived from inverse mapping into the data space. The new subclass vector according to inverse mapping is represented in Figure 5.
Based on this idea, the grid points in the GTM-based patent map were visualized by applying the SNA method based on the new subclass vectors to identify the relationship between vacant grid points and occupied grid points. Figure 6 visualizes the network that could concisely explain the relationships and explicitly classify the grid points [75]. A grid point in the GTM-based patent map corresponds to a node in the network. The darker the link color, the stronger the strength of connection between nodes. As a result, grid points highly related to the patent vacuum could be identified.
Figure 6 represents four subgroups, where the patent vacuums are highlighted nodes with orange colors. In order to identify the occupied technological fields related to patent vacuums by subgroup, it is necessary to interpret the relationship from the SNA graph. Interpretation depending on the graphic information is non-quantitative. In addition, the results are different depending on the researchers. Therefore, we measured the similarity based on the new subclass vectors for each subgroup. When dealing with similarity measurements, Euclidean distance is applied among various methods, such as cosine similarity, because it uses a traditional but effective method and is outperformed [15,76,77]. It can be considered that the smaller the Euclidean distance between nodes, the more similar their technical characteristics. Table 4 lists the top 5 nodes with the closest distances when calculating Euclidean distances based on the highlighted nodes in each subgroup. For example, in subgroup 1, nodes 20, node 27, and node 26 were shown to be close to nodes 21 (patent vacuum), in order. In the case of subgroup 4, nodes 16 and node 5 accorded with the patent vacuums in the GTM-based patent map. Node 5 was the closest to node 12, but node 16 was most related to node 10, respectively. Thus, even if they are in the same subgroup, they should be considered from the perspective of individual nodes.

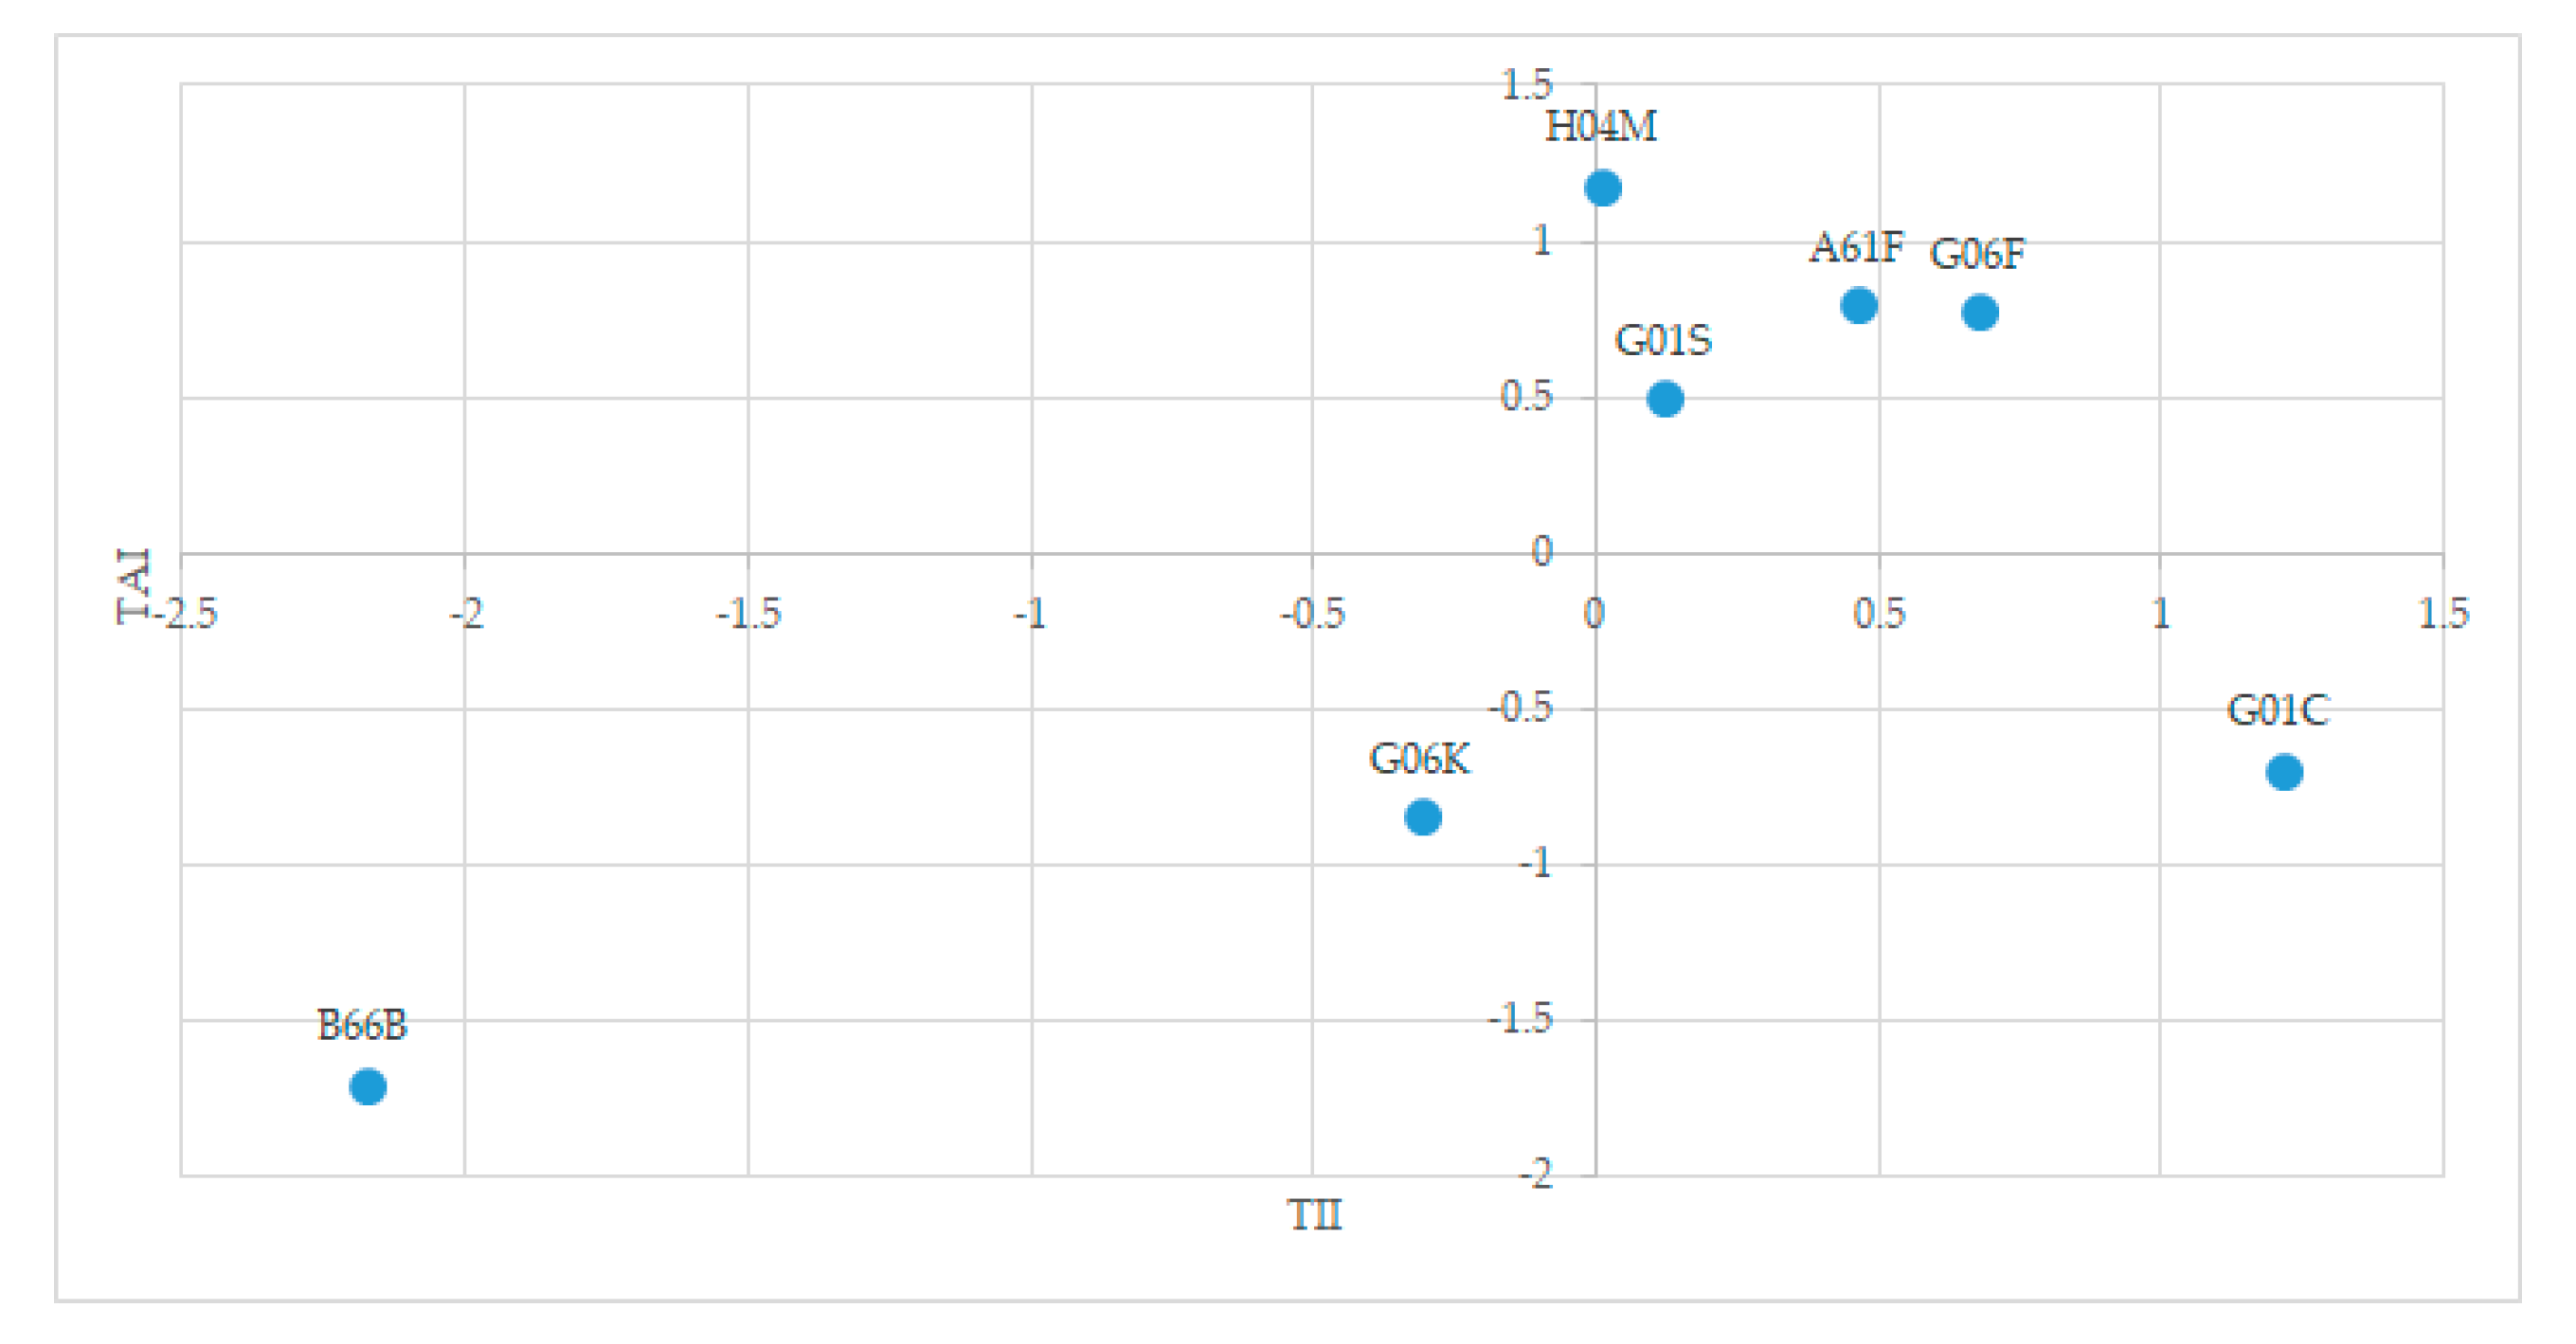
4.4.2. Vacant Technology Level Map

Although seven patent vacuums have been identified simultaneously in the GTM-based patent map, the actual status of development may be different, respectively. Therefore, there is uncertainty in applying the results to new technology development. Thus, the level of technology in the patent vacuums can be identified by the quantity and quality indexes to compare the levels of development. The level of the vacant technology fields is denoted by the TAI and TII indexes for each subclass, as shown in Figure 7. TAI is calculated based on the application number of patents, including subclasses, and the subclass for the patent vacuums is determined by reverse mapping. TII is also calculated based on the citation number of patents, including subclasses derived in the patent vacuums. Each axis is represented by the relative TAI and TII in order to distinguish the technology typology.
The technology level of each patent vacuum was classified into two levels. The 1st, 5th, 16th, and 28th patent vacuums were identified as superiority level fields because two indexes had positive values, whereas the 21th, 23th, and 30th patent vacuums were in the inferiority level field, where the quality and quantity level is negative value. In addition, the technological level of the subclass derived from each patent vacuum is represented in Figure 8. We excluded the A61H when generating the vacant technology level map, because A61H is classified with physical therapy, which covers the treatment of disability and devices for exercising a passive body member [20]. Therefore, the A61H is likely to be included in all patent documents, including machines, i.e., A61H is the most core category of the assistive technology for the visually impaired. Consequently, H04M, G01S, A61F, and G06F were identified as technology for superiority level fields because two indexes had positive values, whereas B66B and G06K were inferior technology in quality and quantity level. G01C was positive in terms of its quantitative level but negative in terms of its qualitative level.

4.5. Results and Discussion

Technological opportunities were identified in a variety of ways. Firstly, the GTM-based patent map was generated to detect patent vacuum. Consequently, a total of seven patent vacuums were derived. Secondly, new IPC vectors that can explain the feature of the cells in the GTM-based patent map were generated by inverse mapping. In order to represent the relationships between patent vacuums and other occupied cells in the GTM-based patent map, SNA was employed, based on the new vectors. There were four subgroups related to patent vacuum that were derived from SNA. However, judgement of researchers was necessary to interpret the similarity between the nodes, which was not quantitative. Therefore, we measured Euclidean distance because the results were able to be different depending on the researcher. As a result, we identified the occupied technological fields related to patent by subgroup. Thirdly, the development level of technological fields corresponding to the patent vacuum were evaluated by constructing the technology level map, considering quantitative and qualitative perspectives of the technological fields.
In the technology level map, it was found that the development of the 28th patent vacuum was the priority among patent vacuums. When planning the new technology, the 28th patent vacuum must be considered a promising technology field. However, it is difficult to support decision-making, since there is no rule of thumb to determine specific technology that can be developed with existing technologies. In order to provide more concrete and elaborate guidelines for creating innovative ideas, the levels of individual technology in the patent vacuums was compared. In terms of subclass, H04M was not only identified as the most superior technology, although it was included in the 28th patented vacuum. H04M is a technology field that responds to circuits controlling other devices through phone lines. H04M can classify technologies according to overall smart devices, such as smartphones and smartwatches connected to other devices or systems through Bluetooth, cellular, Wi-Fi, etc. [78]. The results of the technology level map, where H04M was found to be the best, can be interpreted as reflecting the widespread use of smart devices, such as iPhones and iPads. In practice, applications guiding functions comprised of guide module sand mobile modules using smart devices are becoming increasingly diverse and popular. A patent document can also confirm the association with assistive technology for blind and visually impaired people, which is related to guide modules, including road conditions signal acquisition modules, data acquisition process control module, and the information. Various navigation systems using smart devices can be technological opportunities for blind and visually impaired people. More importantly, smart devices can recognize object, voice, and motion and can guide users through voice or vibration. Thus, guidance using the smart device can be very effective to blind and visually impaired people. For instance, with the availability of a gesture recognition system, user-friendly interactions have become possible and user-friendly systems can provide convenience to the visually impaired. Subsequently, based on the result of network analysis, we can identify that the 28th patent vacuum was the closest to the 29th patent vacuum, including G06F and H04M. We can assume that G06F and H04M impact each other and can be interpreted as having the potential to develop into new technologies. G06F, corresponding to a technology field for electronic digital data processing, includes technologies to analyze data generated in real-time in all dimensions. Additionally, it can be utilized to assist devices, including wearable guide devices using various sensors to process big data occurring in real-time that have appeared. A wrist strap that can guide the blind and visual impaired, according to acquisition user’s acceleration information and motion, can used as an example. Therefore, in order to develop the future market for the blind and visually impaired, it can be expected that it would be advantageous to develop assistive technology or products using big data and smart devices, more specifically, road situation signal acquisition modules and data acquisition process control modules.

5. Conclusions

This research explored new technological opportunities using patents in the field of assistive technology for blind and visually impaired people. As data analytic techniques have advanced, many researchers have attempted to quantitatively discover technological opportunities. Text mining according to computerized tools is the representative, but it requires expert knowledge to extract valid keywords to describe each patent document. In addition, previous studies have some limitations: applying the experimental results to the R&D is an uncertain plan because the mining tools are not only focused on quantitative process and the results cannot verify the technological value of the derived results. In order to extract reliable and objective information, we explored the technological opportunities by considering the characteristics of each method based on the IPC system in each phase. Firstly, the GTM-based patent map was employed to detect patent vacuums automatically and objectively by analyzing the subclass vectors that can reflect the feature of each patent document. It is also a critical point of the GTM-based patent map that it is able to generate the new vectors corresponding to the patent vacuums by inversely mapping from latent grid points into new data points. Based on the new vectors, the characteristics of vacuum cells and occupied cells can be objectively described in the GTM-based patent map and the relationships between cells in the map can be identified. In order to observe the technological association, we applied the SNA and calculated the Euclidean distance between the patent vacuum and other nodes to quantify the relevance to the patent vacuum, rather than relying on expert judgement. Finally, the technology level was measured by the TAI and TII indexes to assess the actual state of technological development. Consequently, promising opportunity technologies in the field of assistive technology for the blind and visually impairment can be derived, as aforementioned. This research highlights how to identify opportunities for upcoming new technologies and obtain detail and practical information in interpreting the results in a quantitative way. All analytic processes were computerized; therefore, it is possible to save considerable time in exploring technological opportunities. This research also provides critical insights for researchers and developers for projecting strategical R&D plans related to technologies that may emerge in the near future. In addition, this study can be an ample source for decision/policy makers to project new contents. These activities can invent new technologies or products using technological convergence.
Despite aforementioned advantages of this research, some limitations still remain when identifying specific technologies. IPC-based patent analysis can be regarded as analysis at the macro level that focuses on performing statistical analysis. Therefore, it is difficult to distinctly specify more microscopic technologies that can be judged to lead the future industry. Based on these limitations, this research should be improved in the future. By applying text mining to the patent document corresponding to the priority level of the technology field based on the IPC system, the core technology for the patent data can be easily grasped. Additionally, it is possible to identify more detail and informative contents by considering overall information of patents from both macro and micro perspectives.

Author Contributions

J.H. performed data curation, formal analysis, investigation, methodology, validation, and writing of the original manuscript; K.H.K. contributed to conceptualization, funding acquisition, investigation, and project administration; J.G.H. contributed to conceptualization, investigation, and project administration; S.J. and J.Y. both contributed to data curation and formal analysis; C.L. contributed to conceptualization, investigation, supervision, and editing of the manuscript. All authors have read and agreed to the published version of the manuscript.

Funding

This research was supported by “Development of activation technology of voice induction machine for the visually impaired people” of the Korea Agency for Infrastructure Technology Advancement, Republic of Korea.

Conflicts of Interest

The authors declare no conflict of interest.

References

  1. World Health Organization. Visual Impairment and Blindness. Available online: https://www.who.int/news-room/fact-sheets/detail/blindness-and-visual-impairment (accessed on 17 August 2020).
  2. Swenor, B.K.; Lee, M.J.; Varadaraj, V.; Whitson, H.E.; Ramulu, P.Y. Aging with vision loss: A framework for assessing the impact of visual impairment on older adults. Gerontologist 2019, 60, 989–995. [Google Scholar] [CrossRef] [PubMed]
  3. Holden, B.A.; Fricke, T.R.; Ho, S.M.; Wong, R.; Schlenther, G.; Cronjé, S.; Butnett, A.; Papas, E.; Naidoo, K.S.; Frick, K.D. Global vision impairment due to uncorrected presbyopia. Arch. Ophthalmol. 2008, 126, 1731–1739. [Google Scholar] [CrossRef] [PubMed] [Green Version]
  4. Bourne, R.R.; Flaxman, S.R.; Braithwaite, T.; Cicinelli, M.V.; Das, A.; Jonas, J.B.; Keeffe, J.; Kempen, J.H.; Leasher, J.; Limburg, H.; et al. Magnitude, temporal trends, and projections of the global prevalence of blindness and distance and near vision impairment: A systematic review and meta-analysis. Lancet Glob. Health 2017, 5, e888–e897. [Google Scholar] [CrossRef] [Green Version]
  5. Elmannai, W.M.; Elleithy, K.M. A highly accurate and reliable data fusion framework for guiding the visually impaired. IEEE Access 2018, 6, 33029–33054. [Google Scholar] [CrossRef]
  6. Hersh, M.A.; Johnson, M.A. On modelling assistive technology systems–Part I: Modelling framework. Technol. Disabil. 2008, 20, 193–215. [Google Scholar] [CrossRef] [Green Version]
  7. Bhowmick, A.; Hazarika, S.M. An insight into assistive technology for the visually impaired and blind people: State-of-the-art and future trends. J. Multimodal User Interfaces 2017, 11, 149–172. [Google Scholar] [CrossRef]
  8. Farcy, R.; Leroux, R.; Jucha, A.; Damaschini, R.; Grégoire, C.; Zogaghi, A. Electronic travel aids and electronic orientation aids for blind people: Technical, rehabilitation and everyday life points of view. In Proceedings of the Conference & Workshop on Assistive Technologies for People with Vision & Hearing Impairments Technology for Inclusion, Los Alamitos, CA, USA, 9–11 July 2006. [Google Scholar]
  9. Munteanu, D.; Ionel, R. Voice-controlled smart assistive device for visually impaired individuals. In Proceedings of the 2016 12th IEEE International Symposium on Electronics and Telecommunications (ISETC), Timisoara, Romania, 27–28 October 2016; pp. 186–190. [Google Scholar]
  10. Tapu, R.; Mocanu, B.; Zaharia, T. Wearable assistive devices for visually impaired: A state of the art survey. Pattern Recognit. Lett. 2018, 137, 37–52. [Google Scholar] [CrossRef]
  11. Schinazi, V.R.; Thrash, T.; Chebat, D.R. Spatial navigation by congenitally blind individuals. WIREs Cogn. Sci. 2016, 7, 37–58. [Google Scholar] [CrossRef] [Green Version]
  12. Hakobyan, L.; Lumsden, J.; O’Sullivan, D.; Bartlett, H. Mobile assistive technologies for the visually impaired. Surv. Ophthalmol. 2013, 58, 513–528. [Google Scholar] [CrossRef] [Green Version]
  13. Lee, H.; Kim, C.; Cho, H.; Park, Y. An ANP-based technology network for identification of core technologies: A case of telecommunication technologies. Expert Syst. Appl. 2009, 36, 894–908. [Google Scholar] [CrossRef]
  14. Coates, V.; Farooque, M.; Klavans, R.; Lapid, K.; Linstone, H.A.; Pistorius, C.; Porter, A.L. On the future of technological forecasting. Technol. Forecast. Soc. Chang. 2001, 67, 1–17. [Google Scholar] [CrossRef]
  15. Yoon, B.; Magee, C.L. Exploring technology opportunities by visualizing patent information based on generative topographic mapping and link prediction. Technol. Forecast. Soc. Chang. 2018, 132, 105–117. [Google Scholar] [CrossRef]
  16. Park, I.; Yoon, B. Technological opportunity discovery for technological convergence based on the prediction of technology knowledge flow in a citation network. J. Informetr. 2018, 12, 1199–1222. [Google Scholar] [CrossRef]
  17. Lee, S.; Yoon, B.; Park, Y. An approach to discovering new technology opportunities: Keyword-based patent map approach. Technovation 2009, 29, 481–497. [Google Scholar] [CrossRef]
  18. Ernst, H. The use of patent data for technological forecasting: The diffusion of CNC-technology in the machine tool industry. Small Bus. Econ. 1997, 9, 361–381. [Google Scholar] [CrossRef]
  19. Park, Y.; Yoon, B.; Lee, S. The idiosyncrasy and dynamism of technological innovation across industries: Patent citation analysis. Technol. Soc. 2005, 27, 471–485. [Google Scholar] [CrossRef]
  20. World Intellectual Property Organization. International Patent Classification (IPC). Available online: https://www.wipo.int/classifications/ipc/en/ (accessed on 20 August 2020).
  21. Leydesdorff, L.; Kushnir, D.; Rafols, I. Interactive overlay maps for US patent (USPTO) data based on International Patent Classification (IPC). Scientometrics 2014, 98, 1583–1599. [Google Scholar] [CrossRef] [Green Version]
  22. Kim, C.; Lee, H.; Seol, H.; Lee, C. Identifying core technologies based on technological cross-impacts: An association rule mining (ARM) and analytic network process (ANP) approach. Expert Syst. Appl. 2011, 38, 12559–12564. [Google Scholar] [CrossRef]
  23. Yoon, J.; Park, H.; Seo, W.; Lee, J.M.; Coh, B.Y.; Kim, J. Technology opportunity discovery (TOD) from existing technologies and products: A function-based TOD framework. Technol. Forecast. Soc. Chang. 2015, 100, 153–167. [Google Scholar] [CrossRef]
  24. Lee, C.; Jeon, J.; Park, Y. Monitoring trends of technological changes based on the dynamic patent lattice: A modified formal concept analysis approach. Technol. Forecast. Soc. Chang. 2011, 78, 690–702. [Google Scholar] [CrossRef]
  25. Klevorick, A.K.; Levin, R.C.; Nelson, R.R.; Winter, S.G. On the sources and significance of interindustry differences in technological opportunities. Res. Policy 1995, 24, 185–205. [Google Scholar] [CrossRef]
  26. Olsson, O. Technological opportunity and growth. J. Econ. Growth 2005, 10, 31–53. [Google Scholar] [CrossRef]
  27. Porter, A.L.; Detampel, M.J. Technology opportunities analysis. Technol. Forecast. Soc. Chang. 1995, 49, 237–255. [Google Scholar] [CrossRef]
  28. Mitchell, V.W. Using Delphi to forecast in new technology industries. Mark. Intell. Plan. 1992, 10, 4–9. [Google Scholar] [CrossRef]
  29. Jun, S.; Park, S.S.; Jang, D.S. Technology forecasting using matrix map and patent clustering. Ind. Manag. Data Syst. 2012, 112, 786–807. [Google Scholar] [CrossRef]
  30. Kim, Y.G.; Suh, J.H.; Park, S.C. Visualization of patent analysis for emerging technology. Expert Syst. Appl. 2008, 34, 1804–1812. [Google Scholar] [CrossRef]
  31. Hsueh, C.C.; Wang, C.C. The use of social network analysis in knowledge diffusion research from patent data. In Proceedings of the 2009 International Conference on Advances in Social Network Analysis and Mining, Athens, Greece, 20–22 July 2009; pp. 393–398. [Google Scholar]
  32. Son, C.; Suh, Y.; Jeon, J.; Park, Y. Development of a GTM-based patent map for identifying patent vacuums. Expert Syst. Appl. 2012, 39, 2489–2500. [Google Scholar] [CrossRef]
  33. Yoon, B.U.; Yoon, C.B.; Park, Y.T. On the development and application of a self–organizing feature map–based patent map. R&D Manag. 2002, 32, 291–300. [Google Scholar]
  34. Chen, R. Design patent map visualization display. Expert Syst. Appl. 2009, 36, 12362–12374. [Google Scholar] [CrossRef]
  35. Song, K.; Kim, K.S.; Lee, S. Discovering new technology opportunities based on patents: Text-mining and F-term analysis. Technovation 2017, 60, 1–14. [Google Scholar] [CrossRef]
  36. Lee, C.; Kang, B.; Shin, J. Novelty-focused patent mapping for technology opportunity analysis. Technol. Forecast. Soc. Chang. 2015, 90, 355–365. [Google Scholar] [CrossRef]
  37. Wold, S.; Esbensen, K.; Geladi, P. Principal component analysis. Chemom. Intell. Lab. Syst. 1987, 2, 37–52. [Google Scholar] [CrossRef]
  38. Johnson, R.A.; Wichern, D.W. Applied Multivariate Statistical Analysis, 6th ed.; Prentice Hall: Upper Saddle River, NJ, USA, 1988. [Google Scholar]
  39. Kohonen, T. The self-organizing map. Proc. IEEE 1998, 78, 1464–1480. [Google Scholar] [CrossRef]
  40. Bishop, C.M.; Svensén, M.; Williams, C.K. GTM: The generative topographic mapping. Neural Comput. 1998, 10, 215–234. [Google Scholar] [CrossRef]
  41. Jeong, Y.; Lee, K.; Yoon, B.; Phaal, R. Development of a patent roadmap through the Generative Topographic Mapping and Bass diffusion model. J. Eng. Technol. Manag. 2015, 38, 53–70. [Google Scholar] [CrossRef]
  42. Strogatz, S.H. Exploring complex networks. Nature 2001, 410, 268–276. [Google Scholar] [CrossRef] [PubMed] [Green Version]
  43. Gelsing, L. Innovation and the Development of Industrial Networks. In National Systems of Innovation: Toward a Theory of Innovation and Interactive Learning; Lundvall, B.A., Ed.; Anthem Press: New York, NY, USA, 2010; pp. 119–132. [Google Scholar]
  44. Yoon, B.; Park, Y. A text-mining-based patent network: Analytical tool for high-technology trend. J. High Technol. Manag. Res. 2004, 15, 37–50. [Google Scholar] [CrossRef]
  45. Breschi, S.; Lissoni, F. Knowledge networks from patent data. In Handbook of Quantitative Science and Technology Research: The Use of Publication and Patent Statistics in Studies of S&T Systems; Moed, H., Glänzel, W., Schmoch, U., Eds.; Springer: Dordrecht, The Netherlands, 2004; pp. 613–643. [Google Scholar]
  46. Redner, S. How popular is your paper? An empirical study of the citation distribution. Eur. Phys. J. B-Condens. Matter Complex Syst. 1998, 4, 131–134. [Google Scholar] [CrossRef]
  47. Hall, B.H.; Adam, B. The NBER Patent-Citations Data File: Lessons, Insights, and Methodological Tools. Pat. Cit. Innov. Window Knowl. Econ. 2002, 403–470. [Google Scholar] [CrossRef]
  48. Lai, K.K.; Wu, S.J. Using the patent co-citation approach to establish a new patent classification system. Inf. Process. Manag. 2005, 41, 313–330. [Google Scholar] [CrossRef]
  49. Stuart, T.E.; Podolny, J.M. Local search and the evolution of technological capabilities. Strateg. Manag. J. 1996, 17, 21–38. [Google Scholar] [CrossRef]
  50. Courtial, J.; Callon, M.; Sigogneau, A. The use of patent titles for identifying the topics of invention and forecasting trends. Scientometrics 1993, 26, 231–242. [Google Scholar] [CrossRef]
  51. OCSE. Using Patent Data as Science and Technology Indicators: Patent Manual 1994; OECD: Paris, France, 1994.
  52. Breschi, S.; Lissoni, F.; Malerba, F. Knowledge-relatedness in firm technological diversification. Res. Policy 2003, 32, 69–87. [Google Scholar] [CrossRef]
  53. Engelsman, E.C.; van Raan, A.F. A patent-based cartography of technology. Res. Policy 1994, 23, 1–26. [Google Scholar] [CrossRef]
  54. Scott, J. Social network analysis. Sociology 1988, 22, 109–127. [Google Scholar] [CrossRef]
  55. Ter Wal, A.L.; Boschma, R.A. Applying social network analysis in economic geography: Framing some key analytic issues. Ann. Reg. Sci. 2009, 43, 739–756. [Google Scholar] [CrossRef] [Green Version]
  56. Newman, M.E. Who is the best connected scientist? A study of scientific coauthorship networks. In Complex Networks; Ben-Naim, E., Frauenfelder, H., Toroczkai, Z., Eds.; Springer: Berlin/Heidelberg, Germany, 2004; Volume 650, pp. 337–370. [Google Scholar]
  57. Brass, D.J.; Burkhardt, M.E. Centrality and power in organizations. Netw. Organ. Struct. Form Action 1992, 191, 198–213. [Google Scholar]
  58. Freeman, L.C. Centrality in social networks conceptual clarification. Soc. Netw. 1978, 1, 215–239. [Google Scholar] [CrossRef] [Green Version]
  59. Ho, Y.; Chiu, H. A social network analysis of leading semiconductor companies’ knowledge flow network. Asia Pac. J. Manag. 2013, 30, 1265–1283. [Google Scholar] [CrossRef]
  60. Park, S.; Lee, S.J.; Jun, S. A network analysis model for selecting sustainable technology. Sustainability 2015, 7, 13126–13141. [Google Scholar] [CrossRef] [Green Version]
  61. Borgatti, S.P. Centrality and network flow. Soc. Netw. 2005, 27, 55–71. [Google Scholar] [CrossRef]
  62. Yoon, B.; Park, I.; Yun, D.; Park, G. Exploring promising vacant technology areas in a technology-oriented company based on bibliometric analysis and visualisation. Technol. Anal. Strateg. Manag. 2009, 31, 388–405. [Google Scholar] [CrossRef]
  63. Joung, J.; Kim, K. Monitoring emerging technologies for technology planning using technical keyword based analysis from patent data. Technol. Forecast. Soc. Chang. 2017, 114, 281–292. [Google Scholar] [CrossRef]
  64. Kürtössy, J. Innovation indicators derived from patent data. Period. Polytech. Soc. Manag. Sci. 2004, 12, 91–101. [Google Scholar]
  65. Rotolo, D.; Hicks, D.; Martin, B.R. What is an emerging technology? Res. Policy 2015, 44, 1827–1843. [Google Scholar] [CrossRef] [Green Version]
  66. Small, H.; Boyack, K.W.; Klavans, R. Identifying emerging topics in science and technology. Res. Policy 2014, 43, 1450–1467. [Google Scholar] [CrossRef]
  67. Arthur, W.B. The structure of invention. Res. Policy 2007, 36, 274–287. [Google Scholar] [CrossRef]
  68. Srinivasan, R. Sources, characteristics and effects of emerging technologies: Research opportunities in innovation. Ind. Mark. Manag. 2008, 37, 633–640. [Google Scholar] [CrossRef]
  69. Porter, A.L.; Roessner, J.D.; Jin, X.Y.; Newman, N.C. Measuring national ‘emerging technology’capabilities. Sci. Public Policy 2002, 29, 189–200. [Google Scholar] [CrossRef]
  70. Stirling, A. Risk, precaution and science: Towards a more constructive policy debate: Talking point on the precautionary principle. EMBO Rep. 2007, 8, 309–315. [Google Scholar] [CrossRef] [Green Version]
  71. Kim, J.; Lee, S. Patent databases for innovation studies: A comparative analysis of USPTO, EPO, JPO and KIPO. Technol. Forecast. Soc. Chang. 2015, 92, 332–345. [Google Scholar] [CrossRef]
  72. Lupu, M.; Fujii, A.; Oard, D.W.; Iwayama, M.; Kando, N. Patent-Related Tasks at NTCIR. In Current Challenges in Patent Information Retrieval, 2nd ed.; Mayer, K., Kando, N., Trippe, A.J., Eds.; Springer: Berlin/Heidelberg, Germany, 2017; Volume 37, pp. 77–111. [Google Scholar]
  73. Ardito, L.; D’Adda, D.; Petruzzelli, A.M. Mapping innovation dynamics in the Internet of Things domain: Evidence from patent analysis. Technol. Forecast. Soc. Chang. 2018, 136, 317–330. [Google Scholar] [CrossRef]
  74. Fall, C.J.; Törcsvári, A.; Fiévet, P.; Karetka, G. Automated categorization of German-language patent documents. Expert Syst. Appl. 2004, 26, 269–277. [Google Scholar] [CrossRef]
  75. Epskamp, S.; Fried, E.I. A tutorial on regularized partial correlation networks. Psychol. Methods 2018, 23, 617. [Google Scholar] [CrossRef] [PubMed] [Green Version]
  76. Chen, H.; Zhang, G.; Lu, J.; Zhu, D. A two-step agglomerative hierarchical clustering method for patent time-dependent data. In Foundations and Applications of Intelligent Systems; Sun, F., Li, T., Li, H., Eds.; Springer: Berlin/Heidelberg, Germany, 2014; Volume 213, pp. 111–121. [Google Scholar]
  77. Benner, M.; Waldfogel, J. Close to you? Bias and precision in patent-based measures of technological proximity. Res. Policy 2008, 37, 1556–1567. [Google Scholar] [CrossRef] [Green Version]
  78. Silverio-Fernández, M.; Renukappa, S.; Suresh, S. What is a smart device?—A conceptualisation within the paradigm of the internet of things. Vis. Eng. 2018, 6, 3. [Google Scholar] [CrossRef] [Green Version]
Figure 1. Example of the generative topographic mapping (GTM)-based patent map.
Sustainability 12 08689 g001
Figure 2. Technology level map.
Sustainability 12 08689 g002
Figure 3. Overall framework.
Sustainability 12 08689 g003
Figure 4. GTM-based patent map.
Sustainability 12 08689 g004
Figure 5. (a) GTM-based patent map, (b) example of new vectors according to inverse mapping.
Sustainability 12 08689 g005
Figure 6. Network between technology fields.
Sustainability 12 08689 g006
Figure 7. Relative level of patent vacuums derived in the GTM-based patent map.
Sustainability 12 08689 g007
Figure 8. Relative level of technologies derived from patent vacuums.
Sustainability 12 08689 g008
Table 1. The format of the international patent classification (IPC) vector.
A61HG06FG01CG08B A43B
Patent 10001 0
Patent 20100 0
Patent 30000 0
Patent 40000 0
Patent 15100100 0
Table 2. Subclass vector of patent vacuum.
Vacuum (No.)Subclass
12345678910111213141516171819202122232425
1(1)1000000001000000000000000
2(5)1000010000000000000000000
3(16)0000000010000000000000000
4(21)0000000001000010000000000
5(23)0010001000000000000000000
6(28)0000001000000000000000000
7(30)0110000000000000000000000
Table 3. Subclass corresponding to the patent vacuum.
Vacuum (No.)Subclass
1(1)A61H, A61F
2(5)G01S, A61H
3(16)G06K
4(21)A61F, B66B
5(23)H04M, G01C
6(28)H04M
7(30)G06F, G01C
Table 4. Euclidean distance from vacant node.
Vacant NodeNodeEuclidean DistanceVacant NodeNodeEuclidean DistanceVacant NodeNodeEuclidean Distance
120.67223220.64130240.787
150.905290.681360.806
30.982241.292290.956
91.000361.700351.162
81.065351.954221.547
5120.69228290.592
111.010220.735
41.086361.462
101.348351.457
61.416241.462
16100.71321200.548
170.760270.563
111.073260.694
41.443250.948
181.744321.074
Publisher’s Note: MDPI stays neutral with regard to jurisdictional claims in published maps and institutional affiliations.

