Significant Labels in Sentiment Analysis of Online Customer Reviews of Airlines


Abstract
1. Introduction
2. Literature Review
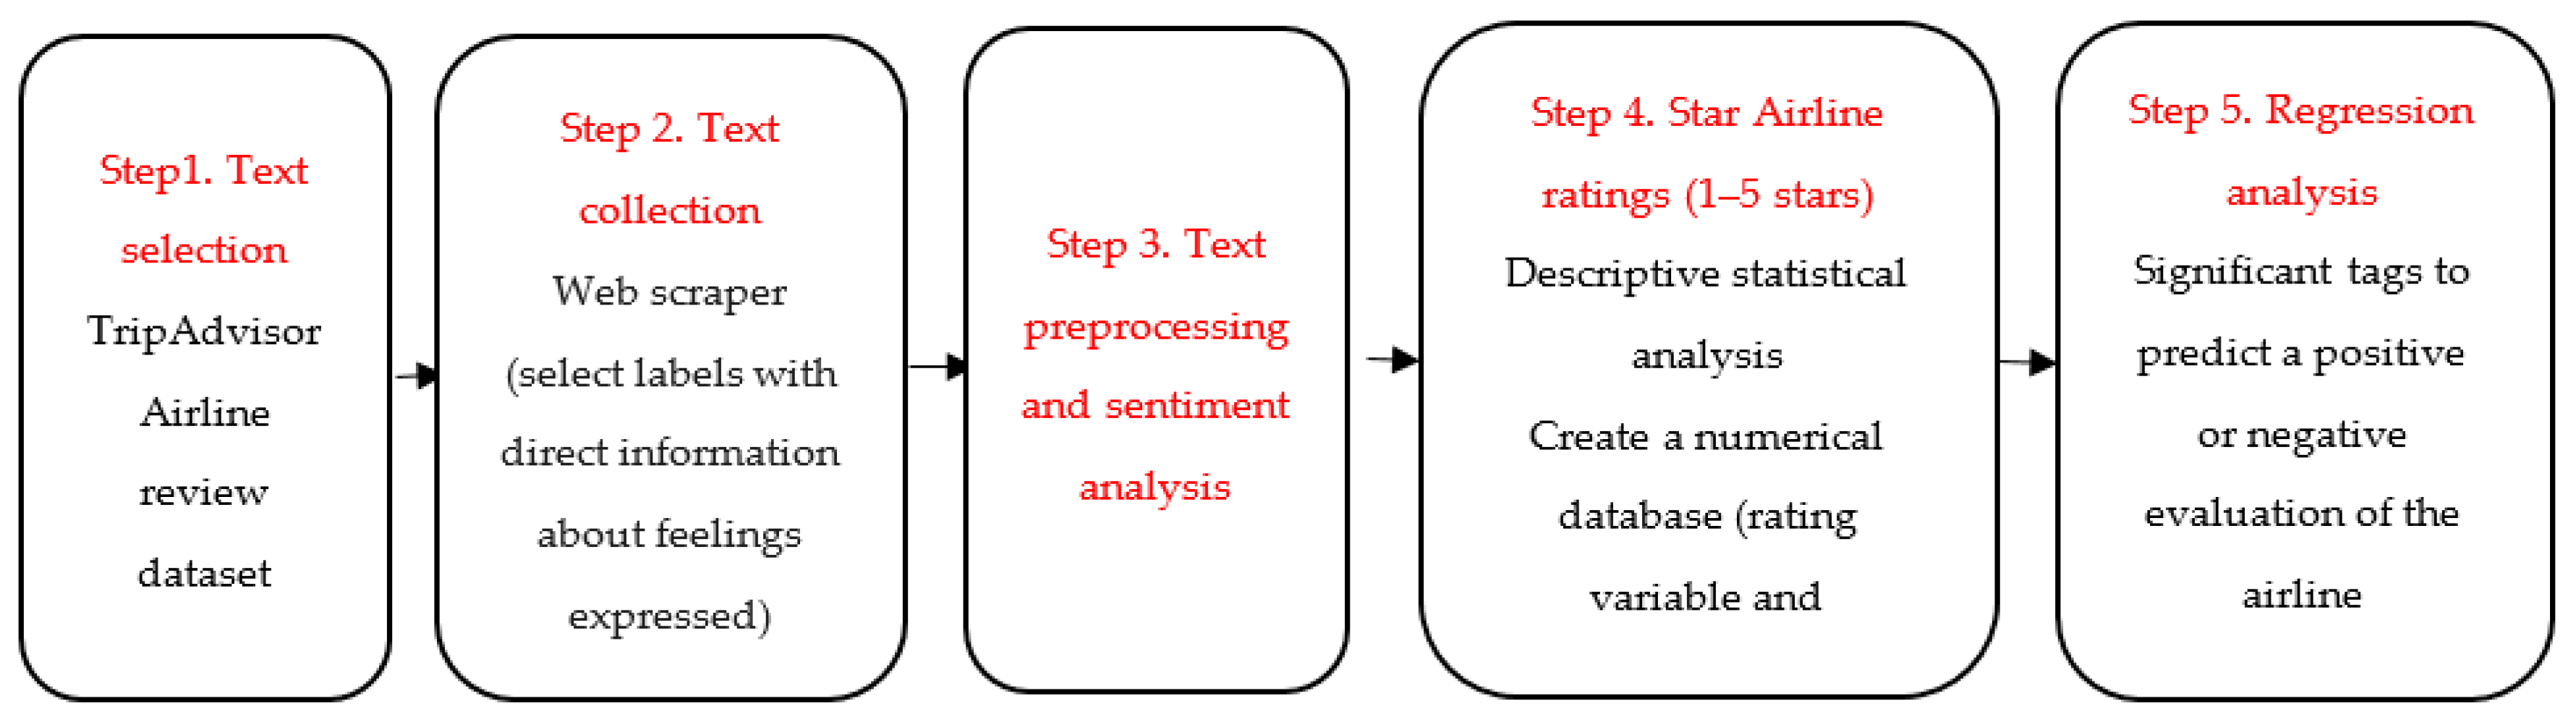
3. Research Methodology
4. Analysis of Results
4.1. Regression Analysis
4.2. Discussion of Results
5. Conclusions
Author Contributions
Funding
Conflicts of Interest
References
- Araque, O.; Corcuera-Platas, I.; Sánchez-Rada, F.; Iglesias, C.A. Enhancing deep learning sentiment analysis with ensemble techniques in social applications. Expert Syst. Appl. 2017, 77, 236–246. [Google Scholar] [CrossRef]
- Liu, B. Sentiment Analysis: Mining Opinions, Sentiments, and Emotions; Cambridge University Press: Cambridge, UK, 2015. [Google Scholar]
- Salminen, J.; Yoganathan, C.; Corporan, J.; Jansen, B.J.; Jung, S.G. Machine learning approach to auto-tagging online content for content marketing efficiency: A comparative analysis between methods and content type. J. Bus. Res. 2017, 101, 203–217. [Google Scholar] [CrossRef]
- Balducci, B.; Marinova, D. Unstructured data in marketing. J. Acad. Mark. Sci. 2018, 46, 557–590. [Google Scholar] [CrossRef]
- Pang, B.; Lee, L.; Vaithyanathan, S. Thumbs up? Sentiment classification using machine learning techniques. In Proceedings of the ACL-02 Conference on Empirical Methods in Natural Language Processing—Volume 10, Association for Computational Linguistics, Stroudsburg, PA, USA, 10 July 2002; pp. 79–86. [Google Scholar]
- Melville, P.; Gryc, W.; Lawrence, R.D. Sentiment analysis of blogs by combining lexical knowledge with text classification. In Proceedings of the 15th ACM SIGKDD International Conference on Knowledge Discovery and Data Mining, New York, NY, USA, 28 June–1 July 2009; pp. 1275–1284. [Google Scholar] [CrossRef]
- Wang, S.; Manning, C.D. Baselines and bigrams: Simple, good sentiment and topic classification. In Proceedings of the 50th Annual Meeting of the Association for Computational Linguistics: Short Papers—Volume 2, Association for Computational Linguistics, Jeju Island, Korea, 8–14 July 2012; pp. 90–94. [Google Scholar]
- Sharma, A.; Park, S.; Nicolau, J.L. Testing loss aversion and diminishing sensitivity in review sentiment. Tour. Manag. 2020, 77, 104020. [Google Scholar] [CrossRef]
- Kiritchenko, S.; Zhu, X.; Mohammad, S.M. Sentiment analysis of short informal texts. J. Artif. Intell. Res. 2014, 50, 723–762. [Google Scholar] [CrossRef]
- Lucini, F.R.; Tonetto, L.M.; Fogliatto, F.S.; Anzanello, M.J. Text mining approach to explore dimensions of airline customer satisfaction using customer reviews. J. Air Transp. Manag. 2020, 83, 101760. [Google Scholar] [CrossRef]
- Rodríguez-Díaz, M.; Espino-Rodríguez, T.F. A methodology for a comparative analysis of the lodging tourism destinations based on online customer review. J. Destin. Mark. Manag. 2018, 8, 147–160. [Google Scholar] [CrossRef]
- Zaki Ahmed, A.; Rodríguez-Díaz, M. Analyzing the Online Reputation and Positioning of Airlines. Sustainability 2020, 12, 1184. [Google Scholar] [CrossRef]
- Rodriguez-Díaz, M.; Rodríguez-Voltes, C.I.; Rodríguez-Voltes, A.C. Gap analysis of the online reputation. Sustainability 2018, 10, 1603. [Google Scholar] [CrossRef]
- Horster, E.; Gottschalk, C. Computer-assisted webnography: A new approach to online reputation management in tourism. J. Vacat. Mark. 2012, 18, 229–238. [Google Scholar] [CrossRef]
- Yacouel, N.; Fleischer, A. The role of cybermediaries in reputation building and price premiums in the online hotel market. J. Travel Res. 2012, 51, 219–226. [Google Scholar] [CrossRef]
- Li, H.; Ye, Q.; Law, R. Determinants of customer satisfaction in the hotel industry: An application of online review analysis. Asia Pac. J. Tour. Res. 2013, 18, 784–802. [Google Scholar] [CrossRef]
- Gössling, S.; Hall, C.M.; Anderson, A.C. The Manager’s Dilemma: A Conceptualization of Online Review Manipulation Strategies. Curr. Issues Tour. 2018, 21, 484–503. Available online: http://www.tandfonline.com/doi/full/10.1080/13683500.2015.1127337 (accessed on 15 September 2018). [CrossRef]
- Rodríguez-Díaz, M.; Espino-Rodríguez, T.F. Determining the reliability and validity of online reputation databases for lodging: Booking.com, TripAdvisror, and HolidayCheck. J. Vacat. Mark. 2018, 24, 261–274. [Google Scholar]
- Chun, R. Corporate reputation: Meaning and measurement. Int. J. Manag. Rev. 2005, 7, 91–109. [Google Scholar] [CrossRef]
- Vermeulen, I.E.; Seegers, D. Tried and tested: The impact of online hotel reviews on consumer consideration. Tour. Manag. 2009, 30, 123–127. [Google Scholar] [CrossRef]
- Ye, Q.; Law, R.; Gu, B.; Chen, W. The influence of user-generated content on traveller behaviour: An empirical investigation on the effects of e-word-of-mouth to hotel online bookings. Comput. Hum. Behav. 2011, 27, 634–639. [Google Scholar] [CrossRef]
- Hernández Estárico, E.; Fuentes Medina, M.; Morini Marrero, S. Una aproximación a la reputación en línea de los establecimientos hoteleros españoles. Pap. Tur. 2012, 52, 63–88. [Google Scholar]
- Varini, K.; Sirsi, P. Social Media and Revenue Management: Where Should the Two Meet? Available online: https://www.researchgate.net/publication/264928889_Social_media_and_revenue_management_Where_should_the_two_meet (accessed on 20 August 2012).
- Kim, W.G.; Lim, H.; Brymer, R.A. The effectiveness of managing social media on hotel performance. Int. J. Hosp. Manag. 2015, 44, 165–171. [Google Scholar] [CrossRef]
- Lee, S.H.; Ro, H. The impact of online reviews on attitude changes: The differential effects of review attributes and consumer knowledge. Int. J. Hosp. Manag. 2016, 56, 1–9. [Google Scholar] [CrossRef]
- Rodríguez Díaz, M.; Espino Rodríguez, T.F.; Rodríguez Díaz, R. A model of market positioning base on value creation and service quality in the lodging industry: An empirical application of online customer reviews. Tour. Econ. 2015, 21, 1273–1294. [Google Scholar] [CrossRef]
- Ye, Q.; Li, H.; Wang, Z.; Law, R. The influence of hotel price on perceived service quality and value in e-tourism: An empirical investigation based on online traveller reviews. J. Hosp. Tour. Res. 2014, 38, 23–39. [Google Scholar] [CrossRef]
- Torres, E.N. Deconstructing service quality and customer satisfaction: Challenges and directions for future research. J. Hosp. Mark. Manag. 2014, 23, 652–677. [Google Scholar] [CrossRef]
- Oliver, R.L. Satisfaction: A Behavioural Perspective on the Consumer; McGraw-Hill: New York, NY, USA, 1997. [Google Scholar]
- Tellis, G.J.; Johnson, J. The value of quality. Mark. Sci. 2007, 26, 758–773. [Google Scholar] [CrossRef]
- Fornell, C.; Mithas, S.; Morgeson, F.V., III; Krishnan, M.S. Customer satisfaction and stock prices: High returns, low risk. J. Mark. 2006, 70, 3–14. [Google Scholar] [CrossRef]
- Jacobson, R.; Mizik, N. Assessing the Value-Relevance of Customer Satisfaction. Available online: https://papers.ssrn.com/sol3/papers.cfm?abstract_id=990783 (accessed on 21 March 2009).
- Fornell, C.; Mithas, S.; Morgeson, F.V., III. Commentary—The economic and statistical significance of stock returns on customer satisfaction. Mark. Sci. 2009, 28, 820–825. [Google Scholar] [CrossRef]
- Chen, Y.; Ganesan, S.; Liu, Y. Does a firm’s product-recall strategy affect its financial value? An examination of strategic alternatives during product-harm crises. J. Mark. 2009, 73, 214–226. [Google Scholar] [CrossRef]
- Luo, X.; Bhattacharya, C.B. Corporate social responsibility, customer satisfaction, and market value. J. Mark. 2006, 70, 1–18. [Google Scholar] [CrossRef]
- Luo, X.; Homburg, C. Satisfaction, complaint, and the stock value gap. J. Mark. 2008, 72, 29–43. [Google Scholar] [CrossRef]
- O’sullivan, D.; Hutchinson, M.C.; O’Connell, V. Empirical evidence of the stock market’s (mis) pricing of customer satisfaction. Int. J. Res. Mark. 2009, 26, 154–161. [Google Scholar] [CrossRef]
- Ittner, C.; Larcker, D.; Taylor, D. Commentary—The stock market’s pricing of customer satisfaction. Mark. Sci. 2009, 28, 826–835. [Google Scholar] [CrossRef]
- Sharma, A.; Dey, S. A comparative study of feature selection and machine learning techniques for sentiment analysis. In Proceedings of the 2012 ACM Research in Applied Computation Symposium, San Antonio, TX, USA, 23–26 October 2012. [Google Scholar]
- Honeycutt, C.; Herrings, S.C. Beyond microblogging: Conversation and collaboration via Twitter. In Proceedings of the 42nd Hawaii International Conference on System Sciences, Big Island, HI, USA, 5–8 January 2009; pp. 1–10. [Google Scholar] [CrossRef]
- Boyd, D.M.; Ellison, N.B. Social network sites: Definition, history, and scholarship. J. Comput. Mediat. Commun. 2007, 13, 210–230. [Google Scholar] [CrossRef]
- Chunga, A.; Andreeva, P.; Benyoucef, M.; Duane, A.; O’Reilly, P. Managing an organisation’s social media presence: An empirical stages of growth model. Int. J. Inf. Manag. 2017, 37, 1405–1417. [Google Scholar] [CrossRef]
- Saura, J.R.; Palos-Sánchez, P.R.; Ríos Martín, M.A. Attitudes to environmental factors in the tourism sector expressed in online comments: An exploratory study. Int. J. Environ. Res. Public Health 2018, 15, 553. [Google Scholar] [CrossRef] [PubMed]
- Das, S.; Chen, M. Yahoo! for Amazon: Extracting market sentiment from stock message boards. Manag. Sci. 2007, 35, 43. [Google Scholar]
- Tong, R.M. An operational system for detecting and tracking opinions in on-line discussion. In Proceedings of the SIGIR Workshop on Operational Text Classification, New Orleans, LA, USA, 1 September 2001; Volume 1. [Google Scholar]
- Turney, P.D. Thumbs up or thumbs down? Semantic orientation applied to unsupervised classification of reviews. In Proceedings of the 40th Annual Meeting on Association for Computational Linguistics, Association for Computational Linguistics, Philadelphia, PA, USA, 7–12 July 2002; pp. 417–424. [Google Scholar]
- Fiorini, P.M.; LIPSKY, L.R. Search marketing traffic and performance models. Comput. Stand. Interfaces 2012, 34, 517–526. [Google Scholar] [CrossRef]
- Liu, Y.; Bi, J.W.; Fan, Z.P. A method for ranking products through online reviews based on sentiment classification and interval-valued intuitionistic fuzzy TOPSIS. Int. J. Inf. Technol. Decis. Mak. 2017, 16, 1497–1522. [Google Scholar] [CrossRef]
- Debes, V.; Sandeep, K.; Vinnett, G. Predicting information diffusion probabilities in social networks: A Bayesian networks based approach. J. Knowl.-Based Syst. 2017, 133, 66–76. [Google Scholar] [CrossRef]
- Insúa Yánez, A. Sistema Deep Learning Para el Análisis de Sentimientos en Opiniones de Productos Para la Ordenación de Resultados de un Buscador Semántico. Diploma Thesis, Universidad de La Coruña, La Coruña, Spain, 2019. [Google Scholar]
- McCallum, A.; Nigam, K.A. Comparison of event models for Naive Bayes text classification. In AAAI/ICML-98 Workshop on Learning for Text Categorization; AAAI Press: Menlo Park, CA, USA, 1998; pp. 41–48. [Google Scholar]
- Berger, A.L.; Pietra, V.J.D.; Pietra, S.A.D. A Maximum entropy approach to natural language processing. Comput. Linguist. 1996, 22, 39–71. [Google Scholar]
- Yang, Y.; Lin, X. A re-examination of text categorization methods. In Proceedings of the SIGIR99: 22nd Annual International ACM SIGIR Conference on Research and Development in Information Retrieval, Berkeley, CA, USA, 15–19 August 1999; pp. 42–49. [Google Scholar]
- Quinlan, J.R. C4.5: Programs for Machine Learning; Morgan Kaufmann Publishers: Burlington, MA, USA, 1993. [Google Scholar]
- Joachims, T. Text categorization with support vector machines: Learning with many relevant features. In Proceedings of the 10th European Conference on Machine Learning (ECML-98), Chemnitz, Germany, 21–23 April 1998; pp. 137–142. [Google Scholar]
- Levy, O.; Goldberg, Y. Dependency-based word embeddings. In Proceedings of the 52nd Annual Meeting of the Association for Computational Linguistics, Baltimore, MA, USA, 23–25 June 2014; pp. 302–308. [Google Scholar]
- Kusner, M.J.; Sun, Y.; Kolkin, N.I.; Weinberger, K.Q. From word embeddings to document distances. In Proceedings of the 32nd International Conference on Machine Learning, Lille, France, 7–9 July 2015. [Google Scholar]
- González-Rodríguez, M.R.; Martínez-Torres, R.; Toral, S. Post-visit and pre-visit tourist destination image through eWOM sentiment analysis and perceived helpfulness. Int. J. Contemp. Hosp. Manag. 2016, 28, 2609–2627. [Google Scholar] [CrossRef]
- Kwok, L.; Xie, K.; Tori, R. Thematic framework of online review research. A systematic analysis of contemporary literature on seven major hospitality and tourism journals. Int. J. Contemp. Hosp. Manag. 2017, 29. [Google Scholar] [CrossRef]
- Nieto-García, M.; Muñoz-Gallego, P.A.; González-Benito, Ó. Tourists’ willingness to pay for an accommodation: The effect of eWOM and internal reference price. Int. J. Hosp. Manag. 2017, 62, 67–77. [Google Scholar] [CrossRef]
- Patricia, M.W.; Broniarczyk, S.M. Integrating Multiple Opinions: The Role of Aspiration Level on Consumer Response to Critic Consensus. J. Consum. Res. 1998, 25, 38–51. [Google Scholar]
- Rogers, E.M. Diffusion of Innovations, 5th ed.; Free Press: New York, NY, USA, 2003. [Google Scholar]
- Senecal, S.; Nantel, J. The influence of online product recommendations on consumers’ online choices. J. Retail. 2004, 80, 159–169. [Google Scholar] [CrossRef]
- Hennig-Thurau, T.; Gwinner, K.P.; Walsh, G.; Gremler, D.D. Electronic word-of-mouth via consumer-opinion platforms: What motivates consumers to articulate themselves on the internet? J. Interact. Mark. 2004, 18, 38–52. [Google Scholar] [CrossRef]
- Bickart, B.; Schindler, R.M. Internet forums as influential sources of consumer information. J. Interact. Mark. 2001, 15, 31–40. [Google Scholar] [CrossRef]
- Hussain, R.; Al Nasser, A.; Hussain, Y.K. Service quality and customer satisfaction of a UAE-based airline: An empirical investigation. J. Air Transp. Manag. 2015, 42, 167–175. [Google Scholar] [CrossRef]
- Tahanisaz, S. Evaluation of passenger satisfaction with service quality: A consecutive method applied to the airline industry. J. Air Transp. Manag. 2020, 83, 101764. [Google Scholar] [CrossRef]
- Sezgen, E.; Mason, K.J.; Mayer, R. Voice of airline passenger: A text mining approach to understand customer satisfaction. J. Air Transp. Manag. 2019, 77, 65–74. [Google Scholar] [CrossRef]
- Bellizzi, M.G.; Eboli, L.; Forciniti, C.; Mazzulla, G. Passengers’ Expectations on Airlines’ Services: Design of a Stated Preference Survey and Preliminary Outcomes. Sustainability 2020, 12, 4707. [Google Scholar] [CrossRef]
- Farooq, M.S.; Salam, M.; Fayolle, A.; Jaafar, N.; Ayupp, K. Impact of service quality on customer satisfaction in Malaysia airlines: A PLS-SEM approach. J. Air Transp. Manag. 2018, 67, 169–180. [Google Scholar] [CrossRef]
- Park, S.; Lee, J.S.; Nicolau, J.L. Understanding the dynamics of the quality of airline service attributes: Satisfiers and dissatisfiers. Tour. Manag. 2020, 81, 104163. [Google Scholar] [CrossRef] [PubMed]
- Lee, T.Y.; Bradlow, E.T. Automated marketing research using online customer reviews. J. Mark. Res. 2011, 48, 881–894. [Google Scholar] [CrossRef]
- Anderson, M.; Magruder, J. Learning from the crowd: Regression discontinuity estimates of the effects of an online review database. Econ. J. 2012, 122, 957–989. [Google Scholar] [CrossRef]
- Tsai, C.F.; Chen, K.; Hu, Y.H.; Chen, W.K. Improving text summarization of online hotel reviews with review helpfulness and sentiment. Tour. Manag. 2020, 80, 104122. [Google Scholar] [CrossRef]
- Song, C.; Guo, J.; Zhuang, J. Analyzing passengers’ emotions following flight delays-a 2011–2019 case study on SKYTRAX comments. J. Air Transp. Manag. 2020, 89, 101903. [Google Scholar] [CrossRef]
- Korfiatis, N.; Stamolampros, P.; Kourouthanassis, P.; Sagiadinos, V. Measuring service quality from unstructured data: A topic modeling application on airline passengers’ online reviews. Expert Syst. Appl. 2019, 116, 472–486. [Google Scholar] [CrossRef]
- Zhao, Y.; Xu, X.; Wang, M. Predicting overall customer satisfaction: Big data evidence from hotel online textual reviews. Int. J. Hosp. Manag. 2019, 76, 111–121. [Google Scholar] [CrossRef]
- Lee, K.; Yu, C. Assessment of airport service quality: A complementary approach to measure perceived service quality based on Google reviews. J. Air Transp. Manag. 2018, 71, 28–44. [Google Scholar] [CrossRef]
- Xiang, Z.; Du, Q.; Ma, Y.; Fan, W. A comparative analysis of major online review platforms: Implications for social media analytics in hospitality and tourism. Tour. Manag. 2017, 58, 51–65. [Google Scholar] [CrossRef]
- Fang, B.; Ye, Q.; Kucukusta, D.; Law, R. Analysis of the perceived value of online tourism reviews: Influence of readability and reviewer characteristics. Tour. Manag. 2016, 52, 498–506. [Google Scholar] [CrossRef]
- Naveen, A. The impact of eWOM density on sales of travel insurance. Ann. Tour. Res. 2016, 56, 137–140. [Google Scholar]
- Park, S.; Nicolau, J.L. Asymmetric effects of online consumer reviews. Ann. Tour. Res. 2015, 50, 67–83. [Google Scholar] [CrossRef]
- Zhu, F.; Zhang, X. Impact of online consumer reviews on sales: The moderating role of product and consumer characteristics. J. Mark. 2010, 74, 133–148. [Google Scholar] [CrossRef]
- Mudambi, S.M.; Schuff, D. What makes a helpful review? A study of customer reviews on Amazon.com. MIS Q. 2010, 34, 185–200. [Google Scholar] [CrossRef]
- Li, X.; Hitt, L.M. Self-selection and information role of online product reviews. Inf. Syst. Res. 2008, 19, 456–474. [Google Scholar] [CrossRef]
- Duan, W.; Gu, B.; Whinston, A.B. Do online reviews matter?—An empirical investigation of panel data. Decis. Support Syst. 2008, 45, 1007–1016. [Google Scholar] [CrossRef]
- Gu, B.; Park, J.; Konana, P. Research note—the impact of external word-of-mouth sources on retailer sales of high-involvement products. Inf. Syst. Res. 2012, 23, 182–196. [Google Scholar] [CrossRef]
- Moe, W.W.; Trusov, M. The value of social dynamics in online product ratings forums. J. Mark. Res. 2011, 48, 444–456. [Google Scholar] [CrossRef]
- Dellarocas, C.; Gao, G.; Narayan, R. Are consumers more likely to contribute online reviews for hit or niche products? J. Manag. Inf. Syst. 2010, 27, 127–158. [Google Scholar] [CrossRef]
- Chintagunta, P.K.; Gopinath, S.; Venkataraman, S. The effects of online user reviews on movie box office performance: Accounting for sequential rollout and aggregation across local markets. Mark. Sci. 2010, 29, 944–957. [Google Scholar] [CrossRef]
- Ahmad, I.S.; Bakar, A.A.; Yaakub, M.R. Movie Revenue Prediction Based on Purchase Intention Mining Using YouTube Trailer Reviews. Inf. Process. Manag. 2020, 57, 102278. [Google Scholar] [CrossRef]
- Forman, C.; Ghose, A.; Wiesenfeld, B. Examining the relationship between reviews and sales: The role of reviewer identity disclosure in electronic markets. Inf. Syst. Res. 2008, 19, 291–313. [Google Scholar] [CrossRef]
- Godes, D.; Mayzlin, D. Using online conversations to study word-of-mouth communication. Mark. Sci. 2004, 23, 545–560. [Google Scholar] [CrossRef]
- Chen, P.Y.; Wu, S.Y.; Yoon, J. The impact of online recommendations and consumer feedback on sales. In Proceedings of the ICIS 2004 Proceedings, Washington, DC, USA, December 2004; p. 58. [Google Scholar]
- Schuckert, M.; Liu, X.; Law, R. A segmentation of online reviews by language groups: How English and non-English speakers rate hotels differently. Int. J. Hosp. Manag. 2015, 48, 143–149. [Google Scholar] [CrossRef]
- Lambrecht, A.; Tucker, C.E. Can Big Data Protect a Firm from Competition? Available online: https://papers.ssrn.com/sol3/papers.cfm?abstract_id=2705530 (accessed on 22 December 2015).
- Siering, M.; Deokar, A.V.; Janze, C. Disentangling consumer recommendations: Explaining and predicting airline recommendations based on online reviews. Decis. Support Syst. 2018, 107, 52–63. [Google Scholar] [CrossRef]
- Kuo, M.S.; Liang, G.S. Combining VIKOR with GRA techniques to evaluate service quality of airports under fuzzy environment. Expert Syst. Appl. 2011, 38, 1304–1312. [Google Scholar] [CrossRef]
- Phillips, P.; Barnes, S.; Zigan, K.; Schegg, R. Understanding the impact of online reviews on hotel performance: An empirical analysis. J. Travel Res. 2017, 56, 235–249. [Google Scholar] [CrossRef]
- Ray, A.; Bala, P.K.; Jain, R. Utilizing emotion scores for improving classifier performance for predicting customer’s intended ratings from social media posts. Benchmarking Int. J. 2020. [Google Scholar] [CrossRef]


| Study | Variables | Research Context | Key Findings |
|---|---|---|---|
| Park et al. (2020) [71] | Number of user reviews; average user ratings | -TripAdvisor -20 US airlines with 157,035 reviews and overall ratings | -The quality of specific service attributes, such as cleanliness, food and beverages, and in-flight entertainment, affects the variations in positive ratings as a satisfier. -Other airline service attributes, such as customer service and check-in and boarding, influence deviations in negative ratings as dissatisfaction. |
| Tsai et al. (2020) [74] | Online hotel reviews; the overall ratings |
|
|
| Sharma et al. (2020) [8] | Number of user sentiment reviews and the overall rating of the specific flight | -TripAdvisor -20 US airlines with 157,036 reviews | -Prospect theory explains the relationship between ratings and review sentiment. -Loss aversion and diminishing sensitivity are confirmed. -Negative deviations in ratings lead to a higher impact on review sentiment than positive deviations. -Variations in ratings closer to (away from) the reference point result in higher (lower) marginal impacts on sentiment. |
| Song et al. (2020) [75] | Online sentiment reviews and the ratings of airlines |
|
|
| Korfiatis et al. (2019) [76] | Airline passenger reviews and the overall rating for their total experience |
|
|
| Zhao et al. (2019) [77] | Online textual reviews; the overall customer ratings |
|
|
| Lee and Yu (2018) [78] | User-generated online content; airport service quality (ASQ) ratings; Google star ratings |
|
|
| Xiang et al. (2017) [79] | Online reviews; average hotel ratings |
|
|
| Fang et al. (2016) [80] | User online reviews, text readability, and historical rating distribution | -Online attraction reviews from TripAdvisor -Two-level empirical analysis; Tobit regression model | Both text readability and reviewer characteristics affect the perceived value of reviews. |
| Amblee (2015) [81] | The density of negative reviews | -SquareMouth.com -Pooled ordinary least squares (OLS) regression -Over 21,000 reviews of travel insurances | When the density of negative reviews is high, sales are lower and vice versa. |
| Park and Nicolau (2015) [82] | Online reviews (star ratings) on usefulness and enjoyment | -Yelp.com -Data collected from restaurant reviews from New York and London -35 restaurants in London with 2500 reviews and 10 in New York with 2590 reviews | -The valence of online reviews has a U-shaped effect on usefulness and enjoyment. -Negative ratings of reviews are more useful than positive reviews. -Positive ratings are associated with higher enjoyment than negative reviews. |
| Zhu and Zhang (2010) [83] | Coefficient of variation in ratings; the total number of reviews posted. | -Gamespot.com -VideoGames.com -Psychological choice model | Online reviews are more influential for less popular games and games whose players have more Internet talent. |
| Mudambi and Scuff (2010) [84] | Star rating of the reviewer; the total number of votes about each review’s helpfulness; word count of the review | -Amazon.com -6 products with 1587 reviews | Review depth is correlated with helpfulness, but review extremity is less helpful for experience goods. |
| Li and Hitt (2008) [85] | Average rating of all reviews | -Amazon.com -2651 books with 136,802 reviews. | Word of mouth (WOM) is not an unbiased indicator of quality and will affect sales. |
| Duan et al. (2008) [86] | Number of user postings; user review ratings | -Movie box office: Yahoo Movies -71 movies with 95,867 total user posts | -The rating of online user reviews has no significant impact on movies’ box office revenues. -Box office sales are significantly influenced by the volume of online postings, suggesting the importance of the awareness effect. |
| Li et al. (2013) [16] | Text mining and content analysis | -TripAdvisor -774 star-rated hotels with 42,668 online traveler reviews | Transportation convenience, food, beverage management, convenience to tourist destinations, and value for money are identified as excellent factors that customers booking both luxury and budget hotels consider. The actual performance is very satisfactory to them. |
| Gu et al. (2012) [87] | User-generated content (UGC); product ratings; product reviews | -Amazon, DPReview, and Epinions -Logistic regression -148 digital cameras with 31,522 reviews | Online WOM on external review websites is a more significant indicator of sales for high involvement products. |
| Moe and Trusov (2011) [88] | Average of all ratings | -Bath, fragrance, and beauty products -500 products with 3801 ratings | Online WOM affects sales and is subject to social dynamics in that ratings will affect future rating behavior. |
| Dellarocas et al. (2010) [89] | Number of movies; UGC; the number of user ratings | -Film data from Yahoo! Movies -2002 data set contains 104 movies with 63,889 reviews -2007-8 data set contains 143 movies with 95,443 reviews. | Products that are less available and less successful in the market are less likely to receive online reviews. |
| Chintag et al. (2010) [90] | Valence, volume, and precision of online reviews. | -Film data from Yahoo! Movies -Logistic regression generalized method of moments procedure -One hundred forty-eight movies, 253 markets with a total of 70,273 reviews. | Online user reviews are correlated with film box office performance. |
| Ahmad et al. (2020) [91] | Average of user reviews; an average of user ratings; sentiment analysis. | YouTube trailer reviews | -People’s movie purchase intention can be extracted from YouTube trailer reviews. -Purchase intention is positively correlated with box office revenue and can improve the prediction accuracy of box office revenue prediction. -Multiple linear regression performed better than support vector machines, neural networks, and random forest in movie revenue prediction. |
| Forman et al. (2008) [92] | Star ratings; average reviews per book | -Amazon.com -786 books with 175,714 reviews | Review identity may be used as a measurable proxy for both future sales and future geographic sales. |
| Godes and Mayzlin (2004) [93] | The average number of posts and ratings | -TV shows from USENET newsgroups. -Multiple regression -One hundred sixty-nine groups and 2398 posts were evaluated. | The dispersion of online conversations can be used to measure ratings. |
| Chen et al. (2004) [94] | The average number of reviews, recommendations, and sales rank | -Book data from Amazon.com -Multiple regression -Six hundred ten observations with 58,566 total reviews. | Consumer ratings are not found to be related to sales, but recommendations are highly significant. |
| Model | Adjusted R Squared | Number of Tags |
|---|---|---|
| All labels | 0.614 | 2567 |
| Root of labels | 0.579 | 1523 (295) |
| Variables | B | t | Sig. | Variables | B | t | Sig. |
|---|---|---|---|---|---|---|---|
| (constant) | 3.679 | 89.443 | 0.000 *** | call | −0.218 | −2.527 | 0.012 * |
| coordination | 2.245 | 2.033 | 0.042 * | result | −0.219 | −2.489 | 0.013 * |
| clause | 1.824 | 1.851 | 0.064 | media | −0.221 | −2.467 | 0.014 * |
| doubt | 1.489 | 2.749 | 0.006 ** | please | −0.235 | −1.803 | 0.072 |
| complex | 1.233 | 1.877 | 0.061 | nor | −0.235 | −2.189 | 0.029 * |
| dedicated | 1.227 | 1.713 | 0.087 | after | −0.240 | −1.821 | 0.069 |
| honey | 1.189 | 1.614 | 0.107 | following | −0.242 | −3.411 | 0.001 ** |
| signpost | 1.164 | 1.828 | 0.068 | cost | −0.243 | −1.892 | 0.059 |
| restrict | 1.158 | 2.346 | 0.019 * | vacations | −0.243 | −1.927 | 0.054 |
| battle | 1.078 | 1.601 | 0.109 | nobody | −0.244 | −2.365 | 0.018 * |
| beautiful | 1.067 | 2.859 | 0.004 ** | not | −0.244 | −7.964 | 0.000 *** |
| notorious | 1.031 | 1.880 | 0.060 | port | −0.250 | −2.123 | 0.034 * |
| supplement | 0.998 | 3.251 | 0.001 ** | basic | −0.258 | −1.608 | 0.108 |
| unbeatable | 0.990 | 4.365 | 0.000 *** | disappointment | −0.263 | −1.611 | 0.107 |
| useless | 0.967 | 2.322 | 0.020 * | possible | −0.268 | −2.429 | 0.015 * |
| candy | 0.896 | 1.635 | 0.102 | unfortunate | −0.274 | −2.408 | 0.016 * |
| achievement | 0.887 | 1.914 | 0.056 | scarce | −0.281 | −2.486 | 0.013 * |
| trend | 0.856 | 2.024 | 0.043 * | tired | −0.283 | −1.649 | 0.099 |
| located | 0.855 | 1.643 | 0.100 | know | −0.289 | −1.992 | 0.046 * |
| distribution | 0.851 | 2.166 | 0.030 * | various | −0.299 | −2.136 | 0.033 * |
| examine | 0.840 | 3.109 | 0.002 ** | missing | −0.304 | −3.681 | 0.000 *** |
| affordable | 0.832 | 1.722 | 0.085 | bad | −0.305 | −4.344 | 0.000 *** |
| instructions | 0.807 | 1.685 | 0.092 | international | −0.307 | −1.897 | 0.058 |
| mess | 0.786 | 1.606 | 0.108 | number | −0.308 | −2.391 | 0.017 * |
| renewal | 0.786 | 1.751 | 0.080 | forget | −0.312 | −1.739 | 0.082 |
| presence | 0.768 | 1.813 | 0.070 | uncomfortable | −0.314 | −5.073 | 0.000 *** |
| canned | 0.731 | 1.643 | 0.100 | total | −0.316 | −2.262 | 0.024 * |
| charter | 0.698 | 1.742 | 0.082 | money | −0.317 | −1.665 | 0.096 |
| perfection | 0.633 | 1.676 | 0.094 | recognizes | −0.322 | −1.891 | 0.059 |
| spotlight | 0.614 | 2.385 | 0.017 * | evil | −0.332 | −1.674 | 0.094 |
| setback | 0.604 | 2.865 | 0.004 ** | bus | −0.342 | −1.679 | 0.093 |
| amazing | 0.593 | 4.152 | 0.000 *** | mister | −0.343 | −2.735 | 0.006 ** |
| cabotage | 0.563 | 1.758 | 0.079 | badly | −0.346 | −1.785 | 0.074 |
| rich | 0.558 | 1.747 | 0.081 | consume | −0.348 | −1.980 | 0.048 * |
| reach | 0.555 | 2.351 | 0.019 * | still | −0.348 | −2.429 | 0.015 * |
| wrong | 0.554 | 2.070 | 0.038 * | thrown | −0.351 | −1.741 | 0.082 |
| directions | 0.537 | 1.779 | 0.075 | few | −0.351 | −2.353 | 0.019 * |
| strategy | 0.529 | 1.609 | 0.108 | old | −0.367 | −2.965 | 0.003 ** |
| commander *** | 0.524 | 3.848 | 0.000 *** | cancel | −0.368 | −2.723 | 0.006 ** |
| great *** | 0.512 | 3.878 | 0.000 *** | never | −0.370 | −2.448 | 0.014 * |
| remarkable * | 0.506 | 1.909 | 0.056 | telephone | −0.378 | −3.183 | 0.001 ** |
| regional | 0.503 | 2.206 | 0.027 * | user | −0.379 | −1.959 | 0.050 |
| evident | 0.501 | 1.792 | 0.073 | minors | −0.386 | −2.634 | 0.008 ** |
| climate | 0.500 | 1.683 | 0.092 | poor | −0.387 | −2.155 | 0.031 * |
| air | 0.488 | 2.364 | 0.018 * | above | −0.398 | −3.101 | 0.002 ** |
| awesome | 0.475 | 2.736 | 0.006 ** | impossible | −0.400 | −3.304 | 0.001 ** |
| wonder | 0.453 | 2.982 | 0.003 ** | leave | −0.402 | −1.695 | 0.090 |
| delight | 0.445 | 1.905 | 0.057 | clothing | −0.402 | −2.065 | 0.039 * |
| electronic | 0.442 | 2.074 | 0.038 * | horror | −0.407 | −3.067 | 0.002 ** |
| exact | 0.440 | 2.681 | 0.007 ** | narrow | −0.407 | −2.583 | 0.010 * |
| excellent | 0.431 | 10.137 | 0.000 *** | separate | −0.407 | −1.770 | 0.077 |
| exquisite | 0.431 | 2.377 | 0.017 * | window | −0.421 | −2.867 | 0.004 ** |
| like | 0.411 | 3.341 | 0.001 ** | hands | −0.421 | −1.884 | 0.060 |
| note | 0.408 | 3.476 | 0.001 ** | accept | −0.430 | −1.970 | 0.049 * |
| cancellations | 0.406 | 1.769 | 0.077 | close | −0.442 | −2.759 | 0.006 ** |
| additional | 0.402 | 2.826 | 0.005 ** | worse | −0.443 | −6.033 | 0.000 *** |
| subsidiary | 0.400 | 1.603 | 0.109 | hotel | −0.447 | −3.719 | 0.000 *** |
| satisfied | 0.399 | 2.005 | 0.045 * | go away | −0.451 | −3.271 | 0.001 ** |
| acceptable | 0.391 | 1.688 | 0.092 | authenticates | −0.457 | −2.043 | 0.041 * |
| assistance | 0.381 | 1.761 | 0.078 | intercontinental | −0.466 | −2.225 | 0.026 * |
| house | 0.379 | 3.316 | 0.001 ** | landing | −0.468 | −1.919 | 0.055 |
| husband | 0.377 | 1.860 | 0.063 | wrongly | −0.469 | −7.071 | 0.000 *** |
| chair | 0.372 | 1.707 | 0.088 | routes | −0.469 | −1.872 | 0.061 |
| pleasure | 0.371 | 2.458 | 0.014 * | error | −0.472 | −2.701 | 0.007 ** |
| perfect | 0.367 | 5.265 | 0.000 *** | characterizes | −0.473 | −1.763 | 0.078 |
| agile | 0.360 | 1.800 | 0.072 | disaster | −0.476 | −4.272 | 0.000 *** |
| according to | 0.355 | 1.880 | 0.060 | dirty | −0.477 | −2.623 | 0.009 ** |
| charm | 0.354 | 2.619 | 0.009 ** | heat | −0.481 | −2.380 | 0.017 * |
| meet | 0.341 | 1.968 | 0.049 * | bridge | −0.491 | −2.114 | 0.035 * |
| friends | 0.325 | 1.860 | 0.063 | exhausting | −0.513 | −1.967 | 0.049 * |
| preferably | 0.322 | 1.999 | 0.046 * | claims | −0.514 | −5.843 | 0.000 *** |
| organized | 0.317 | 1.683 | 0.092 | zero | −0.519 | −2.158 | 0.031 * |
| put | 0.289 | 2.279 | 0.023 * | chaotic | −0.519 | −2.126 | 0.034 * |
| heavy | 0.288 | 2.041 | 0.041 * | dreadful | −0.529 | −1.781 | 0.075 |
| channels | 0.284 | 2.513 | 0.012 * | multiple | −0.536 | −2.316 | 0.021 * |
| deserves | 0.281 | 1.851 | 0.064 | misplaced | −0.547 | −2.629 | 0.009 ** |
| corridor | 0.256 | 2.128 | 0.033 * | awful | −0.556 | −1.966 | 0.049 * |
| difference | 0.254 | 2.890 | 0.004 ** | deficient | −0.562 | −3.209 | 0.001 ** |
| incidence | 0.251 | 2.364 | 0.018 * | learn | −0.574 | −1.959 | 0.050 |
| inconvenient | 0.238 | 2.576 | 0.010 * | cleaning | −0.575 | −2.231 | 0.026 * |
| could | 0.235 | 2.070 | 0.038 * | patience | −0.589 | −1.662 | 0.097 |
| free | 0.235 | 2.068 | 0.039 * | grow | −0.600 | −1.920 | 0.055 |
| world | 0.231 | 2.349 | 0.019 * | priority | −0.616 | −1.913 | 0.056 |
| problem | 0.230 | 4.715 | 0.000 *** | snack | −0.621 | −2.887 | 0.004 ** |
| spouse | 0.226 | 1.621 | 0.105 | pessimistic | −0.623 | −7.081 | 0.000 *** |
| fast | 0.226 | 3.171 | 0.002 ** | nightmare | −0.631 | −1.893 | 0.058 |
| truth | 0.222 | 3.452 | 0.001 ** | neglect | −0.636 | −2.062 | 0.039 * |
| impeccable | 0.217 | 1.735 | 0.083 | depart | −0.643 | −1.732 | 0.083 |
| punctual | 0.215 | 6.690 | 0.000 *** | left | −0.647 | −2.608 | 0.009 ** |
| comfortable | 0.211 | 5.684 | 0.000 *** | unpresentable | −0.671 | −2.005 | 0.045 * |
| planned | 0.210 | 2.574 | 0.010 * | rush | −0.674 | −2.582 | 0.010 * |
| cheap | 0.209 | 1.865 | 0.062 | deplorable | −0.710 | −1.980 | 0.048 * |
| food | 0.208 | 1.704 | 0.088 | refund | −0.719 | −3.028 | 0.002 ** |
| luck | 0.204 | 2.093 | 0.036 * | excuses | −0.721 | −2.491 | 0.013 * |
| internal | 0.200 | 1.931 | 0.054 | glass | −0.731 | −4.772 | 0.000 *** |
| breakfast | 0.200 | 2.243 | 0.025 * | places | −0.740 | −4.237 | 0.000 *** |
| offer | 0.187 | 1.885 | 0.059 | swindle | −0.746 | −3.748 | 0.000 *** |
| recommend | 0.187 | 2.503 | 0.012 * | lies | −0.751 | −3.024 | 0.003 ** |
| went | 0.183 | 1.772 | 0.076 | abuse | −0.756 | −1.863 | 0.063 |
| find | 0.169 | 1.693 | 0.090 | sardines | −0.758 | −1.910 | 0.056 |
| comfort | 0.167 | 1.918 | 0.055 | deteriorated | −0.786 | −1.876 | 0.061 |
| quiet | 0.161 | 2.305 | 0.021 * | robots | −0.798 | −2.159 | 0.031 * |
| attentive | 0.156 | 2.830 | 0.005 ** | checkin | −0.810 | −2.120 | 0.034 * |
| highlight | 0.154 | 2.084 | 0.037 * | garbage | −0.831 | −2.540 | 0.011 * |
| can | 0.151 | 1.624 | 0.104 | decision | −0.832 | −2.580 | 0.010 * |
| little | 0.149 | 2.193 | 0.028 * | subject | −0.860 | −1.879 | 0.060 |
| weigh | 0.145 | 2.063 | 0.039 * | exclusive | −0.861 | −2.231 | 0.026 * |
| also | 0.144 | 2.505 | 0.012 * | about | −0.868 | −2.312 | 0.021 * |
| better | 0.141 | 2.228 | 0.026 * | painful | −0.890 | −3.779 | 0.000 *** |
| land | 0.140 | 1.660 | 0.097 | minuscule | −0.914 | −2.125 | 0.034 * |
| remain | 0.133 | 1.636 | 0.102 | remodeled | −0.916 | −1.892 | 0.059 |
| nice | 0.132 | 2.050 | 0.040 * | fall | −0.937 | −1.827 | 0.068 |
| always | 0.128 | 2.917 | 0.004 ** | support | −0.964 | −3.005 | 0.003 ** |
| very | 0.128 | 4.446 | 0.000 *** | sensitivity | −0.965 | −1.703 | 0.089 |
| real | 0.122 | 1.627 | 0.104 | rude | −0.966 | −3.639 | 0.000 *** |
| something | 0.121 | 2.093 | 0.036 * | list | −1.026 | −2.695 | 0.007 ** |
| friendly | 0.112 | 2.552 | 0.011 * | perfume | −1.033 | −2.171 | 0.030 * |
| deal | 0.112 | 2.262 | 0.024 * | irresponsible | −1.038 | −2.682 | 0.007 ** |
| entertainment | 0.086 | 1.864 | 0.062 | remark | −1.056 | −2.025 | 0.043 * |
| without | −0.077 | −2.075 | 0.038 * | tablets | −1.058 | −1.737 | 0.082 |
| normal | −0.085 | −1.603 | 0.109 | commitments | −1.114 | −2.531 | 0.011 * |
| passenger | −0.086 | −1.682 | 0.093 | weak | −1.127 | −1.954 | 0.051 |
| hours | −0.096 | −2.349 | 0.019 * | die | −1.206 | −1.898 | 0.058 |
| appear | −0.108 | −1.761 | 0.078 | judge | −1.244 | −2.504 | 0.012 * |
| none | −0.109 | −1.909 | 0.056 | veil | −1.270 | −2.356 | 0.019 * |
| when | −0.110 | −2.130 | 0.033 * | delete | −1.331 | −4.930 | 0.000 *** |
| more | −0.110 | −3.449 | 0.001 ** | stingy | −1.352 | −2.093 | 0.036 * |
| delay | −0.116 | −2.198 | 0.028 * | strict | −1.361 | −1.604 | 0.109 |
| between | −0.117 | −2.215 | 0.027 * | victims | −1.389 | −1.797 | 0.072 |
| count | −0.119 | −1.880 | 0.060 | pathetic | −1.419 | −3.099 | 0.002 ** |
| because | −0.120 | −2.180 | 0.029 * | christmas | −1.472 | −3.581 | 0.000 *** |
| almost | −0.124 | −2.094 | 0.036 * | indignation | −1.513 | −1.971 | 0.049 * |
| case | −0.125 | −1.637 | 0.102 | sugar | −1.518 | −2.108 | 0.035 * |
| customer | −0.129 | −1.647 | 0.100 | deadly | −1.539 | −3.084 | 0.002 ** |
| minute | −0.130 | −1.872 | 0.061 | intolerable | −1.596 | −2.119 | 0.034 * |
| neither | −0.136 | −2.506 | 0.012 * | tending | −1.654 | −1.632 | 0.103 |
| last | −0.150 | −2.391 | 0.017 * | pure | −1.681 | −1.669 | 0.095 |
| nothing | −0.151 | −3.067 | 0.002 ** | incompetence | −1.688 | −3.277 | 0.001 ** |
| receive | −0.157 | −1.659 | 0.097 | converted | −1.902 | −3.186 | 0.001 ** |
| want | −0.174 | −1.999 | 0.046 * | load | −1.928 | −2.348 | 0.019 * |
| speak | −0.175 | −1.696 | 0.090 | rare | −1.965 | −2.478 | 0.013 * |
| request | −0.191 | −1.692 | 0.091 | modification | −1.992 | −2.221 | 0.026 * |
| lose | −0.192 | −2.588 | 0.010 * | roadkill | −2.124 | −3.442 | 0.001 ** |
| solve | −0.194 | −2.055 | 0.040 * | anniversary | −2.195 | −2.200 | 0.028 * |
| minimum | −0.202 | −1.822 | 0.068 | disparate | −2.521 | −1.873 | 0.061 |
| conditions | −0.203 | −1.919 | 0.055 | falling | −2.825 | −1.685 | 0.092 |
| answer | −0.204 | −1.684 | 0.092 | capital | −3.231 | −2.503 | 0.012 * |
| think | −0.217 | −1.624 | 0.105 | molehill | −3.295 | −2.290 | 0.022 * |
Publisher’s Note: MDPI stays neutral with regard to jurisdictional claims in published maps and institutional affiliations. |
© 2020 by the authors. Licensee MDPI, Basel, Switzerland. This article is an open access article distributed under the terms and conditions of the Creative Commons Attribution (CC BY) license (http://creativecommons.org/licenses/by/4.0/).
Share and Cite
Zaki Ahmed, A.; Rodríguez-Díaz, M. Significant Labels in Sentiment Analysis of Online Customer Reviews of Airlines. Sustainability 2020, 12, 8683. https://doi.org/10.3390/su12208683
Zaki Ahmed A, Rodríguez-Díaz M. Significant Labels in Sentiment Analysis of Online Customer Reviews of Airlines. Sustainability. 2020; 12(20):8683. https://doi.org/10.3390/su12208683
Chicago/Turabian StyleZaki Ahmed, Ayat, and Manuel Rodríguez-Díaz. 2020. "Significant Labels in Sentiment Analysis of Online Customer Reviews of Airlines" Sustainability 12, no. 20: 8683. https://doi.org/10.3390/su12208683
APA StyleZaki Ahmed, A., & Rodríguez-Díaz, M. (2020). Significant Labels in Sentiment Analysis of Online Customer Reviews of Airlines. Sustainability, 12(20), 8683. https://doi.org/10.3390/su12208683