Article

Untact: Customer’s Acceptance Intention toward Robot Barista in Coffee Shop

1
Department of Foodservice Management, Pai Chai University, Daejeon 35345, Korea
2
Department of Hotel, Tourism, and Foodservice Management, Dongguk University-Gyeonju, Gyeongju 38066, Korea
*
Author to whom correspondence should be addressed.
Sustainability 2020, 12(20), 8598; https://doi.org/10.3390/su12208598
Submission received: 2 September 2020 / Revised: 2 October 2020 / Accepted: 11 October 2020 / Published: 16 October 2020
(This article belongs to the Special Issue Restaurant Sustainable Strategic Management (SSM))

Abstract

:
Restaurants have been using robots to meet the increasing consumer demand for food customization and safety and contactless service operations. This study identified the antecedent factors influencing a customer’s attitude and acceptance intention toward a robot barista. To this end, we conducted a questionnaire survey from 10 to 24 January 2020, on a sample of 317 Korean consumers who purchased coffee prepared by a robot barista. We based the analysis on the following determinant factors of the extension of the technology acceptance model (ETAM): perceived enjoyment, perceived usefulness, need for interaction, perceived risk, and perceived innovativeness. The results showed that perceived usefulness had the highest impact on acceptance intention, followed by perceived enjoyment and the need for interaction. Perceived usefulness and innovativeness positively influenced acceptance intention. These results confirmed the significance of the determinant factors in inducing customers’ attitude and acceptance intention toward a robot barista. This study extends the research on the application of artificial intelligence and the fourth industrial revolution technologies in the food service industry, and hence contributes toward the preparations for the post-Covid-19 period. It also offers practical implications for sustainable coffee shop management.

1. Introduction

Hospitality companies have been increasingly integrating artificial intelligence (AI) technology and AI-driven robotic devices with service delivery operations [1]. These AI-driven robotics and machine learning applications have enhanced the productivity, efficiency, and effectiveness of service delivery operations [2]. For example, Hilton Worldwide’s concierge robot Connie provides personalized customer management and support, and its services include providing real-time recommendations and answering customer questions [1]. Similarly, in South Korea, the fast-growing trend of food technology (food tech) has increased the adoption and use of serving robots in various restaurants [3]. The restaurant chain VIPS has deployed “CLOi Chefbot” to cook noodles [4] and the Woowa Brothers (the startup behind the food delivery application Baemin) launched the serving robot “Dilly Plate” in November 2019. It has since deployed 18 Dilly Plate robots in 12 restaurants, thereby accelerating the popularization of robot services [5]. Food tech has also proliferated in the coffee chains. Coffee shops have been increasingly deploying robot baristas for service operations. San Francisco-based Cafe X Technologies launched the first fully automated kiosk in the United States, which combines automatic brewing technology, robotics, and a technology-based ordering system to serve premium coffee procured from several specialty roasters. Cafe X describes the kiosk as a “robotic café,” designed to “eliminate the variabilities that bog down today’s coffee experience” [6]. Another Portland-based café introduced a robot barista to facilitate contactless service operations to address the rapid decline in visitors owing to the Covid-19 pandemic. This barista robot, called Jarvis, provides a complete contactless service in line with the current trend [7]. In Korea, the franchise coffee shop chain Dal.komm is planning to extend the reach of its Beat robot baristas by deploying it in large marts, followed by shopping malls and university libraries (See Figure 1) [8]. Like their human counterparts, these robot baristas prepare coffee using the hand-drip method, which involves letting hot water drip over ground coffee [9]. However, the robot baristas play a more effective role in meeting the requirements of completely contactless coffee preparation and delivery.
Given this, the current pandemic scenario is expected to popularize the role of a robot barista. In a broader context, robotic services have been gaining attention owing to Covid-19, a novel strain of coronavirus that originated in Wuhan, China, in December 2019. The World Health Organization (WHO) declared Covid-19 as a pandemic in March 2020 [10]. Considering that human contact can be an important source of contamination in this scenario, restaurants are expected to accelerate the deployment of non-face-to-face services, that is, robotic services, to minimize the risk of virus infection [11].
Despite their significance in this situation, empirical research has paid little attention to robotic services [3], especially robot baristas in the coffee shop market. Hence, this study examines the factors influencing the formation of customer’s attitude and their acceptance intention toward a robot barista. This study demonstrates the significance of integrating service operations in the coffee shop market with the AI-driven robotic technology in preparation for the post-corona era. For this investigation, the study applied the technology acceptance model (TAM) proposed by Davis [12]. This theory states that perceived usefulness and perceived ease of use of the technology significantly influence the attitude and acceptance intention to use a technology.
In addition to these variables, Davis, Bagozzi, and Warshaw [13] stated that various external variables can also exert an influence. Hence, this study extended the research model by adding perceived enjoyment, need for interaction, perceived risk, and perceived innovativeness. Along with perceived usefulness in the TAM model, we consider these variables as factors affecting the attitude toward the use of a robot barista. Among these factors, perceived enjoyment provides an intrinsic motivation to use new technology. Several studies [14,15,16] have proved that perceived enjoyment positively influences attitude and behavioral intention to use. It must also be noted that human interaction is absent during the usage of a self-service technology (SST), and yet, this human interaction contributes to the understanding of the dynamics of service provision through SST [17]. For a consumer, perceived risk poses an important psychological barrier to the adoption of a new product [18]. Perceived risk negatively impacts the adoption of products such as the selection of an innovative product [19], the adoption of a self-service hotel technology (SSHT) [17] or any new technology, and the use of mobile banking services [20]. Perceived innovativeness reflects the novelty of an embedded product technology and its originality in the market [21]. Therefore, consumers who encounter a high level of innovativeness are more likely to purchase a new service or product [21,22]. As such, there may be a close relationship between the factors influencing the formation of the attitude toward the use of a robot barista, so we examine this relationship on the basis of the extension of the TAM (ETAM) model discussed in previous studies.
The objectives of this study are as follows. First, based on the TAM model, the study will explore the main factors influencing the attitude formation and purchase intention of the users of a robot barista. Second, unlike existing studies, this study will examine the aforementioned relationship by simultaneously considering perceived enjoyment, need for interaction, perceived risk, and perceived innovativeness along with TAM’s perceived usefulness and multiple other factors. Third, based on the findings, the study will suggest an efficient marketing strategy for coffee shops with a robot barista and provide basic data for revitalizing the future research on robot baristas.

2. Literature Review and Hypotheses

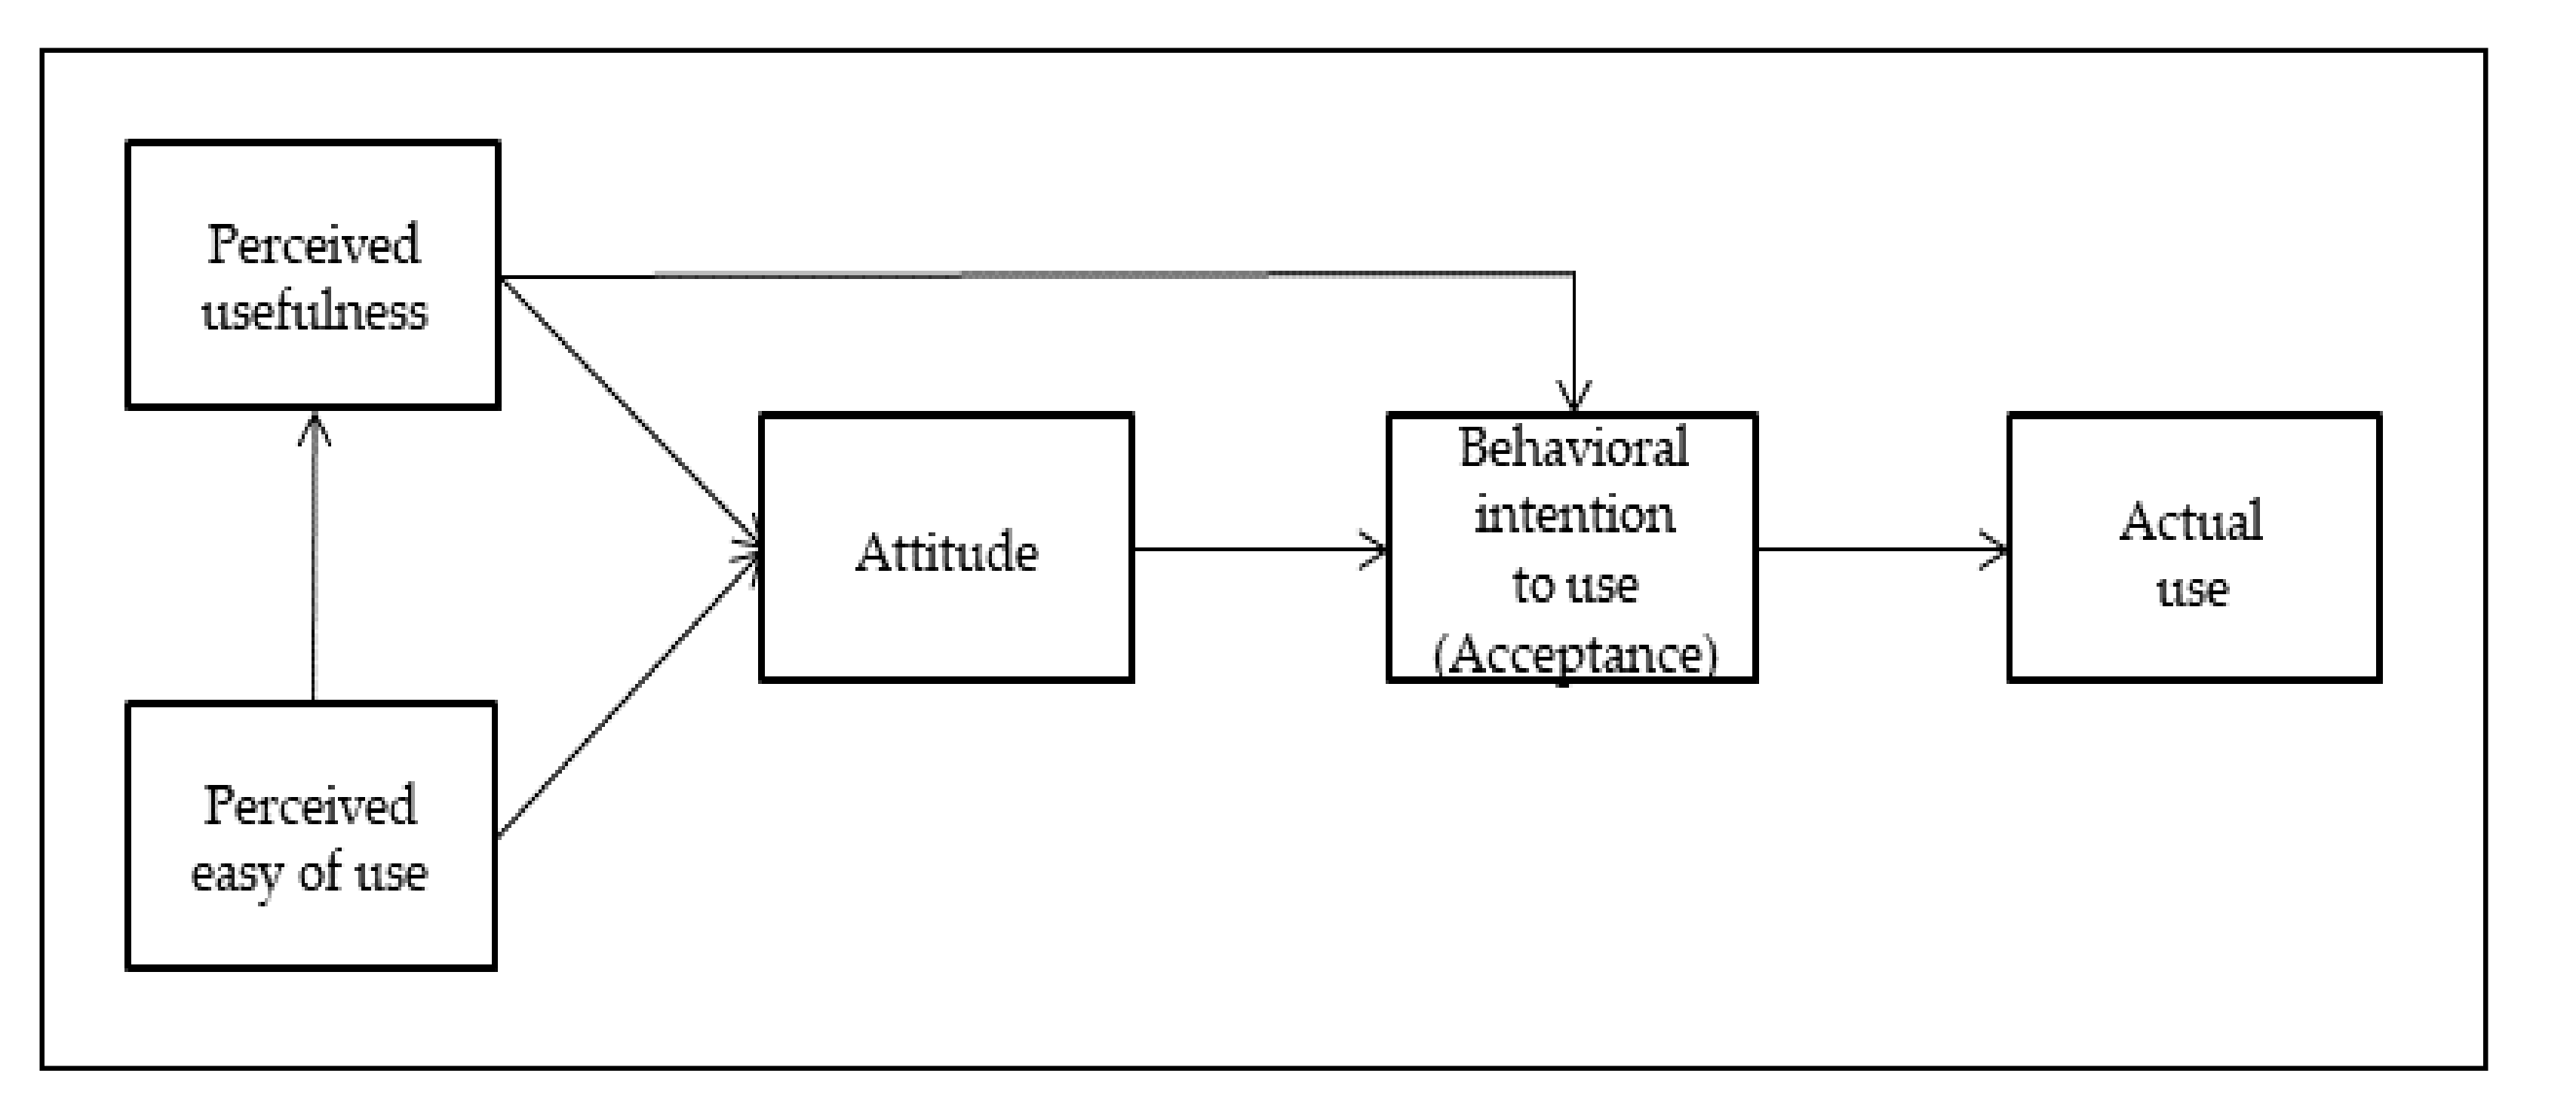
2.1. Technology Acceptance Model (TAM)

Several studies have followed the introduction of TAM, which is the most representative model explaining the adoption of new technology. This model explains the acceptance of the information technology based on the “belief-attitude-behavioral intention-behavior” process model of the rational behavior theory. Davis [12] explains perceived usefulness and the perceived ease of use as important beliefs in the process of technology acceptance (See Figure 2). In other words, as illustrated below TAM explains the user’s intention to accept and use the information technology through perceived usefulness and the perceived ease of use.
Perceived usefulness is defined as the degree to which a new technology is perceived to be useful when used for work [12] and the degree of belief that the use of a specific system improves a user’s work performance [23]. Rogers [19] defined perceived usefulness as the degree to which the value delivered to the user through a product is perceived as superior to the product or service. Perceived usefulness plays an important role in influencing consumer attitude toward a product in terms of the use and proliferation of the information system [24], and it has been identified as one of the important properties of SST [25].
A study on SST acceptance found that consumers are more likely to use SST when they perceive that the technologies based on self-service are more useful than those based on human interaction [26]. Perceived usefulness was also confirmed to have a positive effect on the attitude toward and the intention to use SST [17]. A study on the use of the delivery application showed that perceived usefulness has a direct effect on continuous use intention [27]. Until now, several studies have extensively investigated [28] the notion that attitude has a positive and direct effect on intention [29], and this relationship was also confirmed in a research on technology acceptance. Studies by Kaushik, Agrawal, and Rahman [17] and San-Martín, Lonpez-Catalann, and Ramon-Jeronnimo [30] showed that the attitude toward new information technology directly affects consumers’ behavioral intention. The above studies indicate that perceived usefulness influences the formation of attitude and acceptance intention toward an innovative information technology system and clarify the relationship between the attitude and the acceptance intention. Therefore, the following hypotheses can be established based on the above discussion.
Hypothesis 1.
The perceived usefulness of a robot barista significantly influences consumers’ attitude.
Hypothesis 2.
The perceived usefulness of a robot barista significantly influences acceptance intention.
Hypothesis 3.
The attitude toward a robot barista significantly influences acceptance intention.

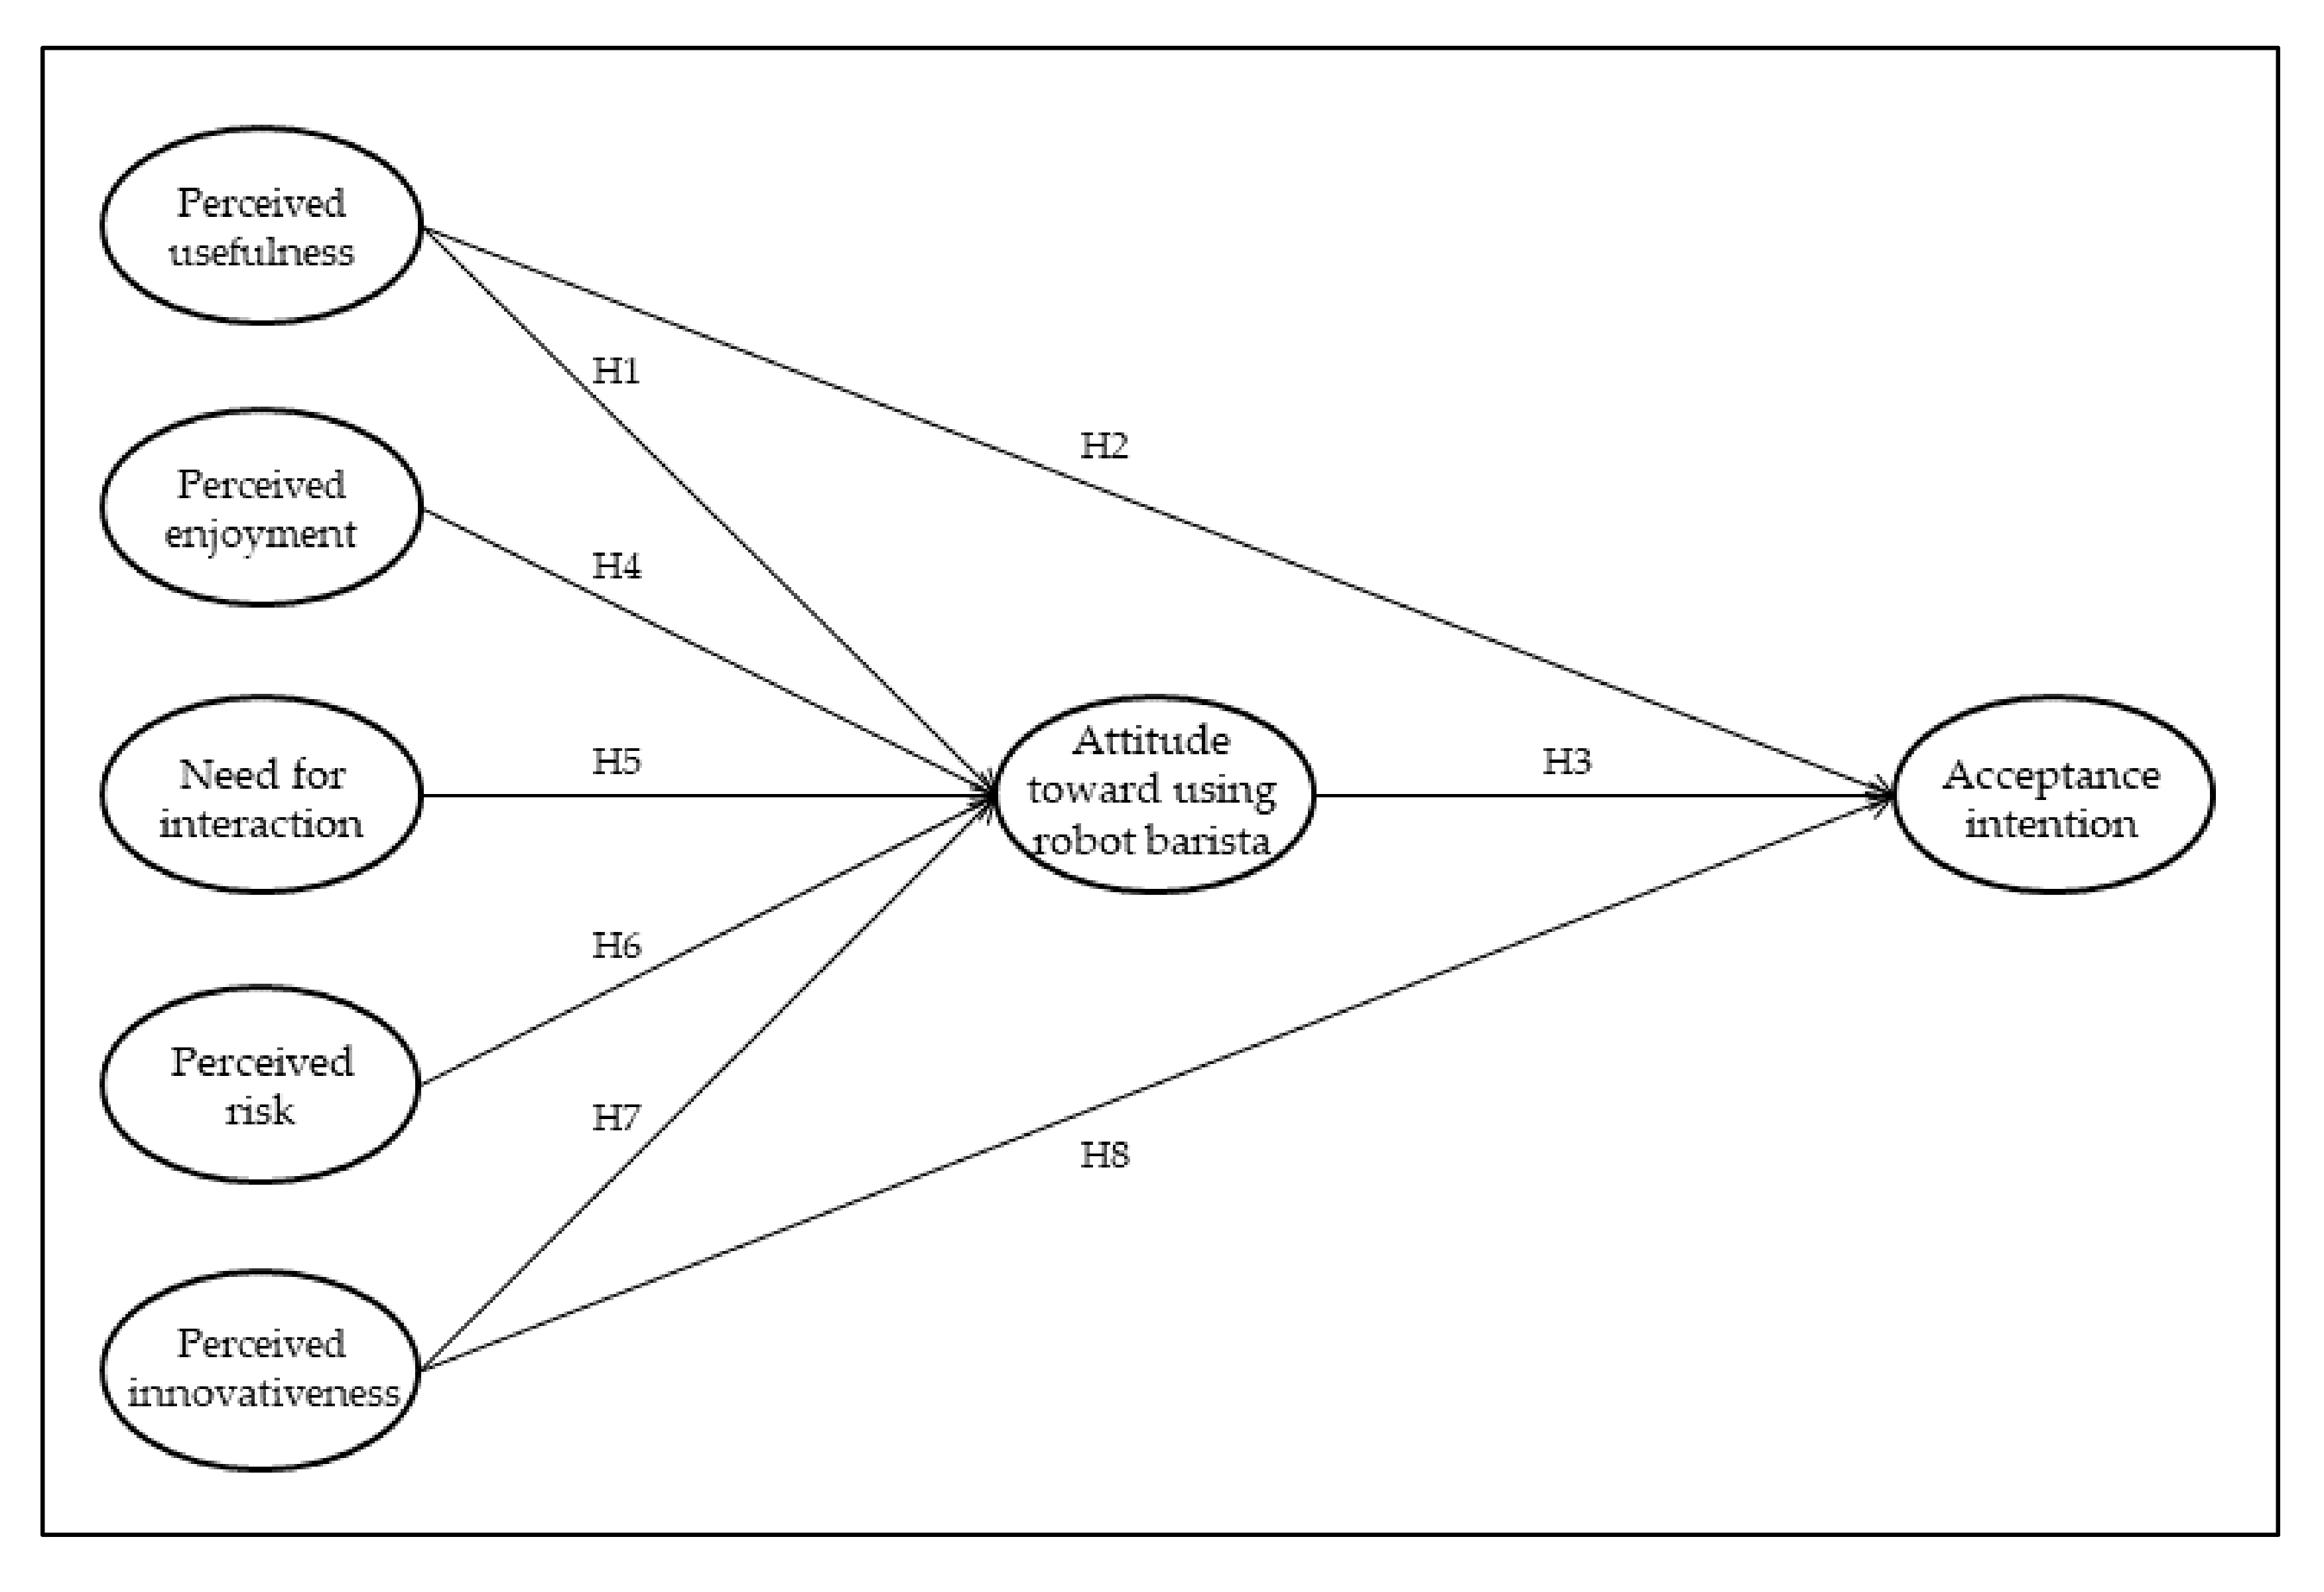
2.2. Extension of the TAM (ETAM): Perceived Enjoyment, Need for Interaction, Perceived Risk, and Perceived Innovativeness

Based on the theory of reasoned action (TRA) in the field of social psychology, TAM has been used by many studies to explain technology acceptance [27]. However, it has a limitation in that the model does not identify all the variables of perceived usefulness, and an insufficient consideration to various exogenous variables and their effects makes it difficult to analyze the discussed relationship in a complex IT environment [31]. It has also been criticized for not describing a specific work-technology environment as a whole [32]. Kaushik et al. [17] also argued that the main variables of TAM (perceived usefulness and the perceived ease of use) fall short in predicting the adoption of an SST in an offline environment. This is because TAM has basically focused only on the functional characteristics of the technology. Thus, it fails to consider the factors that reflect the user’s psychological and cognitive state. To overcome these limitations, we applied the variables of ETAM (perceived enjoyment, the need for interaction, perceived risk, perceived innovativeness) presented in previous studies [13,17,29,33].

2.2.1. Perceived Enjoyment

Perceived enjoyment refers to the degree of enjoyment perceived while using a system, independent of any expected outcome [34]. After discussing the role of perceived usefulness and the perceived ease of use in the initial TAM, Davis et al. [13] theorized that the intrinsic motivation provided by perceived enjoyment directly affects the intention to use an information technology. Davis et al. [13] found that enjoyment can be improved by using information technology and that enhanced enjoyment can influence the acceptance intention of a user. Hence, the study added perceived enjoyment as an acceptance determinant. Since then, several studies on technology acceptance revealed that perceived enjoyment determines the acceptance of a new information technology [29]; these studies also highlighted its relationship with the positive attitude of a user. Moon and Kim [16] presented perceived enjoyment as a new element that reflects a user’s intrinsic belief in the acceptance of the World Wide Web and proved that perceived enjoyment positively affects the attitude toward the use of the web and the intention to use it. In the study on customers’ acceptance intention for a portal site, Van der Heijden [35] showed the relationship between perceived usefulness, perceived ease of use, perceived enjoyment, and attitude. Considering the image interaction of a website targeting e-commerce users, Lee, Fiore, and Kim [36] empirically analyzed the relationship between perceived usefulness, perceived ease of use, perceived enjoyment, and attitude and intention to use. Ha and Stoel [37] explored the relationship between enjoyment, attitude, and intention in online shopping. Praveena and Thomas [38] found that perceived enjoyment has a greater influence on the attitude toward Facebook than the existing TAM variables. Matute-Vallejo and Melero-Polo [39] confirmed that perceived enjoyment explains the perceived ease of use, perceived usefulness, attitude, and flow related to online business simulation games.
As such, studies on ETAM always consider perceived enjoyment as a major factor influencing consumers’ attitude toward and acceptance of information technology. Hence, by applying the ETAM and assuming that in addition to perceived usefulness, perceived enjoyment can determine consumers’ attitude toward a robot barista, we formulate the following hypothesis:
Hypothesis 4.
The perceived enjoyment of using a robot barista significantly influences consumers’ attitude.

2.2.2. Need for Interaction

The need for interaction between a service provider and a consumer is a prerequisite for providing quality service [17,40]. This need for interaction is defined as the desire of an individual to engage in an interaction with a service personnel during a service encounter [41]. Cowles and Crosby [42] stated that some consumers value direct contact with a person in the service delivery process. Dabholkar [43] mentioned the importance of human interaction for a customer in a service encounter; the study indicated that an SST fails to satisfy a customer’s desire to interact with the service staff, which negatively affects its expected quality. Interaction promotes the interpersonal relationship between customers and the service staff [44]. However, the use of SST does not facilitate an interpersonal relationship and interaction, which is very essential for understanding the technology of service delivery through SST [17].
Several studies by Meuter, Ostrom, Bitner, and Roundtree [45] and Walker and Johnson [46] cited that the absence of interaction during SST use contributes toward the non-acceptance of SST [47]. Hanafizadeh, Behboudi, and Koshksaray [20] conducted a study on mobile banking adoption by Iranian banking customers and reported that consumers with a greater desire for interpersonal interaction use fewer mobile banking services. Overall, they showed that the need for interaction has a negative impact on mobile banking adoption. Therefore, the following hypothesis was established:
Hypothesis 5.
The need for interaction when using a robot barista significantly influences consumers’ attitude.

2.2.3. Perceived Risk

Perceived risk is a subjective and psychological risk perceived by consumers in a specific purchase situation [48]. In general, perceived risk refers to the anxiety about loss or uncertainty resulting from decision-making. Studies showed that perceived risk negatively impacts the acceptance intention of a new technology or innovative product [49]. Rogers [19] argued that, irrespective of a positive attitude, if the risk perception of consumers is higher toward innovative products, then they can reject the technology. Crespo, Del Bosque, and Sanchez [50] analyzed that perceived risk negatively affects the attitude and the intention of consumers toward online shopping. Perceived risk poses an important psychological barrier to the adoption of a new product, and the reduction of perceived risk directly improves the likelihood of new product adoption [18,51]. Wessels and Drennan [52] stated that perceived risk has a significant negative impact on the attitude toward and use of mobile banking. In other words, the higher the risk associated with using a new technology, the more is negative the attitude toward it and the lower is the level of willingness to use it. Hanafizadeh et al. [20] conducted a study on the mobile banking adoption by Iranian bank customers and revealed that perceived risk has a negative effect on mobile banking adoption. Kaushik et al. [17] proved that the perceived performance risk negatively affects the attitude toward the adoption of SSHT. Several studies have showed that perceived risk has a negative effect on the acceptance intention toward a new product [53]. These studies indicate that perceived risk is likely to exert a negative impact on customers’ attitude and acceptance intention toward the coffee brewed by a robot barista. We integrate perceived risk as an external variable with perceived usefulness and hypothesize as follows:
Hypothesis 6.
The perceived risk of a robot barista significantly influences consumers’ attitude.

2.2.4. Perceived Innovativeness

Perceived innovativeness is defined as the degree to which the consumers believe that a product has important attributes of innovation, such as newness and uniqueness [21,33]. Perceived innovativeness significantly influences a consumer’s behavioral adoption of a new technology [54,55]. Accordingly, perceived innovativeness plays an important role in distinguishing a company from others and contributes toward the company’s endeavors to gain a competitive advantage [21]. Rogers [19] emphasized the importance of product innovation from a consumer’s perspective and argued that product acceptance is influenced by the objective innovation of the product as well as the degree of consumer perception of the innovative product. Watchravesringkan, Hodges, and Kim [33] presented perceived innovativeness as an intrinsic motivational factor in consumers’ adoption of highly technological fashion products and suggested that perceived innovativeness has a positive effect on consumers’ attitude toward using a technology and fashion products. Boisvert and Ashill [56] found that perceived innovativeness is an important predictor of attitude in the service industry. Hwang et al. [21] showed that consumers’ perceived innovativeness has a positive effect on the attitude and intention of using the drone food delivery service and behavioral intention, including the word-of-mouth. Slade, Dwivedi, Piercy, and Williams [57] suggested that innovativeness in the context of remote mobile payment has a positive effect on behavioral intention toward using the remote mobile payment. In this way, along with the variables of the TAM, perceived innovativeness, which reflects consumers’ subjective value and belief, plays a positive role in forming their attitude and behavioral intention [21]. Accordingly, this study established the following hypotheses based on ETAM:
Hypothesis 7.
The perceived innovativeness of a robot barista significantly influences consumers’ attitude.
Hypothesis 8.
The perceived innovativeness of a robot barista significantly influences consumers’ acceptance intention.
Figure 3 depicts all the hypotheses presented in the theoretical model.

3. Methodology

3.1. Sampling and Data Collection

In this study, we conducted a survey on a sample of consumers who had purchased coffee made by a robot barista at coffee shops in the last three months; the sample comprised South Korean residents aged 20 years and above. The coffee shops selected for the survey are Cafebot, Dalcombit, Lounge X, and Coffee Method; the frequency analysis of the pilot test showed that these coffee shops with robot baristas were most used by coffee consumers. Therefore, it is assumed that the users of these four brands were representative of the population that purchased from robot baristas.
The data were collected from 10 to 24 January 2020 in collaboration with the Macromill Embrain, a reliable and leading online research company in South Korea. We received more than 1.3 million responses. Screening questions were administered to the consumers before inviting them for the interview. Panel members were asked if they had an experience of purchasing coffee brewed by robot baristas at any of the four coffee shops in the previous three months. Consumers who met this inclusion criterion were selected for the study. The questions were presented to all respondents in the same order. Subsequently, we selected a sample of 317 respondents for the empirical analysis. Table 1 presents a profile of the sample. Since the net response rate was 5.6%, the dataset was subjected to a non-response bias analysis using wave analysis. The responses collected within the initial seven days of the survey were classified as “early responses,” while those collected during the last seven days were classified as “late responses.” Using these two groups, we carried out an independent t-test; the results showed a non-significant difference between the two groups, thereby indicating the lack of non-response bias within the dataset.

3.2. Research Instrument

We composed the questionnaire by reviewing previous studies; the questionnaire was modified to suit the situation of the coffee shop with a robot barista. After completing the first questionnaire, we formed a panel of experts consisting of three professors of restaurant management and three managers of coffee shops with a robot barista. They were asked to give their opinion and review the composition and content of the questionnaire. Before the survey, a pilot test was conducted to confirm whether the survey participants fully comprehended the questionnaire. The pilot test led to the deletion of items that were difficult to measure accurately and the correction of the questionnaire; the questionnaire was also supplemented with appropriate expressions. In this way, the final questionnaire was completed. This study considered seven factors—perceived usefulness, perceived enjoyment, the need for interaction, perceived risk, perceived innovativeness, attitude, and acceptance intention. San-Martín and Herrero [58] and Kim et al. [34] listed three variables of perceived usefulness, Ha and Stoel [37] and Kim et al. [34] listed four items of perceived enjoyment, Meuter, Bitner, Ostrom, and Brown [59] and Kaushik et al. [17] listed three items of the need for interaction, Lee [60], Marakarkandy, Yajnik, and Dasgupta [61] listed three items of perceived risk, Watchravesringkan et al. [33] and Hwang et al. [21] listed three items of perceived innovativeness, and Kaushik et al. [17] and Hwang et al. [21] listed three items of attitude and four items of acceptance intention.

3.3. Analytical Methods

For the analysis, we used the statistical package for the social sciences (SPSS) 22.0 and the analysis of a moment structures (AMOS) 22.0. The demographic characteristics were analyzed using SPSS 22.0. We tested the hypotheses using Anderson and Gerbing’s [62] two-step approach—the measurement model and the structural model evaluation. First, we conducted the confirmatory factor analysis (CFA) to test the adequacy of the measurement model and assess the composite reliability and the convergent validity. Subsequently, we performed the structural equation modelling (SEM) to test the hypothetical relationships between the seven constructs proposed in the conceptual model.

4. Data Analysis and Results

4.1. Measurement Model

The goodness-of-fit of the measurement model was assessed using a CFA. To assess the fit of the model, we used the cut-off values of the seven fit indices—χ2/df (<3), goodness-of-fit index (GFI > 0.90), root mean square error of approximation (RMSEA < 0.08), root mean square residual (RMR < 0.08), normed fit index (NFI > 0.9), incremental fit index (>0.9), and comparative fit index (CFI > 0.9) [63]. The measurement model had a good fit with the data collected (χ2 = 298.932, df = 200, CMIN/df = 1.495, RMR = 0.035, GFI = 0.924, NFI = 0.934, IFI = 0.977, CFI = 0.977, and RMSEA = 0.040) (see Table 2). The adequacy of the measurement model was tested using the standard criteria, namely reliability, convergent validity, and discriminant validity. First, the reliability was assessed based on the composite construct reliability (CCR) values. Table 2 shows that all the values exceeded 0.7, demonstrating adequate composite reliability [64]. The average variance extracted (AVE) values of all constructs were higher than the minimum threshold of 0.5, indicating the convergent validity of the measures [64].
To examine the discriminant validity of variables whose convergent validity have been established, we compared the square root of the AVE of each latent variable against its corresponding correlation coefficient between potential variables. Table 3 shows that the square root of the AVE of each latent variable is larger than its corresponding correlation coefficient, implying adequate discriminant validity [64].

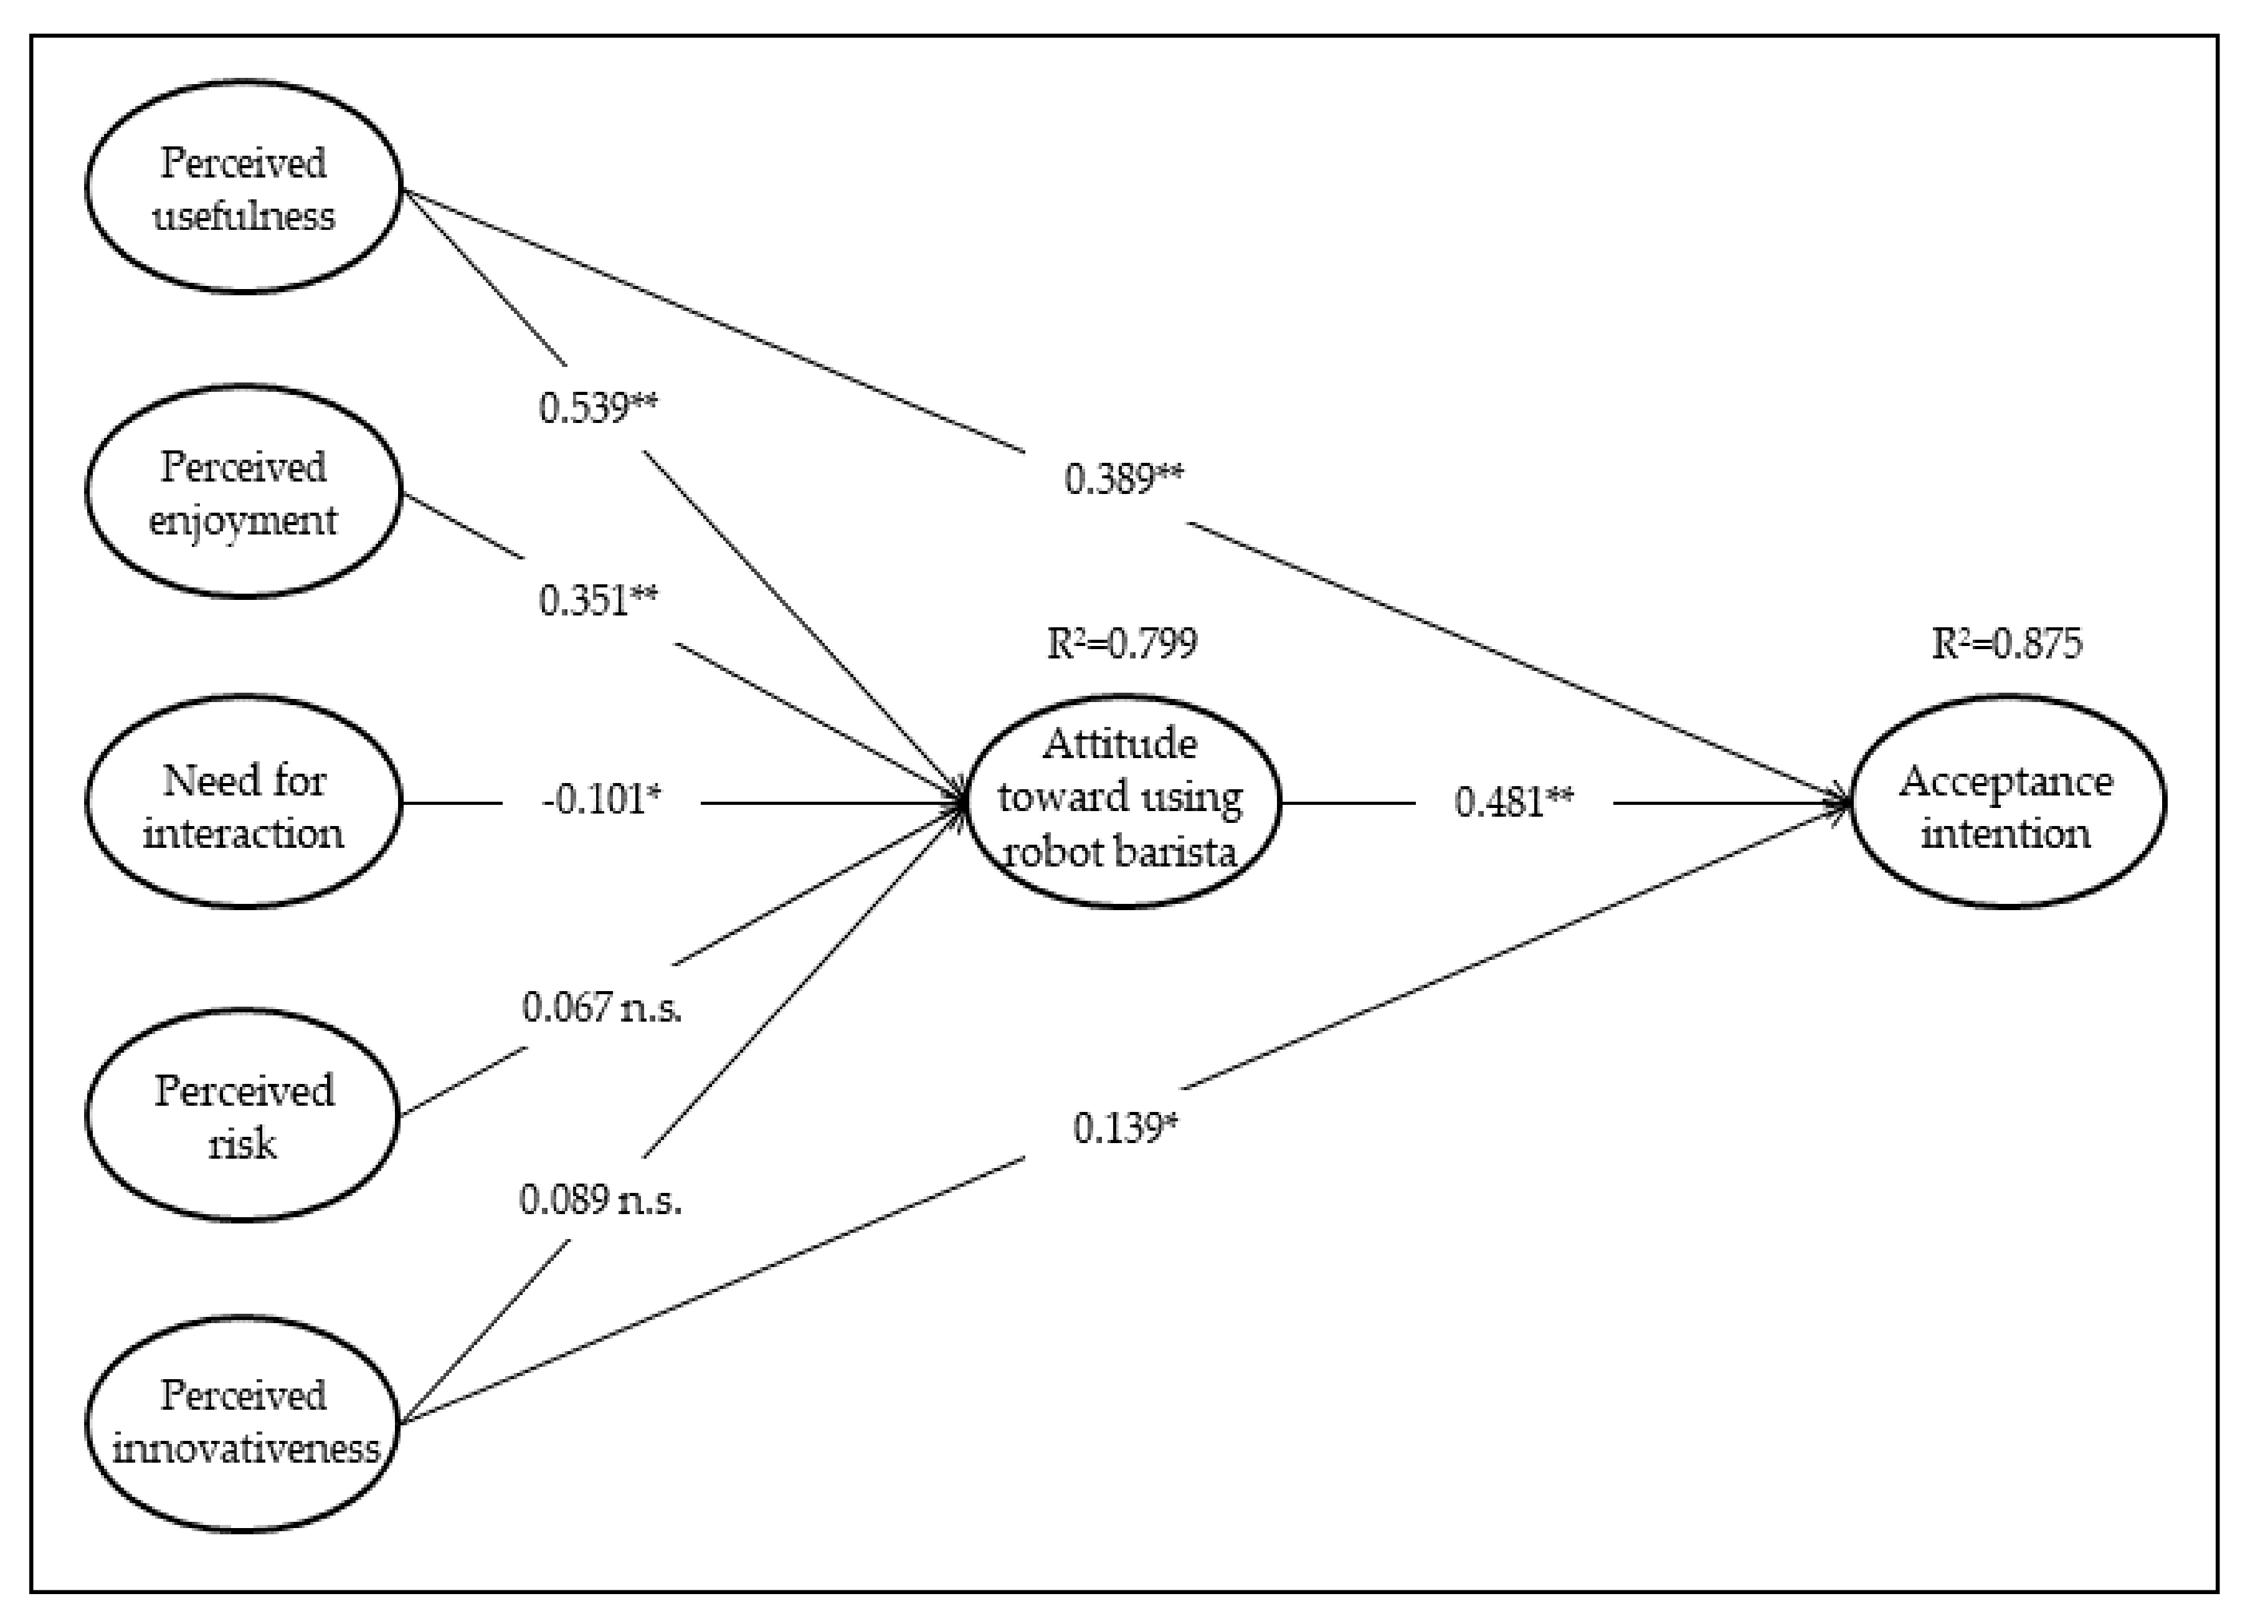
4.2. Structural Model

An SEM was conducted using the AMOS 22.0 statistical package. To test the hypotheses established through the SEM path coefficients, we assessed the fit of the structural model describing the relationships among constructs. The model fit indices were χ2 = 302.114, df = 203, p = 0.000, CMIN/df = 1.488, RMR = 0.035, GFI = 0.923, NFI = 0.933, IFI = 0.977, CFI = 0.977, and RMSEA = 0.039; these values indicate the fulfillment of the standard assessment criteria. Figure 4 presents the result of each hypothesis test describing the causal relationship between any pair of constructs. Hypothesis 1 was supported because perceived usefulness positively and significantly influences attitude (β = 0.539, t = 5.714, p = 0.000). Hypothesis 2 was supported because perceived usefulness positively and significantly influences acceptance intention (β = 0.389, t = 3.910, p = 0.000). Hypothesis 3 was supported because attitude positively and significantly influences acceptance intention (β = 0.481, t = 4.539, p = 0.000). Hypothesis 4 was supported because perceived enjoyment positively and significantly influences attitude (β = 0.351, t = 2.935, p = 0.003). Hypothesis 5 was supported because need for interaction negatively and significantly influences attitude (β = −0.101, t = −1.969, p = 0.049). Hypothesis 6 was rejected because perceived risk does not significantly influence attitude (β = 0.067, t = 1,188, p = 0.235). Hypothesis 7 was rejected because perceived innovativeness does not significantly influence attitude (β = 0.089, t = 0.931, p = 0.352). Lastly, Hypothesis 8 was supported because perceived innovativeness positively and significantly influences acceptance intention (β = 0.122, t = 2.037, p = 0.042).

5. Discussion and Conclusions

5.1. Theoretical Implications

From a theoretical perspective, this study attempted to find the main variable that influences customers’ acceptance intention toward AI adoption; this determination is critical to the effective management of restaurants in the post-Covid-19 era. This study investigated coffee shops with a robot barista. The coffee shop is one of the sub-sectors of the food service industry; the results of this study contribute to the literature on this sector by examining the integration of information technology with food service.
Although TAM has been used in many studies as a model for explaining technology acceptance, it has a limitation in that it does not fully consider the effects of various exogenous variables, and hence falls short in predicting the acceptance of the new technology in an offline environment [17]. To overcome the limitation, we used the variables of ETAM presented by Davis et al. [13], Curran and Meuter [29], Kaushik et al. [17], and Watchravesringkan et al. [33]. This design is different from a few studies on robot services in the hospitality industry [1,3]. Further, it is also different from the study on the acceptance of SST, which applied ETAM to the context of the hospitality industry [17].
To the best of our knowledge, this is the first study to examine consumer acceptance of a service robot in the food service industry. Unlike the previous research [17], this study examines consumer behavior based on their consumption of the coffee produced by a robot. Hence, it is not based on the self-service context in which customers directly operate the latest information and communication technology-based devices. Accordingly, this study excluded perceived ease of use from the ETAM [17] and included perceived enjoyment and perceived innovativeness. This design contributes to the literature on the acceptance of robot service.
This analysis revealed that the attitude of customers toward the robot barista was influenced by perceived usefulness, perceived enjoyment, and the need for interaction. Particularly, perceived usefulness was found to be an important variable in the context of robot services, similar to the context of an SST [17]. However, the need for interaction showed a different pattern from the previous studies [17,29] as it had a negative effect on the formation of the customer attitude. Finally, this study investigated a structural relationship between the variables by applying the ETAM; the variables of the ETAM significantly influenced the consumer behavior toward a robot barista, which has emerged as a new player in food service management. Concerning the model and the research design, our results confirmed the fit of the model, and the research design and results significantly contribute to the literature on restaurant management.

5.2. Practical Implications

Perceived usefulness plays a significant role in influencing customers’ attitude and acceptance intention toward the use of a robot barista. The Korean coffee consumers perceive that the coffee and the service provided by a robot barista are better than that offered by a human employee. The ability of a robot barista to maintain consistency assures customers of its product and service quality. In particular, customers consider the entire service encounter with a robot barista to be a very interesting and pleasant experience. Although coffee products provided by the robot baristas are still limited, customers perceive the service provided by robot baristas to be better than that provided by human employees. This can be attributed to the factors of interest, enjoyment, and novelty associated with a robot barista. However, the interest and novelty will gradually reduce with an increase in the consumption of coffee brewed by robot baristas, and these factors will not contribute toward effective coffee shop management. Therefore, it will be essential to integrate new features into the robot barista to help it provide a wide range of coffee and coffee-based beverages. For instance, in addition to recognizing a customer’s face or fingerprint with the help of an AI algorithm, the robot barista should be able to identify consumption patterns, such as a customer’s preferred coffee product, purchase amount, and purchase frequency. This information can equip a robot barista to generate customized menus for customers. This innovative function will also improve the acceptance intention of the customers and its role in the coffee shop.
In terms of interactions with an employee, customers showed a negative attitude toward the use of robot barista. The studies analyzing service provision through an SST [17,40] also highlighted the significance of human interaction during a service. Customers select and order a coffee while communicating face-to-face with an employee. During these interactions, customers expect the employee’s meticulous attention. However, a robot barista only performs simple tasks, and hence it cannot fulfill the customers’ need for attention and interaction. Although a robot barista’s service will hold significance in the post-corona era, its use will expand only by solving the customers’ need for interaction. Currently, in Korea, robot baristas are performing simple tasks based on a set of commands. Hence, it will be crucial to install AI algorithms that will increase the communication of these robots with customers. The robot barista should help customers select and order coffee and provide detailed explanation of the coffee ordered. Furthermore, although a robot barista plays an important role in the coffee, the need for human service cannot be undermined. Therefore, coffee shops with robot baristas should continue to provide human services and differentiate the latter from those provided in coffee shops without a robot barista. In this regard, the coffee chains should clarify the division of work between the robot barista and the human employee. For example, simple products should be handled by a robot barista, while products that require sophisticated extraction (such as specialty coffee or hand drip) should be handled by a professional human barista. Human baristas must provide customers with an elaborate explanation of a coffee product (green beans, production location, taste, aroma, and history). This will satisfy their curiosity about coffee as well as their intellectual curiosity (as a sommelier does at a wine bar). Human employees must engage in complex communication that goes beyond order and payment. The store employees who are not professional baristas should focus on customer convenience because it cannot be addressed by a robot barista. Finally, for sustainable coffee shop management, it is necessary to further improve the AI function of the robot barista in order to enable anthropomorphism. Employees should also strengthen their expertise as baristas and provide customer service that is differentiated from coffee shops without a robot barista.

5.3. Conclusions

This study demonstrated how the variables of ETAM influence the formation of customers’ attitude and acceptance intention toward the use of robot baristas. To formulate the ETAM, the study added perceived enjoyment, the need for interaction, perceived risk, and perceived innovativeness to the TAM. The results of the data analysis proved that perceived usefulness and perceived enjoyment are positive determinants of attitude. Perceived usefulness and innovativeness were found to significantly influence the acceptance intention toward robot baristas. These empirical findings prove that the ETAM is an appropriate model for explaining consumer behavior toward a robot barista in a coffee shop. Accordingly, the theoretical framework proposed and tested through the model will serve as a basis for future research on service robots in the restaurant industry. In particular, this study proposes that providing a robot service is an important strategy for sustainable coffee shop management, especially when customer demand for “untact” (i.e., without contact) services is increasing as measure against possible infection by the COVID-19 virus.

5.4. Limitations and Future Research

Despite its results and implications, this study has the following limitations and future research direction. First, since the data were collected only in Korea, generalization of the results may be limited. It may not be appropriate to apply these findings to other countries. Second, the subject of the study was limited to coffee shops in the food service industry. Thus, applying the research results to robotic services in hotels or restaurants would not be appropriate. Third, since the online survey can induce selection bias [65], future research should use various types of data collection methods to reduce bias and increase the response rate. Finally, as the introduction of robot baristas in Korea is in the early stages, this study examined consumer acceptance. However, future research should focus on the overall service quality provided by robot baristas; it should also provide a more in-depth discussion of strategic plans in relation to expanding the range of services provided by a robot barista.

Author Contributions

H.J.S. and H.M.J. conceived and designed the experiments; H.M.J. conducted the experiments and analyzed the data; and H.J.S. and H.M.J. authored the paper. All the authors contributed to proof-reading. All authors have read and agreed to the published version of the manuscript.

Funding

This work was supported by the Pai Chai University research grant in 2020.

Conflicts of Interest

The authors declare no conflict of interest.

References

  1. Lin, H.; Chi, O.H.; Gursoy, D. Antecedents of customers’ acceptance of artificially intelligent robotic device use in hospitality services. J. Hosp. Mark. Manag. 2020, 29, 530–549. [Google Scholar] [CrossRef]
  2. Wirtz, J.; Patterson, P.; Kunz, W.; Gruber, T.; Lu, V.N.; Paluch, S.; Martins, A. Brave new world: Service robots in the frontline. J. Serv. Manag. 2018, 29, 907–931. [Google Scholar] [CrossRef] [Green Version]
  3. Jang, H.-W.; Lee, S.-B. Serving Robots: Management and Applications for Restaurant Business Sustainability. Sustainability 2020, 12, 3998. [Google Scholar] [CrossRef]
  4. Naeil. Robots Employed in the Food Service Industry. 17 January 2020. Available online: http://www.naeil.com/news_view/?id_art=338129 (accessed on 24 August 2020).
  5. Fnnews. Delivery of Nation’s Serving Robot ‘Dilly’ Serves at 12 Restaurants Nationwide. 4 February 2020. Available online: https://www.fnnews.com/news/202002041607327658 (accessed on 24 August 2020).
  6. Daily Coffee News. Cafe X Multiroaster ‘Robotic Cafe’ Opens in San Francisco. 30 January 2017. Available online: https://dailycoffeenews.com/2017/01/30/cafe-x-multiroaster-robotic-cafe-opens-in-san-francisco/ (accessed on 24 August 2020).
  7. Daily Coffee News. Robotic Barista Providing Contact-Free Drinks at Portland’s in J Coffee. 26 March 2020. Available online: https://dailycoffeenews.com/2020/05/26/robotic-barista-providing-contact-free-drinks-at-portlands-in-j-coffee (accessed on 24 August 2020).
  8. Infostock Daily. First Entry of Dal.komm Coffee Robot café, ‘Beat2E’ into Supermarket, ‘Cheonggyecheon Branch of Emar’. 20 January 2020. Available online: http://www.infostockdaily.co.kr/news/articleView.html?idxno=84850 (accessed on 24 August 2020).
  9. Joins. Emergence of Robot Barista Which Is Like a Real Barista and Serving by Pang Shuttle. 31 July 2019. Available online: https://news.joins.com/article/23540445 (accessed on 24 August 2020).
  10. Yoon, J.H. X-event becomes reality: Pandemic scenario of infectious diseases in Korean society. Future Horiz. 2020, 1, 10–19. [Google Scholar]
  11. The Financial Express. Post-COVID-19 Pandemic: Touch-Free Localised Production. 28 March 2020. Available online: https://thefinancialexpress.com.bd/views/views/post-covid-19-pandemic-touch-free-localised-production-1585407944 (accessed on 24 August 2020).
  12. Davis, F.D. Perceived usefulness, perceived ease of use, and user acceptance of information technology. MIS Q. 1989, 13, 319–340. [Google Scholar] [CrossRef] [Green Version]
  13. Davis, F.D.; Bagozzi, R.P.; Warshaw, P.R. Extrinsic and Intrinsic Motivation to Use Computers in the Workplace1. J. Appl. Soc. Psychol. 1992, 22, 1111–1132. [Google Scholar] [CrossRef]
  14. Webster, J.; Heian, J.B.; Michelman, J.E. Computer Training and Computer Anxiety in the Educational Process: An Experimental Analysis. In Proceedings of the Eleventh International Conference on Information Systems, Copenhagen, Denmark, 16–19 December 1990; AIS Electronic Library; pp. 71–182. Available online: https://aisel.aisnet.org/icis1990/34/ (accessed on 24 August 2020).
  15. Webster, J.; Martocchio, J.J. Microcomputer Playfulness: Development of a Measure with Workplace Implications. MIS Q. 1992, 16, 201–226. [Google Scholar] [CrossRef]
  16. Moon, J.-W.; Kim, Y.-G. Extending the TAM for a World-Wide-Web context. Inf. Manag. 2001, 38, 217–230. [Google Scholar] [CrossRef]
  17. Kaushik, A.K.; Agrawal, A.K.; Rahman, Z. Tourist behaviour towards self-service hotel technology adoption: Trust and subjective norm as key antecedents. Tour. Manag. Perspect. 2015, 16, 278–289. [Google Scholar] [CrossRef]
  18. Herzenstein, M.; Posavac, S.S.; Brakus, J.J. Adoption of New and Really New Products: The Effects of Self-Regulation Systems and Risk Salience. J. Mark. Res. 2007, 44, 251–260. [Google Scholar] [CrossRef] [Green Version]
  19. Rogers, E.M. Diffusion of Innovations, 5th ed.; Free Press: New York, NY, USA, 2003. [Google Scholar]
  20. Hanafizadeh, P.; Behboudi, M.; Koshksaray, A.A.; Tabar, M.J.S. Mobile-banking adoption by Iranian bank clients. Telemat. Inform. 2014, 31, 62–78. [Google Scholar] [CrossRef]
  21. Hwang, J.; Lee, J.-S.; Kim, H. Perceived innovativeness of drone food delivery services and its impacts on attitude and behavioral intentions: The moderating role of gender and age. Int. J. Hosp. Manag. 2019, 81, 94–103. [Google Scholar] [CrossRef]
  22. Im, I.; Kim, Y.; Han, H.-J. The effects of perceived risk and technology type on users’ acceptance of technologies. Inf. Manag. 2008, 45, 1–9. [Google Scholar] [CrossRef]
  23. Davis, F.D.; Bagozzi, R.P.; Warshaw, P.R. User acceptance of computer technology: A comparison of two theoretical models. Manag. Sci. 1989, 35, 982–1003. [Google Scholar] [CrossRef] [Green Version]
  24. Bhattacharjee, A. Understanding information systems continuance: An expectation confirmation model. MIS Q. 2001, 25, 351–370. [Google Scholar] [CrossRef]
  25. Dabholkar, P.A.; Bagozzi, R.P. An attitudinal model of technology-based self-service: Moderating effects of consumer traits and situational factors. J. Acad. Mark. Sci. 2002, 30, 184–201. [Google Scholar] [CrossRef]
  26. Bitner, M.J.; Brown, S.W.; Meuter, M.L. Technology Infusion in Service Encounters. J. Acad. Mark. Sci. 2000, 28, 138–149. [Google Scholar] [CrossRef]
  27. Lee, S.W.; Sung, H.J.; Jeon, H.M. Determinants of Continuous Intention on Food Delivery Apps: Extending UTAUT2 with Information Quality. Sustainability 2019, 11, 3141. [Google Scholar] [CrossRef] [Green Version]
  28. Curran, J.M.; Meuter, M.L. Self-service technology adoption: Comparing three technologies. J. Serv. Mark. 2005, 19, 103–113. [Google Scholar] [CrossRef]
  29. Fishbein, M.; Ajzen, I. Belief, Attitude, Intention, and Behavior: An Introduction to Theory and Research; Addison-Wesley: Reading, MS, USA, 1975. [Google Scholar]
  30. San-Martín, S.; López-Catalán, B.; Ramón-Jerónimo, M.A. Mobile shoppers: Types, drivers, and impediments. J. Organ. Comput. Electron. Commer. 2013, 23, 350–371. [Google Scholar] [CrossRef]
  31. Agarwal, R.; Karahanna, E. Time Flies When You’re Having Fun: Cognitive Absorption and Beliefs about Information Technology Usage. MIS Q. 2000, 24, 665. [Google Scholar] [CrossRef]
  32. Morosan, C.; DeFranco, A. It’s about time: Revisiting UTAUT2 to examine consumers’ intentions to use NFC mobile payments in hotels. Int. J. Hosp. Manag. 2016, 53, 17–29. [Google Scholar] [CrossRef]
  33. Watchravesringkan, K.; Hodges, N.N.; Kim, Y. Exploring consumers’ adoption of highly technological fashion products. J. Fash. Mark. Manag. Int. J. 2010, 14, 263–281. [Google Scholar] [CrossRef] [Green Version]
  34. Kim, S.H.; Bae, J.H.; Jeon, H.M. Continuous Intention on Accommodation Apps: Integrated Value-Based Adoption and Expectation–Confirmation Model Analysis. Sustainability 2019, 11, 1578. [Google Scholar] [CrossRef] [Green Version]
  35. Van Der Heijden, H. Factors influencing the usage of websites: The case of a generic portal in The Netherlands. Inf. Manag. 2003, 40, 541–549. [Google Scholar] [CrossRef] [Green Version]
  36. Lee, H.; Fiore, A.M.; Kim, J. The role of the technology acceptance model in explaining effects of image interactivity technology on consumer responses. Int. J. Retail. Distrib. Manag. 2006, 34, 621–644. [Google Scholar] [CrossRef]
  37. Ha, S.; Stoel, L. Consumer e-shopping acceptance: Antecedents in a technology acceptance model. J. Bus. Res. 2009, 62, 565–571. [Google Scholar] [CrossRef]
  38. Praveena, K.; Thomas, S. Continuance Intention to Use Facebook: A Study of Perceived Enjoyment and TAM. Bonfring Int. J. Ind. Eng. Manag. Sci. 2014, 4, 24–29. [Google Scholar] [CrossRef] [Green Version]
  39. Matute-Vallejo, J.; Melero-Polo, I. Understanding online business simulation games: The role of flow experience, perceived enjoyment and personal innovativeness. Australas. J. Educ. Technol. 2019, 35, 71–85. [Google Scholar] [CrossRef]
  40. Seth, N.; Deshmukh, S.; Vrat, P. Service quality models: A review. Int. J. Qual. Reliab. Manag. 2005, 22, 913–949. [Google Scholar] [CrossRef] [Green Version]
  41. Dabholkar, P.A. Role of affect and need for interaction in on-site service encounters. In Advances in Consumer Research; Sherry, J.F., Sternthal, B., Eds.; Association for Consumer Research: Provo, UT, USA, 1992; Volume 19, pp. 563–569. [Google Scholar]
  42. Cowles, D.; Crosby, L.A. Consumer Acceptance of Interactive Media in Service Marketing Encounters. Serv. Ind. J. 1990, 10, 521–540. [Google Scholar] [CrossRef]
  43. Dabholkar, P.A. Consumer evaluations of new technology-based self-service options: An investigation of alternative models of service quality. Int. J. Res. Mark. 1996, 13, 29–51. [Google Scholar] [CrossRef]
  44. Kaushik, A.K.; Rahman, Z. Are street vendors really innovative toward self-service technology? Inf. Technol. Dev. 2016, 22, 334–356. [Google Scholar] [CrossRef]
  45. Meuter, M.L.; Ostrom, A.L.; Bitner, M.J.; Roundtree, R. The influence of technology anxiety on consumer use and experiences with self-service technologies. J. Bus. Res. 2003, 56, 899–906. [Google Scholar] [CrossRef]
  46. Walker, R.H.; Johnson, L.W. Why consumers use and do not use technology-enabled services. J. Serv. Mark. 2006, 20, 125–135. [Google Scholar] [CrossRef]
  47. Collier, J.E.; Kimes, S.E. Only if it is convenient: Understanding how convenience influences self-service technology evaluation. J. Serv. Res. 2013, 16, 39–51. [Google Scholar] [CrossRef]
  48. Chen, R.; He, F. Examination of brand knowledge, perceived risk and consumers’ intention to adopt an online retailer. Total. Qual. Manag. Bus. Excel. 2003, 14, 677–693. [Google Scholar] [CrossRef]
  49. Jarvenpaa, S.L.; Todd, P.A. Consumer Reactions to Electronic Shopping on the World Wide Web. Int. J. Electron. Commer. 1996, 1, 59–88. [Google Scholar] [CrossRef]
  50. Crespo, Á.H.; Del Bosque, I.R.; de los Salmones Sánchez, M.M.G. The influence of perceived risk on Internet shopping behavior: A multidimensional perspective. J. Risk Res. 2009, 12, 259–277. [Google Scholar] [CrossRef]
  51. Ma, Z.; Gill, T.; Jiang, Y. Core versus Peripheral Innovations: The Effect of Innovation Locus on Consumer Adoption of New Products. J. Mark. Res. 2015, 52, 309–324. [Google Scholar] [CrossRef]
  52. Wessels, L.; Drennan, J. An investigation of consumer acceptance of M-banking. Int. J. Bank Mark. 2010, 28, 547–568. [Google Scholar] [CrossRef]
  53. Conchar, M.P.; Zinkhan, G.M.; Peters, C.; Olavarrieta, S. An Integrated Framework for the Conceptualization of Consumers’ Perceived-Risk Processing. J. Acad. Mark. Sci. 2004, 32, 418–436. [Google Scholar] [CrossRef]
  54. Agarwal, R.; Prasad, J. A Conceptual and Operational Definition of Personal Innovativeness in the Domain of Information Technology. Inf. Syst. Res. 1998, 9, 204–215. [Google Scholar] [CrossRef]
  55. Hung, S.-Y.; Ku, C.-Y.; Chang, C.-M. Critical factors of WAP services adoption: An empirical study. Electron. Commer. Res. Appl. 2003, 2, 42–60. [Google Scholar] [CrossRef]
  56. Boisvert, J.; Ashill, N.J. How brand innovativeness and quality impact attitude toward new service line extensions: The moderating role of consumer involvement. J. Serv. Mark. 2011, 25, 517–527. [Google Scholar] [CrossRef]
  57. Slade, E.L.; Dwivedi, Y.K.; Piercy, N.C.; Williams, M.D. Modeling Consumers’ Adoption Intentions of Remote Mobile Payments in the United Kingdom: Extending UTAUT with Innovativeness, Risk, and Trust. Psychol. Mark. 2015, 32, 860–873. [Google Scholar] [CrossRef]
  58. San-Martín, H.; Herrero, Á. Influence of the user’s psychological factors on the online purchase intention in rural tourism: Integrating innovativeness to the UTAUT framework. Tour. Manag. 2012, 33, 341–350. [Google Scholar] [CrossRef]
  59. Meuter, M.L.; Bitner, M.J.; Ostrom, A.L.; Brown, S.W. Choosing among Alternative Service Delivery Modes: An Investigation of Customer Trial of Self-Service Technologies. J. Mark. 2005, 69, 61–83. [Google Scholar] [CrossRef]
  60. Lee, M.-C. Factors influencing the adoption of internet banking: An integration of TAM and TPB with perceived risk and perceived benefit. Electron. Commer. Res. Appl. 2009, 8, 130–141. [Google Scholar] [CrossRef]
  61. Marakarkandy, B.; Yajnik, N.; Dasgupta, C. Enabling internet banking adoption. J. Enterp. Inf. Manag. 2017, 30, 263–294. [Google Scholar] [CrossRef]
  62. Hair, J.F.; Hult, G.T.M.; Ringle, C.; Sarstedt, M. Primer on Partial Least Squares Structural Equation Modelling (PLS-SEM); Sage: Los Angeles, CA, USA, 2016. [Google Scholar]
  63. Anderson, J.C.; Gerbing, D.W. Structural equation modeling in practice: A review and recommended two-step approach. Psychol. Bull. 1988, 103, 411–423. [Google Scholar] [CrossRef]
  64. Fornell, C.R.; Larcker, D.F. Evaluating structural equation models with unobservable variables and measurement error. J. Mark. Res. 1981, 18, 39–50. [Google Scholar] [CrossRef]
  65. Wright, K.B. Researching internet-based populations: Advantages and disadvantages of online survey research, online questionnaire authoring software packages, and web survey services. J. Computer-Mediated Commun. 2005, 10, JCMC1034. [Google Scholar] [CrossRef]
Figure 1. Beat Robot Barista of Coffee Shop Chain Dal.komm, as (a) Beat in Kyung Hee University and (b) Beat in No Brand store.
Sustainability 12 08598 g001
Figure 2. Technology Acceptance Model (TAM).
Sustainability 12 08598 g002
Figure 3. Theoretical Framework.
Sustainability 12 08598 g003
Figure 4. Structural equation modelling with parameter estimates; * p < 0.05; ** p < 0.01; n.s. = non-significant.
Sustainability 12 08598 g004
Table 1. Responder’s profile.
Demographic CharacteristicsFrequencyPercentage
GenderMale15448.6
Female16351.4
Age20–29 years7824.6
30–39 years13843.5
40–49 years7022.1
50–59 years278.5
Above 60 years41.3
Marital statusSingle14445.4
Married17354.6
Educational levelHigh school123.8
2-year university288.8
4-year university23774.8
Graduate school4012.6
Annual incomeBelow USD 20,000299.1
USD 20,000–29,0004413.9
USD 30,000–39,0007222.7
USD 40,000–49,0007022.1
USD 50,000–59,0003410.7
Above USD 60,0006821.5
OccupationStudent257.9
Office workers17153.9
Sales and Service268.2
Technician196.0
Professional job3912.3
Self-employed185.7
Housewife123.8
Others72.2
CoffeeshopCafebot13542.6
Dalcombit7022.1
Lounge X6821.5
Coffee Method4413.9
Table 2. Measurement model assessment.
Variables and ItemLoadingCCRAVE
Perceived usefulness (PU) (α = 0.729)
Using a robot barista in coffee shop is useful0.8300.7930.566
Using a robot barista in coffee shop increases efficiency in ordering and receiving coffee menus0.693
Using a robot barista in coffee shop is better than coffee menu manufacturing through a human barista0.583
Perceived enjoyment (PE) (α = 0.880)
Using a robot barista service is a pleasant experience to me0.8000.9130.725
Using a robot barista service is an interesting experience to me0.796
Using a robot barista service is a cheerful experience to me 0.814
Using a robot barista service is a funny experience to me 0.804
Need for interaction (NI) (α = 0.785)
A human barista does things for me that no robot barista could 0.6630.8150.599
I enjoy ordering and receiving coffee menu face-to-face from a human barista0.876
The employee’s attention in customer service is important to me 0.697
Perceived risk (PR) (α = 0.858)
A robot barista runs the risk of incorrect coffee menu manufacturing0.7330.8460.647
I am not sure if a robot barista can perform satisfactorily0.827
Overall, I feel anxious about a robot barista0.850
Perceived innovativeness (PI) (α = 0.809)
A robot barista services seem new0.7280.8700.708
A robot barista services seem creative0.813
A robot barista services seem innovative0.761
Attitude (AT) (α = 0.843)
I am positive about using a robot barista0.8150.9010.742
I am in favor of using a robot barista0.851
I like to use a robot barista0.778
Acceptance intention (AI) (α = 0.892)
I will continue to visit coffee shops with a robot barista in the future0.7700.9050.704
I plan to visit a coffee shop with a robot barista in the future0.837
I am highly likely to recommend a coffee shop with a robot barista to a friend0.790
I will be happy to revisit this coffee shop with a robot barista0.847
Table 3. Correlations of analysis between the variables.
Variable1234567
1. PU0.752
2. PE0.6130.851
3. NI0.003−0.0140.774
4. PR−0.279−0.2830.3740.804
5. PI0.5100.679−0.003−0.2190.841
6. AT0.6750.712−0.059−0.2730.5650.861
7. AI0.7020.708−0.053−0.3330.5800.7930.839
Mean3.6223.9623.2562.9234.0163.7213.718
S.D.0.6920.7160.7900.8830.6820.7210.782
Note: Diagonal elements show the square root of average variance extracted (AVE). Below the diagonal is the corresponding correlation coefficient. All correlation coefficients were significant at the 0.001 level.
Publisher’s Note: MDPI stays neutral with regard to jurisdictional claims in published maps and institutional affiliations.

