Article

Sustainable Design Alternatives and Energy Efficiency for Public Rental Housing in Korea

Department of Housing and Interior Design, Chung-Ang University, Seoul 06911, Korea
*
Author to whom correspondence should be addressed.
Sustainability 2020, 12(20), 8456; https://doi.org/10.3390/su12208456
Submission received: 29 August 2020 / Revised: 6 October 2020 / Accepted: 11 October 2020 / Published: 14 October 2020

Abstract

:
The orientation and shape of a building can influence energy efficiency in both heating and cooling mechanisms. Given the climatic conditions of Korea, many people are concerned about housing orientation and prefer south-oriented locations. As such, many housing complexes consist of a series of long narrow units that are south-facing. The purpose of this study is to investigate design alternatives for the layout of a building complex, size of households, width to depth ratios of floorplans, and design and type of façade; to examine energy efficiency using energy simulation programs; and to suggest diverse design alternatives for public rental housing, as well as energy-efficient options. The alternative housing units, which are more square-shaped than the typical long and rectangular type, resulted in higher energy costs. Simulation results show that as the solar radiation load increases or the window area increases due to plan alteration, there is simultaneously a significant increase and decrease in the cooling and heating loads, respectively. The performance of the suggested layout alteration greatly increased the heating load and slightly decreased the cooling load with similar total energy costs.

1. Introduction

Building sectors were responsible for 28% of global energy-related CO2 emissions in 2019 [1], while heating, ventilation, and air-conditioning systems accounted for 37% of the total energy consumption in buildings. In Korea, of the total energy produced, approximately 20% was consumed in buildings, half of which was consumed in residential buildings [2]. Energy consumption is one of the crucial areas of concern in terms of sustainability [3]. For low-income families, energy-efficient housing lead to significant savings, and integrated green strategies increase housing affordability [4], especially in terms of space, heating, cooling, and lighting.
To improve energy efficiency, it is emphasized to find optimal solutions for heating and cooling loads in the early stage of design [5]. Architectural design features such as building orientation, shape, façade, and its envelope are found to have significant influence on energy loads and their trade-offs [6,7,8]. Many existing studies have explored more efficient ways to link architectural design features and engineering systems with energy consumption [9,10].
For sustainable application, it is especially necessary to consider not only universal principles such as development without compromising future needs but also unique contexts such as the climate and locality. In the residential sector, it is important to consider local climate as well as demographic changes when exploring design alternatives for efficient energy consumption.
Since Korea has four distinct seasons with severe temperature gaps from −7 °C to 30 °C, extremely hot and humid in summer and extremely cold and dry in winter, there is a strong tendency to prefer south-oriented housing under this climate and culture [11]. Considering these extreme variations in temperature, cooling load needs to be taken into account in addition to heating load.
Previous studies have identified the different factors that affect energy consumption in buildings and have investigated how to improve energy efficiency and decrease costs of energy by manipulating these factors. To increase energy efficiency, some architectural design features, namely (1) building orientation; (2) building envelope; (3) plan shape and complexity; (4) story and height; (5) windows and glazing; (6) floor spans; and (7) circulation space, were suggested [5]. In another study, to reduce the demand for energy in residential buildings, building design criteria included a building envelope system, glazing, shading, orientation, shape, and passive heating and cooling mechanisms [7]. Abanda and Byers [12] estimated energy saving costs throughout the lifetime of simulated cases of a well-orientated domestic building using Building Information Modeling (BIM) tools, Revit and Green Building Studio. Among these factors, many studies consistently found that building orientation is a critical factor for improving energy efficiency in buildings [6,7,13].
Besides building orientation, the shape and size of a building can influence energy consumption. A compact shape, such as an orthogonal building, is desirable in minimizing the cost of energy but not desirable for daylight use. An additional advantage is that a compact shape minimizes heat loss by 6–10% [14]. Aksoy and Inalli [8] found that the rates of saving heating energy vary from 34% to 36% depending on the orientation and different shapes of buildings, including other shape factors. They concluded that buildings with a square shape have more advantages, and the most suitable building orientation angles were 0 and 80, in a building with a ratio of length to depth of 2/1 and 1/2, respectively.
Halawa et al. [9] emphasized that façades play an important role in the overall energy consumption in a building and represent the physical appearance of buildings. They suggested a holistic approach in considering façade design options, including façade aesthetics, to attain sustainable buildings. Mirrahimi et al. [15] identified the energy impact variables for designing building façades. They include building physics, building location, external/internal walls and materials, thermal insulation, windows, glazing, window-to-wall ratio, and external shading. Building physics refers to the shape elements of a building such as the form, height, length, and width. Since building façade designs include windows, shading devices and materials significantly influence energy performance in terms of heating, cooling, ventilation, and lighting [16]. Energy efficiency that is influenced by building orientation is related to the façade features of a building.
Using BIM, energy performance was evaluated by changing the following factors: the geometric shape of buildings (ratio of long side to short side), floor area, volume, window area ratio, orientation of the building, and total surface area (envelope area) of the building for residential and office facilities. In residential buildings, the building envelope influenced energy consumption by 42.5%, whereas it only influenced office buildings by 17.1% [10]. These studies identified each important architectural design element for energy consumption and determined how influential each variable was for heating, cooling, and daylighting, or as a part of total energy performance. Some studies investigated more than two variables and their impacts on energy consumption. Nevertheless, investigations and energy consumption simulations that explore the variables which can influence heating and cooling loads simultaneously, as well as total energy saving from the occupant’s perspective, are lacking. A few studies have examined the integrative impact of a wide range of building design factors on energy consumption. Even still, this integrative approach considered various factors and emphasized energy optimization processes for each project through energy simulation or using the BIM tool, rather than exploring generalized design applications for energy efficiency [17,18].
Some studies incorporating predictive models with configurations of simulated conditions have proposed a case for the final design or provided methods to achieve nearly Zero-Energy Buildings (nZEB) for residential purposes. Globally, many urban environments are facing population growth, and the demand for residential buildings, including affordable housing, has increased. Residential buildings account for a major part of the energy consumption in the building sector [19]. In addition, with regard to affordable housing, a sustainable and energy-efficient building is important in terms of the cost of lifelong housing. However, there is a lack of systematic analyses and evidence on the costs of construction and price estimation for lifelong green affordable housing; people presume that green, sustainable buildings are expensive to build [20].
With a developer of a multi-family sustainable housing community in the USA, Cheng et al. [18] indicate that the energy performance of multi-family buildings has not been thoroughly examined to include interactive effects of different variables; instead, the effect of each building and architectural variables on energy efficiency have been analyzed individually. They proposed two scenarios for assessing ten building variables that seem to have an influence on energy consumption. This approach is helpful in identifying design trade-offs in the early stage of a design process and in determining a final energy-efficient design of sustainable housing. Although the results were hard to generalize, this approach showed the interactive effects of energy variable adjustments in the plan and configuration of a building and design optimization processes for energy efficiency.
In addition, some studies reveal that highly energy-efficient buildings can decrease primary energy consumption by 90% in the Mediterranean area [21]. The concept of nZEB has been introduced and implemented worldwide, and the EU (Energy Performance of Buildings Directive) requires all new buildings to be nearly zero-energy by the end of 2020 [22]. In Korea, net zero-energy buildings in a residential community (121 house units), as a best practice, were also initiated and built by the government in 2017. Building materials and construction techniques can improve energy efficiency; however, still, in general, the majority of housings have a similar shape, since regarding the site plan and housing building, the south orientation is traditionally critical in capturing solar heat in Korea. In some super-high-rise apartments in Korea, universal techniques have been widely applied and the internal space of buildings has become sealed and separated from the external space, which is in contrast to the sustainable design strategy [23].
Due to rapid urbanization and an increase in population, apartments have become the most popular type of housing in cities as a result of mass supply, and more than 50% of people in Korea live in apartments [24]. An apartment as a major type of housing, represented in the shape of a simple concrete box as an outcome of economic development, has become common regardless of households and location. Regarding housing for those with low income, public rental apartments are a form of affordable or social housing in Korea and are more notorious for their homogeneous unit plan and building shape. Most public rental housing in Korea is characterized by its small size, narrow rectangular shape of units, narrow balcony, and long corridors due to size limitations, and most housing complexes consist of a series of long narrow units aligned to face south [25]. This is partially due to the fact that, traditionally, more housing units need to face south, and each house unit has smaller south-facing areas along the site. The linear south-facing housing building complexes are parallel to each other and are aligned. The ratio of housing units is far from representing a square shape, and it does not support the changing needs and lifestyles of the occupants. According to the Korea Housing Survey in 2017, the demand for rental housing among young adults living alone was extremely high, with lease occupancy accounting for 53.8% in the different types of housing occupancy [24]. Since public rental housings in Korea are extremely monotonous, and typical housing units are stereotyped, as it seems, they neither support the changing needs of occupants nor improve energy efficiency. Furthermore, considering the longitude of the Korean Peninsula, the climatic conditions have changed dramatically as the amount of energy loads for cooling has increased compared to the conventional amount of energy demand for heating [26]. It is necessary to investigate design alternatives with differently shaped housing units to meet growing demands for diverse housing and changing housing requirements—for example, exploring more south-facing square housing units or sacrificing southern orientation by incorporating different layouts for each housing unit. Nowadays, public agencies and the government are putting forth efforts to provide various design alternatives [27] while minimizing housing fees that occur as a result of an increase in energy performance in response to growing and changing demands.
Therefore, the purpose of this study is to investigate design alternatives for the layout of building complexes, size of households, width to depth ratios of floorplans, and type and design of facade and to examine energy efficiency using energy simulation programs from Integrated Environmental Solutions (IES), Virtual Environment (VE) 2017 in order to suggest diverse design alternatives for public rental housing as well as energy-efficient options.

2. Materials and Methods

2.1. Base Model and Design Alternatives

To simulate energy performance according to various designs of public rental apartments, it is necessary to establish a base model and design alternatives. To this end, the characteristics of the floor plan of small public rental apartments in Korea, the layout and orientation of units, and the design of the elevation were investigated. The base models and design alternatives were set up by reflecting on these factors. The base model, which has a size and unit type that is typical of Korean rental housing, was set at 39 square meters with a rectangular shape; the units of the base model are arranged linearly and are south-facing.

2.2. Energy Simulation

To examine the energy efficiency of design alternatives, energy simulation was conducted using VE 2017 (https://www.iesve.com/ve2017). For the simulation, weather condition data were based on the Seoul meteorological data of the Solar Energy Society. The thermal insulation conditions of the building (U-value) were based on the energy saving design standards of buildings in 2017. For the internal heating conditions and schedules, in terms of residential living conditions, it is assumed that there are 2 persons per household. The conditions for the computer simulation of the base model energy performance were verified by comparing the heating costs with the heating costs of 10 apartments that have the same heating system and size. Further, for the results of energy efficiency, the cost of cooling and heating of the ten households on a typical floor were estimated, and each cost was compared according to design alternatives.

2.2.1. Conditions for Simulation

  • Internal heat source condition and schedule: They were set based on ASHRAE 90.1 (Energy Standard for Buildings) and power consumption per Korean household (see Table 1).
  • Infiltration (including natural ventilation): 0.65 air change per hour (ACH). According to a study that measured the amount of infiltration and natural ventilation in Korean residential spaces, it is 0.6 ACH~0.7 ACH [23]. Therefore, the amount of infiltration and natural ventilation was set to 0.65 ACH in the simulation.
  • Heating and cooling system: For cooling efficiency, the minimum standard of efficiency of the Efficiency Management Equipment Operation Regulation (29 December 2017) was applied. The heating efficiency was assumed to be applied to 100% of the heat measured in the household (see Table 2) because heating costs are calculated from the amount of heating heat supplied to households in the case of district heating. The indoor setting temperature was 26 degrees in summer and 21.7 degrees in winter. The operating time of the heating and cooling system was set to 24 h.
  • Electricity and district heating calculation conditions (see Table 3):

2.2.2. Validation of the Conditions for the Simulation

The reliability of conditions for the simulation was verified by comparing the costs of heating in the simulation model with the costs of heating 39 m2 apartments in the Seoul area. To verify the conditions assumed for the simulation, the output values (energy costs) were compared with the actual cost reported by the apartment housing management information system operated by the Ministry of Land, Infrastructure and Transport and the Korea Appraisal Board (the 10 cases were chosen from the open data source which includes energy costs from housing units with the same size of unit (39 m2), the same type of public rental apartment built more than 10 years ago, located in Seoul metropolitan region). The estimated energy costs were within the range of actual costs and close to the mean value of 10 cases.
  • The costs of heating in the 39 m2 apartments in the Seoul area: As a result of a survey of ten apartment complexes with an exclusive area of 39 m2 in Seoul, annual costs of heating were estimated to be 187,885 won (see Table 4).
  • Comparison with the simulation model: The annual cost of heating of the simulation model is estimated at 194,316 won. It was considered that the difference from the survey value was 3.4%, and the current condition of the simulation was considered to be valid (see Table 5). Most of the complexes were completed before the year 2000, and the insulation standards of the rules on facility standards, and so forth, of buildings (enforcement on 1 June 1992) were applied and reviewed.

3. Base Model and Design Alternatives

In this study, we aimed to examine changes in energy performance between various designs of small rental apartments. The most typical small rental apartment model in Korea was investigated and set as the base model. In addition, various design attempts that have been recently implemented were investigated in terms of their changes to plan shape, layouts between units, the orientation of units, and elevation. Based on this analysis, design alternatives were derived.
The LH (Korea Land & Housing Corporation) Research Report (2012) analyzed the floor plan of an existing LH rental apartment and presented the 2011 LH standard plan. Later, in 2014, LH developed LH’s customized floor plan, which was the design of a floor plan for a rental apartment tailored to consumers, and proposed the plan of 1Bay_Studio for 16 m2, 2Bay_1Bed for 36 m2, and 2Bay_2Bed for 46 m2 [28]. The floor plan of the rental housing (Nowon Energy Zero Housing) in Nowon-gu, Seoul, built in 2018, was developed as 2Bay_2Bed for 39 m2 and 2Bay_3Bed for 49 m2. The floor plan for the unit with an area of 39 m2 remarkably included the types of 1Bay_1Bed, 2Bay_1Bed, and 2Bay_2Bed unit sizes for the design characteristics of small apartments under 50 m2, categorized the shape of the unit plan by measuring the length of the long side, the length of the short side, and the area of the units [29] (see Table 6). In the past, units with an area of 30–40 m2 were typically “1Bay_Studio” or “1Bay_1Bed”, arranged in a row along the corridor. Recently, as various designs of rental apartments have been attempted, a “2Bay-1Bed” plan emerged. A 39 m2 “2Bay_2Bed” type can also be found. Therefore, the target area for the simulation was set to 39 m2, with many changes made to the shape of the plan. The total area of a housing unit is not gross area; it excludes a space used for public common use, an electrical or mechanical drill, and a balcony space.
  • The floor plan of the base model and alternative design: The floor plan of the base model used in the simulation is the “1Bay_1-Bed” type, which is the most common in rental housing, and the area is 39 m2, the short side is 5000 mm, and the long side is set at 9000 mm. An alternative design in the plan “Plan_alt1” is a “2Bay_1-Bed” type that has recently begun to appear at 39 m2, which is the same as the area of the base model. The short side is 6500 mm and the long side is 7000 mm. The area used for the simulation is based on the area of exclusive use and an indoor space (excluding spaces for public use, such as an electrical or mechanical facility space or a balcony space).
  • The layout of the base model and alternative design: Units in Korean rental apartments that were built in the past are mostly arranged in a row along the corridor. In some cases, units that face each other around the corridor can be found. There is also a core-centered layout called “tower type.” The layout of the base model is a typical long and narrow corridor-type with a single row arrangement. The design alternatives for the layout were “Layout_alt1”, which is arranged in two rows facing the corridor, and “Layout_alt2”, which is a tower type.
  • The orientation of the base model and alternative design: In Korea, where there are four seasons, south-facing is the preferred arrangement of units. However, there are many cases where it is difficult to place all units in this way. As the next best thing, southwest- or southeast-facing units are often mixed into the design. In order to examine energy performance according to orientation, the base model was set to south-facing, “orientation_alt1” when combined with southeast, and “orientation_alt2” when combined with southwest.
Most rental apartments in Korea have flat elevation designs. However, in other countries, it is easy to find various elevation designs, even in rental housing [27]. Recently, in Korea, various elevation designs have been attempted to improve the image of rental apartments. Table 7 shows examples of various elevation designs for rental housing. Among them, Sejong City’s LH’s Tomorrow City is a representative example of several units protruding forward or the absence of units in the middle. This not only affects the exterior design but also creates a variety of interior spaces and a flexible space, and this can affect energy performance. The protruding units may act as an awning for other units, or the energy performance may deteriorate due to the increase in the exterior walls in the open space. Therefore, an alternative to the elevation design, “Elevation_alt1”, was set in the form of an empty unit in the middle.

4. Energy Performance for Design Elements

We simulated the energy performance for housing alternatives by changing the shape of units (proportion), layout, and orientation and examined the effects of design options of the alternatives on energy performance.
Some of the design alternatives and diverse house unit compositions have been developed based on a previously conducted case analysis. The targeted housing complex case is situated in Seoul and Kyung-gi province, in the middle of the Korean Peninsula. Design variables affect several building features including ambient features such as daylight penetration, airflow, energy loss or efficiency, and aesthetic appraisal. Among these factors, for public rental housing, energy issues are crucial since most of the residents of public rental housing are in the low income or more socially vulnerable class, and they are more concerned about housing fees, including the cost of energy.

4.1. Characteristics of Energy Consumption of the Base Model

Ten households arranged in a row on the reference floor were analyzed (see Figure 1), and annual heating and cooling load, as well as the characteristics of energy consumption, were analyzed as average values (see Section 2.2, Energy Simulation, for an explanation of simulation conditions, and Section 3, Base Model and Design Alternatives, for an explanation on the simulation targets). Annual heating load and annual cooling load were calculated as heat gain and heat loss for each load generation period. Heat gain was calculated by dividing the lighting used indoors, various types of equipment (including electronic devices), occupants, and solar radiation heat. Heat loss was calculated by splitting it into groups of “exterior walls” for walls facing the outside air, “windows” for windows and doors, “interior walls” for walls not facing the outside air, and “infiltration” for ventilation and infiltration (refer to Appendix A for the thermal transmittance of the building used in the simulation).

4.1.1. Heating and Cooling Load

  • Annual heating load: The biggest factor influencing heat loss was infiltration, followed by windows and exterior walls, and the biggest factor influencing a reduction in the annual heating load was solar radiation (see Table 8).
  • Annual cooling load: The biggest factor influencing heat acquisition was solar radiation, followed by equipment, and the biggest factor influencing heat loss was infiltration (see Table 9).

4.1.2. Annual Energy Consumption and the Costs of Heating and Cooling

For heating, the efficiency value is 100%, so the annual heating load is equal to the annual energy consumption (see Table 2). For cooling, the annual energy consumption for the annual cooling load is calculated using the efficiency, COP3.5. According to electricity and district heating calculation conditions (see Table 2 and Table 3), for heating and cooling, the amount of energy consumption is the amount of heating/cooling load divided by efficiency value. The annual cost of heating is estimated at 62,445 won, and the cost of cooling is 133,517 won. Therefore, the combined annual cost of cooling and heating is 195,962 won (see Table 10).

4.2. Comparison of Base Model and Alternative Design

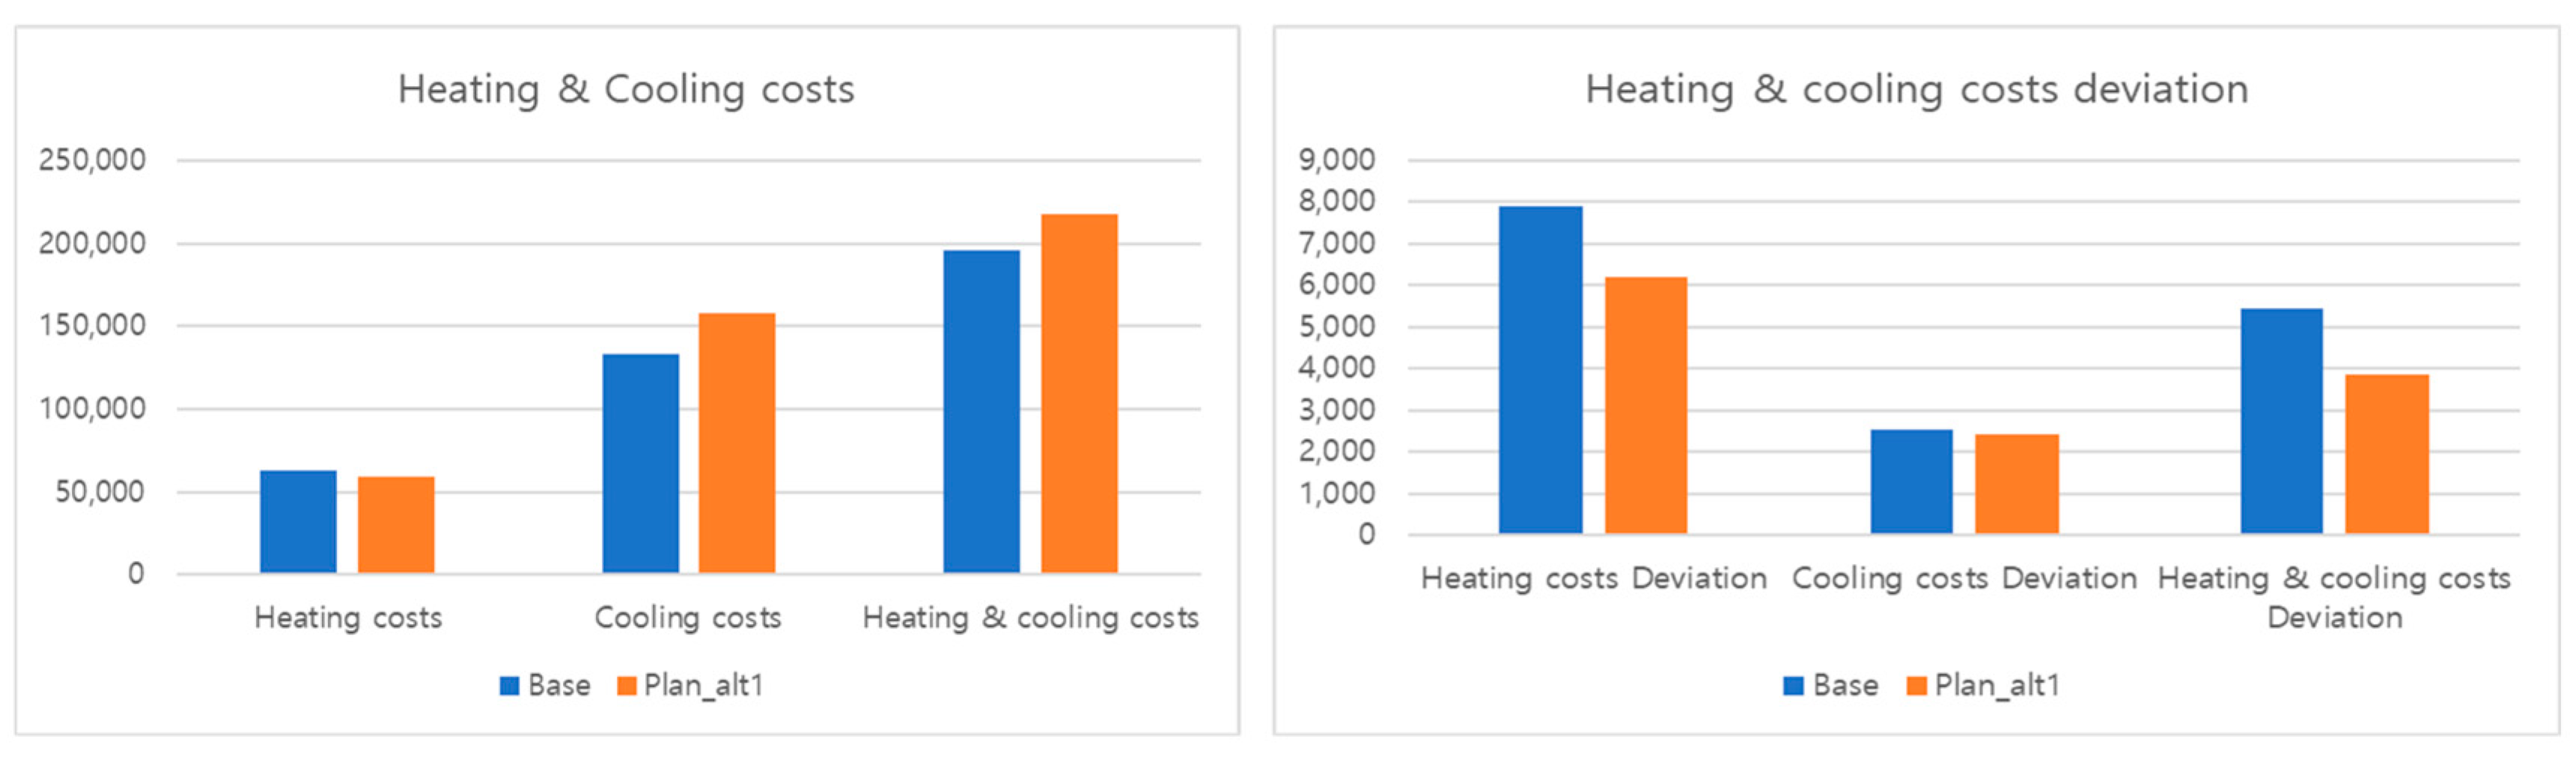
4.2.1. The Alternative Design According to the Shape of the Floor Plan of Units

The width and length of the basic unit is 5000 × 9000 mm, and that of the alternative design unit is 6500 × 7000 mm, which is an increase in the width and a decrease in the length. Compared to the base model, in the alternative model, occupants have more living space as a result of reducing circulation areas (see Table 11).
  • Comparison of heating load
Solar radiation increased according to the change in shape of the horizontal and vertical plan, and heat gain in terms of solar radiation increased. The change in the shape of the floor plan brought about a change in the window area, and there was an increase in heat loss in proportion to the windows. Therefore, the overall heating load was found to be slightly reduced (see Table 12).
  • Comparison of cooling load
Increased solar radiation and increased window area led to an increase in the cooling load (see Table 13).
  • Comparison of annual costs of heating and cooling
Annual heating costs and annual cooling costs are incurred by units that have both many walls facing the outside air and few walls facing the outside air. Therefore, “Mean” (the average value of each unit) was compared, and “Deviation” (the deviation from the average value) was analyzed.
The average annual cost of heating for households decreased by 4.8%, and the annual cost of cooling increased by 18.5%, and the annual combined costs of cooling and heating increased by 11.1%. The deviation in costs of heating between households was −21.2%, and the deviation in costs of cooling was −3.6%, which was less than the costs of heating (see Table 14 and Figure 2).

4.2.2. The Alternative Design According to the Layout of Units

The layout of the basic unit is a linear type, “Layout_alt1” is a parallel type, and “Layout_alt2” is a mixed type (see Table 15).
  • Comparison of heating load
According to the change in layout, heat gain through solar radiation decreased, and heat loss through the interior walls increased. Therefore, it was found that according to the layout, there was a large difference in heating load (see Table 16).
  • Comparison of cooling load
According to the change in layout, there was a noticeable difference between heat gain due to solar radiation and heat loss due to the interior walls, and it was predicted that the cooling load decreased (see Table 17).
  • Comparison of annual costs of heating and cooling
The average annual cost of heating for households increased by 31.9% (layout_alt1) and 21.1% (layout_alt2), and the annual cost of cooling decreased by 16.1% (layout_alt1) and 10.5% (layout_alt2), and the combined annual costs of cooling and heating increased by 0.8% (layout_alt1) and 0.4% (layout_alt2). There was a large deviation in the costs of heating and cooling between households (see Table 18 and Figure 3). This result implies that households in the alternative apartment complex have extremely different costs of energy.

4.2.3. The Alternative Design According to the Orientation

The orientation of “orientation_alt1” is southeast and the orientation of “orientation _alt2” is southwest (see Table 19).
  • Comparison of heating load
The change in heating load was not large considering the change in the southeast or southwest orientation (see Table 20).
  • Comparison of cooling load
The change in cooling load was not large considering the change in the southeast or southwest orientation (see Table 21).
  • Comparison of annual costs of heating and cooling
The change in annual costs of heating and cooling was not large considering the change in the southeast or southwest orientation.
There is a significant increase in the deviations of heating and cooling; however, the total deviation of energy consumption in terms of heating and cooling is similar to that of the base model (see Table 22 and Figure 4).

4.2.4. The Alternative Design According to the Elevation Design

Since there is a difference in the number of units, the average values of units for the 2nd to the 14th floor, excluding the top and bottom floors, were compared (see Table 23).
  • Comparison of heating load
The amount of heat gained during the heating period was the same; however, there was an increase in the heat loss as a result of the changes made to the exterior wall (71.8%), and the heating load increased by 41.5% (see Table 24).
  • Comparison of cooling load
The amount of heat gained during the cooling period was the same; however, the cooling load decreased by 5.5% due to an increase in heat loss through the exterior wall (78.3%) (see Table 25).
  • Comparison of annual costs of heating and cooling
With the change in the elevation design, the deviation in heating load between households increased, and the cost of heating was also 48,486–102,538 won, which increased by household. Further, the deviation in cooling load between households increased, and the average cost of cooling decreased by 5.5% (see Table 26).
The average costs of heating for all households increased by 41.6%; however, the costs of cooling decreased by 5.5%. As a result, the combined annual costs of heating and cooling increased by 6.8%. There was no significant difference between the south and southeast orientation (see Table 27 and Figure 5).
  • Comparing the annual heating and cooling costs of the base model and all design alternatives
Figure 6 is a graph comparing the annual heating and cooling costs of the base model and design alternatives. The difference between the base model and the design alternatives was examined by separating annual heating costs and annual cooling cost. The difference between the base model and the design alternatives was examined by separating annual heating costs and annual cooling costs. However, when we examined using annual heating and cooling costs combined, the difference from the base model decreased.

5. Conclusions

The findings indicate that the shape of a building is an important design factor in the process of optimizing energy efficiency in residential building complexes while simultaneously fulfilling the function of residential living without compromising on heating and cooling mechanisms.
This study presented feasible design alternatives and effects of design factors on heating and cooling energy loads as a whole. A housing unit which is suitable for 1–2 residents in a public rental apartment was developed and generalized in response to demographic changes for affordable options. Using the base model option, energy costs were estimated and compared with design alternatives considering both heating and cooling loads. The alternative housing unit, more square-shaped compared to the long rectangular type, resulted in a higher cost of energy. The change in the shape of the floor plan brought about a change in the window area, and the overall heating load was found to be slightly reduced; however, there was a further increase in the cooling load, resulting in an 11% increase in the total cost of energy. Furthermore, the housing complex consists of more square-shaped house units, resulting in a longer, narrower shape of the housing complex as a whole; thus, each house provides better living conditions. However, the appearance of the alternative residential building may have been similarly monotonous and more linear. Simulation results show that as the solar radiation load increases or the window area increases due to alteration of the plan, there is a simultaneous significant increase in the cooling load while the heating load decreases. It is necessary to consider the size of the window, the shielding coefficient of the window, and the shade design according to alteration of the plan ratio to improve energy savings as a whole.
The performance of the alteration of the layout suggested in this study greatly increased the heating load by between 21.1% and 31.9%, while the cooling decreased by between 10.5% and 12.9%. However, the changes in the alternative layout fail to significantly reduce the cost of energy since the climatic condition in Korea is characterized by extreme temperature differences between summer and winter seasons and higher energy cost rates for cooling. The three models incorporating orientation changes indicated a similar range in terms of the total cost of energy for a whole building. However, in the alternative layout model, the deviation values of the alternatives are much higher than those related to the base option; the households may have extremely different costs of energy depending on the location of the house unit in the residential building complex. There is a dilemma in this context when people have more design alternatives; heating and energy loads are simultaneously affected, and the cost of energy of each house also fluctuates. This result indicates that the orientation and shape of buildings—for example, layout alteration—can dramatically reduce heating costs, which is consistent with previous findings. In Korea, due to its climate, people need both heating and cooling. Thus, the energy performance or energy cost needs to be considered from both a heating and cooling perspective. Seeking design alternatives requires more than simply considering orientation and building shape. From the perspective of residents, it is important to estimate energy consumption in an integrative way that includes heating and cooling. By seeking optimal energy solutions in alternative designs, this study differentiates itself by experimenting with multiple unit formations and altering the layout of housing units relative to the simulation conducted by Lee et al. [10]. Few existing studies have evaluated the energy efficiency of residential buildings starting from a housing unit and alternate collective formations. We concluded that the change in layout proposed in this study did not apparently reduce the cost of energy, and people strongly prefer a south orientation due to climatic and cultural contexts.
To observe the change in energy performance along with the change in the elevation of the façade, we compared the energy performance between the voided and flat form of the façade/balcony. The energy performance of the voided form greatly increased the cost of heating and slightly reduced the cost of cooling. It is extremely necessary to reinforce the insulation of exposed side walls. From the findings that introducing design alternatives did not significantly reduce or increase the cost of energy, it is difficult to use design alternatives as an incentive option for saving costs; however, this also implies that the various design options do not increase cost burdens. By incorporating the building façade design, window design, shielding, and other envelope features of a building, the alternative models improve energy efficiency. Considering changing demographic characteristics and climatic conditions, housing design alternatives can provide more options for residents without causing energy burdens.
Future studies need to consider the changes in climatic conditions in terms of global warming. Increased temperature requires higher cooling loads and residential sectors may require different options. To be able to balance heating and cooling loads, more elaborate design features and other sustainable options are needed. Besides plan alterations (ratio of housing unit), orientation, layout, and elevation changes, the simulation includes other factors such as an increase in the cooling period according to changes in climate and the simultaneous effects of a combination of various design factors in an effort to achieve the optimal energy efficiency model. The energy deviation factor for public rental houses also needs to be investigated since each household can be sensitive when it comes to the energy condition and comfortable living.
Recent developments in technology have greatly improved the energy performance of materials and products, and the costs of energy for heating and cooling are also changing. Therefore, it is necessary to study the design factors in terms of energy performance in a timely manner. The results of this study are helpful in providing sustainable design solutions by balancing more diverse needs of households and the cost of energy as well as in providing more comfortable housing units. The alternative sustainable design options could be balanced by integrating housing design elements and diverse residents’ housing needs as well as by considering aesthetic and economic concerns regarding public rental housing. Specifically, future designers and researchers can benefit from the assessment of energy efficiency of both heating and cooling loads for alternative south-facing building configurations.

Author Contributions

Conceptualization, S.-Y.L.; methodology, S.-Y.L. and M.-W.O.; validation, S.-Y.L. and M.-W.O. and.; formal analysis, S.-Y.L. and M.-W.O.; investigation, M.-W.O.; writing—original draft preparation, S.-Y.L. and M.-W.O.; writing—review and editing, S.-Y.L. and M.-W.O.; visualization, M.-W.O.; funding acquisition, S.-Y.L. All authors have read and agreed to the published version of the manuscript.

Funding

This work was supported by the National Research Foundation of Korea (NRF) grant funded by the Korean government (MSIP) (NRF-2016R1A2B4014631), Korea.

Acknowledgments

The authors appreciate the support of Sang-Hyun Park for the simulation.

Conflicts of Interest

The authors declare no conflict of interest.

Appendix A

The thermal transmittance of the building used in the simulation is presented in Table A1 below.
Table A1. The thermal transmittance (U-value) of the building used in the simulation.
Part of BuildingU-Value
(W/m3 K)
Exterior wall of living roomDirectly facing outside air 0.201 or less
Indirectly facing outside air0.260 or less
Ceiling or roof of the living room on the top floorDirectly facing outside air0.150 or less
Indirectly facing outside air0.220 or less
Floor in living room on the bottom floorDirectly facing outside air0.180 or less
Indirectly facing outside air0.260 or less
Floors between levels of the property0.810 or less
Window and doorDirectly facing outside air1.200 or less
Indirectly facing outside air1.600 or less
Front door of the householdDirectly facing outside air1.400 or less
Indirectly facing outside air1.800 or less

References

  1. IEA. Tracking Buildings. 2020. Available online: https://www.iea.org/reports/tracking-buildings-2020 (accessed on 20 August 2020).
  2. Gang, N.; Kang, S.; Kang, E.; Choi, J. A study on the characteristics of energy consumption and development in linear regression model in residential building—Focused on the data of 2018. J. Archit. Inst. Korea 2020, 46, 115–122. [Google Scholar]
  3. Yeganeh, A.; McCoy, A.; Hankey, S. Green Affordable Housing: Cost-Benefit Analysis for Zoning Incentives. Sustainability 2019, 11, 6269. [Google Scholar] [CrossRef] [Green Version]
  4. Zhao, D.; McCoy, A.P.; Agee, P.; Mo, Y.; Reichard, G.; Paige, F. Time effects of green buildings on energy use for low-income households: A longitudinal study in the United States. Sustain. Cities Soc. 2018, 40, 559–568. [Google Scholar] [CrossRef]
  5. Al-Saggaf, A.; Taha, M.; Hegazy, T.; Ahmed, H. Towards Sustainable Building Design: The Impact of Architectural Design Features on Cooling Energy Consumption and Cost in Saudi Arabia. Procedia Manuf. 2020, 44, 140–147. [Google Scholar] [CrossRef]
  6. Morrissey, J.; Moore, T.; Horne, R.E. Affordable passive solar design in a temperate climate: An experiment in residential building orientation. Renew. Energy 2011, 36, 568–577. [Google Scholar] [CrossRef]
  7. Pacheco, R.; Ordóñez, J.; Martínez, G. Energy efficient design of building: A review. Renew. Sustain. Energy Rev. 2012, 16, 3559–3573. [Google Scholar] [CrossRef]
  8. Aksoy, U.; Inalli, M. Impacts of some building passive design parameters on heating demand for a cold region. Build. Environ. 2006, 41, 1742–1754. [Google Scholar] [CrossRef]
  9. Halawa, E.; Ghaffarianhoseini, A.; Ghaffarianhoseini, A.; Trombley, J.; Hassan, N.; Baig, M.; Yusoff, S.; IIsmail, M. A review on energy conscious designs of building façades in hot and humid climates: Lessons for (and from) Kuala Lumpur and Darwin. Renew. Sustain. Energy Rev. 2018, 82, 2147–2161. [Google Scholar] [CrossRef]
  10. Lee, K.; Seo, J.; Choo, S. A study on analysis of architectural design elements for energy saving based on BIM—Focused on energy performance analysis of tower type buildings using Revit. J. Reg. Assoc. Archit. Inst. Korea 2018, 20, 59–66. [Google Scholar]
  11. Ju, S.; Oh, J. Design elements in apartments for adapting to climate: A comparison between Korea and Singapore. Sustainability 2020, 12, 3244. [Google Scholar] [CrossRef] [Green Version]
  12. Abanda, F.H.; Byers, L. An investigation of the impact of building orientation on energy consumption in a domestic building using emerging BIM (Building Information Modelling). Energy 2016, 97, 517–527. [Google Scholar] [CrossRef]
  13. Wong, K.D.; Fan, Q. Building information modelling (BIM) for sustainable building design. Facilities 2013, 31, 138–157. [Google Scholar] [CrossRef]
  14. Catalina, T.; Virgone, J.; Iordache, V. Study on the impact of the building form on energy. In Proceedings of the Building Simulation: 12th Conference of International Building Performance Simulation Association, Sydney, Australia, 14–16 November 2011; pp. 1726–1729. [Google Scholar]
  15. Mirrahimi, S.; Mohamed, M.F.; Haw, L.C.; Ibrahim, N.L.N.; Yusoff, W.F.M.; Aflaki, A. The effect of building envelope on the thermal comfort and energy saving for high-rise buildings in hot–humid climate. Renew. Sustain. Energy Rev. 2016, 53, 1508–1519. [Google Scholar] [CrossRef]
  16. Thalfeldt, M.; Pikas, E.; Kurnitski, J.; Voll, H. Facade design principles for nearly zero energy buildings in a cold climate. Energy Build. 2013, 67, 309–321. [Google Scholar] [CrossRef]
  17. Wu, M.; Ng, T.; Skitmore, M. Sustainable building envelope design by considering energy cost and occupant satisfaction. Energy Sustain. Dev. 2016, 31, 118–129. [Google Scholar] [CrossRef] [Green Version]
  18. Cheng, L.; Baeb, Y.; Horton, T. A system-level approach for designing multi-family sustainable and energy efficient housing communities. Sustain. Cities Soc. 2019, 44, 183–194. [Google Scholar] [CrossRef]
  19. Takano, A.; Kumar, S.; Kuittinena, M.; Alanne, K. Life cycle energy balance of residential buildings: A case study on hypothetical building models in Finland. Energy Build. 2015, 105, 154–164. [Google Scholar] [CrossRef]
  20. Kahn, M.E.; Kok, N. The capitalization of green labels in the California housing market. Reg. Sci. Urban Econ. 2014, 47, 25–34. [Google Scholar] [CrossRef]
  21. Zacà, I.; D’Agostino, D.; Congedo, P.; Baglivo, C. Assessment of cost-optimality and technical solutions in high performance multi-residential buildings in the Mediterranean area. Energy Build. 2015, 102, 250–265. [Google Scholar] [CrossRef]
  22. European Commission. Progress towards Nearly Zero-Energy Buildings Uptake. Available online: https://ec.europa.eu/energy/topics/energy-efficiency/energy-efficient-buildings/nearly-zero-energy-buildings_en (accessed on 17 August 2020).
  23. Ahn, T.A. Study on the calculation of minimum required air change per hour for apartment house—Based on the cities of S and C-. J. Archit. Inst. Korea Plan. Des. 2005, 21, 297–304. [Google Scholar]
  24. Statistics Korea. Population and Housing Census. Available online: https://www.census.go.kr/mainView.do (accessed on 17 August 2020).
  25. Lee, S.; Oh, M.; Kang, H. Design analysis of affordable housing cases for varieties of public rental housing. Korean Inst. Inter. Des. 2017, 26, 126–134. [Google Scholar]
  26. Kwon, K. A study on the energy performance evaluation of building evaporative cooling system for building construction in response to climate change. J. Converg. Inf. Technol. 2019, 9, 54–60. [Google Scholar]
  27. Lee, S.; Oh, M. The incentives of public and design quality movements for diversity of social housing. SH Urban Res. Insight 2017, 7, 39–57. [Google Scholar] [CrossRef]
  28. Press Release of Ministry of Land, Infrastructure and Transport (Korea) 01.28, 2014. Available online: http://www.molit.go.kr/USR/NEWS/m_71/dtl.jsp?lcmspage=3&id=95073532 (accessed on 24 September 2020).
  29. Paik, H.; Choi, S.; Choi, D.; Joo, J. Planning Design Guidelines for LH Unit Plan; Korea Land & Housing Corporation: Seoul, Korea, 2012; pp. 62–64. [Google Scholar]
Publisher’s Note: MDPI stays neutral with regard to jurisdictional claims in published maps and institutional affiliations.
Figure 1. Modeling of base model.
Sustainability 12 08456 g001
Figure 2. Costs of heating and cooling of plan_alt1.
Sustainability 12 08456 g002
Figure 3. Costs of heating and cooling of layout_alt1 and layout_alt2.
Sustainability 12 08456 g003
Figure 4. Costs of heating and cooling of orientation_alt1 and orientation_alt2.
Sustainability 12 08456 g004
Figure 5. Costs of heating and cooling of elevation_alt1.
Sustainability 12 08456 g005
Figure 6. Costs of heating and cooling of design alternatives.
Sustainability 12 08456 g006
Table 1. Internal heat source condition and schedule.
DensityScheduleRemark
Lighting6.45 W/m2ASHRAE 90.1ASHRAE 90.1
Use of equipment10.97 W/m2ASHRAE 90.1Excluding the energy consumption of lighting *
Persons2 persons/householdASHRAE 90.1Sensible heat 73.27 W/person,
Latent heat 58.61 W/person
* Electricity consumption for 2 persons/household is 212.3 kWh/month (according to statistics from the 2015 edition of the Organization for Economic Cooperation and International Energy), while monthly electricity consumption per person is 106.2 kWh/month. Here, lighting power and energy consumption are excluded.
Table 2. Heating and cooling system.
SystemEfficiencySet TemperatureOperating Time
CoolingAir conditionerCOP 3.5026.024 h
HeatingDistrict heating100%21.724 h
Table 3. Electricity and district heating calculation conditions.
Heat SourceUnit PriceRemark
CoolingElectricity0–200 (kWh)187.9 (Won/kWh)Besides the 212.3 kWh consumption per household, it was assumed that there was additional consumption from air conditioning.
more than 200 (kWh)280.6 (Won/kWh)
HeatingHot water64.35 (won/Mcal)
55.33 (won/kWh)
Korea District Heating Corporation heat rate table (1 November 2017 part)
Table 4. The cost of heating of a 39 m2 household in Seoul area.
Built YearArea (m2)Heat SourceAnnual Heating Cost (won/year)
1200938.7district heating217,368
2199238.6district heating131,340
3199440.0district heating257,208
4199439.6district heating177,108
5199539.6district heating192,660
6199239.6district heating185,328
7199140.0district heating229,644
8199839.7district heating242,928
9199039.9district heating99,684
10198738.0district heating145,584
Mean 187,885
Sources: Apartment housing management information system is operated by the Ministry of Land, Infrastructure, and Transport together with the Korea Appraisal Board (http://www.k-apt.go.kr/).
Table 5. The cost of heating of a 39 m2 household in Seoul area.
Annual Heating CostDifference
Survey value187,885 won/yr
Simulation model value194,316 won/yr3.4%
Table 6. Small floor plans of less than 50 m2.
Object
(year)
TypeFloor PlanCharacteristics of Shape
2011 LH standard plan
(2011)
1Bay_1-Bed Sustainability 12 08456 i001Area (m2)39
Short side (mm)5000
Long side (mm)9000
LH’s customized floor plan
(2014)
2Bay_1-Bed Sustainability 12 08456 i002Area (m2)36
Short side (mm)6100
Long side (mm)6700
Nowon Energy Zero Housing
(2018)
2Bay_2-Bed Sustainability 12 08456 i003Area (m2)39
Short side (mm)6500
Long side (mm)7500
Table 7. Various designs of the elevation of rental housing.
Sustainability 12 08456 i004 Sustainability 12 08456 i005 Sustainability 12 08456 i006
VIA-VERDE (New York, NY, USA)HONEYCOMB (Livade, Slovenia)Codan block 1 (Tokyo, Japan)
Sustainability 12 08456 i007 Sustainability 12 08456 i008 Sustainability 12 08456 i009
Tomorrow City (Sejong, Korea)Tomorrow City (Sejong, Korea)EZ house (Seoul, Korea)
Table 8. Heating load of base model.
Heat GainHeat LossEtc.Annual Heating Load
LightingEquipmentPersonsSolar RadiationTotalExterior WallsWindowsInterior WallsInfiltrationTotal
Base model
(kWh)
36.16123058212099−578−696−499−1620−33931651129
Ratio
(%)
17.229.214.539.1100.017.020.514.747.8100.0
Etc. is a value that corrects errors caused by heat storage.
Table 9. Cooling load of base model.
Heat Gain (kWh)Heat Loss (kWh)Etc.Annual Cooling Load
LightingEquipmentPersonsSolar RadiationTotalExterior WallsWindowsInterior WallsInfiltrationTotal
Base model
(kWh)
51186777715743728−219−321−174−648−1362−52361
Ratio
(%)
13.723.320.842.2100.016.023.612.847.6100.0-
Etc. is a value that corrects errors caused by heat storage.
Table 10. Annual costs of heating and cooling of base model.
Heating CostCooling CostTotal
Annual Heating Load
(kWh)
Efficiency
(%)
Energy Consumption
(kWh)
Annual Heating Cost
(won)
Annual
Cooling Load
(kWh)
Efficiency
(COP)
Energy Consumption
(kWh)
Annual Cooling Cost
(won)
(won)
1129100112962,44523613.5674.5133,517195,962
Table 11. Floor plan of base model and alternative design.
TypeShape of the PlanShape of the Elevation
Base Sustainability 12 08456 i010 Sustainability 12 08456 i011
Plan_alt1 Sustainability 12 08456 i012 Sustainability 12 08456 i013
Table 12. Heating load of plan_alt1.
Heat GainHeat LossEtc. Annual
Heating Load
LightingEquipmentPersonsSolar RadiationTotalExterior WallsWindowsInterior WallsInfiltrationTotal
Base
(kWh)
3616123058212099−578−696−499−1620−33931651129
Plan_alt1
(kWh)
36161230511032380−544−942−467−1638−35911371074
Rate of change (%)0.00.00.034.313.4−5.835.4−6.41.15.8 −4.8
Etc. is a value that corrects errors caused by heat storage.
Table 13. Cooling load of plan_alt1.
Heat Gain (kWh)Heat Loss (kWh)Etc.Annual
Cooling Load
LightingEquipmentPersonsSolar RadiationTotalExterior WallsWindowsInterior WallsInfiltrationTotal
Base
(kWh)
51186777715743728−219−321−174−648−1362−52361
Plan_alt1
(kWh)
51186777720904245−207−434−157−653−145142798
Rate of change (%)0.00.00.032.813.9−5.335.1−9.50.66.5 18.5
Table 14. Costs of heating and cooling of plan_alt1.
Heating CostsCooling CostsHeating and Cooling Costs
Min.Max.MeanDeviationMin.Max.MeanDeviationMin.Max.MeanDeviation
Base
(won)
54,53972,08962,4457891129,919135,940133,5172522190,479202,008195,9635433
Plan_alt1
(won)
53,23367,33759,4386219154,532160,486158,1962431213,707221,983217,6343862
Rate of change (%)−2.4−6.6−4.8−21.218.918.118.5−3.612.29.911.1−28.9
Table 15. Layouts of base model and alternative design.
TypeShape of the PlanShape of the Elevation
Base Sustainability 12 08456 i014 Sustainability 12 08456 i015
Layout_alt1 Sustainability 12 08456 i016 Sustainability 12 08456 i017
Layout_alt2 Sustainability 12 08456 i018 Sustainability 12 08456 i019
Table 16. Heating load of layout_alt1 and layout_alt2.
Heat GainHeat LossEtc.Annual
Heating Load
LightingEquipmentPersonsSolar RadiationTotalExterior WallsWindowsInterior WallsInfiltrationTotal
Base (kWh)3616123058212099−578−696−499−1620−33931651129
Layout
_alt1
Value
(kWh)
3616123055211798−294−620−1216−1597−37274401489
Rate of change
(%)
0.00.00.0−36.6−14.3−49.0−10.9143.5−1.49.9 31.9
Layout
_alt2
Value
(kWh)
3616123056761954−242−622−1296−1607−37674461367
Rate of change
(%)
0.00.00.0−17.6−6.9−58.1−10.6159.6−0.811.0 21.1
Table 17. Cooling load of layout_alt1 and layout_alt2.
Heat GainHeat LossEtc.Annual
Cooling Load
LightingEquipmentPersonsSolar RadiationTotalExterior WallsWindowsInterior WallsInfiltrationTotal
Base (kWh)51186777715743728−219−321−174−648−1362−52361
Layout
_alt1
Value
(kWh)
51186777713553509−106−283−444−629−1462112058
Rate of change
(%)
000−13.9−5.9−51.5−12.0155.4−3.07.3 −12.9
Layout
_alt2
Value
(kWh)
51186777714113566−87−284−452−636−145972114
Rate of change
(%)
000−10.3−4.4−60.1−11.7159.9−1.97.1 −10.5
Table 18. Costs of heating and cooling of layout_alt1 and layout_alt2.
Heating CostsCooling CostsHeating and Cooling Costs
Min.Max.MeanDeviationMin.Max.MeanDeviationMin.Max.MeanDeviation
Base (won)54,53972,08962,4457891129,919135,940133,5172522190,479202,008195,9635433
Layout
_alt1
Value
(won)
74,81290,18282,3886685100,991124,490112,00310,787188,805199,302194,3914255
Rate of change
(%)
37.225.131.9−15.3−22.3−8.4−16.1327.8−0.9−1.3−0.8−21.7
Layout
_alt2
Value
(won)
61,018116,83575,60919,046103,711131,146119,5429883181,820220,744195,15112,402
Rate of change
(%)
11.962.121.1141.4−20.2−3.5−10.5291.9−4.59.3−0.4128.3
Table 19. Direction of base model and alternative design.
TypeShape of the PlanShape of the Elevation
Base Sustainability 12 08456 i020 Sustainability 12 08456 i021
Orientation_alt1 Sustainability 12 08456 i022 Sustainability 12 08456 i023
Orientation_alt2 Sustainability 12 08456 i024 Sustainability 12 08456 i025
Table 20. Heating load of direction_alt1 and direction_alt2.
Heat GainHeat LossEtc.Annual
Heating Load
LightingEquipmentPersonsSolar RadiationTotalExterior WallsWindowsInterior WallsInfiltrationTotal
Base (kWh)3616123058212099−578−696−499−1620−33931651129
Orientation _alt1Value
(kWh)
3616123057782055−544−694−661−1615−35142641195
Rate of change
(%)
0.00.00.0−5.3−2.1−5.8−0.332.4−0.33.6 5.9
Orientation _alt2Value
(kWh)
3616123057612039−544−693−658−1614−35092621208
Rate of change
(%)
0.00.00.0−7.3−2.9−5.9−0.431.9−0.43.4 7.0
Table 21. Cooling load of direction_alt1 and direction_alt2.
Heat GainHeat LossEtc.Annual
Cooling Load
LightingEquipmentPersonsSolar RadiationTotalExterior WallsWindowsInterior WallsInfiltrationTotal
Base (kWh)51186777715743728−219−321−174−648−1362−52361
Orientation
_alt1
Value
(kWh)
51186777715883742−204−319−272−643−1439−32300
Rate of change
(%)
0000.90.4−6.5−0.656.6−0.85.7 −2.6
Orientation
_alt2
Value
(kWh)
51186777715573712−204−319−271−643−1436−22274
Rate of change
(%)
000−1.0−0.4−6.8−0.855.7−0.95.4 −3.7
Table 22. Costs of heating and cooling of direction_alt1 and direction_alt2.
Heating CostsCooling CostsHeating and Cooling Costs
Min.Max.MeanDeviationMin.Max.MeanDeviationMin.Max.MeanDeviation
Base (won)54,53972,08962,4457891129,919135,940133,5172522190,479202,008195,9635433
Orientation
_alt1
Value
(won)
54,61682,08266,12210,391113,063137,597130,0279161189,880206,580196,1495068
Rate of change
(%)
0.113.95.931.7−13.01.2−2.6263.3−0.32.30.1−6.7
Orientation
_alt2
Value
(won)
54,59487,09566,83310,858112,616135,799128,5919043189,777205,033195,4245355
Rate of change
(%)
0.120.87.037.6−13.3−0.1−3.7258.6−0.41.5−0.3−1.4
Table 23. Layouts of base model and alternative design.
TypeShape of the Elevation
Base
(364 units)
Sustainability 12 08456 i026 Sustainability 12 08456 i027
Elevation_alt1
(260 units)
Sustainability 12 08456 i028 Sustainability 12 08456 i029
Table 24. Heating load of elevation_alt1.
Heat GainHeat LossEtc.Annual
Heating Load
LightingEquipmentPersonsSolar RadiationTotalExterior WallsWindowsInterior WallsInfiltrationTotal
Base (kWh)3616123058212099−505−703−135−1634−2977−14892
Elevation
_alt1
Value
(kWh)
3616123058212099−867−694−172−1619−3352−91262
Rate of change
(%)
0.00.00.00.00.071.8−1.327.3−0.912.6-41.5
Table 25. Cooling load of elevation_alt1.
Heat GainHeat LossEtc.Annual
Cooling Load
LightingEquipmentPersonsSolar RadiationTotalExterior WallsWindowsInterior WallsInfiltrationTotal
Base (kWh)51186777715743728−193−327−74−660−1254−92465
Elevation _alt1Value
(kWh)
51186777715743728−345−320−86−646−1397−32328
Rate of change
(%)
0.00.00.00.00.078.3−2.016.5−2.111.4-−5.5
Table 26. Deviation of costs of heating and cooling of elevation_alt1.
Heating CostsCooling Costs
Min.Max.MeanDeviationMin.Max.MeanDeviation
Base (won)47,65665,92049,2944068133,639140,091139,3871337
Elevation _alt1Value
(won)
48,486102,53869,80716,395120,747139,480131,6515661
Rate of change
(%)
1.755.541.5303.0−9.6−0.4−5.5323.4
Table 27. Annual costs of heating and cooling of elevation_alt1.
Heating CostsCooling CostsHeating and Cooling Costs
Base (won)49,294139,387188,681
Elevation _alt1Value
(won)
69,807131,651201,458
Rate of change (%)41.6−5.56.8

