Article

Provincial Carbon Emission Quota Allocation Study in China from the Perspective of Abatement Cost and Regional Cooperation

1
School of Economics and Management, North China Electric Power University, Beijing 102206, China
2
Beijing Key Laboratory of Renewable Electric Power and Low Carbon Development, North China Electric Power University, Beijing 102206, China
3
Research Center for Beijing Energy Development, Beijing 102206, China
4
College of Environmental Science and Engineering, North China Electric Power University, Beijing 102206, China
*
Author to whom correspondence should be addressed.
Sustainability 2020, 12(20), 8457; https://doi.org/10.3390/su12208457
Submission received: 14 September 2020 / Revised: 10 October 2020 / Accepted: 12 October 2020 / Published: 14 October 2020
(This article belongs to the Section Air, Climate Change and Sustainability)

Abstract

:
To achieve the carbon reduction target, the Chinese government not only requires a quota allocation scheme in line with the current development situation, but also needs to minimize the economic expenditure in the emission reduction work. Therefore, this study integrates the multi-index method and zero-sum gains–data envelopment analysis model to obtain a fair and efficient multi-criteria quota allocation scheme. To ensure the effectiveness of the scheme, the fairness and cost effect of the scheme are quantitatively tested. In addition, regional cooperation factors are introduced into the research framework to providing feasible practical measures. The results show that: (1) After optimization, the eastern region has the largest quota increment, accounting for 45% of the country’s quota. (2) The multi-criteria quota allocation scheme after secondary allocation is a more ideal scheme. The quota scheme not only meets the requirements of fairness and efficiency, but also has lower abatement costs. (3) Regional cooperation should be encouraged by China, especially the eastern region, which can alleviate the reducing emission pressure through cooperation. Although the western region needs to undertake additional emission reduction tasks, it can improve the utilization rate of local renewable resources and be conducive to long-term economic development. These results will provide a reference for China to achieve its carbon reduction targets.

1. Introduction

With the continuous rise of the global temperature, the earth’s ecological environment has been seriously damaged. The Fifth Assessment Report of the Inter-governmental Panel on Climate Change (IPCC) concludes that the impact of global warming on the environment has become increasingly prominent, and the influence of human beings on the global climate is also more and more obvious [1]. Related study shows that large amounts of greenhouse gas emissions in future years will cause a further increase in global temperature of about 6.4–9.5 °C [2]. The deterioration of the environment has aroused a high degree of vigilance all over the world, and the key to improving the climate problem lies in the control of carbon emissions.
China, as one of the world’s largest industrial countries and carbon emitters, whether it attaches importance to carbon emission reduction or not, will have an unparalleled impact on the global climate and environment. As one of the countries actively responding to the call for carbon emission reduction, China explicitly promised in the 2015 Paris climate conference to reduce its carbon intensity by at least 60% from 2005 levels by 2030 [3]. In order to accomplish the carbon-cutting target, China has introduced a number of policies to promote emission reduction. China’s pilot carbon trading policy is a typical case, and the practice results show that the introduction of a carbon trading market will effectively promote energy conservation and pollution reduction in the electricity market [4]. Meanwhile, allocation and criticism on the historic allocation of CO2 permits in European Union, which abandoned this method in favor of a new way of allocation, i.e., auctions [5,6]. A reasonable carbon quota allocation scheme is the basic condition for the implementation of various emission reduction policies. However, China’s current quota allocation system often only considers historical carbon emissions, and there are great differences among provinces in social, economic, and environmental dimensions, which lead to allocation results that can’t meet the expected goals. To find a reasonable quota allocation method has become the top priority in China.
At present, fairness and efficiency are the mainstream standards of quota allocation [7]. The principle of fairness means that everyone should be entitled to equal carbon quotas, and fairness is the first condition for quota schemes to be acceptable to different audience groups [8]. Similarly, what the efficiency principle pursues is to achieve emission reduction targets with minimal resource consumption, which is also the key point of allocation [9]. Thus, the data Envelopment Analysis (DEA) model, which can directly reflect the efficiency, is widely used in the study of quota allocation [10,11]. Considering the complexity of reality, the quota allocation method based on a single principle has been unable to meet all the allocation requirements.
To address this problem, some scholars have proposed a multi-criteria allocation method which combines multiple allocation principles. Qin et al. (2017) proposed a multi-criteria decision analysis model considering both efficiency and fairness principles to formulate a regional quota allocation scheme [12]. Mu et al. (2016) allocated quotas of industrial sectors in Liaoning Province from the perspectives of fairness and efficiency [13]. Zhu et al. (2018) combine the three principles of fairness, efficiency, and feasibility, and adopted the China CO2 allowance allocation method to allocate inter-industry carbon quotas [14]. In short, the multi-criteria decision-making method has gradually become one of the important methods in the field of distribution.
There have been many studies on quota allocation methods in the past, but there are few articles to evaluate the designed quota scheme. In a sense, the achievement of carbon reduction targets often means a reduction in economic output [15]. The carbon quota scheme needed by policy makers can not only meet the allocation requirements of many aspects, but also take into account the economic cost of realizing the scheme. Delarue et al. (2010) proposed that the marginal abatement cost is an indicator that can directly reflect the emission reduction potential of different economies, which can be applied to analyze the cost effect of distribution schemes [16]. The indicator can be defined as the cost of each additional unit of carbon dioxide reduction [17]. In related research, Tang et al. (2016) constructed a parameterized function to measure the marginal abatement cost of carbon dioxide. Parameterization methods often need to make assumptions about the distribution of data, which leads to some errors in the results [18]. Therefore, some scholars have proposed to use the directional distance function analysis model [19,20] and the alternative slacks-based DEA model [21,22] in the non-parametric method to calculate the marginal abatement cost of carbon dioxide of each observation object.
As the total amount of quotas in the country is certain, it is inevitable that there will be conflicts of interest between places in quota allocation, which will hinder the completion of emission reduction targets [23]. Balancing the interest conflict in quota allocation has become an urgent problem for the Chinese government. For this reason, China proposed to apply the idea of regional cooperation to emission reduction in the 13th five-year Plan. Considering the uneven distribution of resources and the differences of current development status, we find that the emission reduction resources of various provinces in China are complementary to each other [24], which provides great potential for regional cooperation in emission reduction. Therefore, we think that regional cooperation will have a vital impact on quota allocation and the completion of emission reduction tasks, and regional cooperation will become a valuable choice in determining quota allocation.
To sum up, quota allocation not only needs scientific allocation methods, but also needs to focus on the economic cost of realizing the scheme. In the choice of quota allocation method, although the auction system is a relatively advanced quota allocation method [5,6], this paper focuses on the quota allocation of Chinese provinces from a national macro point of view. Therefore, this paper will study quota allocation from the perspective of fairness and efficiency of national distribution as a whole. Most of the previous studies have innovated on allocation methods, but few people have considered the evaluation of quota schemes, and unevaluated schemes often have their own limitations. To this end, this paper applies the idea of multi-criteria decision-making to propose an allocation method that takes into account the requirements of fairness and efficiency, as well as an evaluation method considering fairness and cost effect, in order to work out a truly scientific and effective carbon quota allocation scheme. In addition, we also recognize the importance of regional cooperation, study the role of regional cooperation in quota allocation, and put forward scientific suggestions and measures, so as to make up for the current research gap.
This paper has the following several key contributions. Firstly, we combine the multi-index method with the optimization idea of zero-sum gains–data envelopment analysis model (ZSG–DEA) to quota allocation, that is, to maximize efficiency on the basis of meeting the requirements of the fairness principle, so as to develop a multi-objective quota allocation scheme that meets the requirements of fairness and efficiency. Secondly, taking Gini coefficient, marginal abatement cost, and total abatement cost as evaluation indicators, this paper evaluates the quota scheme from the aspects of fairness and cost effect, which makes the distribution result more convincing. Finally, we evaluate the role of regional cooperation in quota allocation and provide a practical proposal for the implementation of the allocation scheme.
The rest of the article structure is distributed as follows: The research methods and data sources used in this paper are reviewed in Section 2. Section 3 demonstrates the quota allocation scheme and evaluation results, and analyzes the role of regional cooperation in quota allocation. Finally, the conclusion and corresponding policy recommendations are provided in Section 4.

2. Materials and Methods

To design the provincial quota allocation scheme, which is really in line with the current situation of China’s development, we first use multi-index method and entropy method to allocate quota from the perspective of fairness, and then use ZSG–DEA model to optimize the efficiency, so as to obtain the final multi-criteria quota allocation scheme. To ensure the fairness and effectiveness of the scheme, we select Gini coefficient, marginal abatement cost, and total abatement cost as quantitative indicators to complete the selection of the best quota scheme. Finally, we incorporate regional cooperation into the above quota allocation and evaluation model, and analyze the role of regional cooperation in allocation. The framework of the methodology in this study is illustrated in Figure 1.

2.1. China’s Total Carbon Emission Quota under the 2030 Carbon Reduction Target

Defining the total amount of quota allocation is a prerequisite for accomplishing the allocation task. According to [25], we assume that China will be in the new economic normal from 2017 to 2030, with GDP rising by 6% year by year. Then the total carbon emission quota of China in 2030 can be calculated as follows:
I 2005 = C E 2005 G D P 2005
I 2030 = I 2005 × ( 1 α )
C E 2030 = I 2030 × G D P 2030 = I 2030 × G D P 2016 × ( 1 + 6 % ) 14
where C E t , I t , G D P t respectively refer to China’s total carbon emissions, carbon emission intensity, and total GDP in year t . α is the decline in carbon emission intensity in 2030 compared with 2005, which is set at 65% in this paper [26].

2.2. Multi-Index Method Based on Entropy Weight

Because the single index method can only reflect the distribution result of one dimension, so it is easy to produce extreme cases [27]. Therefore, we choose the multi-index method for the initial allocation of quotas. According to the existing study [26], the fairness principle can be divided into four dimensions: Emission reduction capacity, emission reduction responsibility, emission reduction potential, and residents’ welfare. From these dimensions, we respectively select per capita GDP, historical cumulative carbon emissions, carbon emissions per unit of industrial added value, and employment indicators to construct a quota allocation index system that meets the requirements of fairness. The details of these indicators are shown in Table 1.
To avoid the damage of subjective weighting to the fairness of the scheme, entropy weight is selected as the index weight method. As an objective weighting method, entropy weight method can determine the weight by comparing the discreteness of the index [28]. After weighting by entropy method, we get that the weights of indicators in the index system are w p g , w h c , w i c , w l . Then the weighted sum can be used to get the compound score I i of each province:
I i = w p g I p g + w h c I h c + w i c I i c + w l I l
where I p g , I h c , I i c , I l are the quota allocation values of per capita GDP, historical cumulative carbon emissions, carbon emissions per unit of industrial added value, and employment indicators, respectively.
Finally, the distribution of provincial carbon quotas in 2030 is equal to:
q i = Q 2030 × I i i = 1 n I i

2.3. ZSG–DEA Model and Extended Form

In quota allocation, there is a certain correlation rather than complete independence among the influencing factors, which means the traditional DEA model can’t be well applied in this field. To solve this problem, Lins et al. (2003) introduced the zero-sum game idea into the DEA model and created the ZSG–DEA model [29]. The idea is to adjust the output variable to form a new effective frontier on the premise that the sum of the output variables remains unchanged. The total amount of distributable quota is fixed, and what policy makers expect is a scheme that can maximize the allocation efficiency, which is essentially a process of zero-sum games between decision-making units. Therefore, we choose the ZSG–DEA model to optimize the efficiency of the initial allocation scheme, so as to complete the secondary allocation of quotas.
Assuming that there are n decision-making units D M U i ( i = 1 , 2 , n ) , and θ i is the efficiency value of D M U i . If θ i = 1 , the D M U i is effective. On the contrary, if θ i 1 , the D M U i is ineffective. To achieve the effectiveness of all DMUs, it is necessary to adjust the ineffective DMUs to improve the efficiency value by reducing the input. According to [11], there are mainly two adjustment strategies: Average distribution and proportional distribution. We choose the latter for the sake of rationality. In this strategy, the increased input of D M U k due to D M U j can be expressed as follows:
x k Δ = [ x j ( 1 θ j ) ] × x k j = 1 , j k n x j
This paper selects carbon emission ( c o ) as input index, population ( p ), GDP ( g ), and energy consumption ( e ) as output indicators [30], and constructs a put-oriented ZSG–DEA model. The specific model can be expressed by Equation (7):
m in θ k s . t . { i = 1 n δ i c o i { 1 + [ co k ( 1 θ k ) ] i = 1 , i k n co i } c o k θ k i = 1 n δ i p i p k i = 1 n δ i g i g k i = 1 n δ i e i e k δ i 0 , i = 1 , 2 , , n
Model (7) is the process of zero-sum game for provincial quotas. Invalid DMUs experienced with each reallocation will improve its technical efficiency until all DMUs achieve 100% technical efficiency.
The difference in the distribution of resources determines that there are obvious limitations in emission reduction in a single region, and regional cooperation can help local resources complement each other, which will improve the efficiency of emission reduction. However, regional cooperation often requires an integrated manager, and national cooperation may be difficult to achieve. Therefore, this paper focuses on evaluating the impact of local regional cooperation on quota allocation. The extended ZSG–DEA model considering regional cooperation is as follows:
min θ k s . t . i = 1 , i C ( Q ) n δ i c o i { 1 + [ c o k ( 1 θ k ) ] i = 1 , i k n c o i } c o k θ k , k = 1 , 2 , n , Q = 1 , 2 , , q , k C ( Q ) i = 1 , i C ( Q ) n δ i p i p k , k = 1 , 2 , n , Q = 1 , 2 , , q , k C ( Q ) i = 1 , i C ( Q ) n δ i g i g k , k = 1 , 2 , n , Q = 1 , 2 , , q , k C ( Q ) i = 1 , i C ( Q ) n δ i e i e k , k = 1 , 2 , n , Q = 1 , 2 , , q , k C ( Q ) δ i 0 , i = 1 , 2 , , n
In model (8), we assume that there are Q ( Q = 1 , 2 , , q ) cooperative groups. C ( Q ) means that cooperative group Q contains a set of D M U t ( t = 1 , 2 , m ) with a set size of m . Different cooperation combinations will lead to different results. Therefore, the selection priority of regional cooperation objects should be paid attention to in quota allocation.

2.4. Gini Coefficient in the Study of Quota Allocation

To ensure that quota allocation schemes can be accepted by different groups, fairness of the scheme must be guaranteed. Gini coefficient, as an indicator of fairness, has extended from being only applied to evaluate regional income distribution differences to economic, environmental, and other fields [31]. Hence, Gini coefficient is selected to evaluate the fairness of quota scheme.
The Gini coefficient can be calculated by Lorenz curve. In the quota allocation, the Abscissa of the Lorenz curve is the cumulative proportion of the population of each province, and the ordinate is the cumulative proportion of carbon emission quotas of the corresponding provinces [32]. The order of each point is arranged according to the per capita quota from low to high. Figure 2 shows the Lorentz curve.
The curvature change of Lorenz curve reflects the fairness of allocation. Referring to [33], the Gini coefficient can be formulated as follows:
G = A A + B = 2 A = 1 2 B
B = i = 1 n ( x i x i 1 ) × ( y i + y i 1 ) 2
where A is the area between the Lorentz curve and the absolute fairness line. B is the area between the Lorentz curve and the two coordinate axes. x i , y i represent the cumulative proportion of population and quota of the former i provinces, respectively. G is the Gini coefficient. According to the regulations of relevant international organizations, if G is less than 0.2, the scheme is very fair; between 0.2 and 0.4 indicates that the scheme is relatively fair, and if it is greater than 0.4, the scheme is unfair.

2.5. Cost Effect Analysis Based on Slacks-Based Measure-Data Envelopment Analysis Model

To guarantee the effectiveness of the scheme, the distribution scheme should be tested quantitatively. For this reason, this paper selects marginal abatement cost and total abatement cost as evaluation index, and constructs the SBM–DEA to obtain these indicators. Referring to [34], we select capital stock, employment population, and energy consumption as input variables, provincial GDP as a desirable output, and carbon emissions as an undesirable output. The detailed model can be expressed as the following:
min ρ i * = 1 1 3 ( s i k k i + s i l l i + s i e e i ) 1 + 1 2 ( s i g g i + s i c o c o i ) s . t . { j = 1 30 λ j k j + s i k = k i j = 1 30 λ j l j + s i l = l i j = 1 30 λ j e j + s i e = e i j = 1 30 λ j g j s i g = g i j = 1 30 λ j c o j + s i c o = c o i j = 1 30 λ j = 1 s i k , s i l , s i e , s i g , s i c o , λ j 0 , i , j = 1 , 2 , 30
where the subscript i ( i = 1 , 2 , 30 ) refers to the observation province. k i , l i , e i , g i , c o i represent the capital stock, employment, energy consumption, local gross domestic product, and carbon emission of region i , respectively. s i k , s i l , s i e , s i g , s i c o are the relaxation variable of the corresponding index. λ j denotes the intensity vector. ρ i * stands for the average efficiency of input and output of the province i . When ρ i * = 1 , s i k , s i l , s i e , s i g , s i c o are both 0, which means that D M U i is an effective decision unit.
To solve this nonlinear model, we transform the model (11) into a linear model (12) by means of Charnes–Cooper transformation. The transformation satisfies: t = 1 1 2 ( r i g g i + r i c o c o i ) , ξ j = t λ j , r i k = t s i k , r i l = t s i l , r i e = t s i e , r i g = t s i g , r i c o = t s i c o .
min ρ i * = t 1 3 ( s i k k i + s i l l i + s i e e i ) { j = 1 30 ξ j k j + r i k = t k i j = 1 30 ξ j l j + r i l = t l i j = 1 30 ξ j e j + r i e = t e i j = 1 30 ξ j g j r i g = t g i j = 1 30 ξ j c o j + r i c o = t c o i j = 1 30 ξ j = t t , ξ j , r i k , r i l , r i e , r i g , r i c o 0
Since the marginal abatement cost is equal to the ratio of the shadow price of carbon emissions to economic output, we construct the dual model (13). The dual model is as follows:
max θ { θ + μ k i k i + μ l i l i + μ e i e i μ g i g i + μ c o i c o i = 1 j = 1 30 μ k i k j + j = 1 30 μ l i l j + j = 1 30 μ e i e j j = 1 30 μ g i g j + j = 1 30 μ c o i c o j 0 μ k i 1 3 k i ; μ l i 1 3 l i ; μ e i 1 3 e i ; μ g i θ 2 g i ; μ c o i θ 2 c o i
where θ , μ k i , μ l i , μ l i , μ g i , μ c o i are all dual variables. θ represents the overall profit of the economy at the level of production and technology. Through model (13), we get the expression of the marginal abatement cost:
M A C i = p g i × μ c o i μ g i
where p g i is the is the market price of GDP in province i , which is set to 1 yuan/t according to the definition. M A C i is the marginal abatement cost of carbon emission in province i .
However, the marginal abatement cost of each province can only reflect the local marginal cost effect of reduction work, and it is difficult to measure the merits of the overall emission reduction plan. Accordingly, we introduce the total abatement cost to compare the advantages and disadvantages of different schemes. The significance of this index is to maintain the current share of provincial carbon emissions until 2030 as the benchmark scheme, and use the designed quota scheme to compare it with and combine with the marginal abatement cost, so as to quantify the cost of realizing the quota scheme. The index can be expressed by Equation (15):
T R C = i = 1 n ( I c o i D c o i ) × M A C i
where I c o i represents the carbon emissions of province i by 2030 if the proportion of carbon emissions in 2012–2016 is maintained. D c o i is the carbon emission quota of province i in the selected scheme. T R C represents the total abatement cost of the scheme. If T R C > 0 , it means that the scheme still needs additional cost compared with the current carbon emissions. If T R C < 0 , it means that the scheme has cost benefits compared with the current carbon emissions. Obviously, the smaller the total abatement cost of the scheme, the more likely it is to be favored by policy makers.

2.6. Data Sources and Processing

2.6.1. Carbon Emissions Estimation

Considering the lack of authoritative statistics on China’s carbon emissions index, we adopt the recommended method in the 2006 IPCC Guidelines for National Greenhouse Gas Inventories to estimate this index [35]. To avoid errors caused by rough classification in calculating, we regard coal, coke, and other eight kinds of energy in the energy consumption table of the yearbook as the sources of carbon emissions. Therefore, the method of calculating carbon emissions is as follows:
co i = j = 1 8 co i j = j = 1 8 E i j × C E F j × O j
where co i j is the carbon dioxide emission produced by the fuel j in area i . Additionally, C E F j , O j represent the carbon emission coefficient and oxidation rate of fuel j , respectively, and their data are shown in Table 2:

2.6.2. Data Source

This study covers 30 provinces in China, among which four provinces, Tibet, Hong Kong, Macao, and Taiwan, were excluded from the study because the data were unavailable. According to the geographical location of provinces and related research [24], we divide these provinces into three regions: The eastern, central, and western regions, as shown in Table 3. The eastern region is economically developed, but the emission pollution is the most serious. The central region is dominated by agricultural development, and the economic level and emissions are in the middle level. Although most of the western regions are underdeveloped provinces, they are rich in renewable resources.
The indicators of population, GDP, carbon emissions per unit of industrial added value, employment, and fixed asset investment in 30 provinces come from the China Statistical Yearbook (2001–2017) [36]. Energy consumption can be obtained from the China Energy Statistical Yearbook (2001–2017) [37]. In addition, with regard to the indicators designed by the study for 2030, we refer to the studies of other scholars. China’s population, GDP, employment, and other indicators in 2030 are predicted from the average growth from 2001 to 2016 [19], while the proportion of the corresponding indicators in each province is consistent with that from 2012 to 2016 [38]. Meanwhile, according to the China Energy Outlook 2030, China’s total energy consumption in 2030 is set at 5.3 billion tons. The capital stock is calculated by the perpetual inventory method, indicating that [39]:
k t = k t 1 × ( 1 ε t ) + f t
where k t , ε t , f t respectively represent the capital stock, depreciation rate, and investment in fixed assets in year t . The capital stock in the first year is set as a fixed asset investment divided by 10% in 2000. The depreciation rate is set at 10.96% [40].

3. Results

3.1. Initial Quota Allocation Scheme Based on Fairness Principle

Using Equations (1)–(3), the total carbon emission quota of China in 2030 is 21.44 billion tons. To fully integrate fairness principle into quota allocation system, we combine multi-index method and entropy method for initial quota allocation. The results show that the weights of the four indicators in the quota allocation index system under entropy weight are 0.1458, 0.3424, 0.1458, and 0.3660, respectively, in which the quota allocation is more affected by the emission reduction responsibility and residents’ welfare dimensions than by the other two dimensions. This allocation method combines the principles of hereditary system, egalitarianism, and ability to pay in the fairness of distribution, and reflects the fairness of the quota scheme from many aspects.
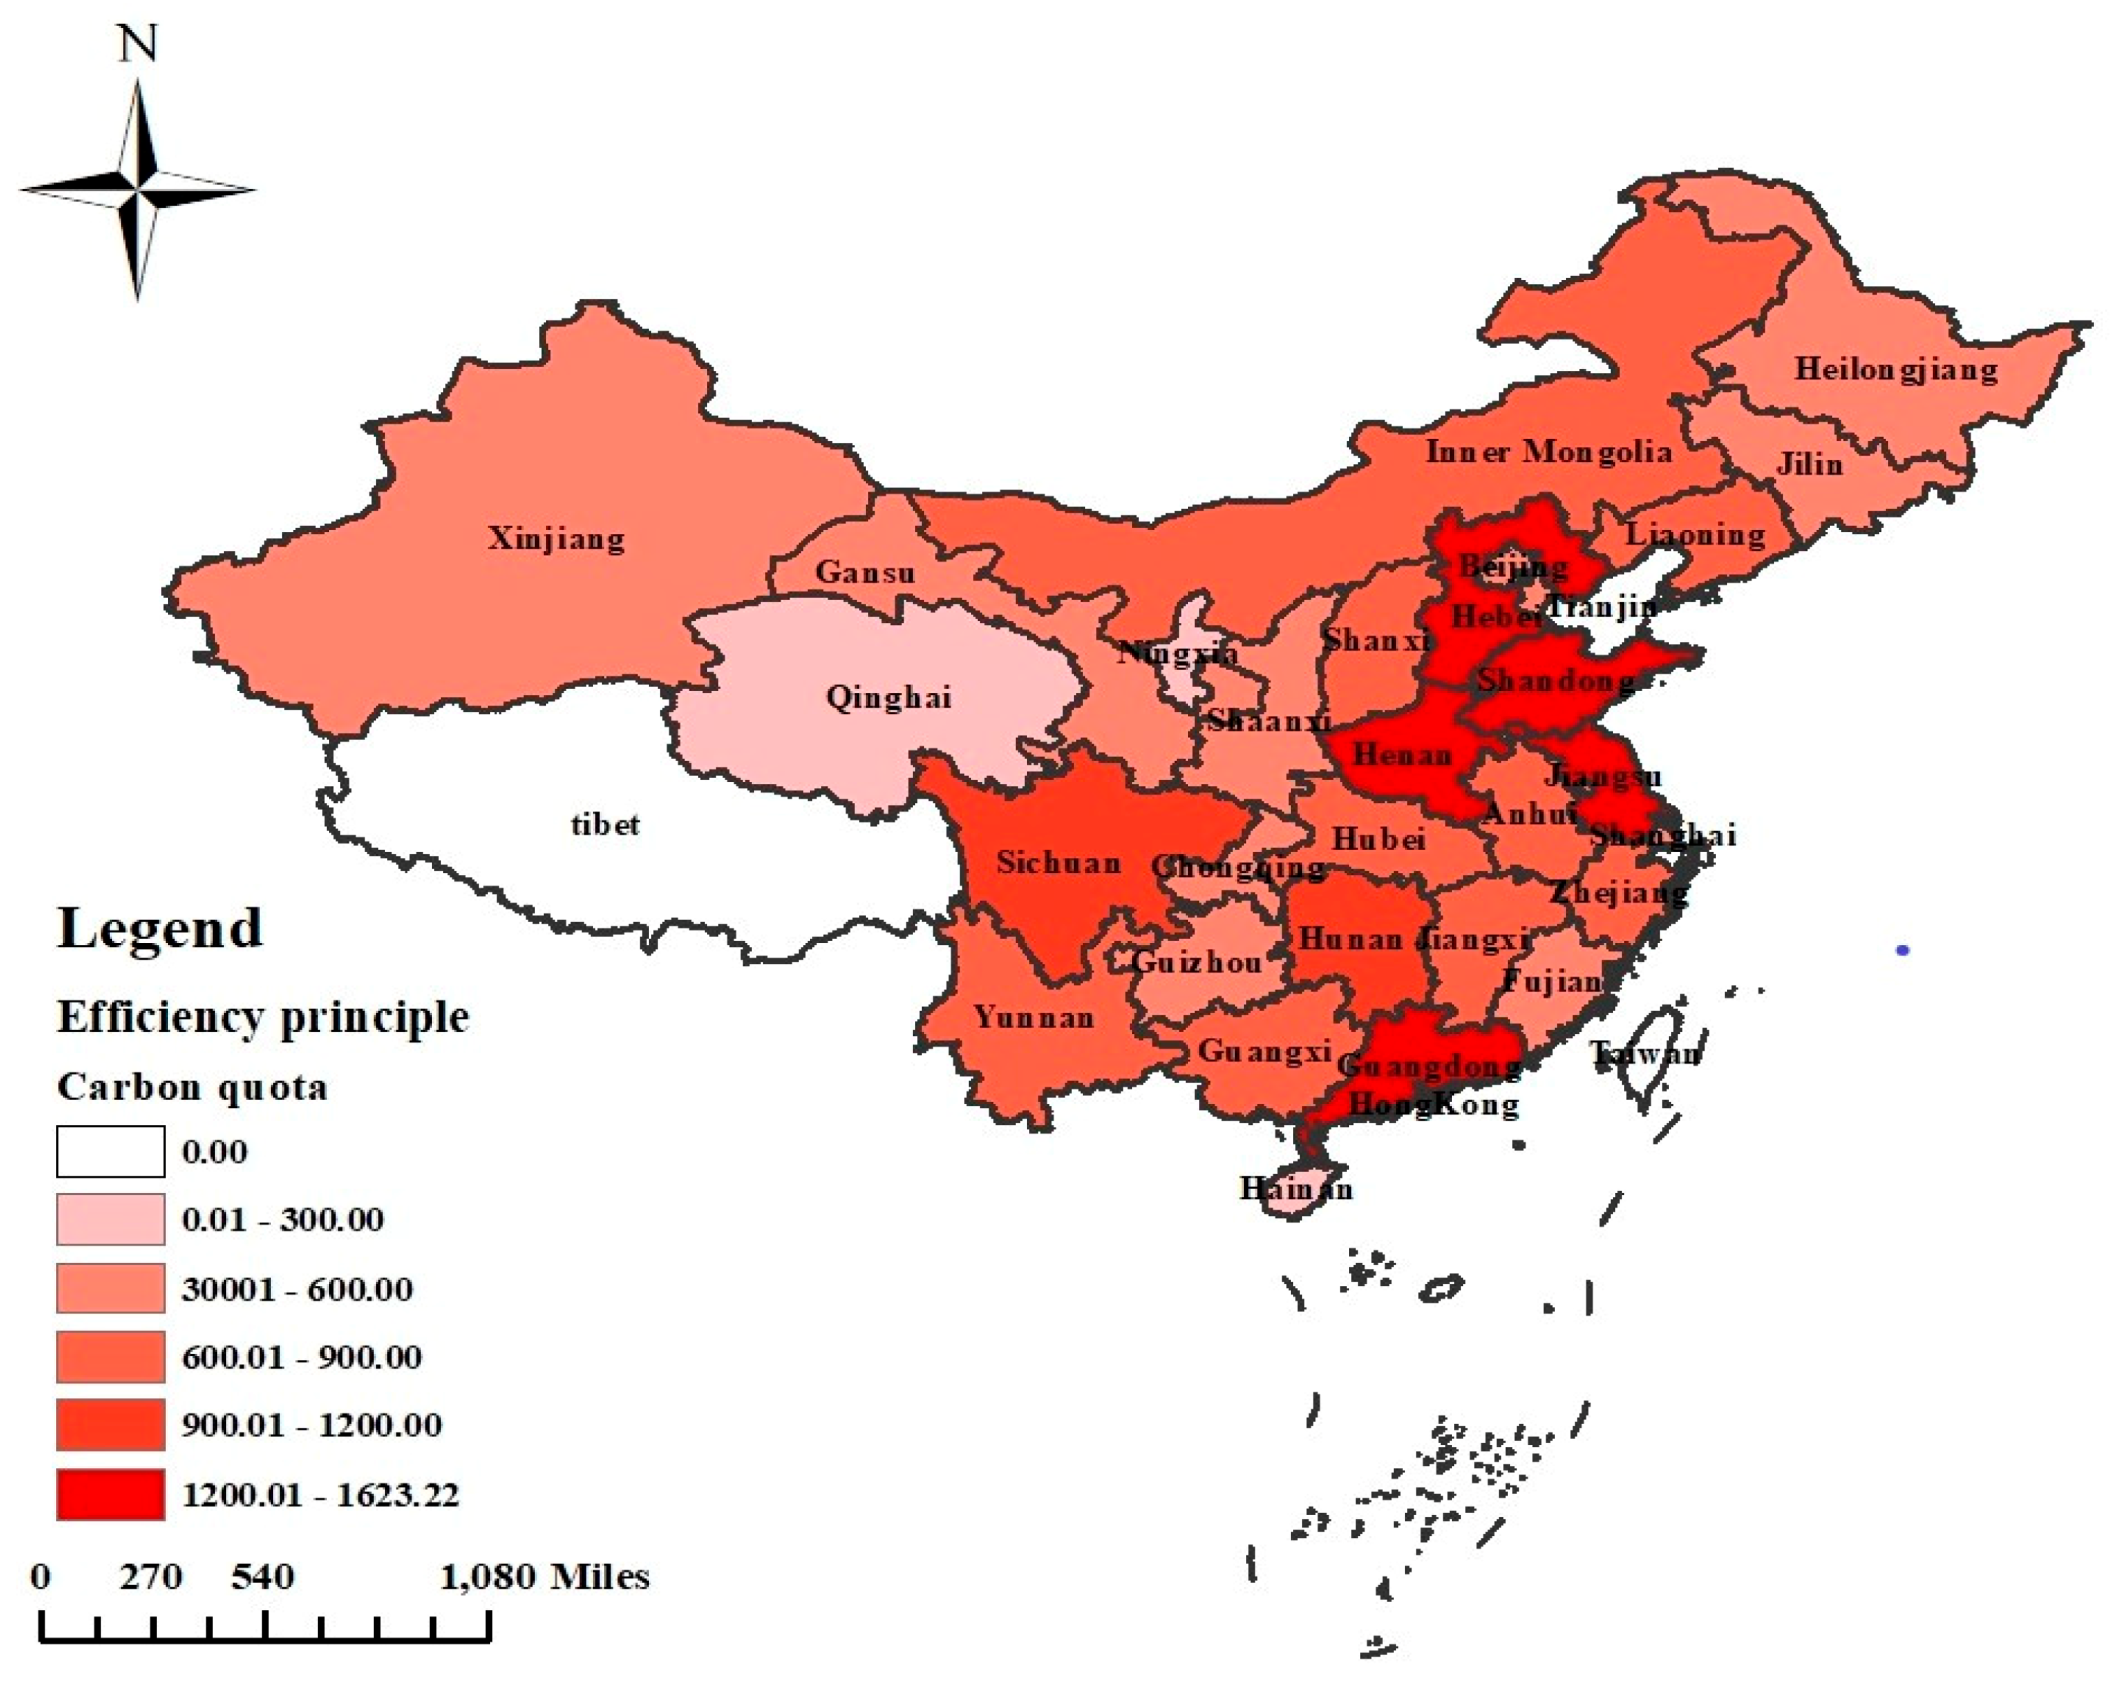
Figure 3 presents the quota allocation results of China’s provinces in 2030, showing obvious spatial disparities. Among the three regions, the eastern region obtained the highest proportion of quotas, 41.18%, significantly more than the western region’s 22.82%. Four of the five provinces (Hebei, Jiangsu, Shandong, and Guangdong) with the highest quota allocation belong to the eastern provinces. Except for four municipalities directly under the Central Government, the provinces with less quota allocation, such as Qinghai and Ningxia, are distributed in the western region. This is because there is a significant correlation between the quota and the development level, and the overall development level of developed provinces is stronger than that of less developed provinces, so developed provinces should receive more quotas to meet the requirements of fair distribution.

3.2. Optimized Redistribution Quota Scheme Based on ZSG-DEA Model

Through model (7), we calculate that the average efficiency of the initial allocation scheme is 0.796, which shows that the scheme still has room for improvement in efficiency. In order to improve the efficiency of the quota, we optimize the initial quota scheme by using ZSG–DEA model. After three iterations, the quota allocation efficiency of each province reached the maximum value of 1. Figure 4 represents the complete iterative process, where the broken line is the efficiency of each province in multiple iterations, and the column denotes the amount of adjustment.
Figure 4 shows dynamic changes in efficiency during quota adjustment processes. The initial average efficiency of the eastern region was the highest among the three regions at 0.856, followed by the central region at 0.814, and the western region was the lowest at 0.717. In the iterative process, the efficient eastern region tends to obtain some carbon emission quotas from the inefficient western region, and these provinces have a higher demand for quotas. Interestingly, Hainan, the least efficient province, belongs to the eastern region, while Xinjiang, the most efficient province, is located in the western region. This represents the conflict between fairness and efficiency in quota allocation. Figure 5 and Figure 6 respectively show two quota allocation schemes before and after the improvement of the ZSG–DEA model.
As shown in Figure 4, Figure 5 and Figure 6, we find that after adjusting the ZSG–DEA model, the quota in the eastern region increases by 676.39 Mt, while that in the central and western regions decreases by 182.81 Mt and 493.58 Mt, respectively. Four of the five provinces with the largest increase in adjustment (Guangdong, Jiangsu, Hebei, and Shandong) are in the east, while four of the five provinces with the largest reduction in adjustment are also located in the west (Guizhou, Gansu, Chongqing, Qinghai). Seen as a whole, the quota in the optimization scheme is mainly transferred from the western region to the eastern region.
The rationality of these adjustments lies in that the eastern provinces such as Guangdong, Jiangsu, Hebei, and Shandong are densely populated, have strong economic strength and developed industrial level, and should be given a higher quota level in order to ensure the stability of their economic development in the future. While the western provinces such as Xinjiang, Yunnan, and Guizhou have relatively small carbon emissions and are rich in hydropower, wind, and light resources. These provinces have the ability to undertake part of the emission reduction tasks for the eastern provinces to improve the efficiency of quota allocation in the whole country. All in all, the allocation of carbon quotas is greatly affected by the eastern provinces, and the carbon reduction work of these provinces should be paid more attention to.

3.3. Evaluation Results of Fairness and Cost Effect of Quota Schemes

Due to the lack of recognized quota allocation standards, the current allocation method is highly subjective, which will be difficult to ensure the implementation effect of the quota scheme. Therefore, the evaluation of the quota scheme is very necessary. Based on this point, this paper brings fairness and cost effect into the scope of evaluation, and evaluates the rationality of the designed quota scheme.
Fairness is the basic condition of quota allocation. Considering that the optimization of the ZSG–DEA model will affect the fairness of the original scheme, we choose the Gini coefficient to quantify and test the fairness of the scheme. The Gini coefficient of the scheme is calculated to be 0.0950 less than 0.2, which shows that the adjusted scheme still has strong fairness. In addition, the efficiency values of the provinces optimized by the ZSG–DEA model are all up to 1, which shows that the improved final quota allocation scheme is in line with the efficiency principle. The results show that the allocation scheme of this study is a quota allocation scheme which takes into account both fairness and efficiency.
The cost effect of the quota scheme refers to the economic cost to be paid by local and national governments for the implementation of the quota plan. Therefore, we choose the marginal abatement cost (MAC) and the total abatement cost (TAC) to quantify and compare the cost effects of different schemes, and through the SBM–DEA model to obtain these two indicators. Figure 7a,b show the quotas and abatement costs of the two quota allocation schemes.
Figure 7 identifies that the total abatement cost of the initial quota scheme and the optimization scheme are 241 billion yuan and −1.93 trillion yuan, respectively, and the optimization scheme will bring lower abatement costs. In terms of marginal abatement cost, the marginal abatement cost in the eastern region, including Jiangsu, Hebei, Guangdong, and other provinces with a higher development level, is generally on the high side, while in the western region, the marginal abatement cost in less developed provinces such as Qinghai, Ningxia, and Gansu is often at a low level. This shows that the marginal abatement cost of each province is intrinsically related to the development level. The developed provinces tend to have a higher economic level and larger carbon emissions, which also increases the difficulty of emission reduction in the province, resulting in these provinces have to bear a higher marginal abatement cost. It is also the reason for the lower marginal abatement cost in less developed provinces.
The starting point of the ZSG–DEA model is to transfer part of the quota from low abatement cost areas to high abatement cost areas, so as to make full use of the provincial resources to improve the national abatement efficiency. Table 4 further illustrates the changing trend of regional abatement costs before and after optimization. After optimization, the total abatement cost in the eastern region reduces to 3055.54 billion yuan, while the total abatement cost in the central and western regions increases to 250.65 and 637.72 billion yuan. The reason for this change is that the central and western regions have helped the eastern region undertake part of the emission reduction task within the scope of their own emission reduction capacity, and the marginal abatement cost of the western and central provinces is much less than that of the eastern region. As a result, the western region has completed the abatement task at a lower cost.
For the eastern provinces where it is difficult to reduce emissions, the increase in quotas will greatly lighten the resistance to emission reduction, and what the local government should do is to introduce relevant policies to urge the completion of emission reduction tasks on time. For the central and western provinces where it is difficult to reduce emissions, the reduction of quotas will promote the local use of renewable energy. If the Chinese government can give certain financial subsidies to these provinces, it will not only stimulate their enthusiasm for emission reduction work, but also promote local economic development. In general, our optimized quota allocation scheme shifts part of the emission reduction pressure from the eastern provinces with large emissions to the western and central provinces through the adjustment of carbon emission quotas, so as to “averaging” the emission reduction pressure. The optimization scheme not only has certain advantages in terms of cost effect, but is also more in line with the development status of China’s provinces in terms of abatement task allocation.

3.4. Impact of Regional Collaboration on Quota Allocation

Although quota allocation is carried out on a provincial basis, in fact, the implementation of most emission reduction policies and work often requires a process from the local to whole country. A representative case is China’s carbon trading market policy. As a key factor affecting emission reduction, regional cooperation will play an important role in quota allocation. In order to further study the role of regional cooperation in quota allocation, we have formed the following five scenarios according to the cooperation situation in the eastern, central, and western regions of China, which are called national cooperation scenario, east–west cooperation scenario, east–middle cooperation scenario, middle–west cooperation scenario, and intra-regional cooperation scenario, and list the quota allocation and abatement costs of regions under the five scenarios in Table 5.
From Table 5, we find that the total abatement cost is the lowest in the national cooperation scenario, the highest in the intra-regional cooperation scenario, and the remaining inter-regional cooperation scenarios are between the two. This shows that considering regional cooperation in quota allocation can effectively reduce the abatement cost of the scheme, while the national coalition can minimize the abatement cost. Therefore, for the Chinese government, it is easier to achieve the desired quota allocation results at the national level.
However, local provinces usually play different roles in regional cooperation, and not all provinces can obtain economic benefits in regional cooperation. Under regional cooperation, the eastern provinces will reduce the abatement cost no matter which region they cooperate with, and the cooperation with the western provinces will reduce the local abatement cost to a greater extent. The cooperation of the western provinces will increase their own pressure and abatement cost, while the central provinces are more willing to cooperate with the western region to reduce their own emission reduction pressure. For the eastern and some developed central provinces, the current situation of high emissions and high abatement costs determines that it is difficult to maintain the balance between economic development and emission reduction tasks alone, and the choice of regional cooperation will greatly reduce local abatement expenditure. For the western and some central provinces with less emission reduction pressure, regional cooperation will bring them additional emission reduction tasks and burden, but it will also promote the local use of renewable energy, thus stimulating local economic development.
On the whole, we believe that the impact of regional cooperation on quota allocation is undoubtedly positive. Eastern provinces will strive to alleviate their own emission reduction pressure through intra-regional and inter-regional cooperation. While the central and western provinces may increase the emission reduction burden in regional cooperation, but in the long run, it can also improve the local industrial level and economic development. For the Chinese government, cooperation at the national level is undoubtedly the most ideal way of quota allocation, and regional cooperation should be encouraged in quota allocation. However, considering that regional cooperation will bring additional emission reduction tasks to the central and western provinces, the Chinese government should give corresponding financial subsidies or policy support to improve its enthusiasm for cooperation.

3.5. Comparative Analysis of Different Economic Growth Rates

The main contribution of this research is to design a quota allocation method and scheme evaluation method, which is applied to the study of China’s provincial quota allocation in 2030. As the future quota allocation plan is formulated in this paper, the forecast difference of economic growth may have an impact on the allocation results. Therefore, this paper sets up three scenarios in which the economic growth rate is 5.5%, 6%, and 6.5%, respectively, and uses the scenario comparison method to reflect the impact of economic growth changes on the distribution results.
Table 6 lists the allocation results in three scenarios. Obviously, the results of the secondary quota allocation in the three scenarios have lower total abatement cost and meet more allocation principles than the initial allocation, which verifies the optimization effect of the secondary allocation. This also shows that the quota allocation method in this paper has a wide range of applicability. However, it is interesting that although the increase in economic growth will lead to a certain increase in the quota of each province and the whole country, the proportion of the quota of each province remains unchanged. It can be inferred that economic growth is only related to China’s total quota in 2030, and does not affect the specific distribution results of each province. We guess that the quota distribution results of each province may be related to the future development trend of each province, and the specific relationship between the development speed and distribution result will become the follow-up research topic in this field.

4. Conclusions and Policy Suggestions

Recently, China has committed to controlling its own carbon emissions, and the emission reduction work has made phased progress, but there is still a long way to go to achieve the emission reduction target. With the introduction of a carbon trading market and other emission reduction policies, the traditional quota allocation method has been unable to adapt to the current development situation in China. Now, the European Union Commission is adopting beside emissions trading system a carbon border measure against third countries such as China, USA, India, and others, to be set on imports [41,42]. This will urge China to issue a quota allocation plan in line with the current development situation as soon as possible. Therefore, based on China’s carbon reduction target in 2030, this study combines the multi-index method and ZSG–DEA model to design a fair and efficient multi-criteria quota allocation method. We also select indicators to evaluate the allocation scheme from the aspects of fairness and cost effect, so as to select the best scheme. On this basis, this paper also studies the impact of regional cooperation on quota allocation, which provides a practical reason for the implementation of quota scheme. The main conclusions of this paper are as follows:
(1) In the process of efficiency optimization, the quota is mainly transferred from the western region with low emission to the eastern region with high emission. The eastern region has nearly 45% of the national quota, and the work of reducing carbon emissions in this region should be paid close attention to.
(2) The multi-criteria quota allocation scheme after secondary allocation not only meets the requirements of fairness and efficiency, but also has advantages in the abatement cost. This scheme is a more ideal quota allocation scheme.
(3) Regional cooperation will help China to rationally share the pressure of emission reduction among provinces and reduce the national abatement cost. The eastern region will strive to ease its own emission reduction pressure through cooperation. The central region is less affected by regional cooperation, but it is more inclined to cooperate with the western region. Although the western region will undertake additional emission reduction tasks for the eastern and central regions, it also gives the western region an opportunity for economic development. The Chinese government should encourage regional cooperation and set up a corresponding compensation mechanism to improve the cooperation enthusiasm of the western provinces.
According to the above conclusions, we give some policy suggestions. Firstly, the Chinese government should actively promote the construction of a national carbon trading market and set up a national quota trading platform to encourage cooperation. Secondly, provincial governments should formulate corresponding energy policies according to their own development and emission reduction targets. For example, the eastern provinces with high emissions should focus on adjusting the local energy structure and actively look for cooperative provinces to alleviate their own carbon reduction pressure. For the central provinces with moderate carbon reduction pressure, the local government should give certain policy concessions or subsidies to local clean energy power generation enterprises to stimulate the development of local clean energy. The western region can further expand the local renewable energy consumption through the development of energy storage systems, so as to reduce the dependence on thermal power and alleviate the local phenomenon of abandoning wind and light. Thirdly, the Chinese government should encourage the research of energy conservation and optimize the production process of energy consumption industries.
In general, the future research work can start from the following aspects. Firstly, this paper only formulates the allocation method of provincial carbon emission quota, and the allocation method of quota among industries and even enterprises is also a topic of wide social concern. Secondly, the implementation effect of carbon trading policies and carbon trading markets is also an issue worthy of in-depth discussion. Finally, this study only considers the regional cooperation between large-scale regions, and the cooperation between small-scale provinces and cities will be an important direction for further research.

Author Contributions

Conceptualization, Q.T.; Data curation, J.Z.; Funding acquisition, Q.T.; Methodology, J.Z.; Software, Y.D.; Supervision, Y.Z. All authors have read and agreed to the published version of the manuscript.

Funding

This research was funded by 111 Project grant number [B18021], and the 2018 Key Projects of philosophy and Social Sciences Research, Ministry of Education, China grant number [No.71874053], and the 2018 Key Projects of philosophy and Social Sciences Research, Ministry of Education, China [No.18JZD032].

Acknowledgments

The authors are very grateful to the the 2018 Key Projects of philosophy and Social Sciences Research, Ministry of Education, China for their support for this study. Meanwhile, the authors thank to the editors and the anonymous reviewers for their insightful comments and suggestions.

Conflicts of Interest

The authors declare no conflict of interest.

References

  1. IPCC. Climate Change 2014: Synthesis Report; IPCC: Geneva, Switzerland, 2014; pp. 1–151. [Google Scholar]
  2. Tokarska, K.; Gillett, N.; Weaver, A.; Arora, V.; Eby, M. The climate response to five trillion tonnes of carbon. Nat. Clim. Chang. 2016, 6, 851–855. [Google Scholar] [CrossRef]
  3. Mu, Y.; Wang, C.; Cai, W. The economic impact of China’s INDC: Distinguishing the roles of the renewable energy quota and the carbon market. Renew. Sustain. Energy Rev. 2018, 81, 2955–2966. [Google Scholar] [CrossRef]
  4. Tan, Q.; Ding, Y.; Ye, Q.; Mei, S.; Zhang, Y.; Wei, Y. Optimization and evaluation of a dispatch model for an integrated wind-photovoltaic-thermal power system based on dynamic carbon emissions trading. Appl. Energy 2019, 253, 113598. [Google Scholar] [CrossRef]
  5. Gerbeti, A. La nuova direttiva europea sullo scambio delle quote di emissione: Luci ed ombre. Riv. Giuridica dell’Ambiente 2010, 1, 183–189. (In Italian) [Google Scholar]
  6. Gerbeti, A. Mercati Ambientali. Encycl. Treccani 2017, 2, 107–111. (In Italian) [Google Scholar]
  7. Zhou, P.; Wang, M. Carbon dioxide emissions allocation: A review. Ecol. Econ. 2016, 125, 47–59. [Google Scholar] [CrossRef]
  8. Wei, Y.; Wang, L.; Liao, H.; Wang, K.; Murty, T.; Yan, J. Responsibility accounting in carbon allocation: A global perspective. Appl. Energy 2014, 130, 122–133. [Google Scholar] [CrossRef]
  9. Cai, W.; Ye, P. A more scientific allocation scheme of carbon dioxide emissions allowances: The case from China. J. Clean. Prod. 2019, 215, 903–912. [Google Scholar] [CrossRef]
  10. Banker, R.D.; Charnes, A.; Cooper, W.W. Some Models for Estimating Technical and Scale Inefficiencies in Data Envelopment Analysis. Manag. Sci. 1984, 30, 1078–1092. [Google Scholar] [CrossRef] [Green Version]
  11. Sun, H.; Tariq, G.; Chen, H.; Zhu, J.; Liu, Y.; Wu, C. Do market share and efficiency matter for each other? An application of the zero-sum gains data envelopment analysis. J. Oper. Res. Soc. 2010, 61, 647–657. [Google Scholar] [CrossRef]
  12. Qin, Q.; Liu, Y.; Li, X.; Li, H. A multi-criteria decision analysis model for carbon emission quota allocation in China’s east coastal areas: Efficiency and equity. J. Clean. Prod. 2017, 168, 410–419. [Google Scholar] [CrossRef]
  13. Mu, H.; Li, L.; Li, N.; Xue, Z.; Li, L. Allocation of Carbon Emission Permits among Industrial Sectors in Liaoning Province. Energy Procedia 2016, 104, 449–455. [Google Scholar] [CrossRef]
  14. Zhu, B.; Jiang, M.; He, K.; Chevallier, J.; Xie, R. Allocating CO2 allowances to emitters in China: A multi-objective decision approach. Energy Policy 2018, 121, 441–451. [Google Scholar] [CrossRef]
  15. Wang, J.; Lv, K.; Bian, Y.; Cheng, Y. Energy efficiency and marginal carbon dioxide emission abatement cost in urban China. Energy Policy 2017, 105, 246–255. [Google Scholar] [CrossRef]
  16. Delarue, E.D.; Ellerman, A.D.; D’Haeseleer, W.D. Robust MACCs? The topography of abatement by fuel switching in the European power sector. Energy 2010, 35, 1465–1475. [Google Scholar] [CrossRef] [Green Version]
  17. Jiang, H.; Dong, K.; Zhang, K.; Liang, Q. The hotspots, reference routes, and research trends of marginal abatement costs: A systematic review. J. Clean. Prod. 2019, 252, 119809. [Google Scholar] [CrossRef]
  18. Tang, K.; Yang, L.; Zhang, J. Estimating the regional total factor efficiency and pollutants’ marginal abatement costs in China: A parametric approach. Appl. Energy 2016, 184, 230–240. [Google Scholar] [CrossRef]
  19. Wang, Z.; Chen, H.; Huo, R.; Wang, B.; Zhang, B. Marginal abatement cost under the constraint of carbon emission reduction targets: An empirical analysis for different regions in China. J. Clean. Prod. 2019, 249, 119362. [Google Scholar] [CrossRef]
  20. Zhao, J. The Carbon Emissions Efficiency and Marginal Abatement Cost in Urban of China: Non-Parametric Directional Distance Function Method. Mod. Econ. 2017, 8, 386–396. [Google Scholar] [CrossRef] [Green Version]
  21. Wei, C.; Ni, J.; Du, L. Regional allocation of carbon dioxide abatement in China. China Econ. Rev. 2012, 23, 552–565. [Google Scholar] [CrossRef]
  22. Choi, Y.; Zhang, N.; Zhou, P. Efficiency and abatement costs of energy-related CO2 emissions in China: A slacks-based efficiency measure. Appl. Energy 2012, 98, 198–208. [Google Scholar] [CrossRef]
  23. Uddin, N.; Taplin, R. Regional cooperation in widening energy access and also mitigating climate change: Current programs and future potential. Glob. Environ. Chang. 2015, 35, 497–504. [Google Scholar] [CrossRef]
  24. Yu, A.; You, J.; Rudkin, S.; Zhang, H. Industrial carbon abatement allocations and regional collaboration: Re-evaluating China through a modified data envelopment analysis. Appl. Energy 2019, 233–234, 232–243. [Google Scholar] [CrossRef]
  25. Zheng, J.; Mi, Z.; Coffman, D.M.; Shan, Y.; Guan, D.; Wang, S. The Slowdown in China’s Carbon Emissions Growth in the New Phase of Economic Development. One Earth 2019, 1, 240–253. [Google Scholar] [CrossRef] [Green Version]
  26. Fang, K.; Zhang, Q.; Long, Y.; Yoshida, Y.; Sun, L.; Zhang, H.; Dou, Y.; Li, S. How can China achieve its Intended Nationally Determined Contributions by 2030? A multi-criteria allocation of China’s carbon emission allowance. Appl. Energy 2019, 241, 380–389. [Google Scholar] [CrossRef]
  27. Lai, Y.; Wang, F.; Zhang, Y.; Li, S.; Wu, P.; Ou, P.; Fang, Q.; Chen, Z.; Duan, Y. Implementing chemical mass balance model and vulnerability the theories to realize the comprehensive evaluation in an abandoned battery plant. Sci. Total. Environ. 2019, 686, 788–796. [Google Scholar] [CrossRef] [PubMed]
  28. Liu, Z.; Geng, Y.; Dong, H.; Wilson, J.; Micic, T.; Wu, R.; Cui, X.; Qian, Y.; You, W.; Sun, H. Efficient distribution of carbon emissions reduction targets at the city level: A case of Yangtze River Delta region. J. Clean. Prod. 2018, 172, 1711–1721. [Google Scholar] [CrossRef]
  29. Lins, M.P.E.; Gomes, E.G.; de Mello, J.C.C.B.S.; de Mello, A.J.R.S. Olympic ranking based on a zero sum gains DEA model. Eur. J. Oper. Res. 2003, 148, 312–322. [Google Scholar] [CrossRef] [Green Version]
  30. Zhou, P.; Ang, B.W. Decomposition of aggregate CO2 emissions: A production-theoretical approach. Energy Econ. 2008, 30, 1054–1067. [Google Scholar] [CrossRef]
  31. Teng, F.; He, J.; Pan, X.; Zhang, C. Metric of Carbon Equity: Carbon Gini Index Based on Historical Cumulative Emission per Capita. Adv. Clim. Chang. Res. 2011, 2, 134–140. [Google Scholar] [CrossRef]
  32. Song, D.; Liu, X. Spatial distribution of provincial carbon emissions. China Popul. Resour. Environ. 2013, 5. Available online: http://en.cnki.com.cn/Article_en/CJFDTotal-ZGRZ201305002.htm (accessed on 10 March 2020).
  33. Yuan, Q.; McIntyre, N.; Wu, Y.; Liu, Y.; Liu, Y. Towards greater socio-economic equality in allocation of wastewater discharge permits in China based on the weighted Gini coefficient. Resour. Conserv. Recycl. 2017, 127, 196–205. [Google Scholar] [CrossRef]
  34. Yang, G.; Fukuyama, H.; Song, Y. Estimating capacity utilization of Chinese manufacturing industries. Socio-Econ. Plan. Sci. 2019, 67, 94–110. [Google Scholar] [CrossRef]
  35. Lubetsky, J.; Steiner, B.A.; Lanza, R. 2006 Intergovernmental Panel on Climate Change (IPCC) Guidelines for National Greenhouse Gas Inventories; IPCC: Geneva, Switzerland, 2006. [Google Scholar]
  36. National Bureau of Statistics of China. China Statistical Yearbook 2001–2017; China Statistical Press: Beijing, China, 2017.
  37. National Bureau of Statistics of China. China Energy Statistical Yearbook 2001–2017; China Statistical Press: Beijing, China, 2017.
  38. Yu, A.; Lin, X.; Zhang, Y.; Jiang, X.; Peng, L. Analysis of driving factors and allocation of carbon emission allowance in China. Sci. Total. Environ. 2019, 673, 74–82. [Google Scholar] [CrossRef]
  39. Duan, F.; Wang, Y.; Wang, Y.; Zhao, H. Estimation of marginal abatement costs of CO2 in Chinese provinces under 2020 carbon emission rights allocation: 2005–2020. Environ. Sci. Pollut. Res. Int. 2018, 25, 24445–24468. [Google Scholar] [CrossRef] [PubMed]
  40. Shan, H. Reestimating the capital stock of China: 1952–2006. J. Quant. Tech. Econ. 2008, 10, 17–31. [Google Scholar]
  41. Gerbeti, A.; Tullio, F. CO2 nei Beni e Competitività Industriale Europea; Delfino: Milano, Italy, 2014. [Google Scholar]
  42. Gerbeti, A. CO2 in Goods. In Green Fiscal Reform for a Sustainable Future: Reform, Innovation and Renewable Energy; Cheltenham Edward Elgar Publishing: Cheltenham, UK, 2016. [Google Scholar]
Figure 1. The method flowchart used in this study.
Sustainability 12 08457 g001
Figure 2. Lorenz curve and Gini coefficient diagram.
Sustainability 12 08457 g002
Figure 3. The result of quota allocation based on the principle of fairness.
Sustainability 12 08457 g003
Figure 4. The zero-sum gains–data envelopment analysis (ZSG–DEA) model adjustment process.
Sustainability 12 08457 g004
Figure 5. Quota allocation scheme of initial quota scheme.
Sustainability 12 08457 g005
Figure 6. The quota allocation scheme of secondary allocation quota scheme improvement.
Sustainability 12 08457 g006
Figure 7. (a) Marginal abatement cost and the total abatement cost of the initial quota scheme. (b) Marginal abatement cost and the total abatement cost of the secondary allocation quota scheme.
Sustainability 12 08457 g007
Table 1. The dimensions, indexes, and interpretation of the principle of fairness.
DimensionIndicatorInterpretation
Emission reduction capacityPer capita GDPThe greater the per capita GDP, the stronger the carbon reduction capacity of the province, and the less carbon quota should be allocated.
Emission reduction responsibilityHistorical cumulative carbon emissionsThe greater the historical cumulative carbon emissions of the province, the more carbon quotas should be allocated in order to maintain its development.
Emission reduction potentialCarbon emissions per unit of industrial added valueThe greater the carbon emissions per unit of industrial added value, the greater the emission reduction potential, and the less carbon quotas should be allocated.
Residents’ welfareEmploymentThe greater the number of people employed in the province, the better the welfare given the residents, and the more carbon quotas should be allocated.
Table 2. The main parameters used to calculate carbon emissions.
CoalCokeCrude OilGasolineKeroseneDiesel OilFuel OilNatural Gas
Carbon Dioxide Emission Coefficient1.90032.86043.02022.92523.01793.09593.17052.1622
Carbon Oxidation Rate0.940.930.980.980.980.980.980.99
Table 3. The division of the eastern, central, and western regions.
AreaProvinces
Eastern regionBeijing, Tianjin, Hebei, Liaoning, Shanghai, Jiangsu, Zhejiang, Fujian, Shandong, Guangdong, Hainan
Central regionShanxi, Inner Mongolia, Jilin, Heilongjiang, Anhui, Jiangxi, Henan, Hubei, Hunan, Guangxi
Western regionChongqing, Sichuan, Guizhou, Yunnan, Shaanxi, Gansu, Qinghai, Ningxia, Xinjiang
Table 4. Regional quota and cost reduction.
AreaPreliminary Allocation SchemeOptimization Scheme of ZSG–DEA
QuotaTotal Abatement CostQuotaTotal Abatement Cost
Eastern region8828.512639.519504.90−416.03
Central region7716.91−1006.637534.10−755.98
Western region4892.67−1391.494399.09−753.77
Country21,438.09241.3921,438.09−1925.79
Table 5. The multi-scenario quota and total abatement costs under Regional Cooperation.
Area{E,C,W}{E},{C},{W}{E},{C,W}{E,C}{W}{E,W}{C}
QuotaTotal Abatement CostQuotaTotal Abatement CostQuotaTotal Abatement CostQuotaTotal Abatement CostQuotaTotal Abatement Cost
E9505−41688292050882920509250479938013
C7534−7567717−11117986−16567296−3387717−1111
W4399−7544893−17034624−12604893−17034341−646
Country21438−192621438−76521438−86621438−156221438−1744
Table 6. The distribution results of quota under different scenarios.
Scenario 1 (Economic Growth Rate = 5.5%)Scenario 2 (Economic Growth Rate = 6%)Scenario 3 (Economic Growth Rate = 6.5%)
InitialSecondaryInitialSecondaryInitialSecondary
Quota(MtCO2)Eastern8263.048896.108828.519504.909429.7410152.19
Central7222.647051.547716.917534.108242.448047.18
Western4579.294117.324892.674399.095225.864698.67
Country20,064.9620,064.9621,438.0921,438.0922,898.0422,898.04
Total abatement cost (Billion) 225.93 −1802.44 241.39−1925.79257.83−2056.94
Publisher’s Note: MDPI stays neutral with regard to jurisdictional claims in published maps and institutional affiliations.

