Article

Postcollection Separation of Plastic Recycling and Design-For-Recycling as Solutions to Low Cost-Effectiveness and Plastic Debris

School of Business and Economics and Tinbergen Institute, Vrije Universiteit Amsterdam, 1081 HV Amsterdam, The Netherlands
Sustainability 2020, 12(20), 8415; https://doi.org/10.3390/su12208415
Submission received: 1 September 2020 / Revised: 9 October 2020 / Accepted: 10 October 2020 / Published: 13 October 2020
(This article belongs to the Special Issue Recycling and Sustainability of Plastics)

Abstract

:
In the Netherlands, plastic waste recycling is high on the policy agenda. Much effort is made to recycle, mostly by residents, who separate plastic waste at home. However, much of the separated waste is not recycled into new products. Substantial amounts are burned or even shipped to Asia. This leads to substantial plastic debris, as recent evidence has shown. Moreover, the cost-effectiveness of plastic recycling versus incineration is very low. Based on evidence from the north of the Netherlands, postcollection or mechanical separation can be a viable alternative as more useful plastics are separated and there are indications that different plastic streams are of higher polymeric purity. Furthermore, there is some circumstantial evidence that cost-effectiveness increases if postseparation is chosen. To avoid large streams of mixed plastics that are barely recyclable, it is important that further agreements with the packaging industry are made to phase out these mixed plastics and further increase the polymeric purity of different plastic waste streams.

1. Introduction

The European Union (EU) advocates a plastic (packaging) waste recycling rate of more than 55% by 2025. Currently, in the Netherlands, 52% of plastic (packaging) waste is registered as recycled, although this yield has been disputed as only approximately half is usable in the main recycled products (washed milled goods) [1]. Thus, even for the Netherlands, which has already invested heavily in recycling, it will be a challenge to become circular. In the Netherlands, the preferred solution to reach this target is to implement kerbside collection schemes or drop-off locations at nearby schools or shops. Based on a survey, plastic waste recycling by residents is practised in all EU capitals [2]. However, plastic waste separation by residents is expensive. Municipalities have to set up an infrastructure for plastic collection from residential properties. Therefore, the cost-effectiveness of plastic recycling—in terms of cost per tonne (1000 kg) of carbon dioxide (CO2) reduction—is low. Based on Dutch data, a saving of 1 t of CO2 through plastic recycling compared with incineration costs approximately €180 [3]. Alternatives such as wind energy or carbon capture and storage in the old natural gas fields in the North Sea are much cheaper [3].
One serious problem of household separation of plastic waste is low quality [1,4]. Plastic waste is very heterogeneous as it contains many different polymers and product types, and it is often contaminated. In the Netherlands, 25–30% of home-separated plastic waste is burned and most of the low-quality mixed plastics are exported out of sight, mostly to underdeveloped countries in Asia. Based on recent evidence, there is a significant leakage of European plastic waste into the ocean [5]. According to estimates, the yearly amount of exported polyethylene (PE) entering the ocean is 83,187 t [5]. This information provides pertinent indications of the efficacy and risks of current European plastic waste management practices. Moreover, China’s ban on plastic waste seems to have worsened this practice.
Notably, since 2013, some municipalities in the north of the Netherlands have invested in the postcollection or mechanical separation of plastic waste (hereafter ‘postseparation’) [6]. Plastics are collected with mixed waste streams and separated using infrared and film-grabber techniques in a factory [7]. Based on these pilot schemes, empirical evidence shows that more plastic waste per inhabitant is recycled and the main recycling products are of higher polymeric purity [4,6]. Moreover, the costs of recycling plastic waste using postseparation seem to be lower than for home separation. Although an exact business case for the Netherlands is still lacking, there is circumstantial evidence that costs for postseparation are substantially lower. Therefore, cost-effectiveness will increase if postseparation is chosen. In this paper, assuming full capacity and using data from a consultancy firm, the (capital and operations) costs per tonne are €70 to €150, which is much lower than home separation [8].
Therefore, in the Netherlands, the postseparation of plastic waste has become a serious alternative to home separation as shown by the recent opening of two large new mechanical postseparation facilities in Amsterdam and Rotterdam. Importantly, postseparation avoids the separate collection of low-quality mixed plastics, which are regularly burned. However, further steps are needed to lower the share of mixed plastics, which cannot be properly recycled, and of which substantial quantities are exported to Asia. Currently, relatively large PE flexible film sorts are categorised mostly as mixed plastics [1]. Therefore, multiple improvements will be needed with regards to packaging design to lower the polymeric contamination of recycled plastics and reduce shipment to Asia. This should be supported by fee differentiation by the Dutch green dot organisation in charge of implementing European product responsibility (‘Afvalfonds’) [9].
The intention of the paper is not to present new data, but rather to give a policy perspective on plastic recycling based on earlier data research. Therefore, the paper is organised as follows. Section 2 contains facts and figures. Section 2.1 provides an overview of plastic recycling in the Netherlands [6]. In Section 2.2, a cost-effectiveness analysis of incineration versus the recycling of plastic waste is presented [3]. In Section 2.3, I consider whether Dutch plastic waste recycling is a pathway to ocean debris of plastic waste. The data in this section are based on [5]. In Section 3, I offer this policy perspective of a combination of postseparation and design-for-recycling. Although most empirical evidence is based on the Netherlands and the material composition is more specific to the region of the Gooi and Vecht area, it is of interest to other countries as well. Finally, Section 4 contains some conclusions and final thoughts.

2. Facts and Figures

2.1. Plastic Recycling in the Netherlands

The officially reported Dutch plastic (packaging) waste recycling yield increased from 47% in 2013 to 52% in 2018. The net recycling yield is lower as the net amount of plastic packaging in the main recycled products is lower and substantial amounts are exported outside the Netherlands [1,4]. There are large differences in plastic recycling or separation between Dutch municipalities. In 2013–2014, the four largest cities in the Netherlands (i.e., Amsterdam, the Hague, Rotterdam, and Utrecht) separated on average 1 to 2 kg per inhabitant per year, while some rural municipalities collected 30 kg per inhabitant yearly [6].
In Table 1, the share of the different separation systems in 2013 and 2014 is given. I distinguish between three separation systems (postcollection or mechanical separation, kerbside or door-to-door collection, and the drop-off or bring system), and combinations are possible.
Notably, 11% of Dutch municipalities have only postseparation for their plastic waste. In approximately 30% of municipalities, there is a system of only the kerbside collection of plastic waste, and approximately 20% of Dutch municipalities have a system of only drop-off locations. Some of these municipalities combine different systems. The most important combination comprises the kerbside collection and drop-off locations, accounting for 23–24% of municipalities. A small number of municipalities combine postseparation with kerbside collection (4–7%) or with drop-off separation (1–4%), or even with both (4–7%). Therefore, two-thirds of Dutch municipalities have implemented a kerbside system with either minicontainers or collection bags. On average, plastic waste is collected at the kerbside either biweekly or triweekly [10].
Municipalities with only postseparation succeed in separating 8.4 kg more plastic waste per inhabitant than those municipalities without any plastic waste separation [6]. Collection by only drop-off locations is an ineffective strategy to increase the amount of recycled plastic waste; however, drop-off locations lead to higher-quality plastic waste suitable for recycling. As it is known from the literature, introducing a unit-based pricing (UBP) system is effective in increasing recyclables such as plastics [11]. The combination of kerbside collection with a UBP system gives an extra amount of 7.6 kg—somewhat less than postseparation [6]. Remarkably, in 2014, an increasing number of municipalities went for a combination of postcollection and kerbside collection. However, the extra quantity of separated plastic was minimal, and thus such a combination is not advisable as it will approximately double the cost [6].
In the Netherlands, increasing municipalities are implementing a UBP system, mostly in combination with kerbside collection. It is possible to distinguish between four different UBP systems—volume-, frequency-, bag-, and weight-based—with different incentive structures [11]. The volume-based programme allows households to choose between different volumes of a collection bin. In the frequency-based system, the household pays for the number of times the bin is presented at the kerbside. In the bag-based system, households buy a special bag with specific marks. In the weight-based system, waste is priced per kilogram. Therefore, the most effective in reducing waste is the weight-based system, followed by the bag-based and frequency-based systems [11]. By 2017, 45% of all Dutch municipalities had implemented a UBP system, this share having risen substantially from 16% in 1999 [12]. However, UBP systems can have some adverse effects, such as illegal or illicit dumping or waste tourism. Based on data for Charlottesville (VA, USA), it has been suggested that illegal dumping may account for 28% to 43% of the reduction in waste [13]. However, the impact of waste fees on illegal disposal or waste tourism is still open to debate, as data are not readily available.
In recent years, the frequency of collecting plastic waste has increased. Since 2015, most Dutch municipalities have combined the home separation of plastic waste with metal packaging (such as tins and cans) and beverage cartons (plastic, metal, and drink (PMD)). In other European (capital) cities, the cocollection of packaging materials is quite common [2]. Therefore, recent data for plastic separation are harder to collect. In most municipalities, PMD waste are collected every two or three weeks. The effect of increasing the frequency of collection on the amount of plastic waste is rather small and barely cost-effective. Based on 2013–2014 data, there is a positive relationship between the frequency of collection and the quantity of collected plastic waste. However, this effect is rather small. If plastic waste is collected for kerbside only once a week instead of every two weeks, the amount of plastic waste increases by 2.7–3.9 kg [6] (p. 134).
Some environmental groups stress the importance of separation by residents as it can generate awareness. The UBP of unsorted waste in this respect can be important as it creates an incentive that may lead consumers to buy goods with less packaging. However, UBP can also have a negative effect on the motivation of people to sort waste. In the literature, there are increasing studies showing that for some people, intrinsic motivation to sort waste erodes due to these price incentives. For example, in an empirical investigation for a town in Lofoten in Norway, half of the inhabitants behave in that way [14]. Using Dutch data, the interaction effect of the postseparation of plastic recycling with UBP of unsorted waste can be tested [4]. Estimations show that this effect is not significant [6] (p. 134). This indicates that the awareness effect of such a system on the reduction of plastic waste is nonexistent on average.

2.2. Cost-Effectiveness of Plastic Recycling vs. Incineration

In the Netherlands, costs for the collection, separation, sorting, and recycling of (packaging) plastic waste are reimbursed by the (packaging) industry. Afvalfonds is in charge of this reimbursement. In 2015, Dutch municipalities received a financial contribution of €677 per tonne (/t) for separated plastic waste for its collection, processing, and exploitation. This is higher than the compensation awarded in Belgium, Italy, Portugal, and France, but lower than in Germany [15].
In [3], a cost-effectiveness analysis of the recycling of plastic waste compared with the more conventional incineration of plastic waste, using 2015 data for the Netherlands, is given. Both options have unique revenues and costs. The main benefit of plastic recycling is the avoidance of CO2 emissions that otherwise would occur during incineration and from the production of virgin (new) plastic material. Notably, the focus is on CO2 as Dutch waste-to-energy plants employ state-of-the-art technology, which filters out most air pollutants such as sulphur dioxide (SO2) and nitrogen oxide (NOx) [3]. This is the result of additional national environmental standards, in excess of minimum European requirements. At the same time, there are significant costs involved in recycling plastic waste as compensated by Afvalfonds. The benefit of plastic waste incineration is the energy that can be recovered, which reduces emissions in the regular energy production sector by displacing production. The main cost associated with incineration is the requirement for a waste-to-energy plant with the associated capital investment. Calculating the costs and revenues of both plastic waste treatment options and comparing the results leads to an implicit CO2 abatement price of €178/t of CO2 in the case of plastic recycling [3]. The cost-effectiveness of plastic recycling—in terms of cost per tonne of CO2 reduction—is low (Figure 1).
Thus, a saving of 1 t of CO2 through plastic recycling costs €178 in the Netherlands—far higher than alternatives for saving CO2, such as wind energy (€30) or carbon capture and storage in old natural gas fields in the North Sea (€80 to €90) [3]. Furthermore, this implicit price is much higher than current (or historic) EU Emissions Trading System (ETS) prices. During early 2016, the market price for CO2 emissions in the ETS was approximately €6/t. This low price can be explained by the surplus of rights after the second trading period [16]. Therefore, the ETS was updated to June 2019 after the surplus was limited. Notably, in terms of CO2 emissions, the benefit of plastic recycling compared to plastic incineration is very modest, i.e., 0.1% to 0.15% of total CO2 emissions. To put this into perspective, it would take an average Dutch household 60 years of plastic separation to compensate for the CO2 emissions of a single flight (in economy class) from Amsterdam to Los Angeles [3].
In [2], it is assumed that the opportunity emissions from recycling plastic waste are based on the average energy mix in the Netherlands. Therefore, in a sensitivity analysis, it is assumed that the replacement energy is renewable energy with no CO2 emissions (i.e., fully CO2 neutral). In this scenario, the cost-effectiveness decreases from €178/t to €106/t of CO2. Although the decrease is substantial, the implicit CO2 price remains higher than for other viable alternatives. In addition, alternative assumptions of lower collection costs and a higher price of secondary plastics are examined, and the conclusion of low cost-effectiveness is robust [3].
In [2], 1 t of mixed plastic waste is based on the mass balance of separated plastic waste from households. This mass balance is mostly due to the home separation of plastic waste as, in 2015, only 7% of the Dutch population (11% of the municipalities) did not have home separation. Importantly, this source is more polluted than separated plastics from businesses. The recycling rate for this collected mixed plastic is 75%, meaning that 25% of the collected household plastic is still used for energy recovery. Furthermore, based on actual price data and the household plastic mix, the value of recycled plastic waste that is lost due to incineration is €495/t. Taking into account current evidence, it seems that the cost-effectiveness of plastic recycling versus incineration is even worse. First, based on evidence from home-separated PMD from municipalities in the Gooi and Vecht area (an urban area around Hilversum, in the centre of the Netherlands) in 2018, the residue was 31% [17], which was 6% higher than in [3]. Second, due to the 2020 coronavirus (COVID-19) crisis, the price for secondary plastics has dropped dramatically, making recycling an even worse option compared to incineration.
In Table 2, plastic polymers and other materials of the PMD stream from the municipalities in the Gooi and Vecht area are given for 2018.
The authors of [18] compared different polymer products and found that the polymers PET 90/10 and some PP and HDPE, mainly bottles, have good opportunities to be recycled. For other polymers and beverage cartons, there are complex issues and, in general, the effectiveness of recycling these is low and poor. For mixed plastics, such as plastic trays, films, pots, and tubs, this is much more difficult or sometimes impossible.
It should be noted that the main recycled products made of sorted polyethylene terephthalate (PET), PE, and polypropylene (PP) predominantly contain the desired polymer of the intended packaging. In principle, they can be recycled and sent to Dutch recycling companies. However, the recycled products made from the sorted products of mixed plastics mostly contain polymers not intended for packaging, which are not easy to recycle. Interestingly, no company in the Netherlands can deal with recycling mixed plastics. Instead, the mixed plastics of the Gooi and Vecht area are exported to Germany [17].

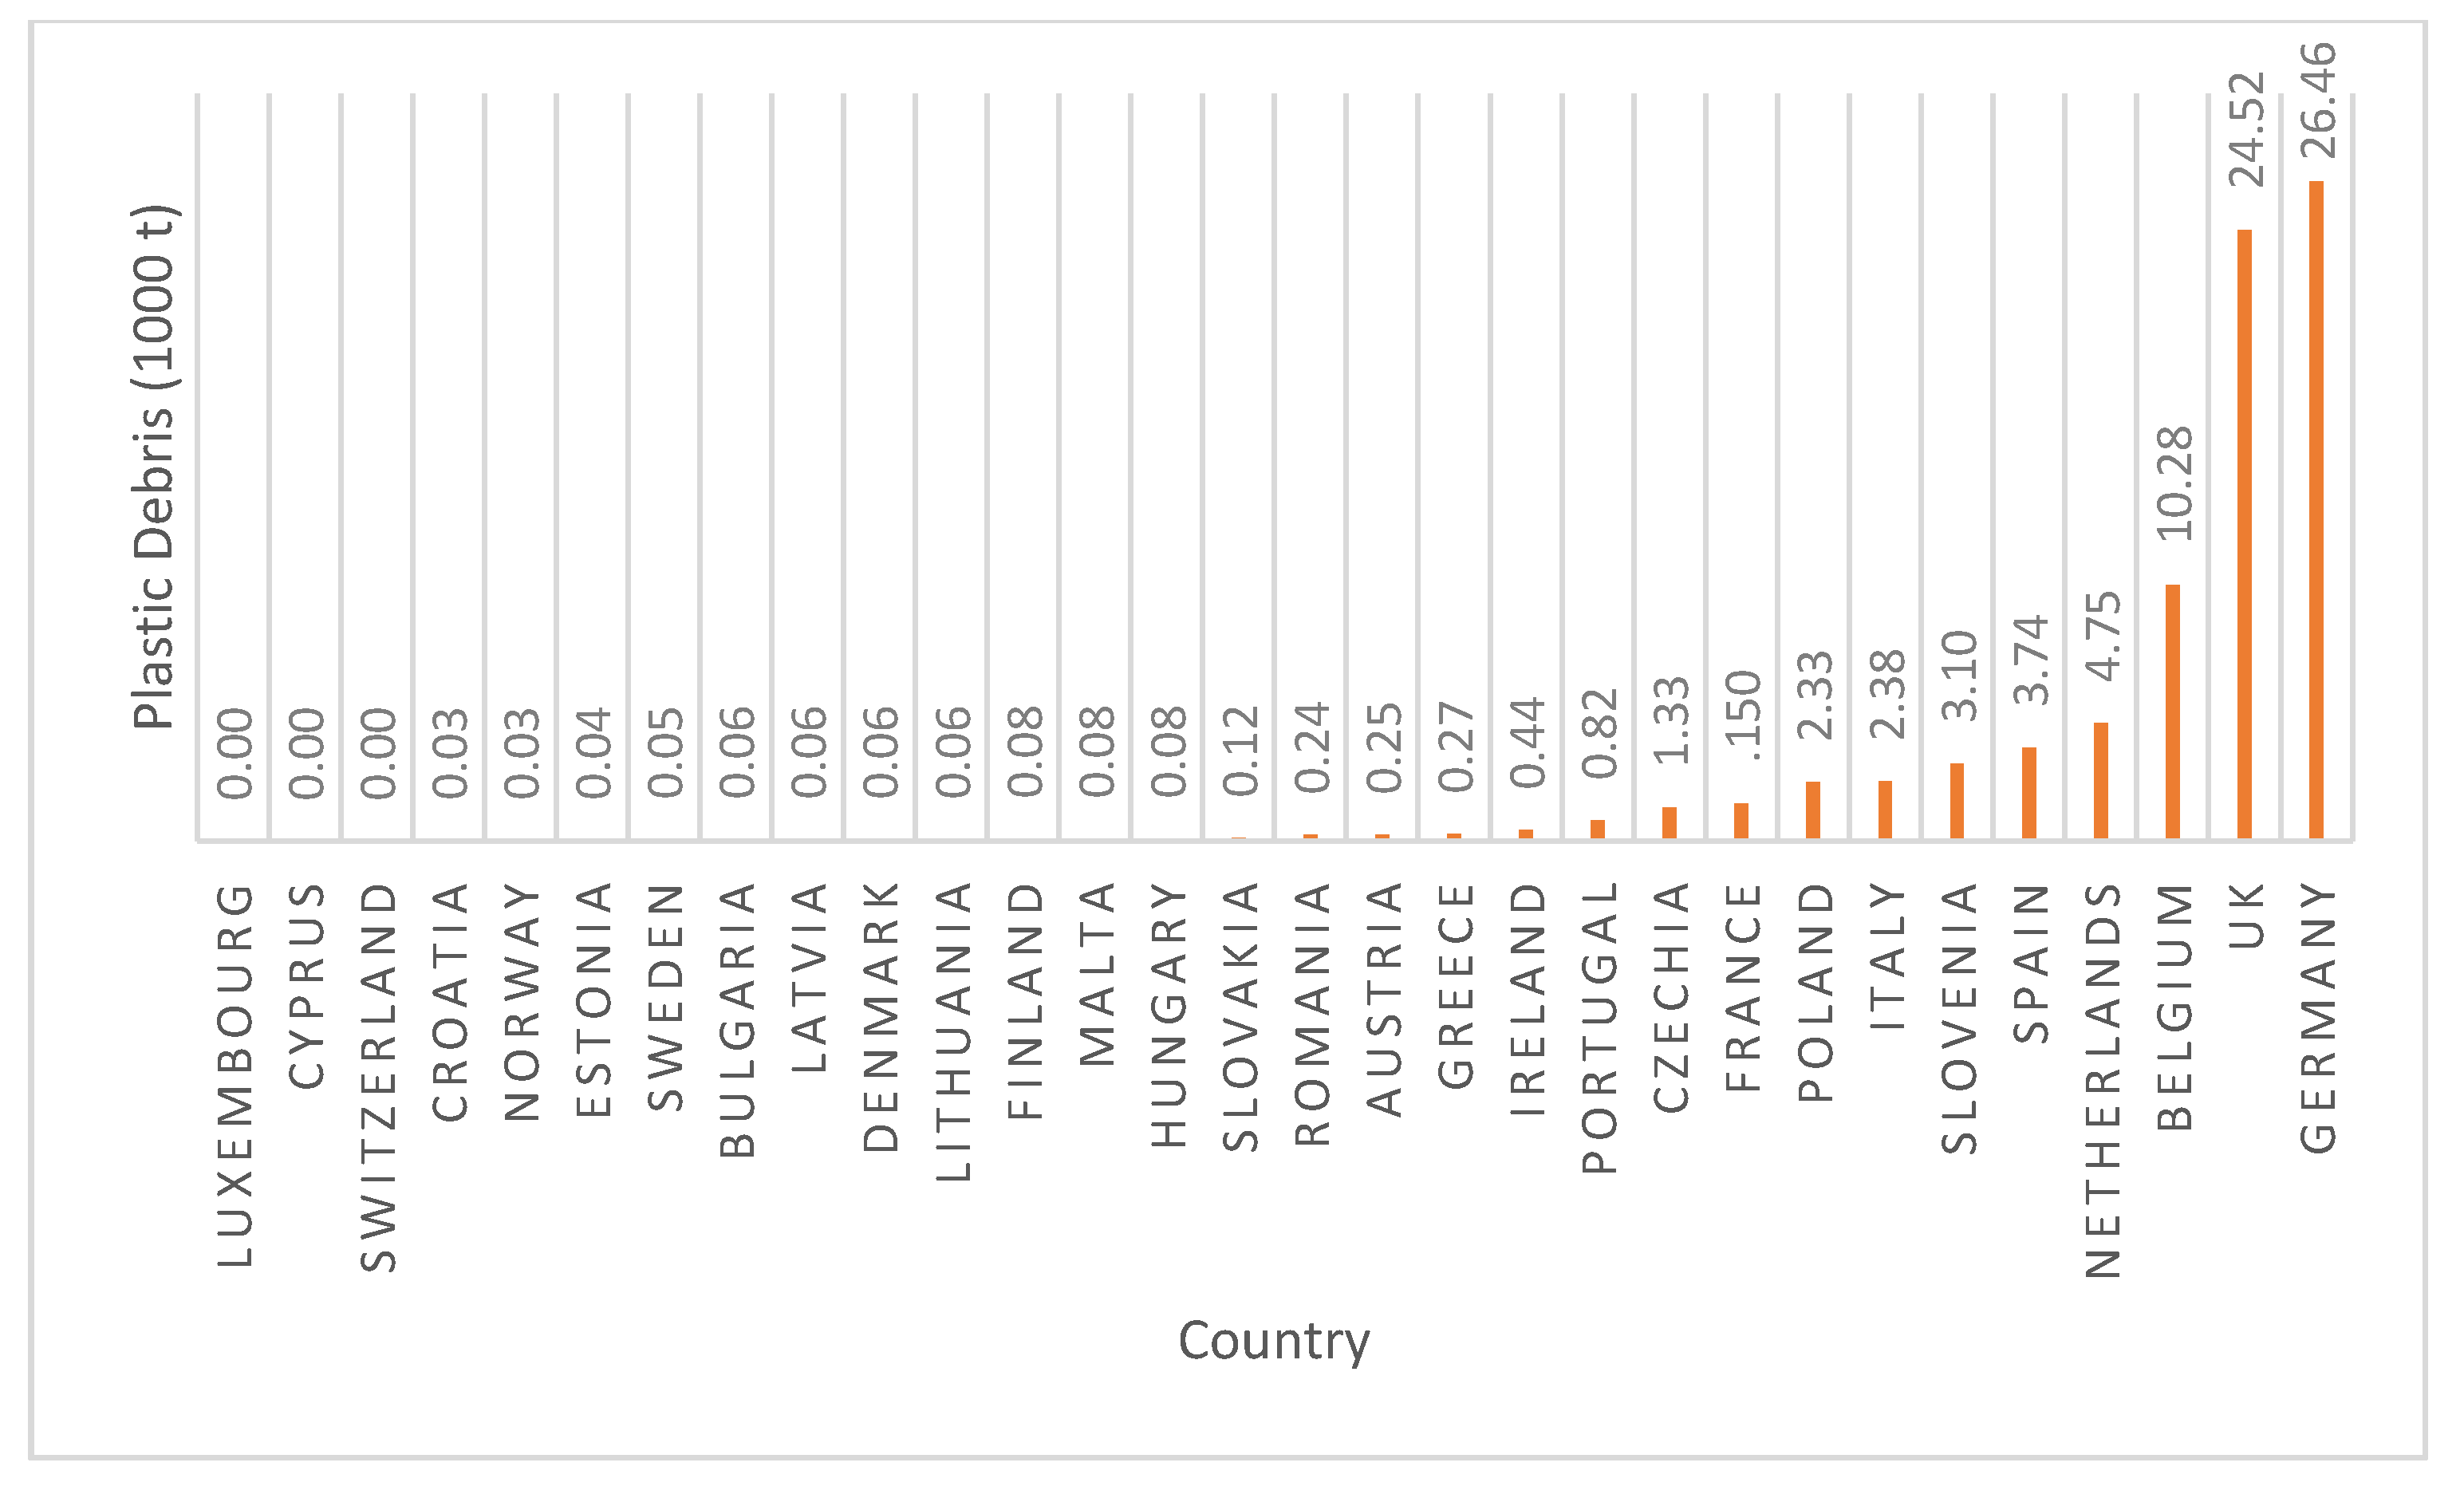
2.3. Recycling as a Pathway to Plastic Debris in the Ocean

Mixed plastics consist mainly of polyethylene (PE) and other plastics, which makes them difficult to recycle. PE is one of the most common types of plastic packaging. While an increasing share of post-consumer-separated plastic waste from Europe is collected for recycling, in 2017, 46% of separated PE waste was exported out of the source country, including the intra-EU trade [5]. Integrated data are used for EU+ (i.e., EU28, Norway, and Switzerland) on PE waste flows in 2017 from the United Nations Comtrade Database, an open repository providing detailed international trade data. Much of this exported European plastic goes to Asia. For example, for the Netherlands, 50% of PE is exported to Asia. Table 3 gives the export destinations and quantities for Dutch polymers of PE.
The most importers for Dutch PE are China, followed by Germany, Belgium, and India. In [5], it is shown that if waste is exported from a high gross domestic product (GDP) country to be recycled in a lower-income country, mostly in Asia, there is significant potential for ‘leakage’ into the environment. It is estimated that 83,187 t, or 3% of exported European PE in 2017, ended up in the sea, indicating the pathway for plastic debris entering the oceans. Data uncertainty is reflected in the range of 32,115–180,558 t [5]. Figure 2 shows the leakage from EU28, Norway, and Switzerland (ordered by increasing ocean debris).
The country with the highest tonnage of PE ending up as ocean debris is Germany with 26.46 kt, followed by the United Kingdom (24.52), Belgium (10.28), and the Netherlands (4.75). The countries with (almost) no ocean debris are Luxembourg, Cyprus, and Switzerland (Figure 2).
Importantly, the data are for 2017, and in 2018, China introduced a ban on the import of plastic waste. However, European municipalities adapted to China’s ban and early indications show that large quantities of plastic waste are being diverted to South East Asia [5]. These lower-income countries are likely to have poorer waste management procedures than China. For example, if plastic waste is shipped to Bangladesh instead, the percentage of plastic debris in the ocean increases from 18.6% to 21.2% in the average scenario [5]. Therefore, the potential for plastic exports from Europe to end up as ocean debris is likely to increase following the ban.

3. How to Bring about Less Plastic Debris and a More Cost-Effective System

In this section, some solutions are discussed to lower plastic debris and achieve a more cost-effective system for plastic recycling.

3.1. Postseparation Is a Serious Alternative Resulting in Better Quality of Separated Plastics

A serious problem of home separation is the low quality of plastic waste. Therefore, an important question is whether postseparation can yield a higher quality of recycled plastics. Importantly, there is some evidence that the quality is better in the case of postseparation than with home separation, as reported previously in a detailed material flow analysis [19]. For postseparation, the composition of a 2014 sample from Omrin and Attero has been taken. For home separation, the composition of 26 different Dutch municipalities between 2009 and 2013 has been used. Recycled plastics often contain polymeric contaminants that form immiscible blends and are difficult to recycle. In Figure 3, the polymer composition and contaminants of polymers and other forms of pollution are given for home separation (HS) and postseparation (PS) for the main plastic streams of PET, PE, PP, film, and mixed plastics [19].
In Figure 3, it is shown that postseparation generates lower polymeric contamination of sorted plastics, such as PET, PE, PP, and other plastic streams, than home separation. On the other hand, the residual waste content from postseparation is slightly higher than home separation. In recent years, many Dutch municipalities have changed from plastic collection to PMD cocollection, which has resulted in more residual waste in the collected material. Thus, the purity of recycling different plastic types increases if postseparation is chosen. The decrease in the contamination of PE and PP is an advantage during recycling, highlighting the importance of a homogenous PE and PP waste stream for closed-loop recycling [20]. Interestingly, in the north, or the province Friesland of the Netherlands, where postseparation has been in place since 2013, a joint project between Omrin, Philips, and Morsinkhoff (labelled the National Test Centre Circular Plastics (NTCP)) is able to produce granulates of postseparated PP of such quality as virgin material for use in high-end consumer products [21]. The tensile strength of all the reprocessed PP samples measured by NHL/Stenden (i.e., a university in Friesland) lay around 20 MPa, which is at the lower end of what is typical for virgin PP [20,21].
In addition, there are indications that the contamination of home separation has increased substantially after the introduction of PMD cocollection. In a lab in Wijster, the composition of 278 samples of home-separated PMD were analysed [22]. Remarkably, 70% of the samples did not meet the quality threshold of 15% contamination agreed upon between the association of municipalities and Afvalfonds in 2019. Some of the samples were even above 40% contamination. The municipalities with such contamination will get a lower fee and thus the implicit price for saving 1 t of CO2 becomes more than €180. Interestingly, municipalities with a bag-based system are less contaminated than those with a container-based system. Nevertheless, not many Dutch municipalities use this system as there are many disadvantages [11]. The most important disadvantages are that Dutch legislation limits the number of bags carried per waste-collection employee, and that birds such as gulls and ravens cause a nuisance by picking over the bags’ contents [11]. To conclude, the contamination of home-separated glass, paper/carton, plastic, and metals has increased in recent years, and the quality deficit with postseparation has increased.

3.2. Postseparation Leads to Lower Costs as Well

It is important to take a closer look at the collection costs of plastic waste through home separation, as these costs dominate the costs of plastic waste recycling. Two-thirds of the total Afvalfonds remuneration fee are related to collection and transportation costs [3]. Many Dutch municipalities have an expensive infrastructure for collecting plastic waste or PMD every two weeks [10]—costs that are avoided by the postseparation of plastic waste. Unfortunately, I do not have an accurate estimation of the cost of the production process of postseparation, but there are indications that it is cheaper and the cost-effectiveness is higher if postseparation is chosen. In 2017, an agreement was made between Afvalfonds and the waste-to-energy plant (AEB) for the metropole of Amsterdam. AEB were to build a new plant for industrial separation or postseparation of plastic waste. Importantly, in their press release, they announced: ‘That means lower fees, and long-term security’ [6]. In addition, there are currently six postseparation facilities for PMD in the Netherlands (Table 4), some of which are only recently operational. In Wijster (Drenthe), there are two separate facilities.
The associated annual costs related to the capital and maintenance expenditure of a postseparation facility are €20 million [8]. Assuming a full capacity and the range given in Table 4, the costs per tonne are €70 to €150, which are much lower than the Afvalfonds fee. Of course, full capacity is only an assumption, and for Amsterdam, as they have chosen a combination of postseparation and home separation, this is not the case yet. However, due to problems with its waste management company, AEB, Amsterdam later announced it would change to only postseparation in 2021.

3.3. Design-For-Recycling

There is also a need for design-for-recycling. Improvements will be needed with regards to packaging design, as well as the diversity of plastic packaging definitions. Importantly, the share of mixed plastics must be lowered and the share of nonrecyclable plastic packaging has to be reduced. Their presence in the collected materials results in a need for a mixed sorted product. If the proportion of nonrecyclable packaging is reduced, less mixed plastic would be produced, and less good recyclable plastic PE and PP packaging would be lost to this category [1,4]. Moreover, the export of these ‘bad’ plastics would become lower as well, and the probability of plastic debris would decrease. Additionally, the design of ‘good recyclable’ plastic packaging also needs to be improved since, within these good recyclable packaging designs, components are still present that cause polymeric contamination [1]. In addition, (packaging) companies pay a (fixed) fee to the fund according to the level of plastic production. Since 2019, there have been two tariffs: one for normal plastics and a lower tariff for good recyclable plastics [9]. This is a good first step, but a further differentiation of tariffs is needed to phase out mixed plastics. For smaller companies, there is a fixed contribution independent of their plastic production.
An obstacle to design-for-recycling is the recently announced, so-called EU-wide tax on nonrecycled plastic waste. The European Commission is proposing a tax of €0.80/kg of plastic waste burned. However, as it is related to the European targets of separation and not real recycling, the downcycling of plastic waste and the issue of plastic waste will be intensified, particularly in relation to its impact on oceans and marine wildlife. Therefore, this tax will only be counterproductive [23].

4. Discussion and Conclusions

In the EU, in general, residents separate trash and much is recycled. Recycling can be an important way to recover valuable materials while reducing greenhouse gas emissions and conserving significant amounts of energy and water. However, the recycling of plastic waste poses a serious problem. Of the 272 kt of plastic waste collected in the Netherlands in 2018 (52% of packaging plastic launched on the market), less than half was recycled [1,24]. Mixed plastics cannot be recycled in a proper way and other polymers, PET eventually excluded, degrade quickly and cannot be used in the same way as virgin plastics. Moreover, separating plastic waste by residents is very expensive. Therefore, if the same amount of money now paid on so-called plastic recycling is spent on wind energy six times as much, greenhouse gas emissions can be saved.
The postseparation of plastic waste is a serious alternative to home separation as Dutch empirical evidence shows that more plastic waste per inhabitant is recycled, and the quality is higher [6]. In recent years, plastics have been mixed with metal (packaging) and beverage cartons and, consequently, the quality of separated plastics has worsened [22]. However, strict separate collection (different types of plastics, metals, and beverage cartons in one bin) seems to be an unviable alternative and cost-effectiveness will deteriorate even more. Moreover, the costs of recycling plastic waste using postseparation seems lower than with home separation. Thus, the cost-effectiveness of plastic recycling seems higher if postseparation is chosen, although an accurate estimation is needed.
Due to this evidence and taking into account recent innovations in separating machines, an increasing number of Dutch municipalities are changing to postseparation, or have announced to do so, like Amsterdam and Utrecht. Interestingly, for Rotterdam, which stopped home separation at the end of 2019, there is circumstantial evidence that the amount of plastic waste collected per inhabitant is ten times higher with postseparation. In cities where it is more difficult to store recyclables at home, it seems advisable; however, even for small municipalities, postseparation has its advantages. Recently, an increasing number of small- and medium-sized municipalities have changed to postseparation as well. An alternative model is home separation in combination with UBP, although the pricing of waste can have serious drawbacks such as illegal or illicit dumping or problems with bags [12]. Circumstantial evidence in large cities such as Arnhem, where UBP was recently implemented, shows that dumping increased substantially [25]. This in line with the literature showing that intrinsic motivation to sort waste can erode due to these price incentives. In the Netherlands, there is evidence that not only the quality of plastic waste deteriorates but textile and biowaste due to the introduction of UBP systems too [26].
Importantly, on top of postseparation, further attention should be paid to design-for-recycling strategies. Plastic waste contains a relatively large PE flexible film category, which is now sorted as mixed plastic waste and of which a substantial part is exported to Asia. While an increasing share of postconsumer plastic waste from Europe is collected for recycling, due to the plastic waste import ban by China, a significant amount of plastic waste ends up as plastic debris in the ocean [5]. Therefore, an agenda of postseparation should be combined with lowering the amount of mixed plastics. Fee differentiation and a ban on ‘bad’ plastics are also important to attain a more closed-loop recycling system. Cooperation between different actors can be helpful too, as the experience in the Friesland province is showing. Overall, this should lead to a futuristic scenario with the postseparation of plastic waste, no plastic debris, and recycling of plastic waste in consumer products and other applications of plastic.

Funding

This research received no external funding.

Acknowledgments

I would like to thank George Bishop for sending me an Excel spreadsheet containing the data of their appendix. I would like to thank Hugo Bellaart for sending me information on PMD production of the Gooi and Vecht area and further comments, also from Elbert Dijkgraaf, on an earlier version. I also would like to thank John Vernooi for sending me information on the project in Friesland [20]. The views in the article are the author’s own.

Conflicts of Interest

The author declares no conflict of interest.

References

  1. Brouwer, M.; Picuno, C.; Thoden van Velzen, E.U.; Kucha, K.; De Meester, S.; Rageart, K. The impact of collection portfolio expansion on key performance indicators of the Dutch recycling system for Post-Consumer Plastic Packaging Waste, a comparison between 2014 and 2017. Waste Manag. 2019, 100, 112–121. [Google Scholar] [PubMed]
  2. Seyring, N.; Dollhofer, M.; Weissenbacher, J.; Bakas, I.; McKinnon, D. Assessment of collection schemes for packaging and other recyclable waste in European Union-28 Member States and capital cities. Waste Manag. Res. 2016, 34, 947–956. [Google Scholar] [CrossRef] [PubMed]
  3. Gradus, R.H.J.M.; Nillesen, P.H.L.; Dijkgraaf, E.; Koppen, R.J.van. A cost-effectiveness analysis for incineration or recycling of Dutch household plastic waste. Ecol. Econ. 2017, 135, 22–28. [Google Scholar] [CrossRef]
  4. Brouwer, M.; Thoden van Velzen, E.U.; Augustinus, A.; Soethoudt, H.; De Meester, S.; Rageart, K. Predictive model for the Dutch post-consumer plastic packaging recycling system and implications for the circular economy. Waste Manag. 2018, 71, 62–85. [Google Scholar] [CrossRef] [PubMed] [Green Version]
  5. Bishop, G.; Styles, D.; Lens, P.N.L. Recycling of European plastic is a pathway for plastic debris in the ocean. Environ. Int. 2020. [Google Scholar] [CrossRef] [PubMed]
  6. Dijkgraaf, E.; Gradus, R.H.J.M. Post separation of plastic waste: Better for the environment and lower collection costs? Environ. Resour. Econ. 2020, 77, 127–142. [Google Scholar]
  7. Feil, A.; Pretz, T.; Jansen, M.; Thoden van Velzen, E.U. Separate collection of plastic waste better than technical sorting from municipal solid waste? Waste Manag. Res. 2017, 35, 172–180. [Google Scholar] [CrossRef] [PubMed]
  8. JMA. Gemeente Hengelo: Evaluatie Afvalinzameling En Mogelijkheden Nascheiding; JMA (De Jonge Milieu Advies): Zeist, The Netherlands, 2019. [Google Scholar]
  9. Afvalfonds verpakkingen. Tariefdifferentiatie Kunststof. Available online: afvalfondsverpakkingen.nl/en/ (accessed on 22 July 2020).
  10. Dijkgraaf, E.; Gradus, R.H.J.M. An EU recycling target: What does the Dutch evidence tell us? Environ. Resour. Econ. 2017, 68, 501–526. [Google Scholar] [CrossRef] [Green Version]
  11. Dijkgraaf, E.; Gradus, R.H.J.M. Waste management in the Netherlands. In Handbook on Waste Management; Kinnaman, T., Takeuchi, K., Eds.; Edward Elgar Publishers: Cheltenham, UK, 2014; pp. 287–315. [Google Scholar]
  12. Gradus, R.H.J.M.; Dijkgraaf, E. Poorer and less political fragmented Dutch municipalities take tighter waste reduction decisions. Waste Manag. 2019, 88, 328–336. [Google Scholar] [CrossRef]
  13. Fullerton, D.; Kinnaman, T.C. Household responses to pricing garbage by the bag. Am. Econ. Rev. 1996, 86, 971–984. [Google Scholar]
  14. Heller, M.; Vatn, A. The divisive and disruptive effect of a weight-based waste fee. Ecol. Econ. 2017, 131, 275–285. [Google Scholar] [CrossRef]
  15. Marques, R.; da Cruz, N. Recycling and Extended Producer Responsibility: The European Experience; Ashgate: Dorchester, UK, 2015. [Google Scholar]
  16. Bel, G.; Joseph, S. Emissions abatement: Untangling the impacts of the EU ETS and the economic crisis. Energy Econ. 2015, 49, 531–539. [Google Scholar] [CrossRef]
  17. Gemeente Gooise Meren. Beantwoording Vragen Gemeenteraad over PMD Inzameling. Available online: https://bestuur.gooisemeren.nl/fileadmin/user_upload/191209_VVD_Beantwoording_vragen_Gooise_Meren_aan_AB_Regio_-_GAD.pdf (accessed on 29 July 2020).
  18. Hopewell, J.; Dvorak, R.; Kosior, E. Plastics recycling: Challenges and opportunities. Philos. Trans. R. Soc. B Biol. Sci. 2009, 364, 2115–2126. [Google Scholar] [CrossRef] [PubMed] [Green Version]
  19. Thoden van Velzen, E.U.; Brouwer, M.; Molenveld, K. White Paper: Kwaliteit Van Gerecyclede Huishoudelijke Kunststofverpakkingen; Wageningen University & Research: Wageningen, The Netherlands, 2018. [Google Scholar]
  20. Eriksen, M.K.; Christiansen, J.D.; Daugaard, A.E.; Astrup, T.F. Closing the loop for PET, PE and PP waste from households: Influence of material properties and product design for plastic recycling. Waste Manag. 2019, 100, 75–85. [Google Scholar]
  21. Dirksen, M.; van Zutphen, L.; Bergsma, A. Doorbraak in Recycling Van Kunststof Verpakkingen: Polypropyleen Uit Nascheiding Opgewerkt Tot Virgin Kwaliteit; Omrin: Heereveen, The Netherlands, 2020. [Google Scholar]
  22. Attero. Pmd: Er zit Meer Vervuiling in Dan je op Het Eerst Oog Ziet! Available online: attero.nl (accessed on 28 August 2020).
  23. Gradus, R.H.J.M.; Prast, H. EU’s Proposed Tax on Burning Plastic Waste is Counter-Productive. Available online: https://www.euractiv.com/section/energy-environment/opinion/eus-proposed-tax-on-burning-plastic-waste-is-counter-productive/ (accessed on 1 August 2020).
  24. Afvalfonds verpakkingen. Verpakkingen in De Circulaire Economie, Recycling Verpakkingen Nederland 2018; AfvalfondsVerpakkingen: Leidschendam-Voorburg, The Netherlands, 2019. [Google Scholar]
  25. Bruinsma, J. Zo Groot is de Rotzooi in Arnhemse Wijken: Troep Bij Bijna één op de Vijf Containers. De Gelderlander. Available online: https://www.gelderlander.nl/arnhem/zo-groot-is-de-rotzooi-in-arnhemse-wijken-troep-bij-bijna-een-op-de-vijf-containers~ad62e3ee/ (accessed on 7 October 2020).
  26. CPB. De Circulaire Economie Van Kunststof: Van Grondstoffen Tot Afval; CPB: Den Haag, The Netherlands, 2017. [Google Scholar]
Figure 1. Costs of CO2 reduction (in euros per tonne) for different options. Source: [3]; the EU Emissions Trading System (ETS) was updated to 2019/6 (i.e., € 25/t) after the surplus was limited.
Sustainability 12 08415 g001
Figure 2. Contribution (1000 t) to total ocean debris originating from EU+. Source: [5] (Supplementary Materials); author’s presentation.
Sustainability 12 08415 g002
Figure 3. Polymer contamination (%) and residual (%) of PET, PE, PP, film, and mixed plastics from home separation or postseparation. Source: [19] (Table 1).
Sustainability 12 08415 g003
Table 1. Share of municipalities (%) with different waste separation systems.
System20132014
Kerbside 32%28%
Kerbside and drop-off24%23%
Drop-off22%18%
Post11%11%
Post and kerbside4%7%
Post, kerbside, and drop-off4%7%
Post and drop-off1%4%
Source: [6] (Table 1).
Table 2. Different polymer, metal and drink production and its ability for recycling.
Plastic Polymer, etc.TonneShareEffectiveness of RecyclingDestination
PET 90/101724%HighNetherlands
PET trays812%ComplexNetherlands
HDPE1854%Complex, HDPE bottles, highNetherlands
LDPE49711%PoorNetherlands
PP2756%Potentially HighNetherlands
Mixed plastics127928%Very PoorGermany
Beverage cartons2295%Poorn.a.
Tin3127%Highn.a.
Aluminium862%Highn.a.
Residue143131%Incineratorn.a.
Source: [18] with author’s interpretation, for the second column, see [17]. Note: high-density polyethylene (HDPE); low-density polyethylene (LDPE); polyethylene terephthalate (PET); polypropylene (PP).
Table 3. Export destinations and quantities for Dutch PE.
CountryTonneShare
China52,34234%
Germany25,01616%
Belgium24,00116%
India99236%
United Kingdom69084%
France66734%
Hong Kong60184%
Italy38132%
Turkey33002%
Viet Nam28502%
Poland19581%
Other Europe69435%
Other Asia19871%
Source: [5]; author’s presentation.
Table 4. Postseparation facilities in the Netherlands and their capacity.
CompanyPlaceProvinceCapacity (Kilotonnes)
OmrinHeerenveenFriesland300
AEBAmsterdamNoord-Holland300
AtteroWijsterDrenthe280/280
GroningenGroningen140
AVRRotterdamZuid-Holland200
HVCAlkmaarNoord-Holland140
Source: [8] (for Omrin, this is the capacity end of this year based on a personal conversation with John Vernooi).
Publisher’s Note: MDPI stays neutral with regard to jurisdictional claims in published maps and institutional affiliations.

