Future Climate Change Renders Unsuitable Conditions for Paramo Ecosystems in Colombia


Abstract
1. Introduction
1.1. Site Description
1.2. Data and Methodology
2. Results
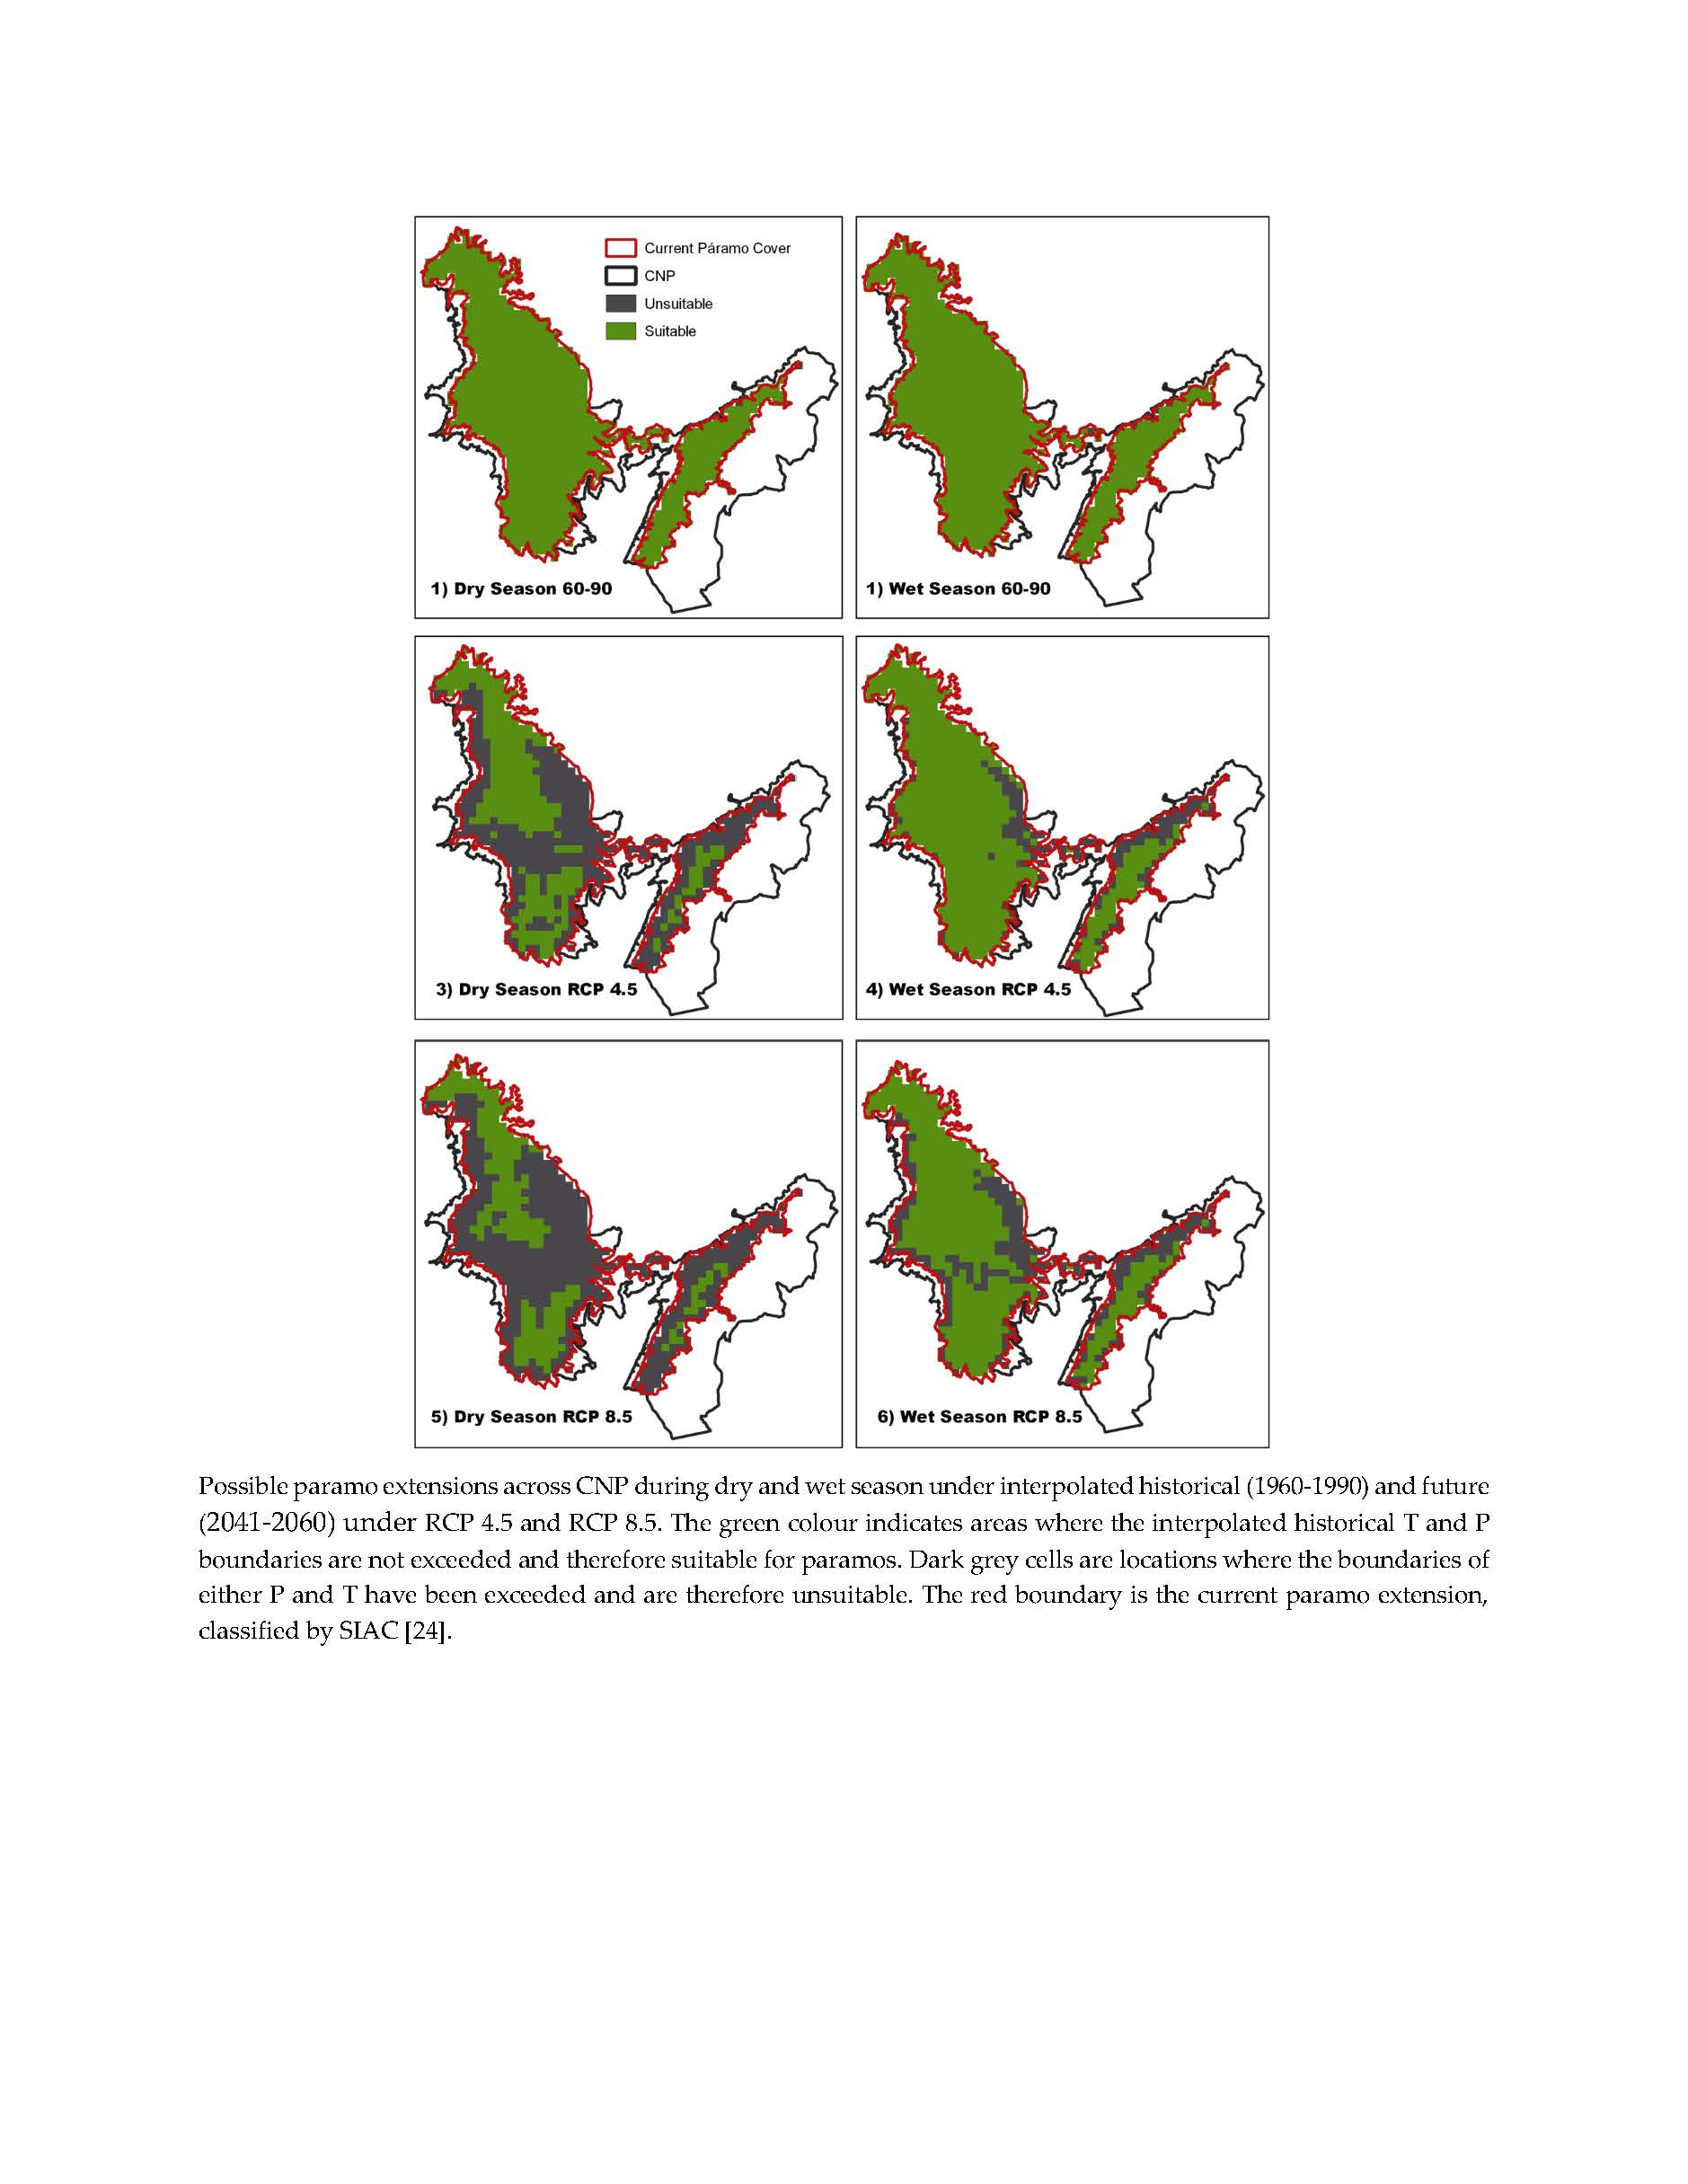
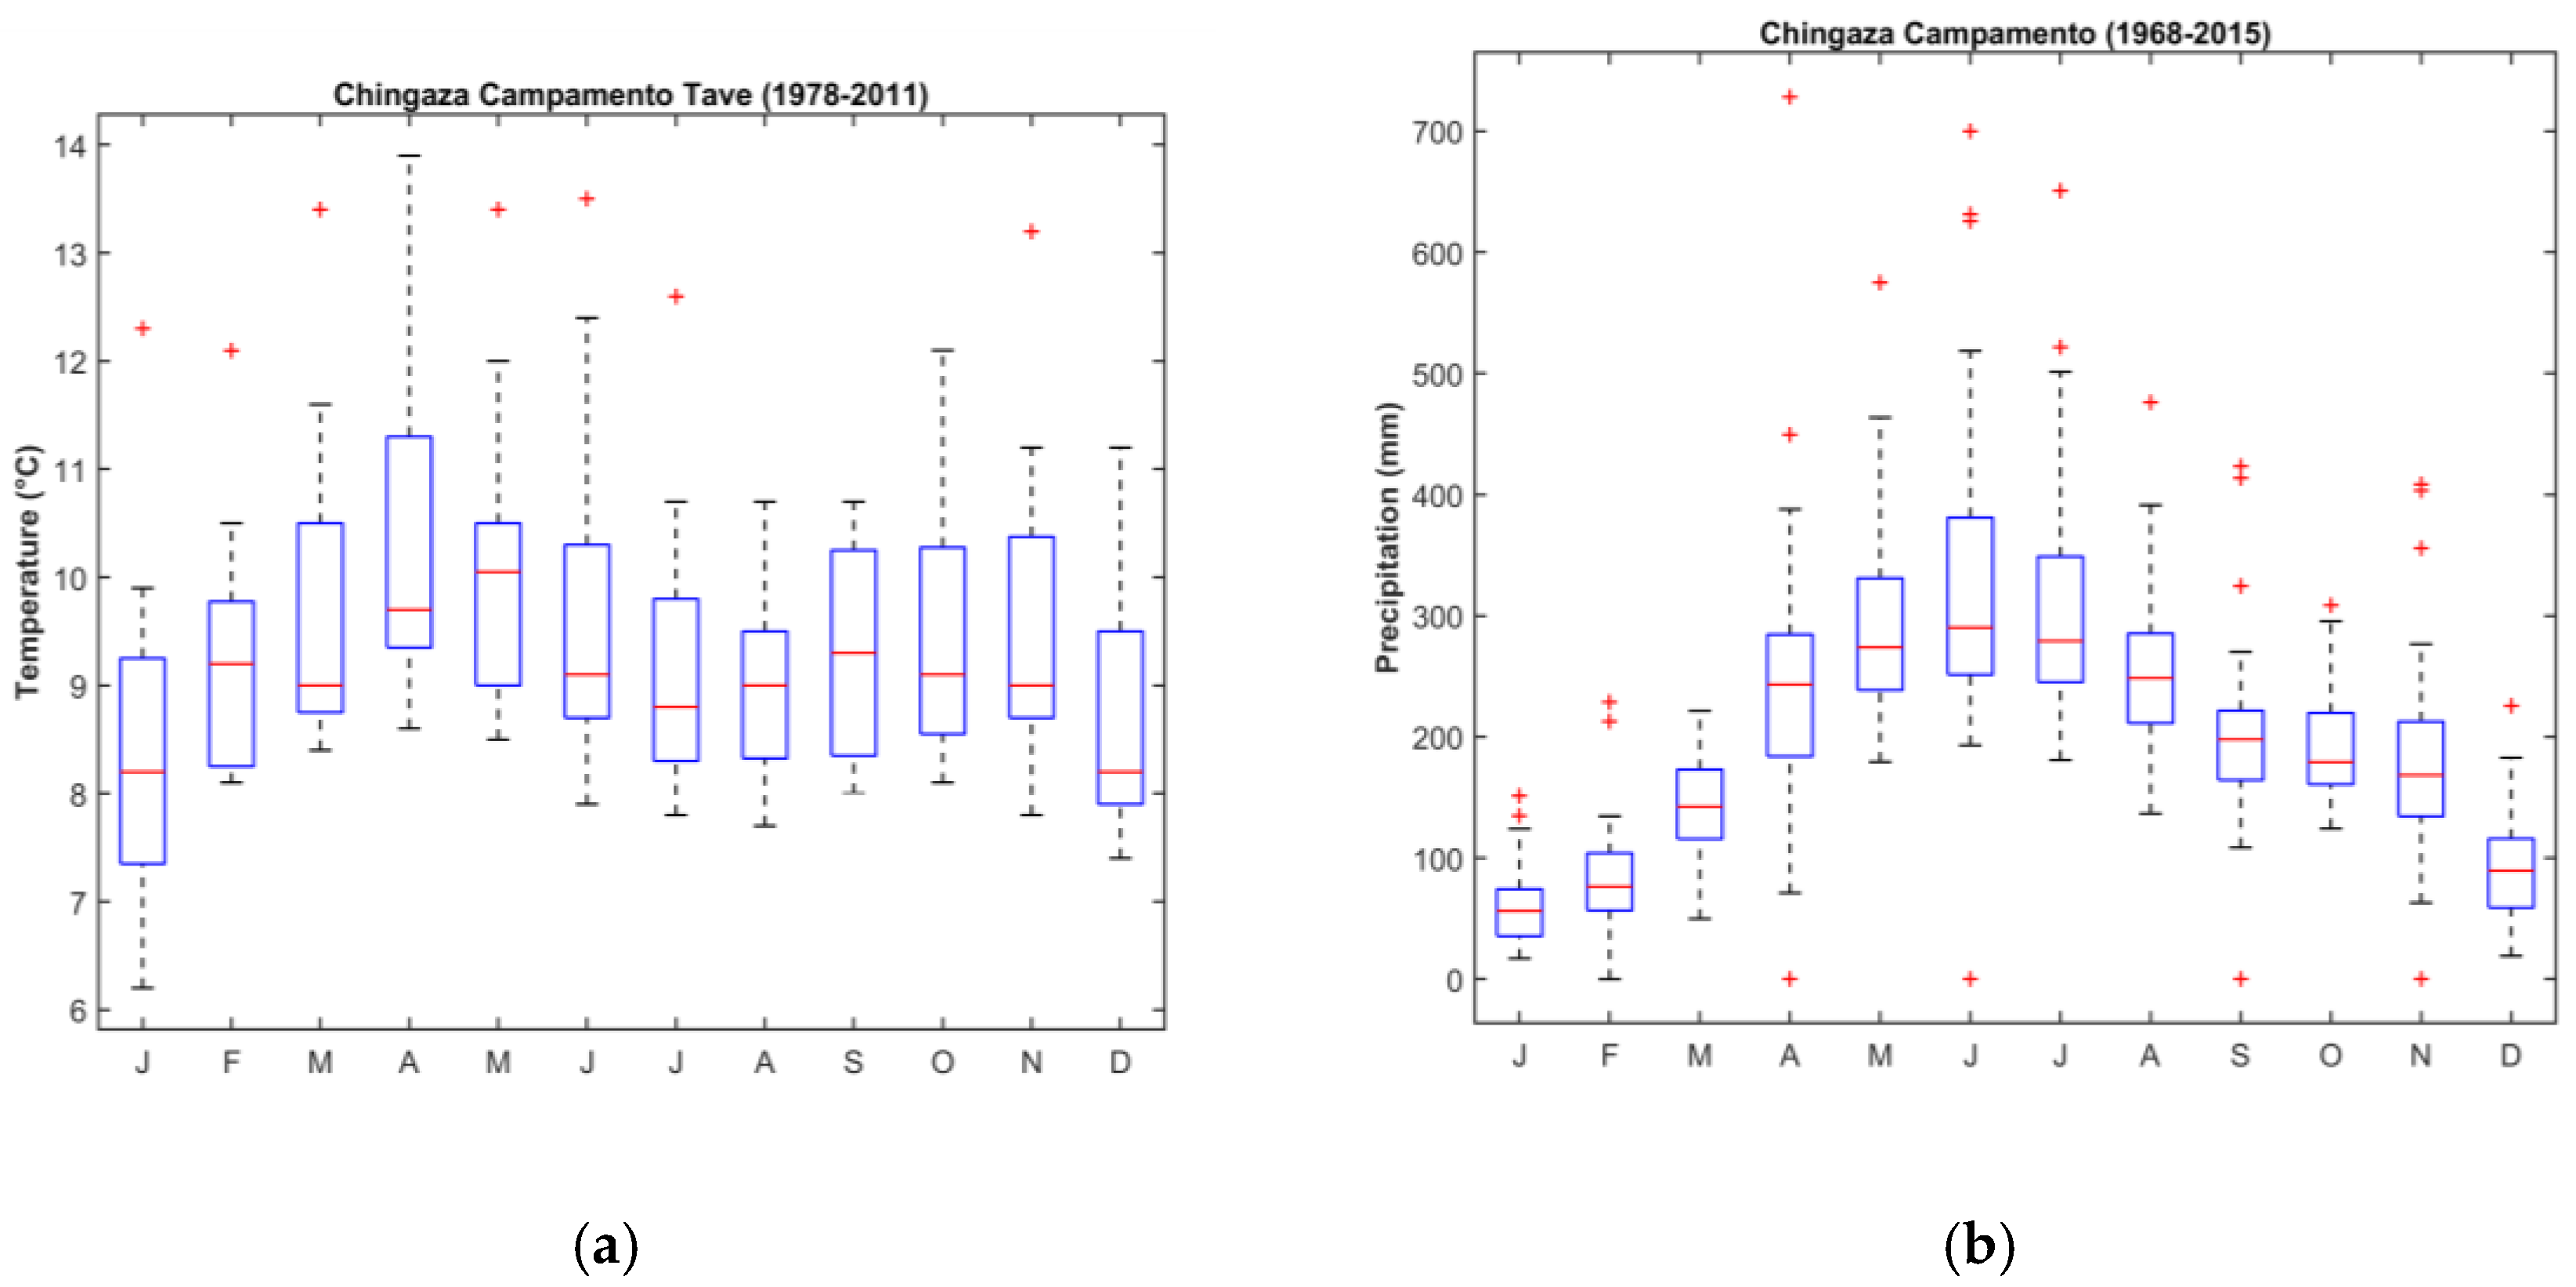
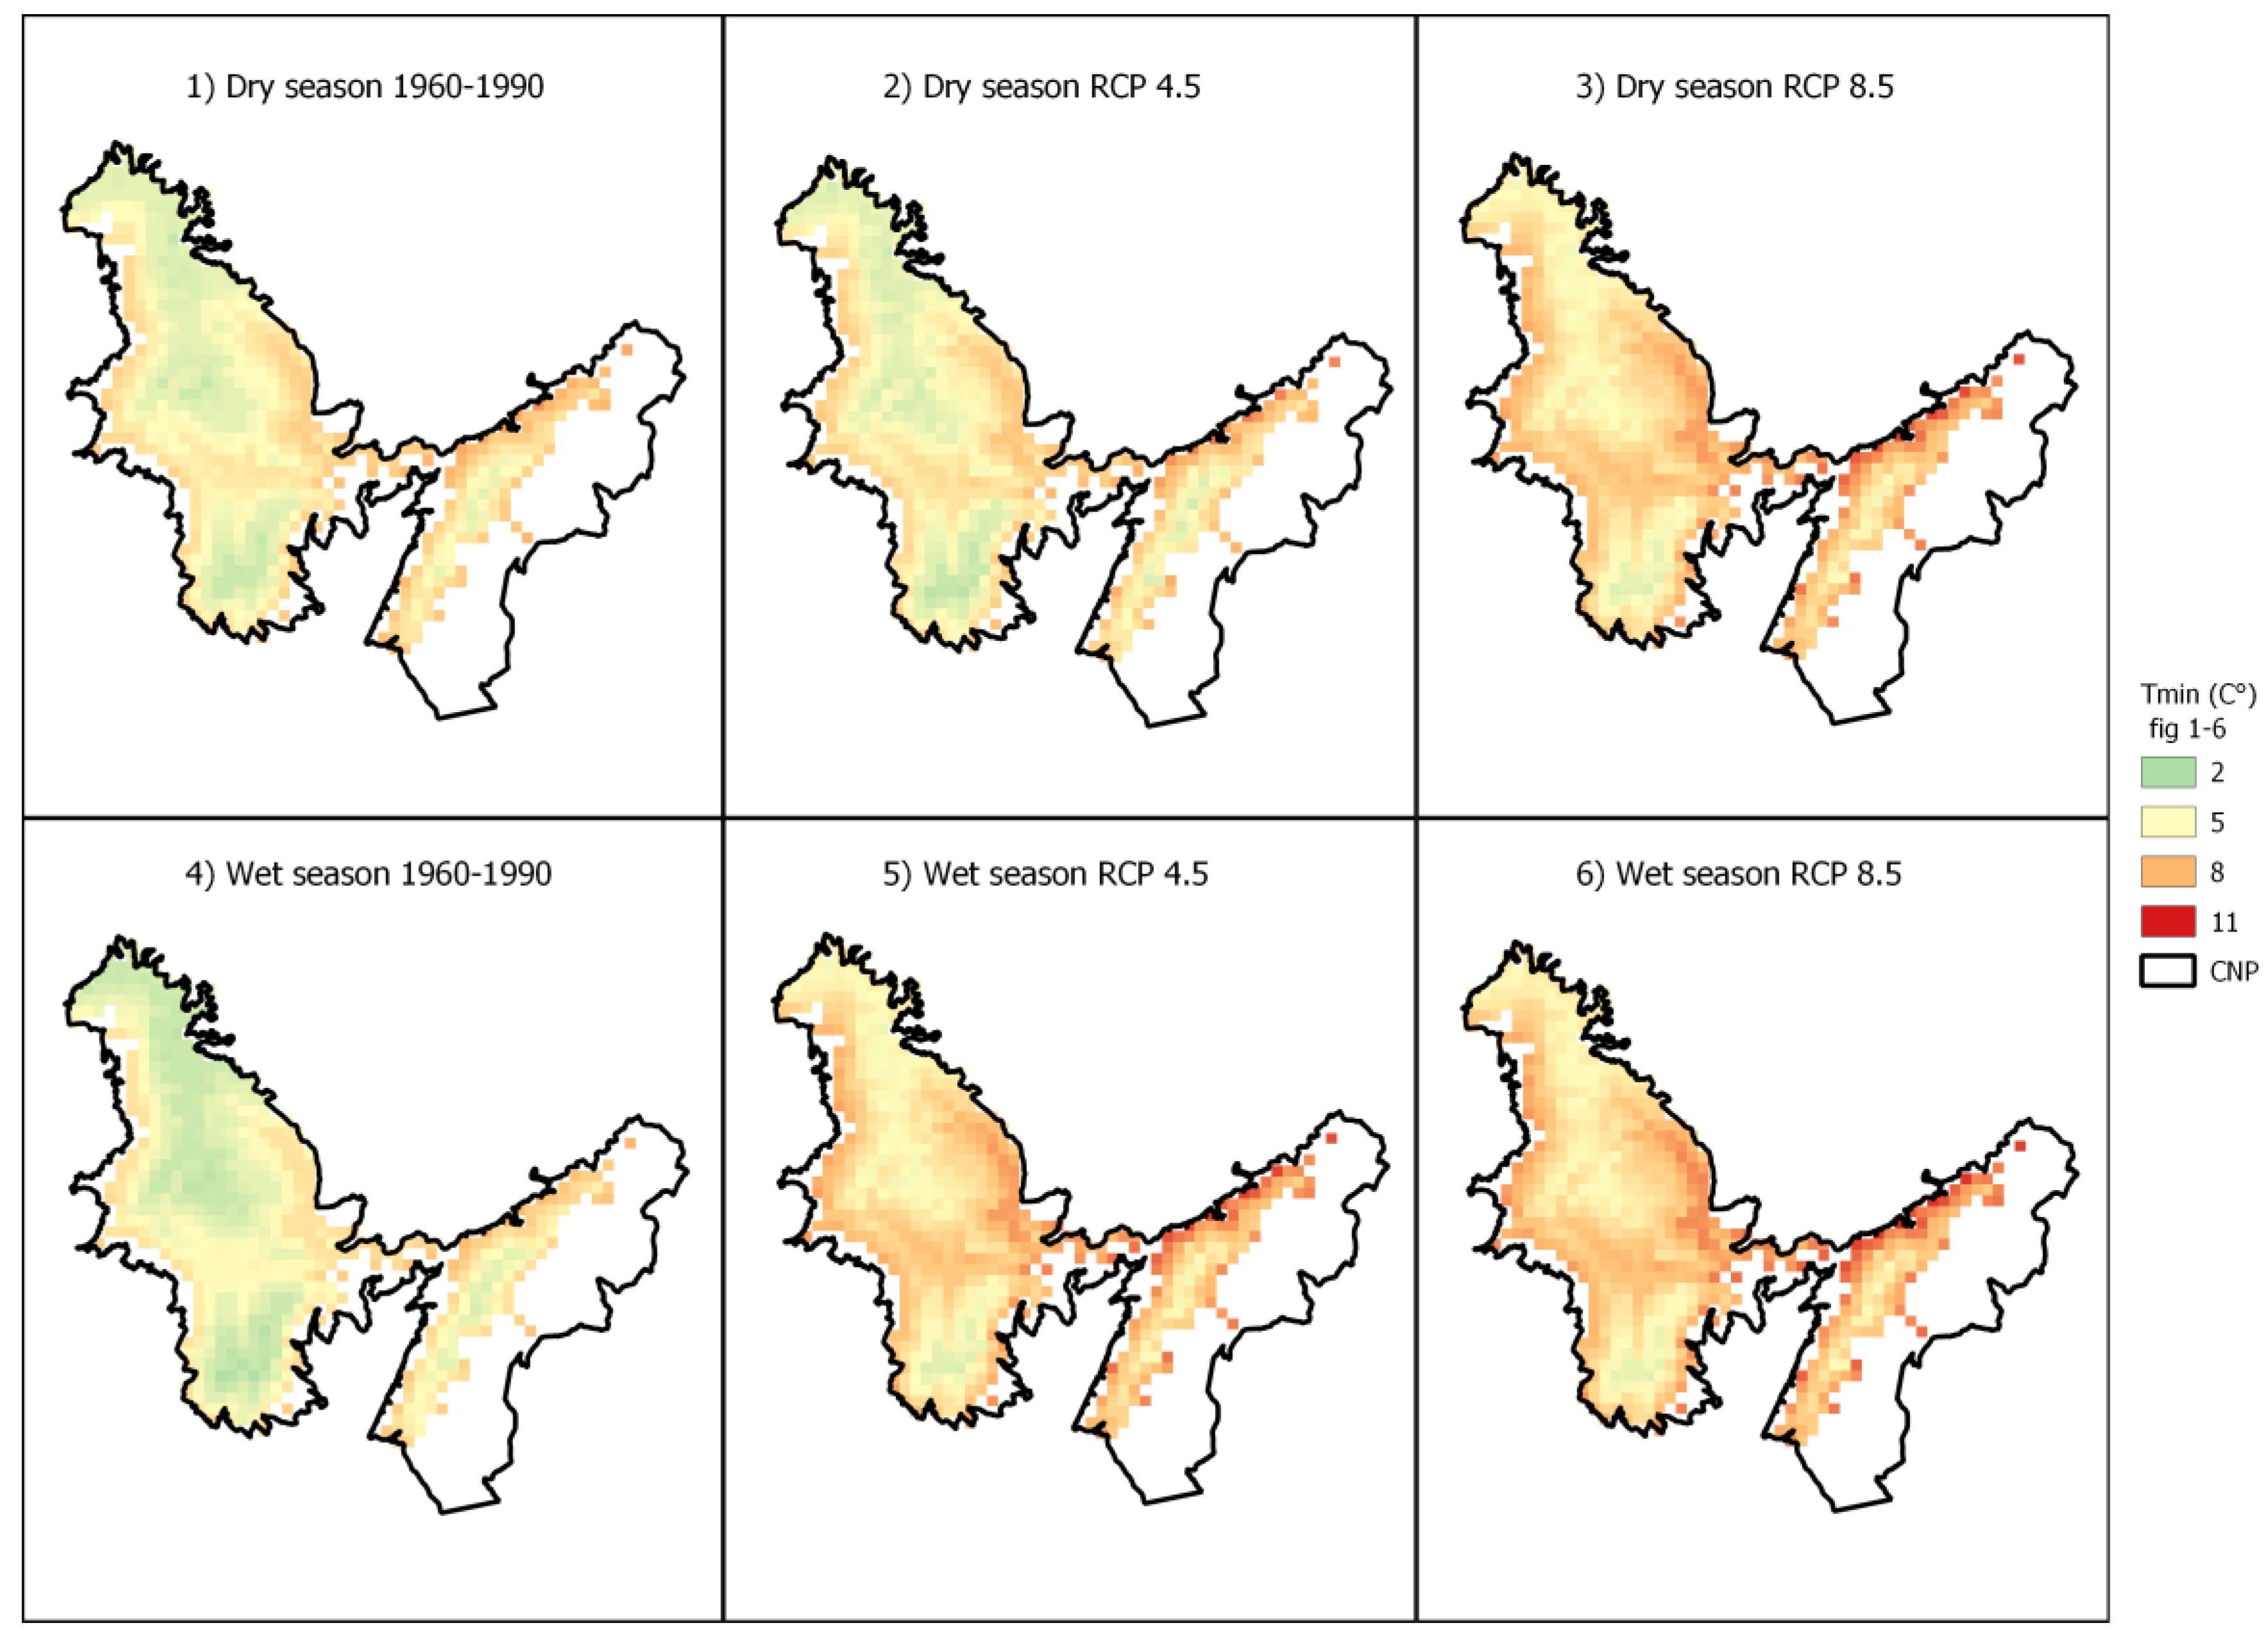
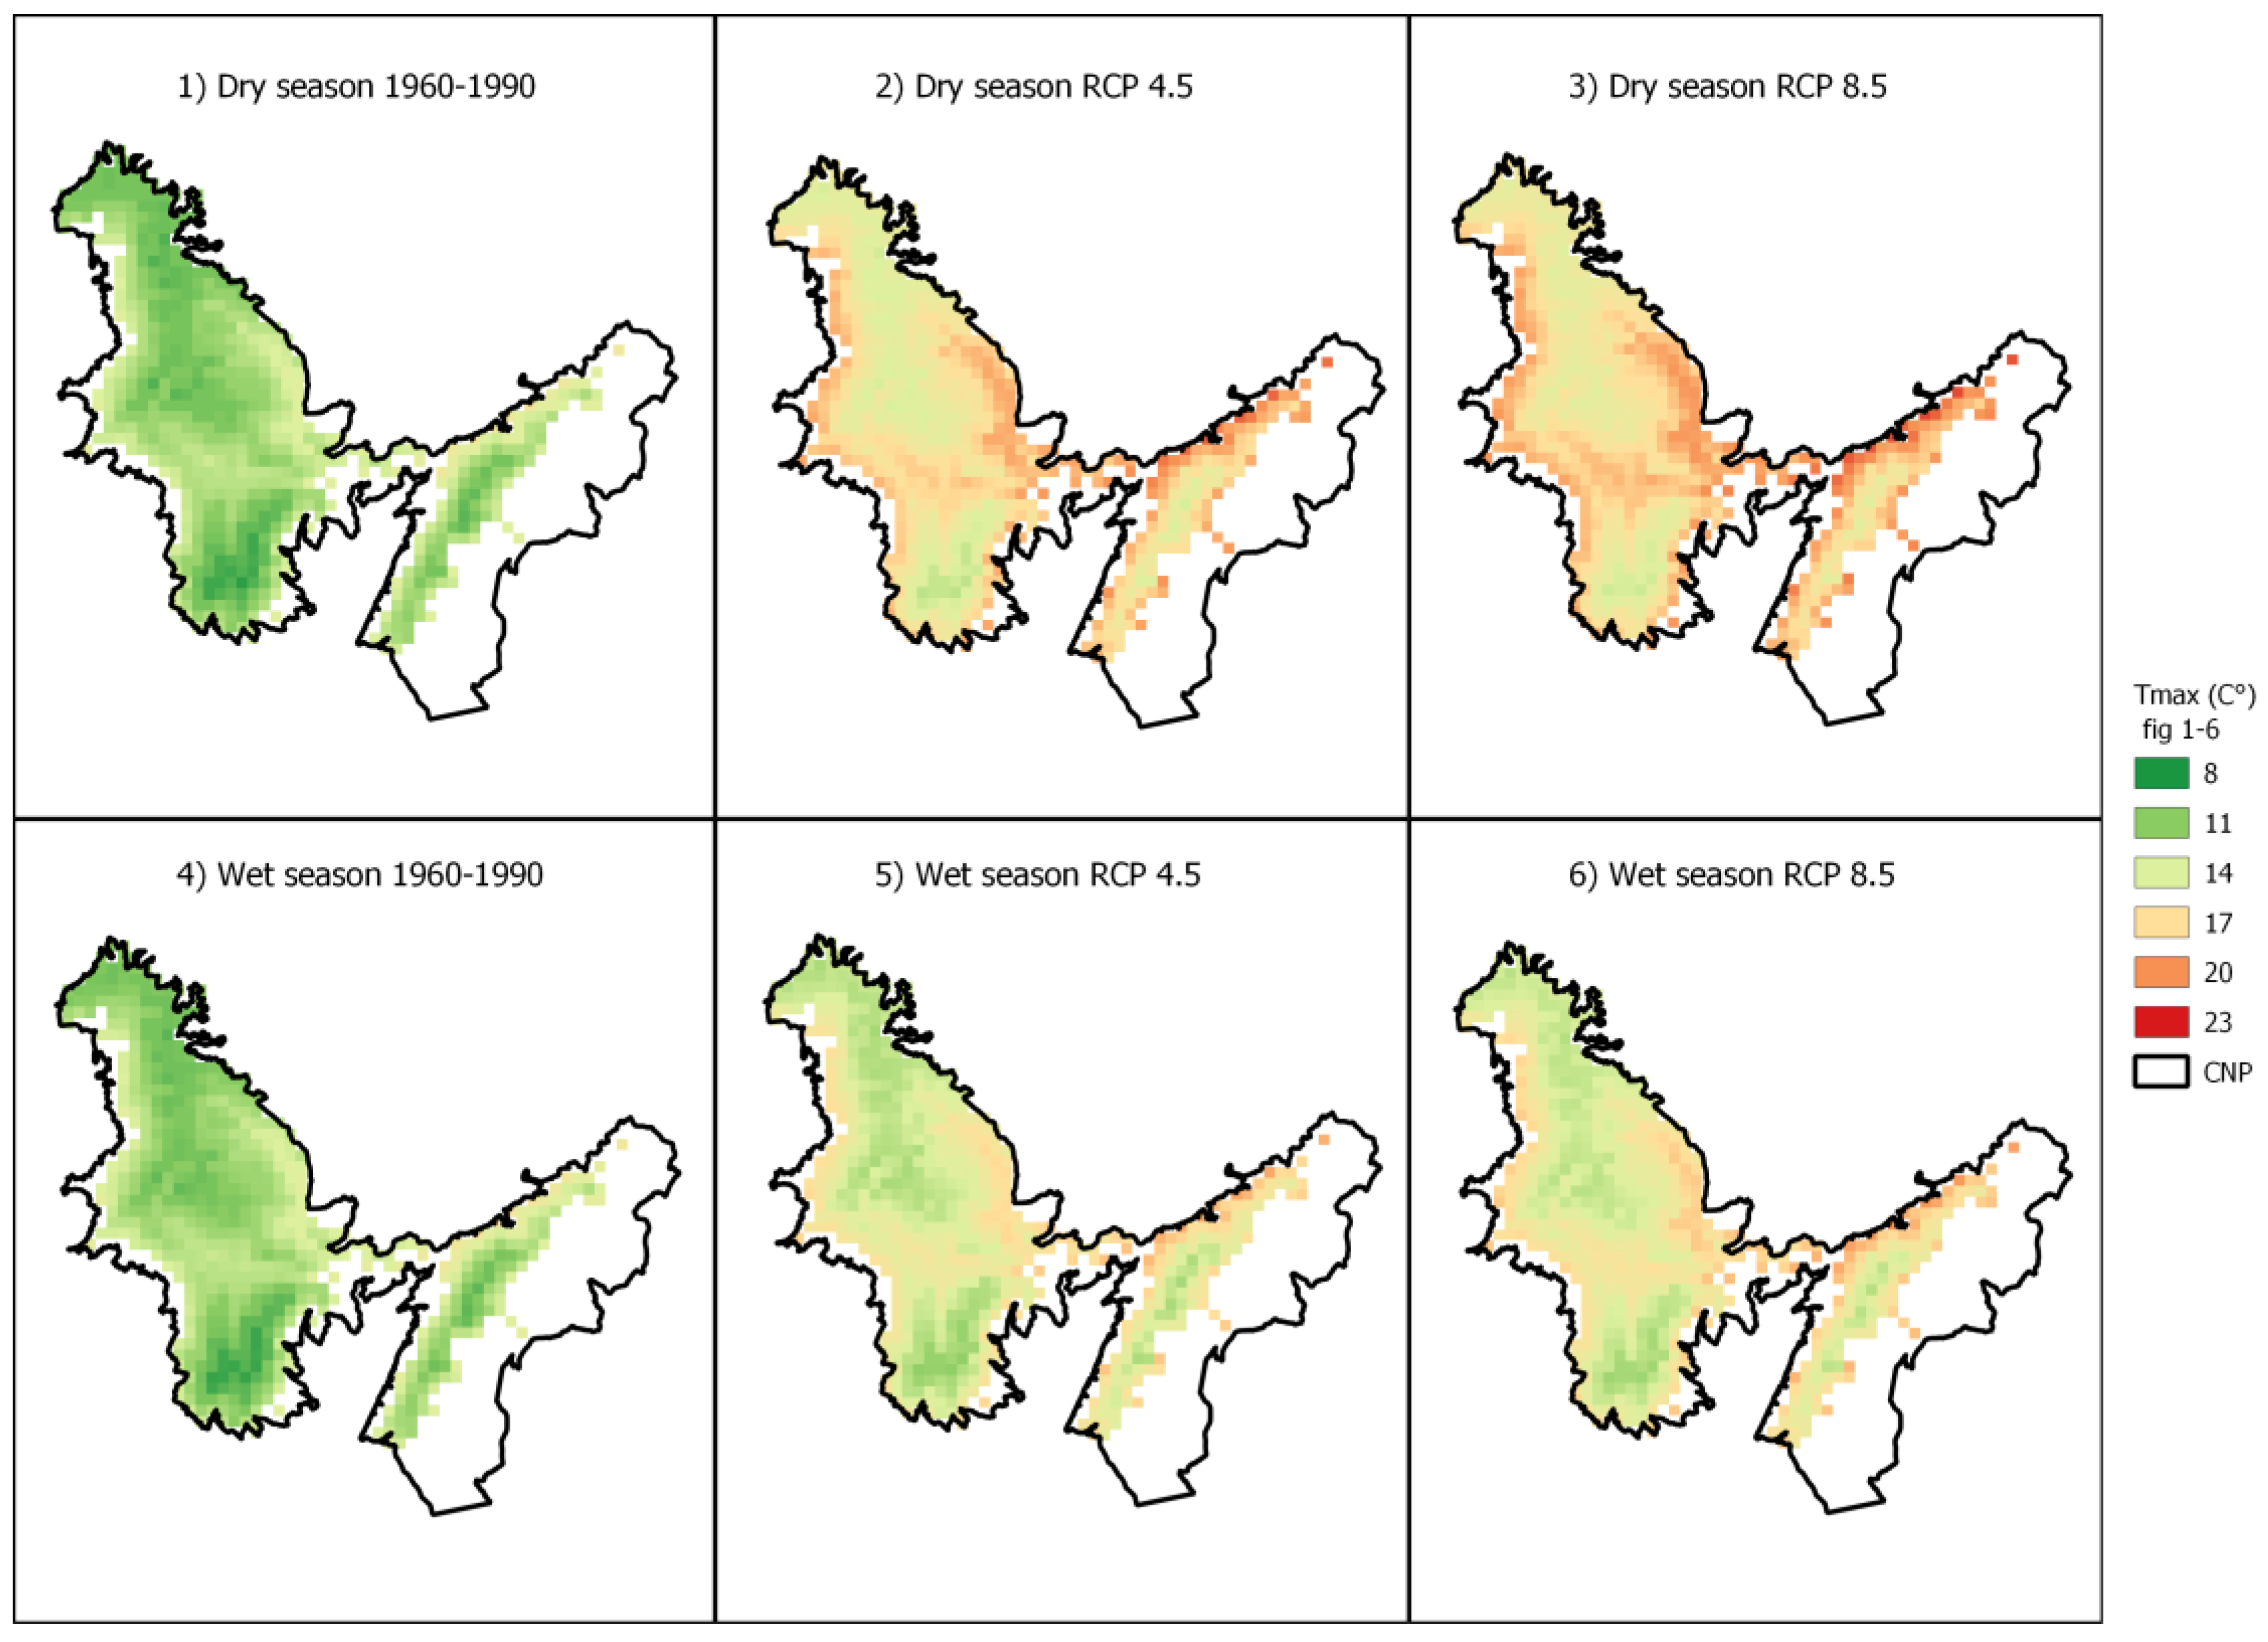
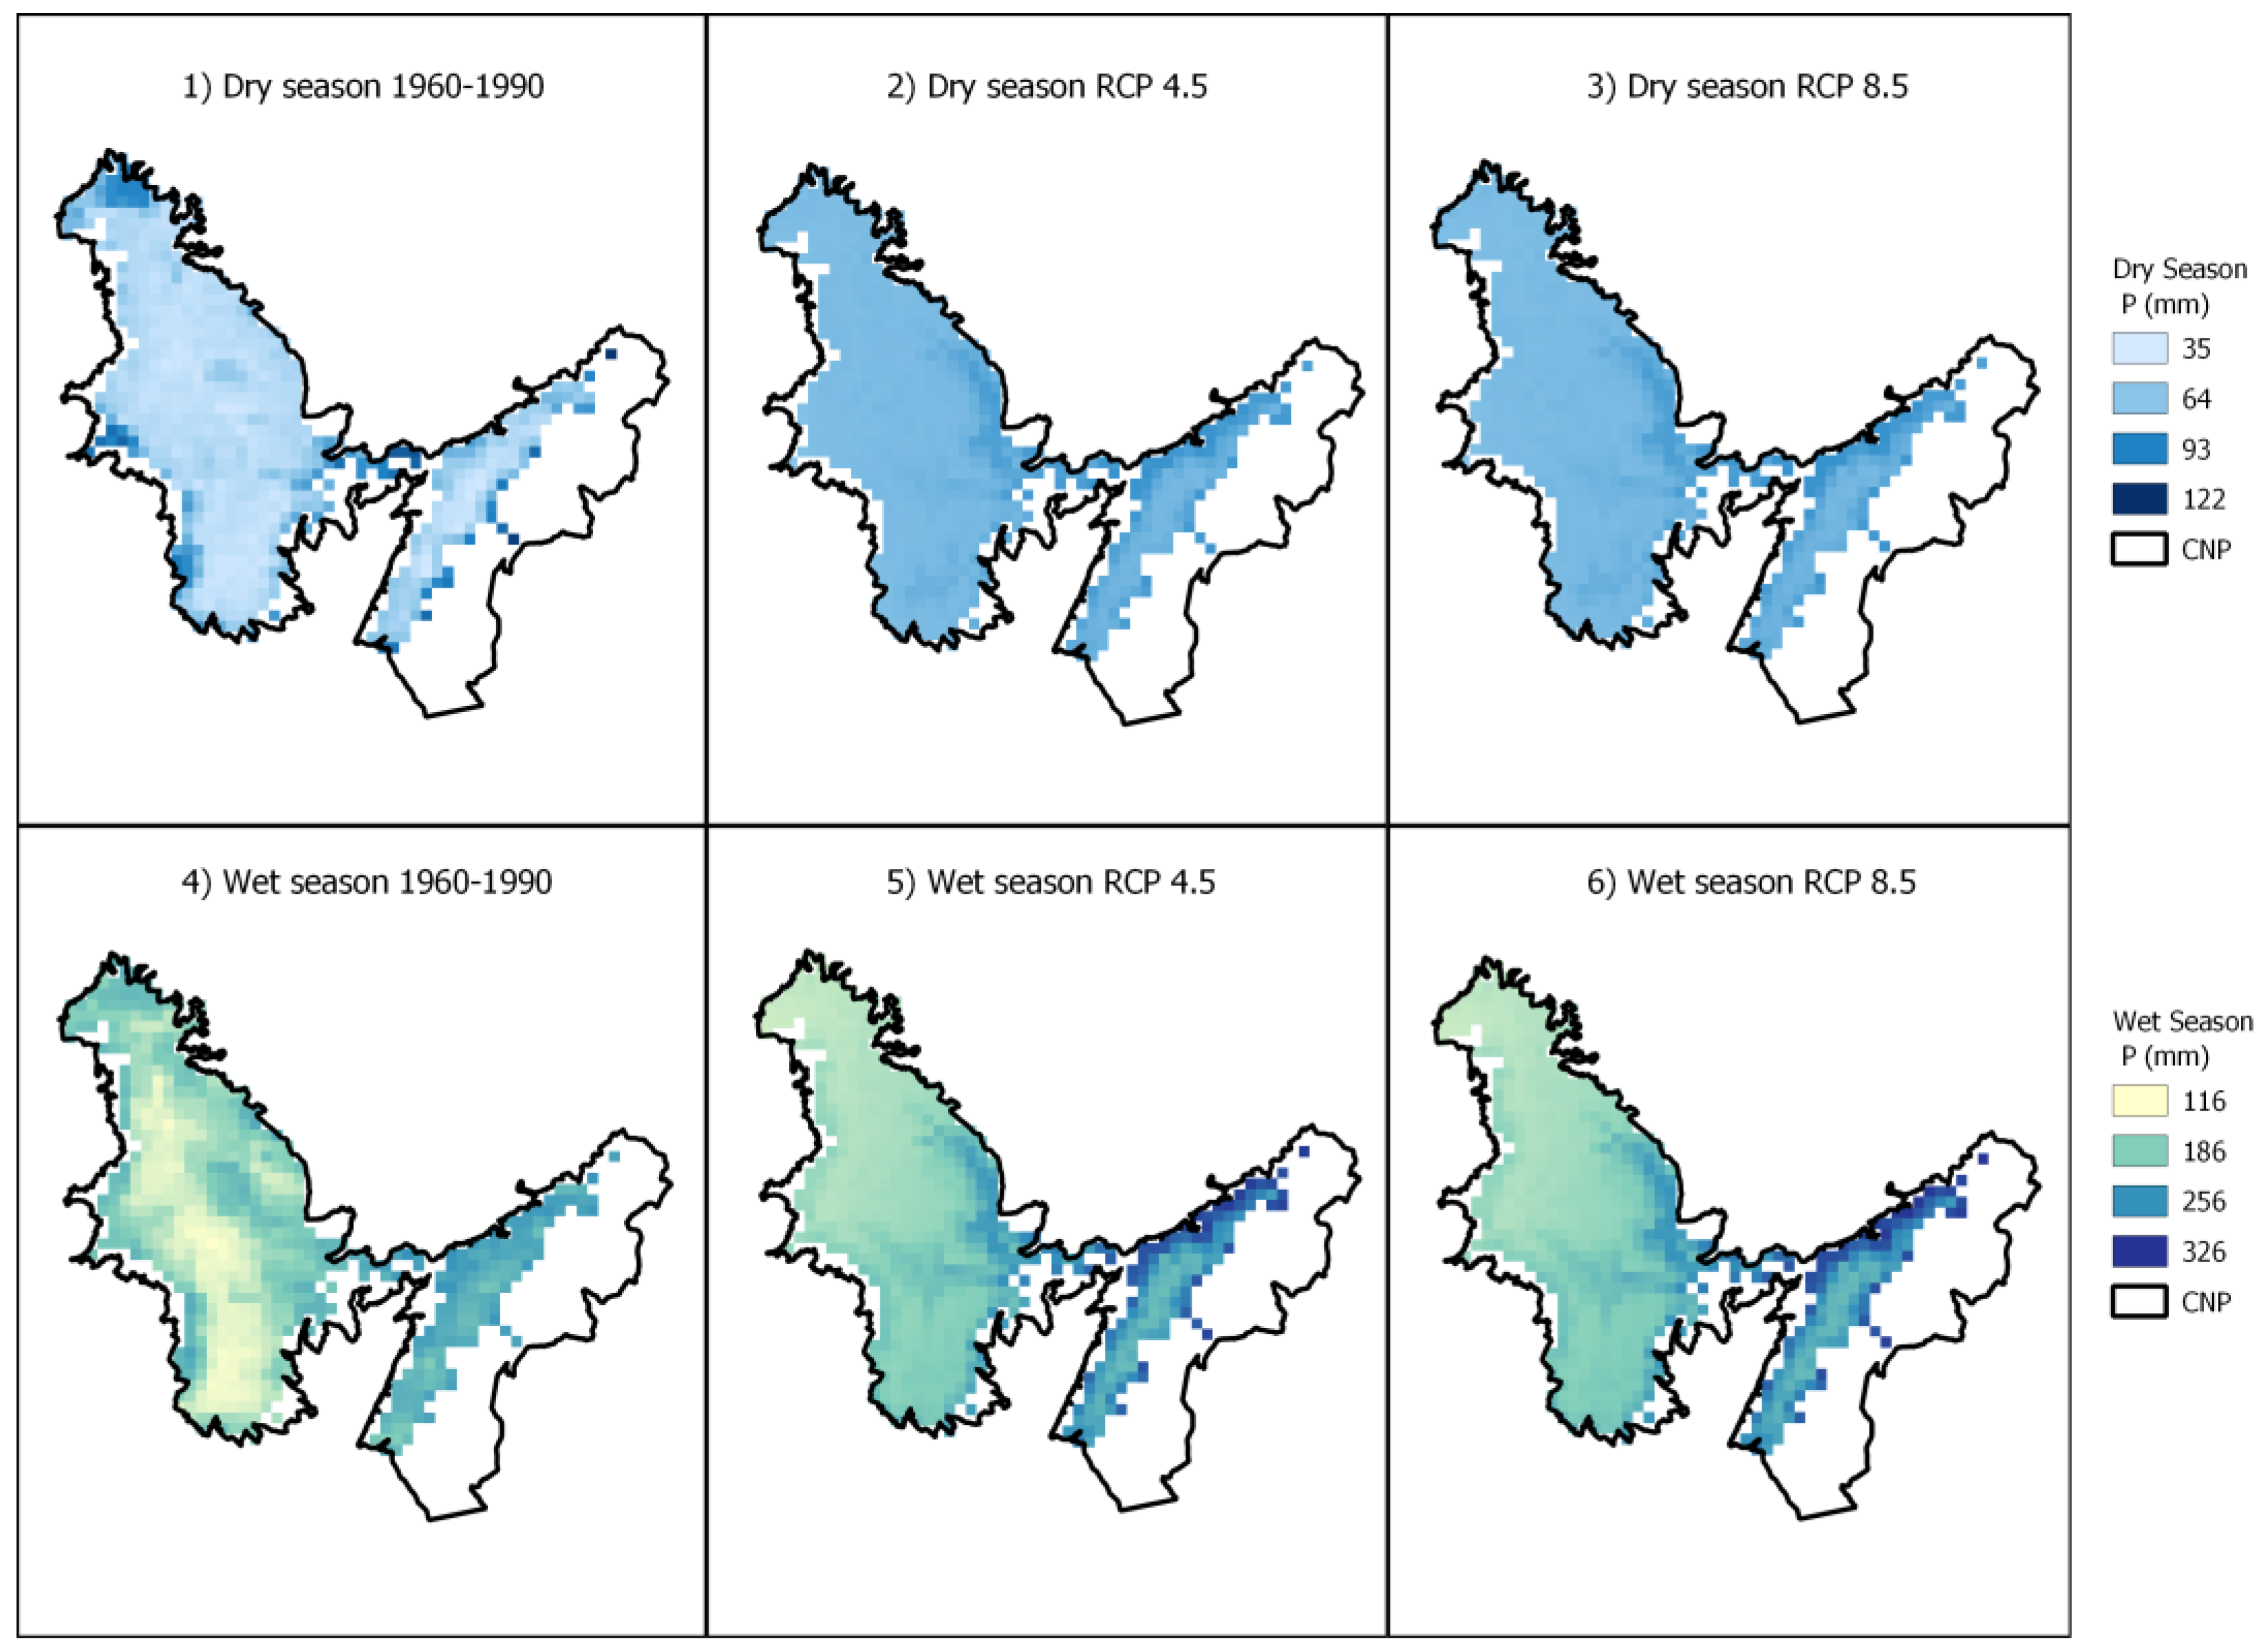
2.1. Historical Climate Conditions and Future Scenarios (RCP 4.5 and RCP 8.5)
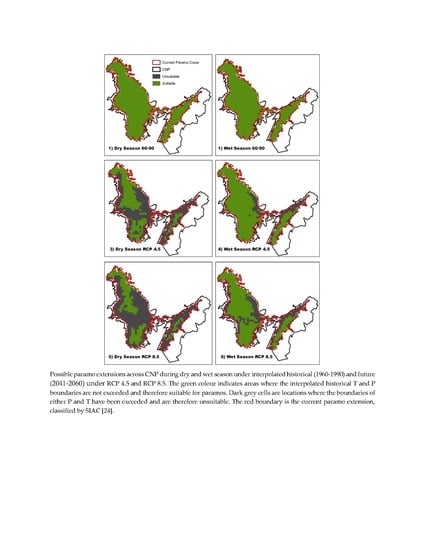
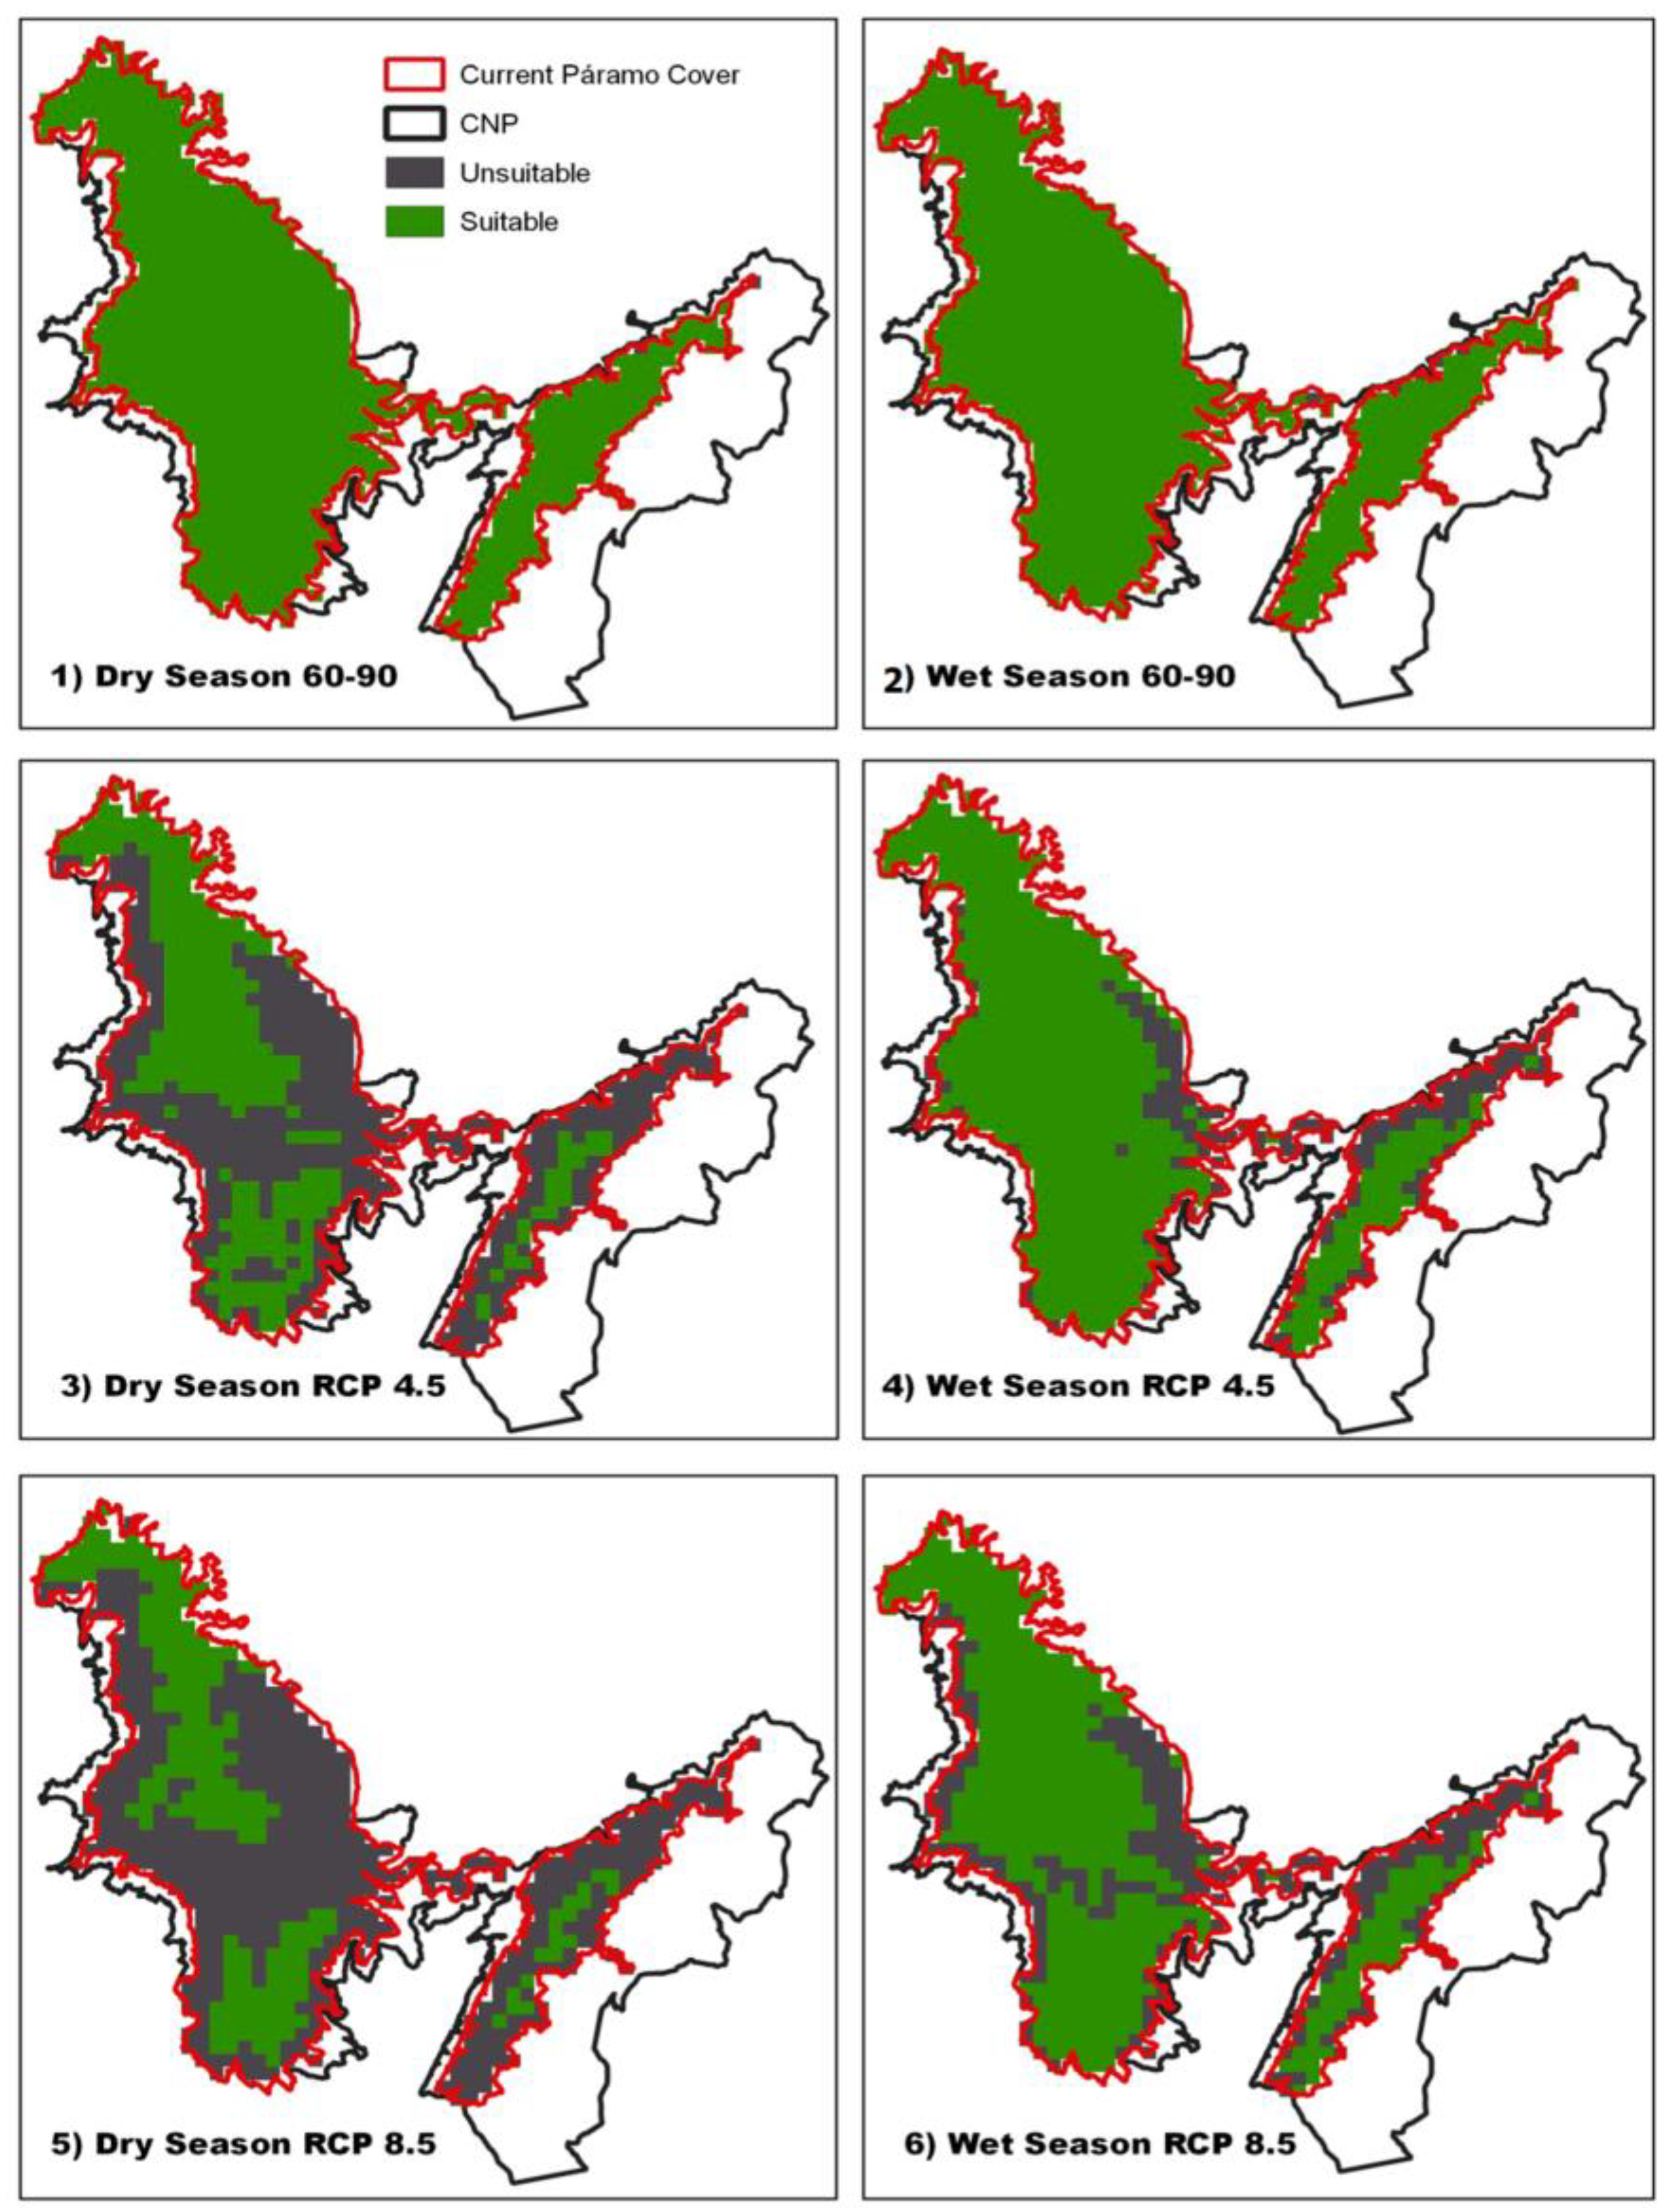
2.2. Future Suitability for Paramos
3. Discussion
Future Climate in CNP and Its Effect on the Extension of Paramos
4. Conclusions
Supplementary Materials
Author Contributions
Funding
Acknowledgments
Conflicts of Interest
References
- Luteyn, J.L. Paramos-Checklist Plant Diversity, Geographical Distribution; Memoirs of the New York Botanical Garden; The New York Botanical Garden: Bronx, NY, USA, 1999; Volume 84, ISBN 978-0-89327-427-6. [Google Scholar]
- Buytaert, W.; Célleri, R.; De Bièvre, B.; Cisneros, F.; Wyseure, G.; Deckers, J.; Hofstede, R. Human impact on the hydrology of the Andean paramos. Earth-Sci. Rev. 2006, 79, 53–72. [Google Scholar] [CrossRef]
- Hribljan, J.A.; Suárez, E.; Heckman, K.A.; Lilleskov, E.A.; Chimner, R.A. Peatland carbon stocks and accumulation rates in the Ecuadorian paramo. Wetl. Ecol. Manag. 2016, 24, 113–127. [Google Scholar] [CrossRef]
- Morales-Rivas, M.; Otero Garcia, J.; van der Hammen, T.; Torres Perdigón, A.; Cadena Vargas, C.E.; Pedraza Peñaloza, C.A.; Rodríguez Eraso, N.; Franco Aguilera, C.A.; Betancourth Suárez, J.C.; Olaya Ospina, É.; et al. Atlas de Paramos de Colombia; Instituto de Investigación de Recursos Biológicos Alexander von Humboldt: Bogotá, CO, USA, 2007; ISBN 9588151915. [Google Scholar]
- Buytaert, W.; Cuesta-Camacho, F.; Tobón, C. Potential impacts of climate change on the environmental services of humid tropical alpine regions: Climate change and environmental services. Glob. Ecol. Biogeogr. 2011, 20, 19–33. [Google Scholar] [CrossRef]
- Ruiz, D.; Martinson, D.G.; Vergara, W. Trends, stability and stress in the Colombian Central Andes. Clim. Chang. 2012, 112, 717–732. [Google Scholar] [CrossRef]
- Anderson, E.P.; Marengo, J.; Villalba, R.; Young, B.; Cordero, D.; Gast, F.; Jaimes, E.; Ruiz, D. Consequences of Climate Change for Ecosystems and Ecosystem Services in the Tropical Andes. Clim. Chang. Biodivers. Trop. Andes 2011, 1, 1–18. [Google Scholar]
- Rios, O.V.; Pedraza, P.; Lora, C.A. Parque Nacional Natural Chingaza; Universidad Nacional: Bogotá, CO, USA, 2004; ISBN 958-33-6824-5. [Google Scholar]
- Cárdenas Agudelo, M.F. Ecohydrology of Paramos in Colombia: Vulnerability to Climate Change and Land Use. Doctoral Thesis, Universidad Nacional de Colombia Sede Medellín Facultad de Minas Escuela de Geociencias y Medio Ambiente, Sede Medellín, CO, USA, 2019. [Google Scholar]
- Kumar, S.; Merwade, V.; Kinter, J.L.; Niyogi, D. Evaluation of Temperature and Precipitation Trends and Long-Term Persistence in CMIP5 Twentieth-Century Climate Simulations. J. Clim. 2013, 26, 4168–4185. [Google Scholar] [CrossRef]
- Bailey, R.G. Identifying Ecoregion Boundaries. Environ. Manag. 2004, 34, S14–S26. [Google Scholar] [CrossRef]
- WMO Climatological Normals. Available online: http://www.wmo.int/pages/prog/wcp/wcdmp/GCDS_1.php (accessed on 13 February 2019).
- Vinnikov, K.Y.; Groisman, P.Y.; Lugina, K.M. Empirical Data on Contemporary Global Climate Changes (Temperature and Precipitation). J. Clim. 1990, 3, 662–677. [Google Scholar] [CrossRef][Green Version]
- Sistema Lacustre de Chingaza|Ramsar Sites Information Service. Available online: https://rsis.ramsar.org/ris/1782 (accessed on 12 June 2020).
- Galindo Tarazona, R.; Guzmán, C.; Parra, A.; Santana Martinez, D.M.; Cano Burgons, M.; Ortiz Vanegas, A.; Guillermo Linares, L.; Hernandez, D.; Roa, E. Planes de Manejo Áreas del Sistema de Parques Nacionales Naturales de Colombia; Reformulacion Participativa del Plan de Manejo Parque Nacional Natural Chingaza; Minambiente: Bogotá, CO, USA, 2013; p. 273.
- Sanchez, A.; Posada, J.M.; Smith, W.K. Dynamic Cloud Regimes, Incident Sunlight, and Leaf Temperatures. In Espeletia Grandiflora and Chusquea Tessellata, Two Representative Species of the Andean Paramo, Colombia. Arct. Antarct. Alp. Res. 2014, 46, 371–378. [Google Scholar] [CrossRef]
- WorldClim 1.4—WorldClim 1 Documentation. Available online: https://www.worldclim.org/data/v1.4/worldclim14.html (accessed on 17 May 2020).
- Hijmans, R.J.; Cameron, S.E.; Parra, J.L.; Jones, P.G.; Jarvis, A. Very high resolution interpolated climate surfaces for global land areas. Int. J. Climatol. 2005, 25, 1965–1978. [Google Scholar] [CrossRef]
- Flato, G.; Marotzke, J.; Abiodun, B.; Braconnot, P.; Chou, S.C.; Collins, W.; Cox, P.; Driouech, F.; Emori, S.; Eyring, V.; et al. Evaluation of Climate Models. In Climate Change 2013: The Physical Science Basis. Contribution of Working Group I to the Fifth Assessment Report of the Intergovernmental Panel on Climate Change; Cambridge University Press: Cambridge, NY, USA, 2013; pp. 741–866. [Google Scholar]
- Palomino-Lemus, R.; Córdoba-Machado, S.; Esteban-Parra, M.J. Evaluation of the global climate models in the CMIP5 on the South America Northwest. Rev. Biodivers. Neotrop. 2015, 5, 16–22. [Google Scholar] [CrossRef]
- Gent, P.R.; Danabasoglu, G.; Donner, L.J.; Holland, M.M.; Hunke, E.C.; Jayne, S.R.; Lawrence, D.M.; Neale, R.B.; Rasch, P.J.; Vertenstein, M.; et al. The Community Climate System Model Version 4. J. Clim. 2011, 24, 4973–4991. [Google Scholar] [CrossRef]
- ArcGIS [GIS software 2015]; Environmental Systems Research Institute Inc.: Redlands, CA, USA, 2015.
- QGIS Development Team. Quantum Geographic Information System [QGIS]; Open Source Geospatial Foundation: Chicago, IL, USA, 2019; Available online: https://qgis.org/en/site/ (accessed on 1 October 2018).
- SIAC Sistema de Información Ambiental de Colombia. Available online: http://www.siac.gov.co/catalogo-de-mapas (accessed on 1 October 2018).
- Ruiz, D.; Moreno, H.A.; Gutiérrez, M.E.; Zapata, P.A. Changing climate and endangered high mountain ecosystems in Colombia. Sci. Total Environ. 2008, 398, 122–132. [Google Scholar] [CrossRef]
- Portmann, R.W.; Solomon, S.; Hegerl, G.C. Spatial and seasonal patterns in climate change, temperatures, and precipitation across the United States. Proc. Natl. Acad. Sci. USA 2009, 106, 7324–7329. [Google Scholar] [CrossRef] [PubMed]
- Sanchez, A.; Rey-Sánchez, A.C.; Posada, J.M.; Smith, W.K. Interplay of seasonal sunlight, air and leaf temperature in two alpine paramo species, Colombian Andes. Agric. For. Meteorol. 2018, 253–254, 38–47. [Google Scholar] [CrossRef]
- Célleri, R.; Feyen, J. The Hydrology of Tropical Andean Ecosystems: Importance, Knowledge Status, and Perspectives. Mt. Res. Dev. 2009, 29, 350–355. [Google Scholar] [CrossRef]
- Beven, K. Validation and Equifinality. In Computer Simulation Validation; Simulation Foundations, Methods and Applications; Springer: Cham, Switzerland, 2019; pp. 791–809. ISBN 978-3-319-70766-2. [Google Scholar]
- Zhang, F.; Zhang, H.; Hagen, S.C.; Ye, M.; Wang, D.; Gui, D.; Zeng, C.; Tian, L.; Liu, J. Snow cover and runoff modelling in a high mountain catchment with scarce data: Effects of temperature and precipitation parameters. Hydrol. Process. 2015, 29, 52–65. [Google Scholar] [CrossRef]
- Gao, Y.; Xiao, L.; Chen, D.; Xu, J.; Zhang, H. Comparison between past and future extreme precipitations simulated by global and regional climate models over the Tibetan Plateau. Int. J. Climatol. 2018, 38, 1285–1297. [Google Scholar] [CrossRef]
- Xu, J.; Gao, Y.; Chen, D.; Xiao, L.; Ou, T. Evaluation of global climate models for downscaling applications centred over the Tibetan Plateau: EVALUATION OF GCMS FOR DOWNSCALING. Int. J. Climatol. 2017, 37, 657–671. [Google Scholar] [CrossRef]
- Khan, N.; Shahid, S.; Ahmed, K.; Ismail, T.; Nawaz, N.; Son, M. Performance Assessment of General Circulation Model in Simulating Daily Precipitation and Temperature Using Multiple Gridded Datasets. Water 2018, 10, 1793. [Google Scholar] [CrossRef]
- Mountain Research Initiative EDW Working Group; Pepin, N.; Bradley, R.S.; Diaz, H.F.; Cacares, E.B.; Forsythe, N.; Fowler, H.; Liu, X.D.; Miller, J.R.; Ning, L.; et al. Elevation-dependent warming in mountain regions of the world. Nat. Clim. Chang. 2015, 5, 424–430. [Google Scholar] [CrossRef]
- Vuille, M.; Francou, B.; Wagnon, P.; Juen, I.; Kaser, G.; Mark, B.G.; Bradley, R.S. Climate change and tropical Andean glaciers: Past, present and future. Earth-Sci. Rev. 2008, 89, 79–96. [Google Scholar] [CrossRef]
- Van der Hammen, T. The Pleistocene Changes of Vegetation and Climate in Tropical South America. J. Biogeogr. 1974, 1, 3. [Google Scholar] [CrossRef]
- Hooghiemstra, H.; Wijninga, V.M.; Cleef, A.M. The paleobotanical records of Colombia: Implications for biogeography and biodiversity. Ann. Mo. Bot. Gard. 2006, 93, 297–325. [Google Scholar] [CrossRef]
- Gilman, S.E.; Urban, M.C.; Tewksbury, J.; Gilchrist, G.W.; Holt, R.D. A framework for community interactions under climate change. Trends Ecol. Evol. 2010, 25, 325–331. [Google Scholar] [CrossRef]
- Rasmann, S.; Pellissier, L.; Defossez, E.; Jactel, H.; Kunstler, G. Climate-driven change in plant-insect interactions along elevation gradients. Funct. Ecol. 2014, 28, 46–54. [Google Scholar] [CrossRef]
- Tylianakis, J.M.; Didham, R.K.; Bascompte, J.; Wardle, D.A. Global change and species interactions in terrestrial ecosystems. Ecol. Lett. 2008, 11, 1351–1363. [Google Scholar] [CrossRef]
- Barbeito, I.; Dawes, M.A.; Rixen, C.; Senn, J.; Bebi, P. Factors driving mortality and growth at treeline: A 30-year experiment of 92 000 conifers. Ecology 2012, 93, 389–401. [Google Scholar] [CrossRef]
- Rehm, E.M.; Feeley, K.J. The inability of tropical cloud forest species to invade grasslands above treeline during climate change: Potential explanations and consequences. Ecography 2015, 38, 1167–1175. [Google Scholar] [CrossRef]
- Jaramillo, F.; Desormeaux, A.; Hedlund, J.; Jawitz, J.W.; Clerici, N.; Piemontese, L.; Rodríguez-Rodriguez, J.A.; Anaya, J.A.; Blanco-Libreros, J.F.; Borja, S.; et al. Priorities and Interactions of Sustainable Development Goals (SDGs) with Focus on Wetlands. Water 2019, 11, 619. [Google Scholar] [CrossRef]
- Valencia, J.B.; Mesa, J.; León, J.G.; Madriñán, S.; Cortés, A.J. Climate Vulnerability Assessment of the Espeletia Complex on Páramo Sky Islands in the Northern Andes. Front. Ecol. Evol. 2020, 8, 309. [Google Scholar] [CrossRef]


| Period | Tmin (°C) | Tmax (°C) | T Range (°C) | P (mm) | P Range (mm) |
|---|---|---|---|---|---|
| Interpolated Historical | 2.6–8.7 | 8.7–16.3 | 13.4 | 93–205 (1120–2455) | 112 (1335) |
| RCP 4.5 | 3.3–9.9 | 11.8–19.9 | 16.6 | 118–241 (1420–2895) | 123 (1475) |
| RCP 8.5 | 3.9–10.6 | 12.4–20.6 | 16.7 | 120–245 (1440–2936) | 125 (1496) |
| Period | Tmin (°C) | Tmax (°C) | T Range (°C) | P (mm) | P Range (mm) |
|---|---|---|---|---|---|
| Dry Hist (60–90) | 3–8.8 | 8.5–16 | 13 | 36–121 | 85 |
| Wet Hist (60–90) | 2.2–7.9 | 8.8–16.4 | 14.2 | 116–254 | 138 |
| Dry RCP 4.5 | 2.6–9.1 | 12.8–21.2 | 18.6 | 64–86 | 22 |
| Wet RCP 4.5 | 3.7–10.3 | 11.2–19.2 | 15.5 | 144–322 | 178 |
| Dry RCP 8.5 | 3.8–10.1 | 13.5–21.8 | 18 | 65–87 | 22 |
| Wet RCP 8.5 | 4–10.6 | 11.8–19.8 | 15.8 | 146–326 | 180 |
| Scenario | P (1) | P (0) | T (1) | T (0) | Comb. (1) | Comb. (0) | % (1) | % (0) |
|---|---|---|---|---|---|---|---|---|
| Dry RCP 4.5 | 674 | 0 | 410 | 264 | 410 | 264 | 61 | 39 |
| Wet RCP 4.5 | 600 | 74 | 620 | 54 | 586 | 88 | 87 | 13 |
| Dry RCP 8.5 | 674 | 0 | 326 | 348 | 326 | 348 | 48 | 52 |
| Wet RCP 8.5 | 594 | 80 | 447 | 227 | 445 | 229 | 66 | 34 |
| RCP 4.5 | 623 | 53 | 491 | 185 | 492 | 184 | 73 | 27 |
| RCP 8.5 | 617 | 59 | 474 | 202 | 406 | 270 | 60 | 40 |
© 2020 by the authors. Licensee MDPI, Basel, Switzerland. This article is an open access article distributed under the terms and conditions of the Creative Commons Attribution (CC BY) license (http://creativecommons.org/licenses/by/4.0/).
Share and Cite
Cresso, M.; Clerici, N.; Sanchez, A.; Jaramillo, F. Future Climate Change Renders Unsuitable Conditions for Paramo Ecosystems in Colombia. Sustainability 2020, 12, 8373. https://doi.org/10.3390/su12208373
Cresso M, Clerici N, Sanchez A, Jaramillo F. Future Climate Change Renders Unsuitable Conditions for Paramo Ecosystems in Colombia. Sustainability. 2020; 12(20):8373. https://doi.org/10.3390/su12208373
Chicago/Turabian StyleCresso, Matilda, Nicola Clerici, Adriana Sanchez, and Fernando Jaramillo. 2020. "Future Climate Change Renders Unsuitable Conditions for Paramo Ecosystems in Colombia" Sustainability 12, no. 20: 8373. https://doi.org/10.3390/su12208373
APA StyleCresso, M., Clerici, N., Sanchez, A., & Jaramillo, F. (2020). Future Climate Change Renders Unsuitable Conditions for Paramo Ecosystems in Colombia. Sustainability, 12(20), 8373. https://doi.org/10.3390/su12208373