Are Global Companies Better in Environmental Efficiency in India? Based on Metafrontier Malmquist CO2 Performance


Abstract
1. Introduction
1.1. Socio-Managerial Contexts
1.2. Research Motivation and Objective
1.3. Research Contribution
2. Literature Review
3. Model Design and Specification
3.1. Production Technology Set
3.2. CRS Non-Radial Directional Distance Function
3.3. Non-Radial Metafrontier Malmquist CO2 Performance Index (NMMCPI)
4. Analysis and Discussion
4.1. Data Collection and Preprocessing
4.2. Result and Its Implications
5. Conclusions
Author Contributions
Funding
Conflicts of Interest
Appendix A

| DMU | Group | NMMCPI | EC | BPC | TGC |
|---|---|---|---|---|---|
| FDI 1 | FDI | 1.0001 | 1.0008 | 1.0217 | 0.9781 |
| FDI 2 | FDI | 0.9997 | 1.0057 | 0.9971 | 0.9969 |
| FDI 3 | FDI | 1.0015 | 1.0056 | 1.0001 | 0.9958 |
| FDI 4 | FDI | 1.0004 | 1.0024 | 0.9705 | 1.0283 |
| FDI 5 | FDI | 0.9989 | 0.9999 | 0.9973 | 1.0017 |
| FDI 6 | FDI | 0.9964 | 0.9997 | 0.9897 | 1.0071 |
| FDI 7 | FDI | 1.0029 | 1.0143 | 0.9932 | 0.9955 |
| FDI 8 | FDI | 1.0007 | 1.0022 | 1.0345 | 0.9652 |
| FDI 9 | FDI | 1.0013 | 1.0071 | 1.0474 | 0.9492 |
| FDI 10 | FDI | 1.0152 | 1.0383 | 1.0150 | 0.9633 |
| FDI 11 | FDI | 1.0014 | 1.0041 | 0.9984 | 0.9989 |
| FDI 12 | FDI | 1.0004 | 1.0013 | 1.0019 | 0.9972 |
| FDI 13 | FDI | 1.0285 | 1.0389 | 1.0503 | 0.9426 |
| FDI 14 | FDI | 1.0001 | 1.0016 | 0.9893 | 1.0093 |
| FDI 15 | FDI | 1.0000 | 1.0004 | 0.9911 | 1.0086 |
| FDI 16 | FDI | 1.0002 | 1.0011 | 0.9982 | 1.0009 |
| FDI 17 | FDI | 1.0000 | 1.0004 | 0.9899 | 1.0098 |
| FDI 18 | FDI | 0.9876 | 0.9805 | 0.9991 | 1.0081 |
| FDI 19 | FDI | 1.0003 | 1.0011 | 0.9650 | 1.0354 |
| FDI 20 | FDI | 1.0023 | 1.0115 | 0.9945 | 0.9964 |
| FDI 21 | FDI | 0.9999 | 1.0051 | 0.9942 | 1.0006 |
| FDI 22 | FDI | 1.0003 | 1.0016 | 0.9790 | 1.0201 |
| FDI 23 | FDI | 1.0009 | 1.0031 | 0.9977 | 1.0001 |
| FDI 24 | FDI | 0.9997 | 1.0002 | 0.9598 | 1.0414 |
| FDI 25 | FDI | 0.9996 | 1.0062 | 0.9999 | 0.9935 |
| FDI | 1.0015 | 1.0053 | 0.9990 | 0.9978 | |
| Dom1 | Domestic | 1.0535 | 1.0000 | 0.9993 | 1.0542 |
| Dom2 | Domestic | 1.0011 | 1.0041 | 1.0023 | 0.9947 |
| Dom3 | Domestic | 0.9465 | 0.9523 | 1.0126 | 0.9815 |
| Dom4 | Domestic | 1.0003 | 1.0020 | 0.9981 | 1.0002 |
| Dom5 | Domestic | 1.0012 | 1.0040 | 0.9990 | 0.9982 |
| Dom6 | Domestic | 0.9915 | 0.9900 | 1.0137 | 0.9880 |
| Dom7 | Domestic | 1.0012 | 1.0081 | 1.0063 | 0.9869 |
| Dom8 | Domestic | 0.9949 | 0.9821 | 0.9986 | 1.0145 |
| Dom9 | Domestic | 1.0524 | 0.9892 | 1.0111 | 1.0522 |
| Dom10 | Domestic | 1.0182 | 1.0000 | 0.9813 | 1.0376 |
| Dom11 | Domestic | 1.0908 | 1.0662 | 0.9973 | 1.0258 |
| Dom12 | Domestic | 0.9978 | 0.9962 | 0.9990 | 1.0026 |
| Dom13 | Domestic | 1.0148 | 0.9709 | 1.0055 | 1.0395 |
| Dom14 | Domestic | 1.0024 | 1.0136 | 0.9988 | 0.9901 |
| Dom15 | Domestic | 1.0033 | 1.0130 | 0.9996 | 0.9908 |
| Dom16 | Domestic | 1.0002 | 1.0001 | 0.9992 | 1.0009 |
| Dom17 | Domestic | 0.9995 | 1.0017 | 1.0163 | 0.9818 |
| Dom18 | Domestic | 0.9985 | 0.9995 | 1.0102 | 0.9889 |
| Dom19 | Domestic | 1.0148 | 1.0575 | 1.0158 | 0.9447 |
| Dom20 | Domestic | 1.0003 | 1.0041 | 0.9916 | 1.0047 |
| Dom21 | Domestic | 1.1657 | 1.1630 | 0.9951 | 1.0073 |
| Dom22 | Domestic | 0.9563 | 0.9837 | 0.9987 | 0.9734 |
| Dom23 | Domestic | 1.0001 | 1.0008 | 0.9978 | 1.0015 |
| Dom24 | Domestic | 1.0650 | 1.0846 | 1.0162 | 0.9663 |
| Dom25 | Domestic | 0.9997 | 0.9998 | 0.9941 | 1.0058 |
| Domestic | 1.0148 | 1.0115 | 1.0023 | 1.0013 |
References
- Dillon, J. Another Climate Milestone Falls at Mauna Loa Observatory. Available online: https://scripps.ucsd.edu/programs/keelingcurve/2018/06/07/another-climate-milestone-falls-at-mauna-loa-observatory/ (accessed on 7 August 2020).
- Myllyvirta, L. Analysis: India’s CO2 Emissions Growth Poised to Slow Sharply in 2019. Available online: https://www.carbonbrief.org/analysis-indias-co2-emissions-growth-poised-to-slow-sharply-in-2019 (accessed on 7 August 2020).
- The World Bank. Available online: https://data.worldbank.org/indicator/EN.ATM.CO2E.KT?locations=IN (accessed on 21 September 2020).
- FDI Statistics. Available online: https://dipp.gov.in/sites/default/files/FDI_Factsheet_27May2019.pdf (accessed on 12 August 2020).
- Debroy, B.; Nayyar, D. Make in India. Available online: https://www.makeinindia.com/home (accessed on 7 August 2020).
- Kılıçarslan, Z.; Dumrul, Y. Foreign Direct Investments and CO2 Emissions Relationship: The Case of Turkey. Bus. Econ. Res. J. 2017, 8, 647–660. [Google Scholar] [CrossRef]
- Ran, N.; Majmudar, U. Sustainable Finance: Trends for 2020. Available online: https://economictimes.indiatimes.com/blogs/ResponsibleFuture/sustainable-finance-trends-for-2020/ (accessed on 7 August 2020).
- Aravossis, K.; Kapsalis, V.C.; Kyriakopoulos, G.; Xouleis, T.G. Development of a Holistic Assessment Framework for Industrial Organizations. Sustainability 2019, 11, 3946. [Google Scholar] [CrossRef]
- Kim, S. CO2 emissions, foreign direct investments, energy consumption, and GDP in developing countries: A more comprehensive study using panel vector error correction model. Korean Econ. Rev. 2019, 35, 5–24. [Google Scholar]
- Blalock, G.; Gertler, P.J. Welfare gains from Foreign Direct Investment through technology transfer to local suppliers. J. Int. Econ. 2008, 74, 402–421. [Google Scholar] [CrossRef]
- Guo, Z.F.; Lin, J.H.; Luo, J. An Empirical Analysis of the Regional Influence of FDI on Energy Efficiency in China. Adv. Mater. Res. 2013, 684, 626–629. [Google Scholar] [CrossRef]
- To, A.H.; Ha, D.T.-T.; Nguyen, H.M.; Vo, D.H. The Impact of Foreign Direct Investment on Environment Degradation: Evidence from Emerging Markets in Asia. Int. J. Environ. Res. Public Health 2019, 16, 1636. [Google Scholar] [CrossRef]
- Rao, M. The Impact of Environment on FDI. Available online: https://www.thehindu.com/opinion/op-ed/the-impact-of-environment-on-fdi/article24017203.ece (accessed on 7 August 2020).
- Copeland, B.R.; Taylor, M.S. North-South Trade and the Environment. Q. J. Econ. 1994, 109, 755–787. [Google Scholar] [CrossRef]
- Forslid, R.; Okubo, T.; Ulltveit-Moe, K.H. Why are firms that export cleaner? International trade, abatement and environmental emissions. J. Environ. Econ. Manag. 2018, 91, 166–183. [Google Scholar] [CrossRef]
- Mielnik, O.; Goldemberg, J. Foreign direct investment and decoupling between energy and gross domestic product in developing countries. Energy Policy 2002, 30, 87–89. [Google Scholar] [CrossRef]
- Yao, X.; Guo, C.; Shao, S.; Jiang, Z. Total-factor CO2 emission performance of China’s provincial industrial sector: A meta-frontier non-radial Malmquist index approach. Appl. Energy 2016, 184, 1142–1153. [Google Scholar] [CrossRef]
- Fan, M.; Shao, S.; Yang, L. Combining global Malmquist–Luenberger index and generalized method of moments to investigate industrial total factor CO2 emission performance: A case of Shanghai (China). Energy Policy 2015, 79, 189–201. [Google Scholar] [CrossRef]
- Solarin, S.A.; Al-Mulali, U. Influence of foreign direct investment on indicators of environmental degradation. Environ. Sci. Pollut. Res. 2018, 25, 24845–24859. [Google Scholar] [CrossRef] [PubMed]
- Lin, B.; Chen, X. Evaluating the CO2 performance of China’s non-ferrous metals Industry: A total factor meta-frontier Malmquist index perspective. J. Clean. Prod. 2019, 209, 1061–1077. [Google Scholar] [CrossRef]
- Lin, B.; Fei, R. Regional differences of CO2 emissions performance in China’s agricultural sector: A Malmquist index approach. Eur. J. Agron. 2015, 70, 33–40. [Google Scholar] [CrossRef]
- Liu, Q.; Wang, S.; Zhang, W.; Zhan, D.; Li, J. Does foreign direct investment affect environmental pollution in China’s cities? A spatial econometric perspective. Sci. Total Environ. 2018, 613, 521–529. [Google Scholar] [CrossRef]
- Salim, R.; Yao, Y.; Chen, G.; Zhang, L. Can foreign direct investment harness energy consumption in China? A time series investigation. Energy Econ. 2017, 66, 43–53. [Google Scholar] [CrossRef]
- Sarkodie, S.A.; Strezov, V. Effect of foreign direct investments, economic development and energy consumption on greenhouse gas emissions in developing countries. Sci. Total Environ. 2019, 646, 862–871. [Google Scholar] [CrossRef]
- Pan, X.; Guo, S.; Han, C.; Wang, M.; Song, J.; Liao, X. Influence of FDI quality on energy efficiency in China based on seemingly unrelated regression method. Energy 2020, 192, 116463. [Google Scholar] [CrossRef]
- Wang, S. Impact of FDI on energy efficiency: An analysis of the regional discrepancies in China. Nat. Hazards 2016, 85, 1209–1222. [Google Scholar] [CrossRef]
- Mastromarco, C.; Simar, L. Effect of FDI and Time on Catching Up: New Insights from a Conditional Nonparametric Frontier Analysis. J. Appl. Econ. 2014, 30, 826–847. [Google Scholar] [CrossRef]
- Yue, S.; Yang, Y.; Hu, Y. Does Foreign Direct Investment Affect Green Growth? Evidence from China’s Experience. Sustainability 2016, 8, 158. [Google Scholar] [CrossRef]
- Song, M.; Tao, J.; Wang, S. FDI, technology spillovers and green innovation in China: Analysis based on Data Envelopment Analysis. Ann. Oper. Res. 2013, 228, 47–64. [Google Scholar] [CrossRef]
- Yang, X.; Li, C. Industrial environmental efficiency, foreign direct investment and export ——Evidence from 30 provinces in China. J. Clean. Prod. 2019, 212, 1490–1498. [Google Scholar] [CrossRef]
- Lei, M.; Zhao, X.; Deng, H.; Tan, K.C. LeeDEA analysis of FDI attractiveness for sustainable development: Evidence from Chinese provinces. Decisi. Support. Syst. 2013, 56, 406–418. [Google Scholar] [CrossRef]
- Zang, C.Q.; Liu, Y. Analysis on total-factor energy efficiency and its influencing factors of Shandong thinking about environmental pollution. China Popul. Resour. Environ. 2012, 22, 8. [Google Scholar]
- Monaheng, M.P.; Donghui, Z.; Zaman, Q.U. The Relationship between FDI and Economic Performance (BRICS). Eur. Online J. Nat. Soc. Sci. 2019, 8, 148–157. [Google Scholar]
- Luo, J.; Cheng, K. The Influence of FDI on Energy Efficiency of China: An Empirical Analysis Based on DEA Method. Appl. Mech. Mater. 2013, 291, 1217–1220. [Google Scholar] [CrossRef]
- Lee, H.; Choi, Y. Greenhouse gas performance of Korean local governments based on non-radial DDF. Technol. Forecast. Soc. Chang. 2018, 135, 13–21. [Google Scholar] [CrossRef]
- Färe, R.; Grosskopf, S. New Directions: Efficiency and Productivity; Springer Science & Business Media: Berlin, Germany, 2006; Volume 3. [Google Scholar]
- Zhang, N.; Zhou, P.; Choi, Y. Energy efficiency, CO2 emission performance and technology gaps in fossil fuel electricity generation in Korea: A meta-frontier non-radial directional distance functionanalysis. Energy Policy 2013, 56, 653–662. [Google Scholar] [CrossRef]
- Faere, R.; Grosskopf, S.; Lovell, C.A.K.; Pasurka, C. Multilateral Productivity Comparisons When Some Outputs are Undesirable: A Nonparametric Approach. Rev. Econ. Stat. 1989, 71, 90. [Google Scholar] [CrossRef]
- Zhang, N.; Choi, Y. Total-factor carbon emission performance of fossil fuel power plants in China: A metafrontier non-radial Malmquist index analysis. Energy Econ. 2013, 40, 549–559. [Google Scholar] [CrossRef]
- Pyatt, G.; Shephard, R.W. Theory of Cost and Production Functions. Econ. J. 1972, 82, 1059. [Google Scholar] [CrossRef]
- Chambers, R.G.; Chung, Y.; Färe, R. Benefit and Distance Functions. J. Econ. Theory 1996, 70, 407–419. [Google Scholar] [CrossRef]
- Zhang, N.; Choi, Y. A note on the evolution of directional distance function and its development in energy and environmental studies 1997–2013. Renew. Sustain. Energy Rev. 2014, 33, 50–59. [Google Scholar] [CrossRef]
- Zhou, P.; Ang, B.; Wang, H. Energy and CO2 emission performance in electricity generation: A non-radial directional distance function approach. Eur. J. Oper. Res. 2012, 221, 625–635. [Google Scholar] [CrossRef]
- Fukuyama, H.; Weber, W.L. A directional slacks-based measure of technical inefficiency. Socio-Econ. Plan. Sci. 2009, 43, 274–287. [Google Scholar] [CrossRef]
- Choi, Y.; Lee, H.S. Heterogeneity and its policy implications in GHG emission performance of manufacturing industries. Carbon Manag. 2018, 9, 347–360. [Google Scholar] [CrossRef]
- Choi, Y.; Lee, H.S. Are Emissions Trading Policies Sustainable? A Study of the Petrochemical Industry in Korea. Sustainability 2016, 8, 1110. [Google Scholar] [CrossRef]
- Zhang, N.; Choi, Y. A comparative study of dynamic changes in CO2 emission performance of fossil fuel power plants in China and Korea. Energy Policy 2013, 62, 324–332. [Google Scholar] [CrossRef]
- Wang, Q.; Zhang, H.; Zhang, W. A Malmquist CO2 emission performance index based on a metafrontier approach. Math. Comput. Model. 2013, 58, 1068–1073. [Google Scholar] [CrossRef]
- Oh, D.-H. A metafrontier approach for measuring an environmentally sensitive productivity growth index. Energy Econ. 2010, 32, 146–157. [Google Scholar] [CrossRef]
- Oh, D.-H.; Lee, J.-D. A metafrontier approach for measuring Malmquist productivity index. Empir. Econ. 2009, 38, 47–64. [Google Scholar] [CrossRef]
- INFOGRAPHIC: India’s Energy-Related CO2 Emissions. Available online: https://energy.economictimes.indiatimes.com/news/coal/infographic-indias-energy-related-co2-emissions/72277641 (accessed on 21 September 2020).
- Singh, A. Why Do Indian Businesses Need to Take Air Pollution Seriously? Available online: https://wri-india.org/blog/why-do-indian-businesses-need-take-air-pollution-seriously (accessed on 7 August 2020).
- Lee, M.; Jin, Y. The substitutability of nuclear capital for thermal capital and the shadow price in the Korean electric power industry. Energy Policy 2012, 51, 834–841. [Google Scholar] [CrossRef]
- Choi, Y.; Yu, Y.; Lee, H.S. A Study on the Sustainable Performance of the Steel Industry in Korea Based on SBM-DEA. Sustainability 2018, 10, 173. [Google Scholar] [CrossRef]
- Choi, Y.; Lee, H.; Mastur, A. Are Sustainable Development Policies Really Feasible? Focused on the Petrochemical Industry in Korea. Sustainability 2019, 11, 3980. [Google Scholar] [CrossRef]
- Indian Economic Growth Slowed Down in 2016–2017: Government. Available online: https://economictimes.indiatimes.com/news/economy/indicators/indian-economic-growth-slowed-down-in-2016-17-government/articleshow/62294363.cms?from=mdr (accessed on 7 August 2020).


| Reference(s) | Field of Research | Measurement | Method | Input/Output | Conclusions |
|---|---|---|---|---|---|
| Pan et al. (2019) [25] | FDI Quality in China | Energy efficiency | SBM-DEA | Input—energy, capital, and labor. Desirable output-GDP of each province. Undesirable output—CO2 emissions. | Positive |
| Wang (2017) [26] | FDI on energy efficiency in China | Energy efficiency | Sequential DEA | Input—capital, labor, and energy. Desirable output—GDP. Undesirable output—SO2 and CO2. | Positive |
| Mastromarco et al. (2017) [27] | FDI and time | Efficiency | DEA | Input—labor and capital. Output—GDP. | Positive |
| Yue et al. (2016) [28] | FDI from China’s Experience | Efficiency | SBM-DEA | Input—capital, labor, and energy. Desirable output—GDP. Undesirable output—SO2. | Positive |
| Song et al. (2015) [29] | FDI in China | Efficiency | DEA | Input—variables passed the test. Desirable output—the number of patents. | Positive |
| Yang et al. (2019) [30] | FDI and export in China | Environmental efficiency | SBM-DEA | Input—labor, capital stock, energy consumption, and water consumption. Desirable output—industrial added value. Undesirable output—CO2 emissions, SO2 emissions, and wastewater. | Negative |
| Lei et al. (2013) [31] | FDI attractiveness from Chinese provinces | Bottleneck | DEA | Input—material capital, human capital, energy, and degree of openness. Output—FDI Performance Index and FDI Potential Index. | Negative |
| Zang et al. (2012) [32] | FDI in developing countries | Energy efficiency | Super-efficiency DEA | Negative | |
| Monaheng et al. (2019) [33] | FDI and economic performance (BRICS) | Economic performance | DEA (managerial disposability) | Input—oil, labor force, and capital. Desirable output—GDP. Undesirable output—economic production. | Mixed |
| Guo et al. (2013) [11] | Regional Influence of FDI in China | Energy efficiency | DEA | Input—capital, labor and energy. Desirable output—GDP. Undesirable output—environmental pollution | Mixed |
| Luo et al. (2013) [34] | FDI of China | Environmental performance | DEA | Input—capital, labor, and energy. Output—GDP. | Mixed |
| Group | Variable | Input/Output | Unit | Mean | Std. Deviation | Maximum | Minimum |
|---|---|---|---|---|---|---|---|
| FDI | Capital | Input | Million rupees | 16,134.19 | 29,101.62 | 145,220.00 | 103.85 |
| Employee | Input | Per person | 3387.12 | 4968.39 | 24,491.00 | 48.00 | |
| Energy | Input | Gj | 362,115.59 | 654,115.20 | 3,195,000.00 | 3116.16 | |
| Sales Turnover | Desirable output | Million rupees | 49,033.27 | 90,114.70 | 493,699.73 | 813.75 | |
| CO2 Emissions | Undesirable output | Tons | 17,782.89 | 36,434.82 | 218,541.00 | 111.40 | |
| Domestic | Capital | Input | Million rupees | 173,821.11 | 4,315,63.83 | 3,004,470.00 | 549.20 |
| Employee | Input | Per person | 10,790.33 | 14,906.18 | 71,826.00 | 133.00 | |
| Energy | Input | Gj | 1,981,662.00 | 3,012,483.17 | 13,180,794.43 | 17,142.97 | |
| Sales Turnover | Desirable output | Million rupees | 305,544.82 | 738,513.58 | 3,990,530.00 | 1082.51 | |
| CO2 Emissions | Undesirable output | Tons | 100,795.48 | 159,748.60 | 636,676.79 | 612.86 |
| Variables | Capital | Employee | Energy | Sales Turnover | CO2 |
|---|---|---|---|---|---|
| Capital | 1.00 | ||||
| Employee | 0.27 | 1.00 | |||
| Energy | 0.50 | 0.50 | 1.00 | ||
| Sales turnover | 0.82 | 0.22 | 0.29 | 1.00 | |
| CO2 emission | 0.48 | 0.41 | 0.96 | 0.26 | 1.00 |
| FDI | Domestic | |||||||
|---|---|---|---|---|---|---|---|---|
| Year | NMMCPI | EC | BPC | TGC | NMMCPI | EC | BPC | TGC |
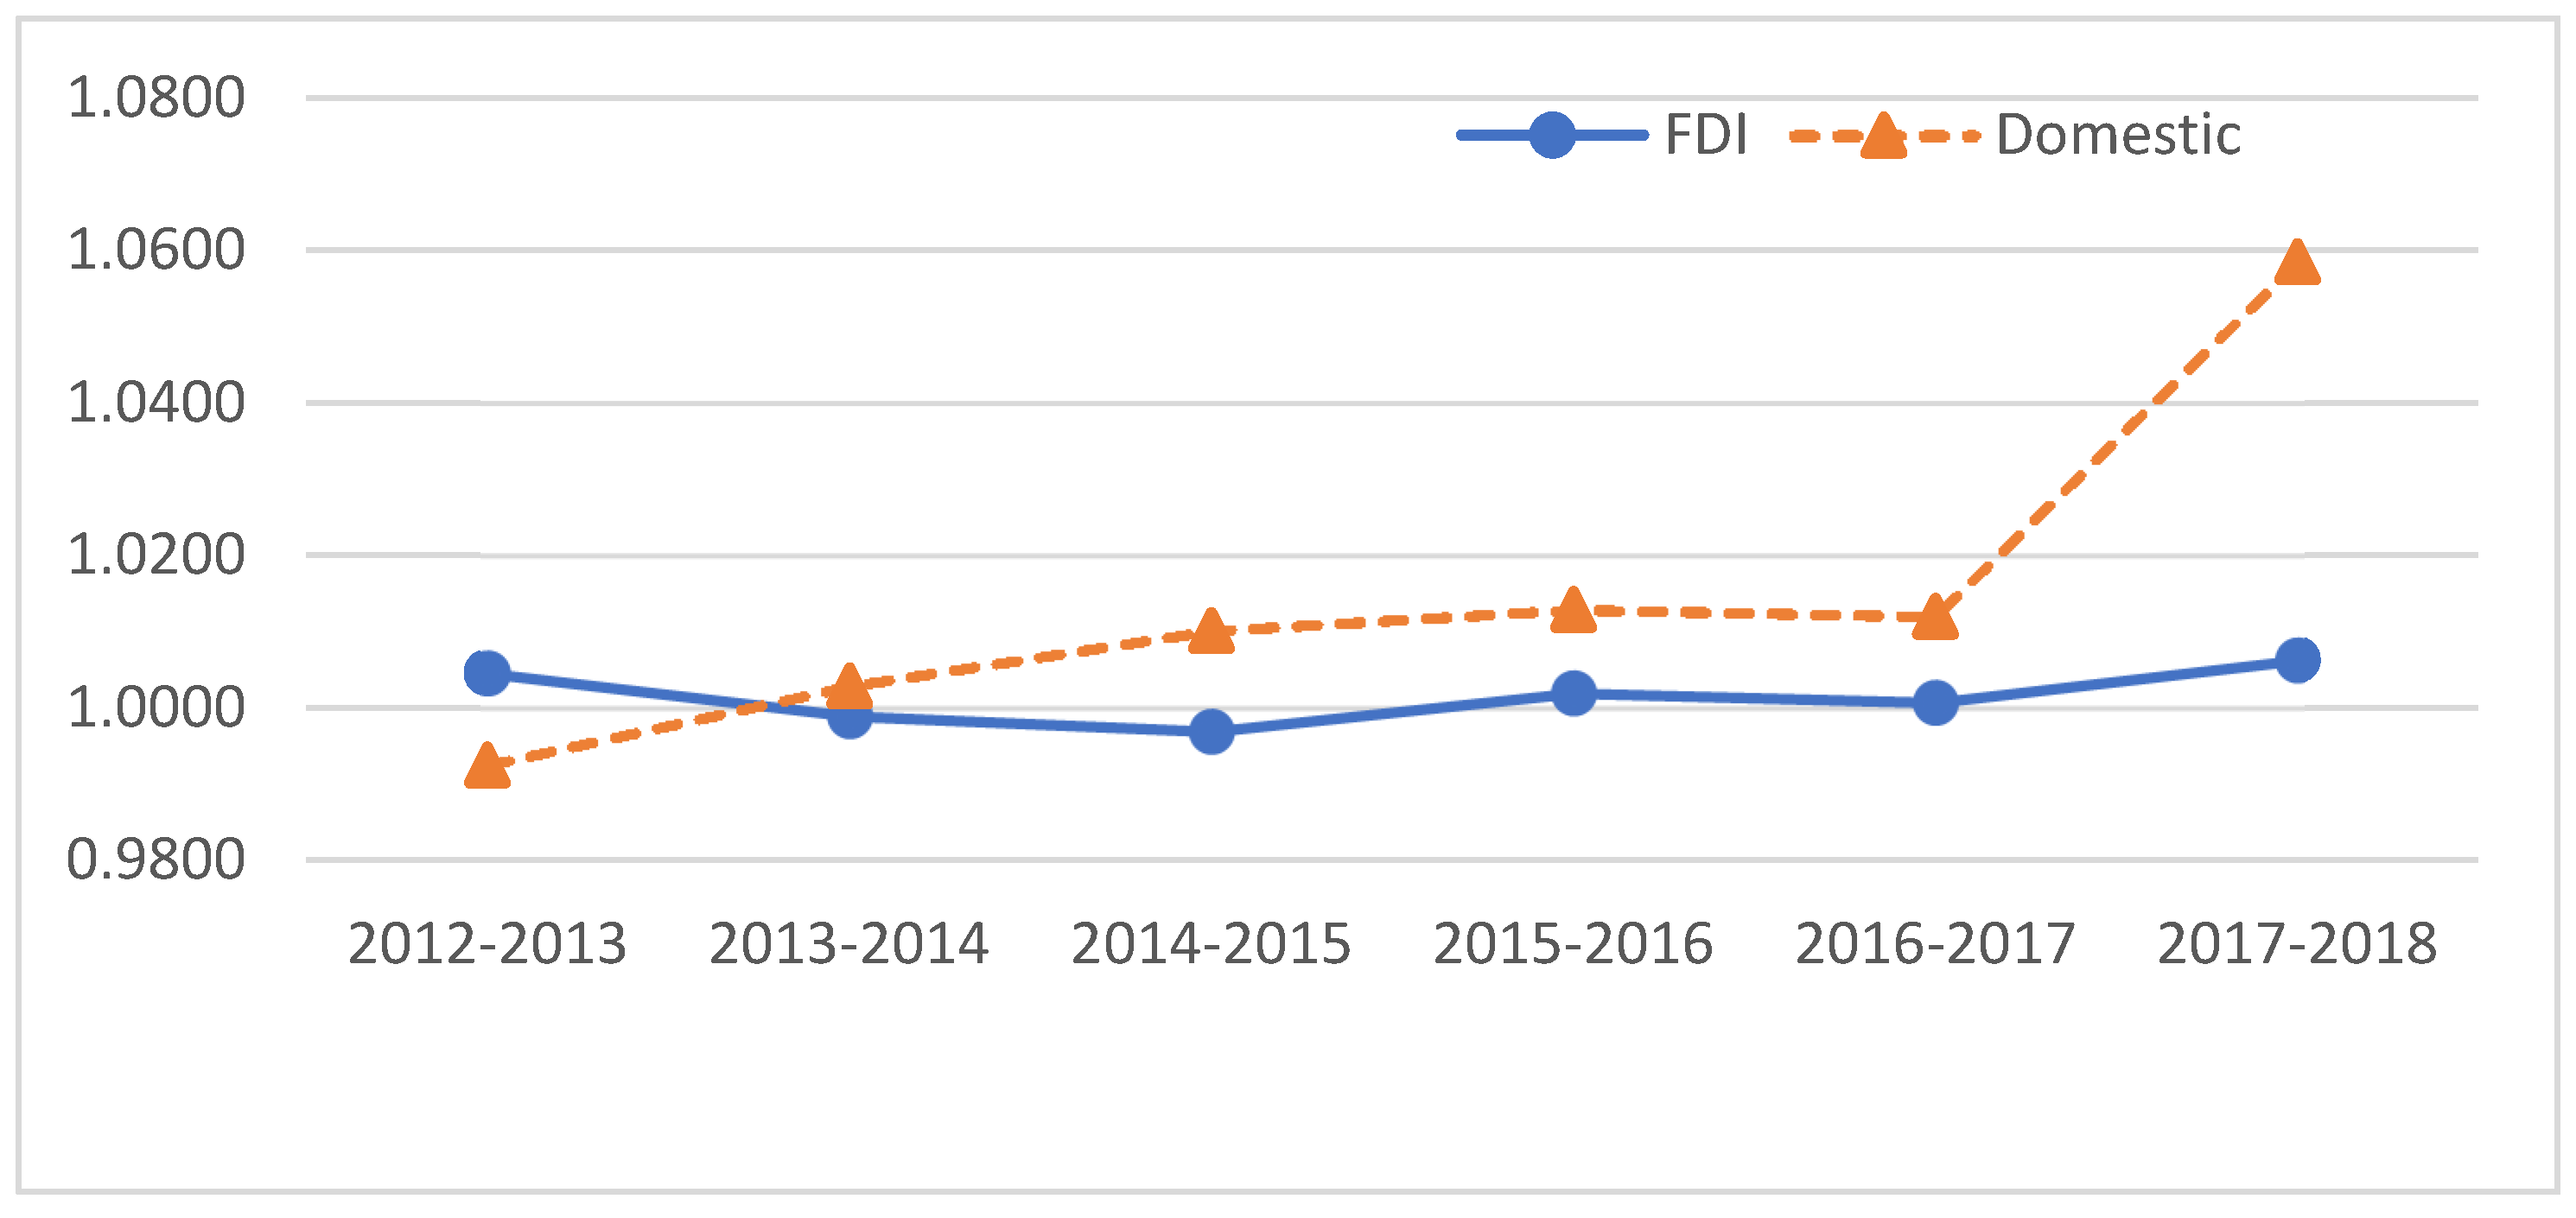
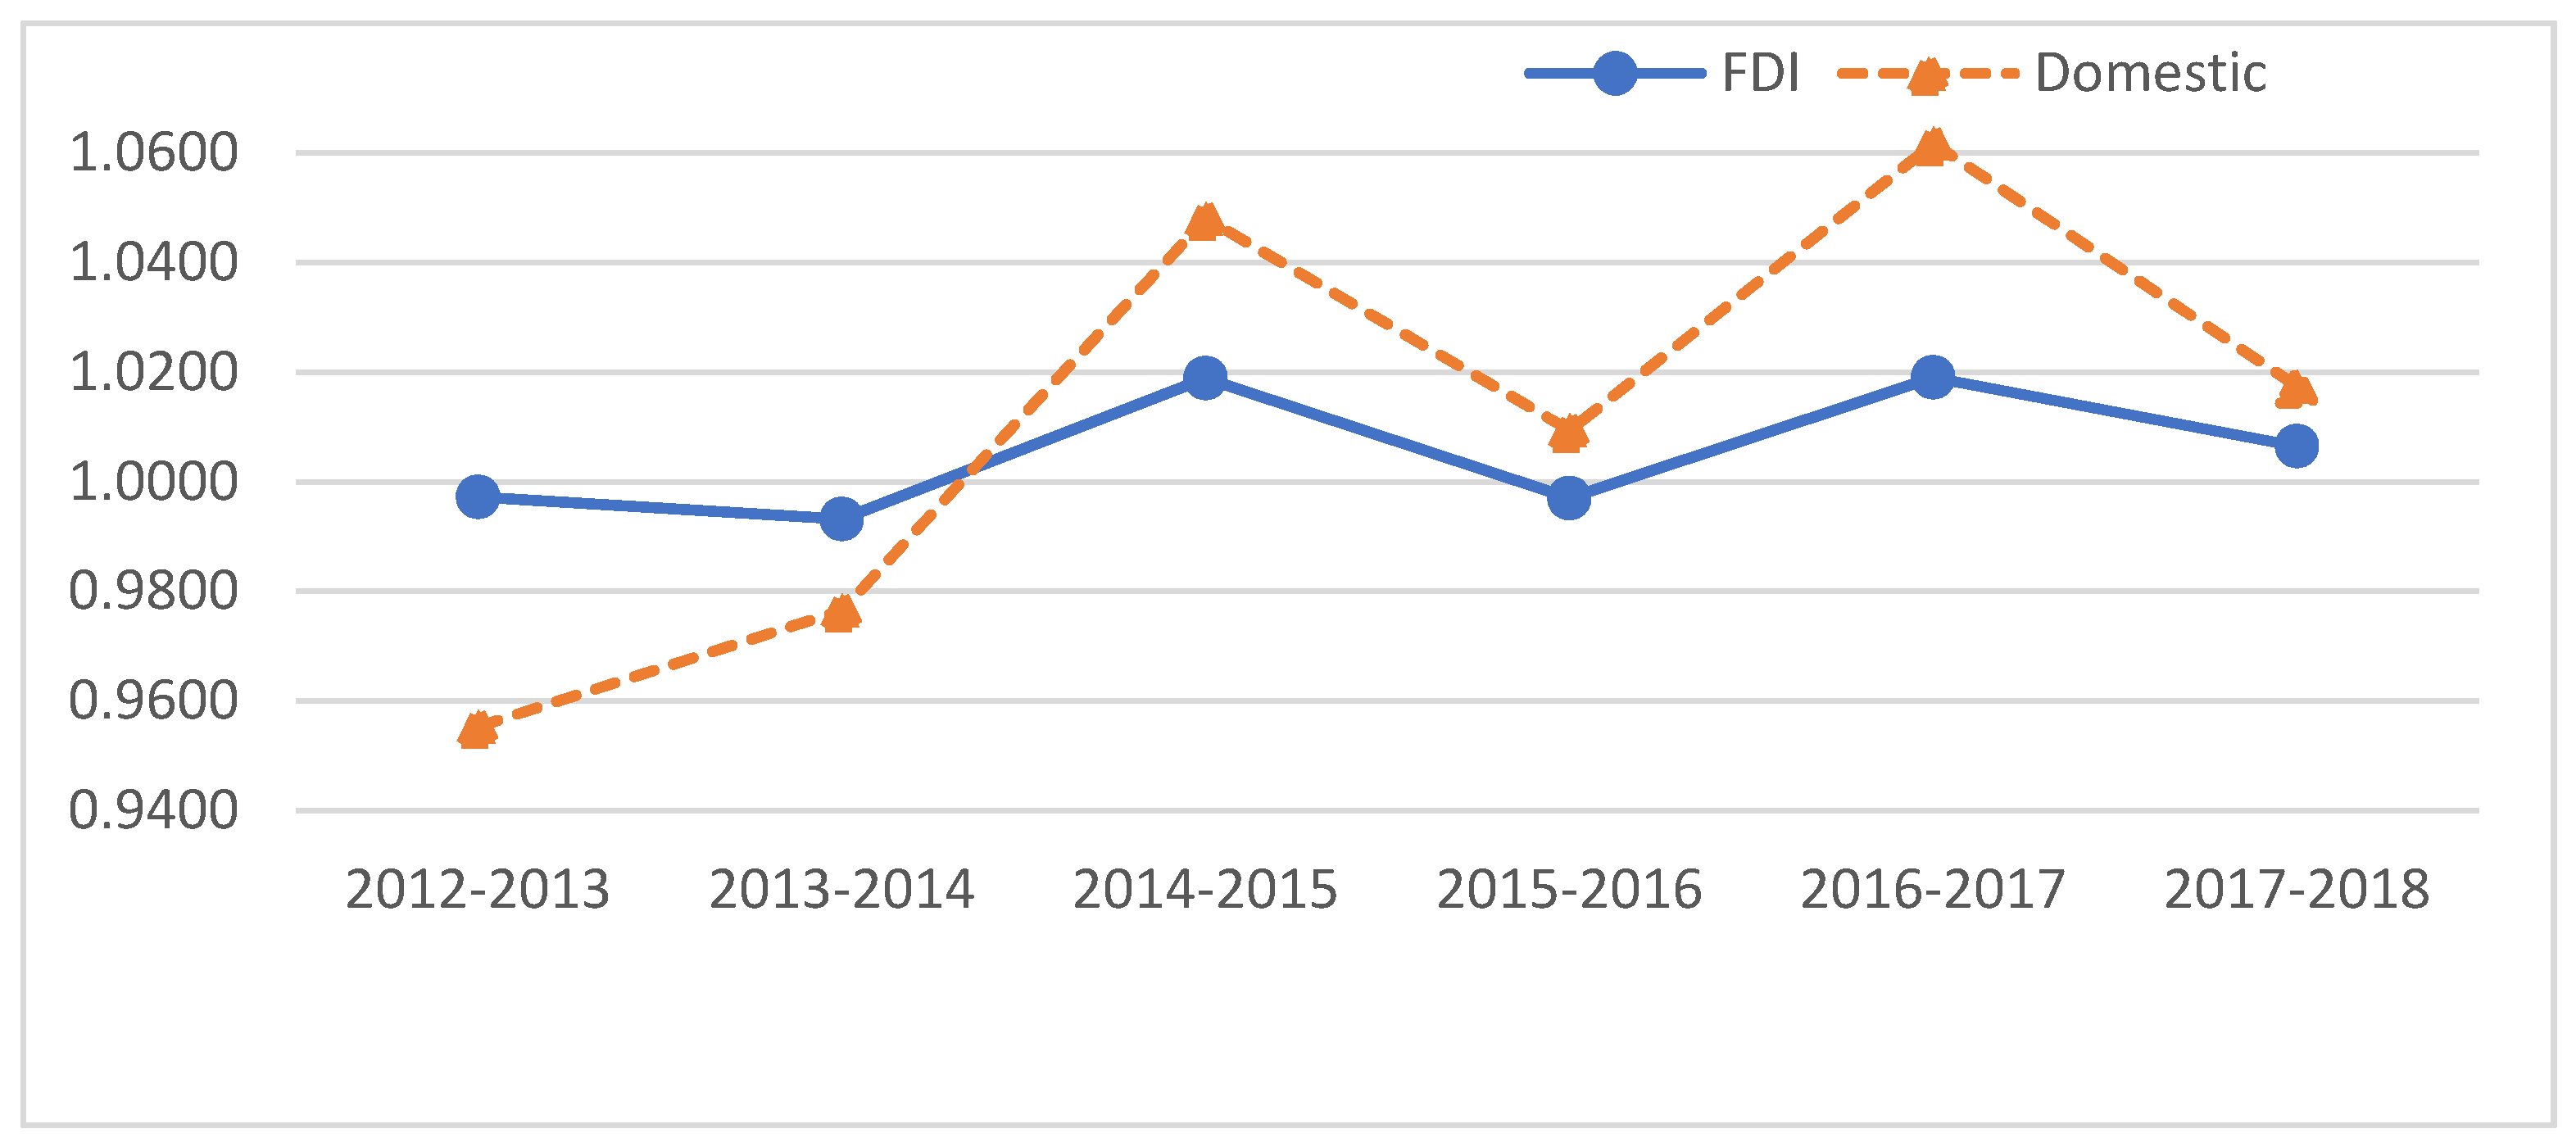
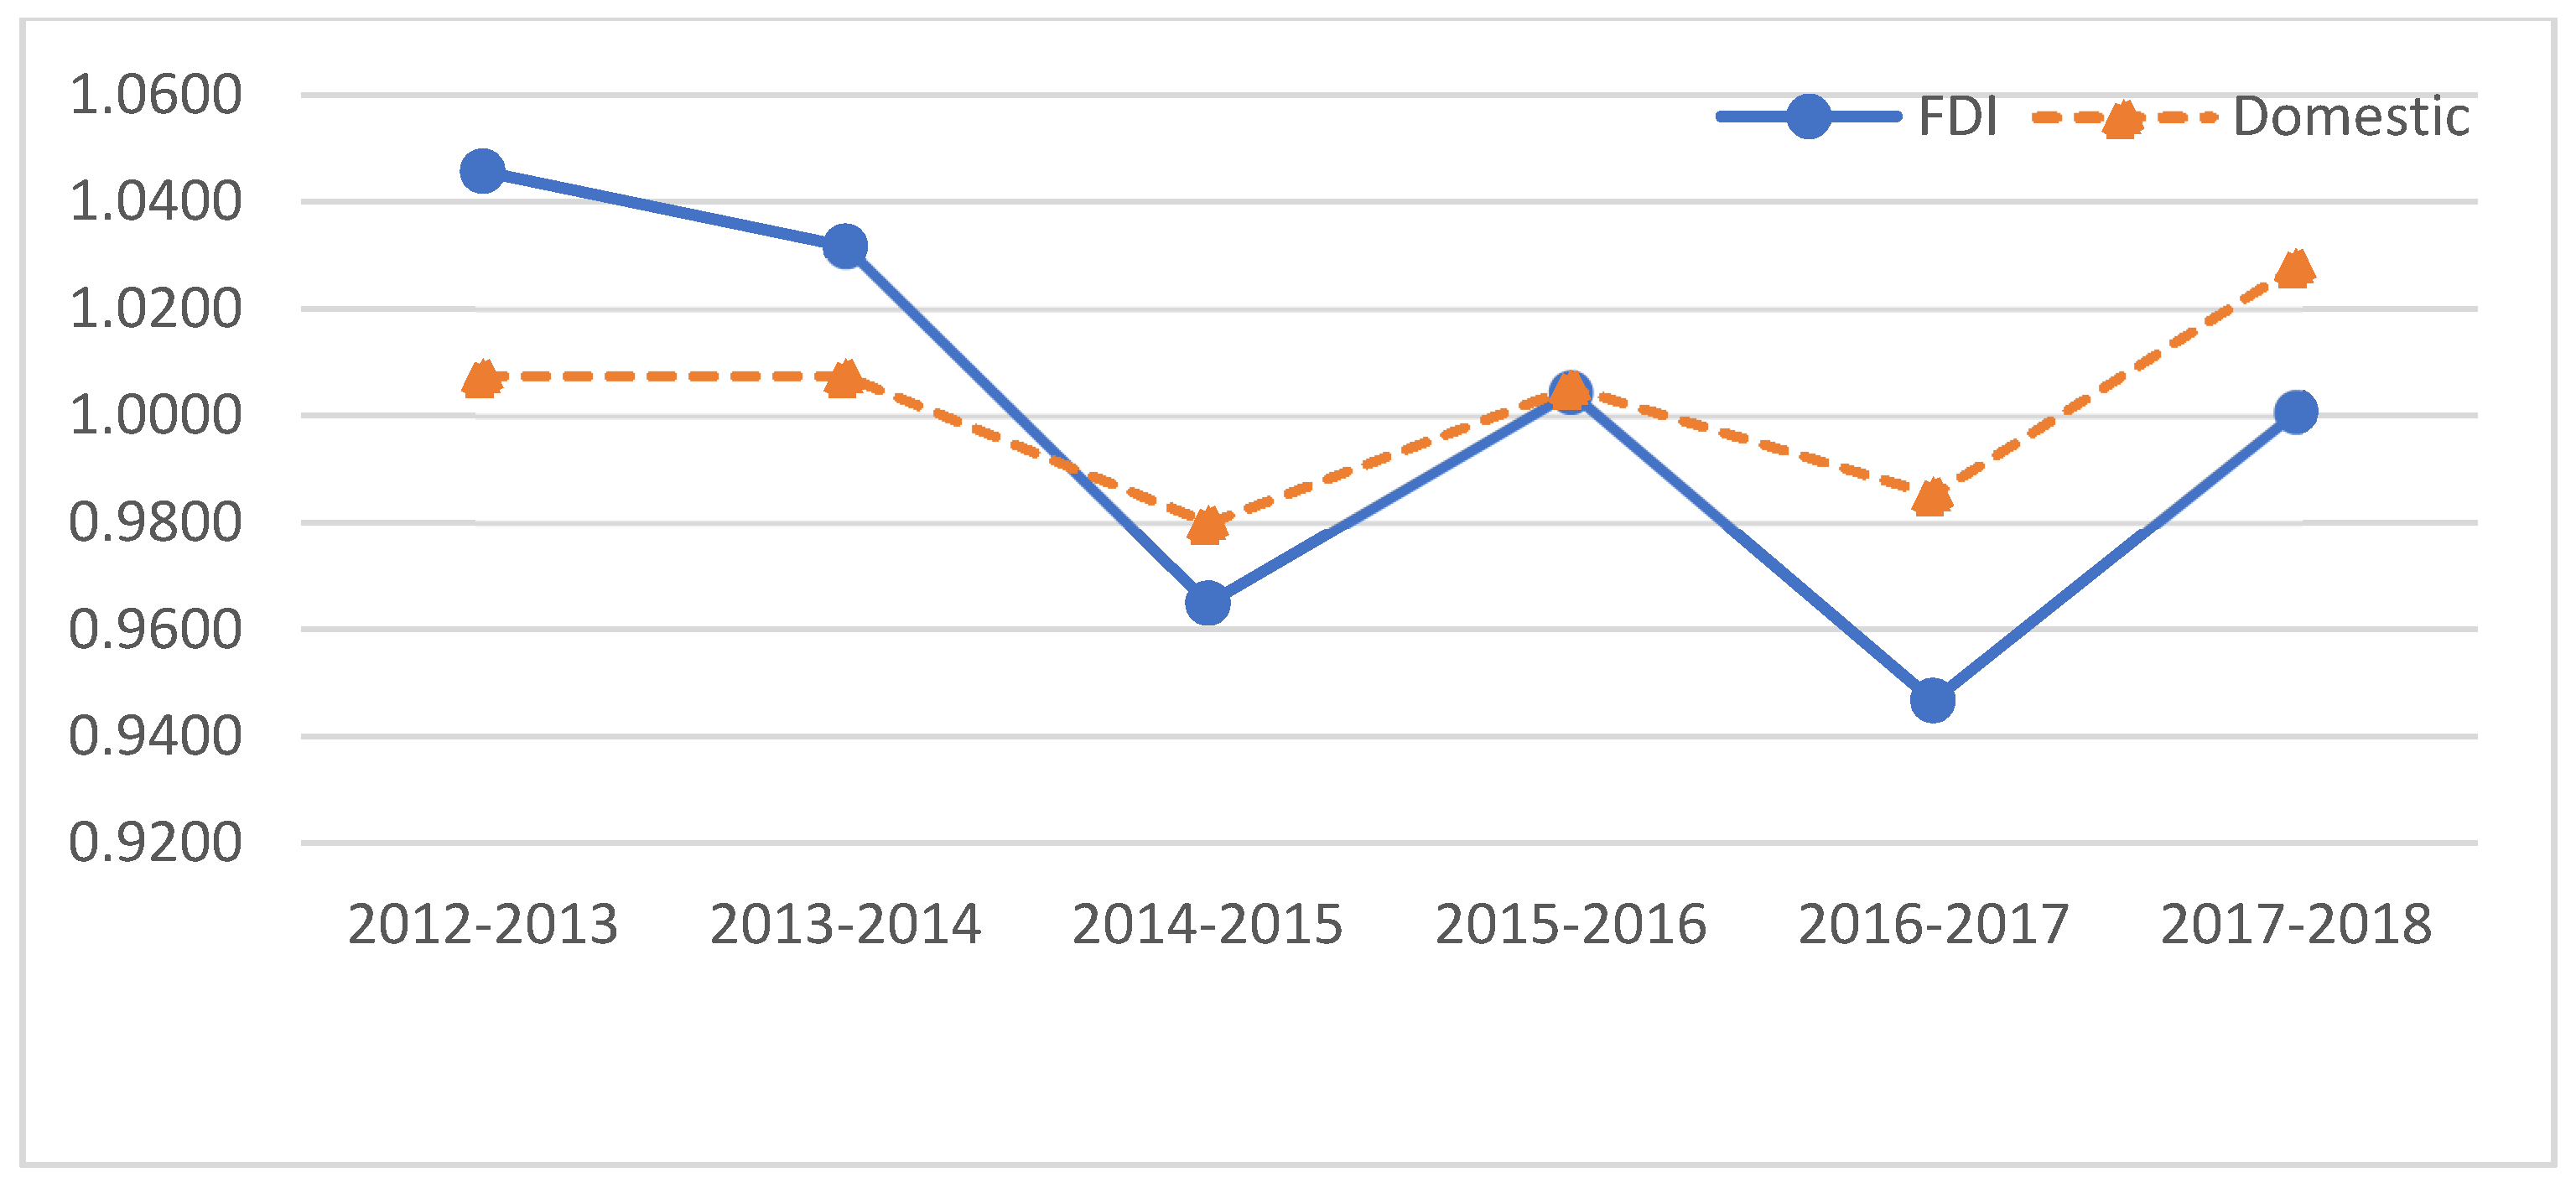
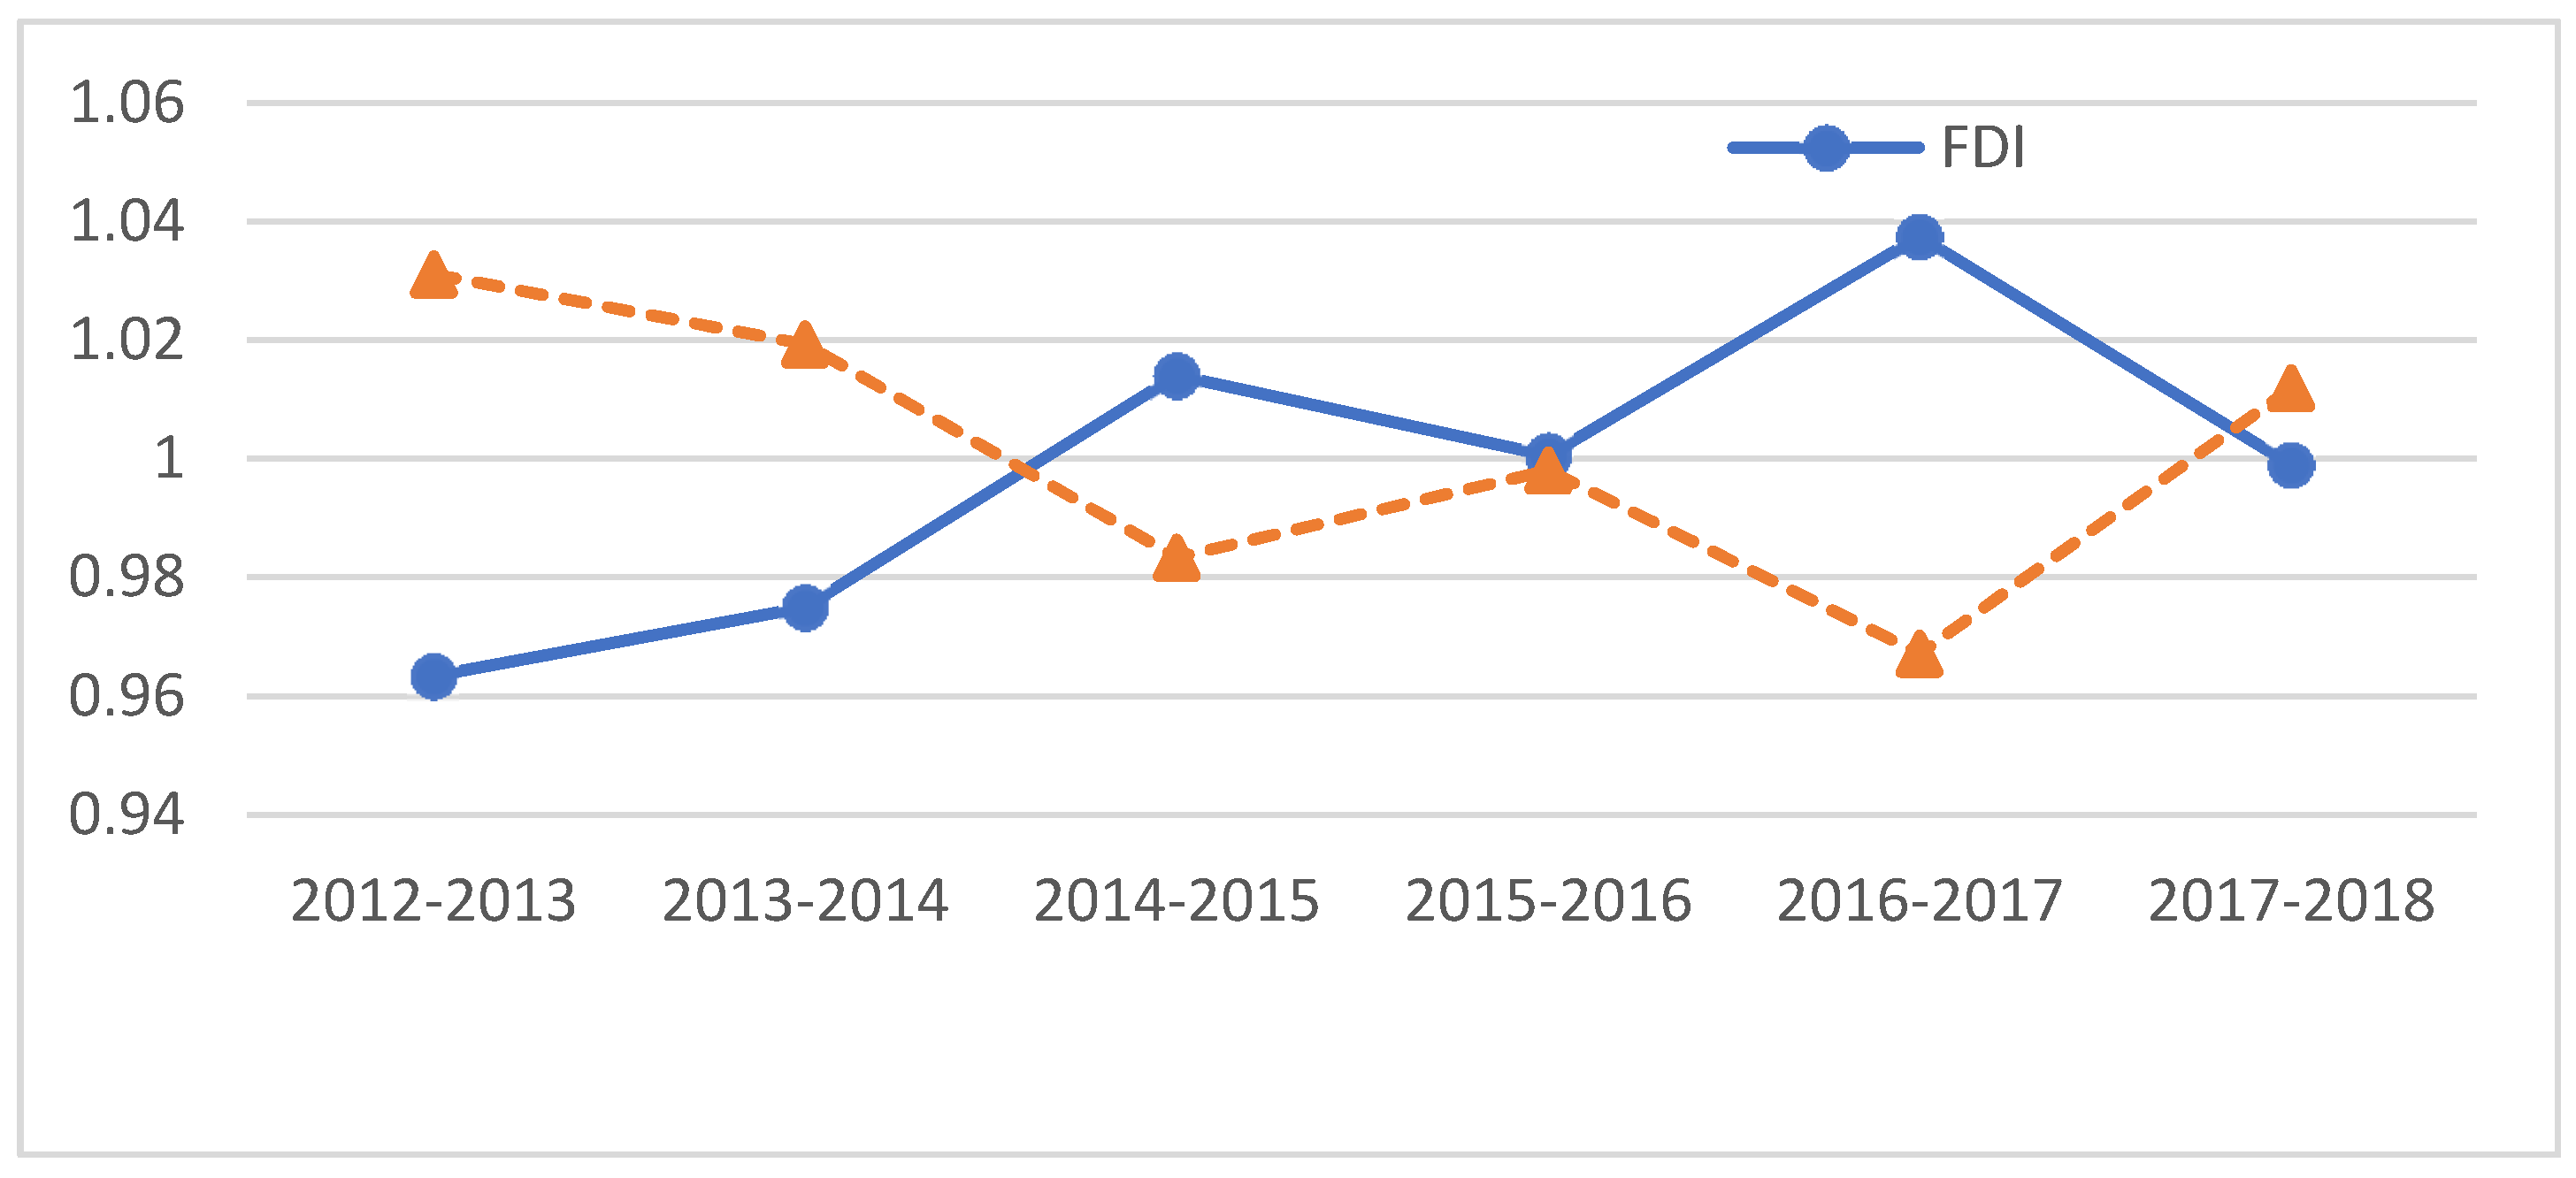
| 2012–2013 | 1.0046 | 0.9972 | 1.0457 | 0.9634 | 0.9925 | 0.9554 | 1.0075 | 1.0311 |
| 2013–2014 | 0.9989 | 0.9932 | 1.0316 | 0.9749 | 1.0029 | 0.9766 | 1.0075 | 1.0193 |
| 2014–2015 | 0.9969 | 1.0189 | 0.9649 | 1.0140 | 1.0101 | 1.0481 | 0.9800 | 0.9834 |
| 2015–2016 | 1.0019 | 0.9970 | 1.0044 | 1.0005 | 1.0129 | 1.0094 | 1.0054 | 0.9981 |
| 2016–2017 | 1.0007 | 1.0190 | 0.9466 | 1.0374 | 1.0120 | 1.0618 | 0.9854 | 0.9672 |
| 2017–2018 | 1.0062 | 1.0065 | 1.0007 | 0.9990 | 1.0585 | 1.0174 | 1.0281 | 1.0120 |
| Average | 1.0015 | 1.0053 | 0.9990 | 0.9982 | 1.0148 | 1.0115 | 1.0023 | 1.0019 |
© 2020 by the authors. Licensee MDPI, Basel, Switzerland. This article is an open access article distributed under the terms and conditions of the Creative Commons Attribution (CC BY) license (http://creativecommons.org/licenses/by/4.0/).
Share and Cite
Choi, Y.; Lee, H.; Debbarma, J. Are Global Companies Better in Environmental Efficiency in India? Based on Metafrontier Malmquist CO2 Performance. Sustainability 2020, 12, 8359. https://doi.org/10.3390/su12208359
Choi Y, Lee H, Debbarma J. Are Global Companies Better in Environmental Efficiency in India? Based on Metafrontier Malmquist CO2 Performance. Sustainability. 2020; 12(20):8359. https://doi.org/10.3390/su12208359
Chicago/Turabian StyleChoi, Yongrok, Hyoungsuk Lee, and Jahira Debbarma. 2020. "Are Global Companies Better in Environmental Efficiency in India? Based on Metafrontier Malmquist CO2 Performance" Sustainability 12, no. 20: 8359. https://doi.org/10.3390/su12208359
APA StyleChoi, Y., Lee, H., & Debbarma, J. (2020). Are Global Companies Better in Environmental Efficiency in India? Based on Metafrontier Malmquist CO2 Performance. Sustainability, 12(20), 8359. https://doi.org/10.3390/su12208359