Contaminants of Emerging Concern Removal in an Effluent of Wastewater Treatment Plant under Biological and Continuous Mode Ultrafiltration Treatment
Abstract
1. Introduction
- Constant product flow even during cleanings
- Up to 30% cost reduction
- 50% footprint reduction
- 5% higher net production
- Large reduction of occupied space (suitable for modular plants)
2. Materials and Methods
2.1. Equipment for UF and Operation Procedure
2.2. Sampling Method
2.3. Analytical Method and Method Assurance
3. Results and Discussion
3.1. Relationship Between Ammonium Concentration and Emerging Contaminants Concentration
3.2. Removal Yields of Emerging Contaminants with the Biological Treatment
3.3. Removal Yields of Emerging Contaminants with UF Treatment
3.4. Removal Yields and Adsorption Phenomena in UF Treatment
3.5. Toxicity Test
4. Conclusions
5. Patents
Author Contributions
Funding
Acknowledgments
Conflicts of Interest
References
- Chávez, A.M.; Ribeiro, A.R.; Moreira, N.F.F.; Silva, A.M.T.; Rey, A.; Álvarez, P.M.; Beltrán, F.J. Removal of Organic Micropollutants from a Municipal Wastewater Secondary Effluent by UVA-LED Photocatalytic Ozonation. Catalysts 2019, 9, 472. [Google Scholar] [CrossRef]
- Lopera, A.E.C.; Ruiz, S.G.; Alonso, J.M.Q. Removal of emerging contaminants from wastewater using reverse osmosis for its subsequent reuse: Pilot plant. J. Water Process. Eng. 2019, 29, 100800. [Google Scholar] [CrossRef]
- Gros, M.; Petrovic, M.; Barceló, D. Analysis of Emerging Contaminants of Municipal and Industrial Origin. In Emerging Contaminants from Industrial and Municipal Waste: Occurrence, Analysis and Effects; Barceló, D., Petrovic, M., Eds.; The Handbook of Environmental Chemistry; Springer: Berlin/Heidelberg, Germany, 2008; pp. 37–104. ISBN 978-3-540-74795-6. [Google Scholar]
- Quiñones, D.H.; Álvarez, P.M.; Rey, A.; Beltrán, F.J. Removal of emerging contaminants from municipal WWTP secondary effluents by solar photocatalytic ozonation—A pilot-scale study. Sep. Purif. Technol. 2015, 149, 132–139. [Google Scholar] [CrossRef]
- Tran, N.H.; Reinhard, M.; Gin, K.Y.H. Occurrence and fate of emerging contaminants in municipal wastewater treatment plants from different geographical regions—A review. Water Res. 2018, 133, 182–207. [Google Scholar] [CrossRef] [PubMed]
- Prasse, C.; Stalter, D.; Schulte-Oehlmann, U.; Oehlmann, J.; Ternes, T.A. Spoilt for choice: A critical review on the chemical and biological assessment of current wastewater treatment technologies. Water Res. 2015, 87, 237–270. [Google Scholar] [CrossRef] [PubMed]
- Montes-Grajales, D.; Fennix-Agudelo, M.; Miranda-Castro, W. Occurrence of personal care products as emerging chemicals of concern in water resources: A review. Sci. Total Environ. 2017, 595, 601–614. [Google Scholar] [CrossRef]
- Pereira, L.C.; De Souza, A.O.; Bernardes, M.F.F.; Pazin, M.; Tasso, M.J.; Pereira, P.H.; Dorta, D.J. A perspective on the potential risks of emerging contaminants to human and environmental health. Environ. Sci. Pollut. Res. 2015, 22, 13800–13823. [Google Scholar] [CrossRef]
- Luo, Y.L.; Guo, W.S.; Ngo, H.H.; Nghiem, L.D.; Hai, F.I.; Zhang, J.; Liang, S.; Wang, X.C. A review on the occurrence of micropollutants in the aquatic environment and their fate and removal during wastewater treatment. Sci. Total Environ. 2014, 473, 619–641. [Google Scholar] [CrossRef]
- Vulliet, E.; Cren-Olive, C.; Grenier-Loustalot, M.F. Occurrence of pharmaceuticals and hormones in drinking water treated from surface waters. Environ. Chem. Lett. 2011, 9, 103–114. [Google Scholar] [CrossRef]
- Shelley, L.K.; Ross, P.S.; Miller, K.M.; Kaukinen, K.H.; Kennedy, C.J. Toxicity of atrazine and nonylphenol in juvenile rainbow trout (Oncorhynchus mykiss): Effects on general health, disease susceptibility and gene expression. Aquat. Toxicol. 2012, 124, 217–226. [Google Scholar] [CrossRef]
- De Wever, H.; Verachtert, H. Biodegradation and toxicity of benzothiazoles. Water Res. 1997, 31, 2673–2684. [Google Scholar] [CrossRef]
- European Environment Agency. Urban Waste Water Treatment. Available online: https://www.eea.europa.eu/data-and-maps/indicators/urban-waste-water-treatment/urban-waste-water-treatment-assessment-4 (accessed on 16 December 2019).
- Oturan, M.A.; Aaron, J.J. Advanced Oxidation Processes in Water/Wastewater Treatment: Principles and Applications. A Review. Crit. Rev. Environ. Sci. Technol. 2014, 44, 2577–2641. [Google Scholar] [CrossRef]
- Nasirabadi, P.S.; Saljoughi, E.; Mousavi, S.M. Membrane processes used for removal of pharmaceuticals, hormones, endocrine disruptors and their metabolites from wastewaters: A review. Desalin. Water Treat. 2016, 57, 24146–24175. [Google Scholar] [CrossRef]
- Van Der Bruggen, B.; Vandecasteele, C.; Van Gestel, T.; Doyen, W.; Leysen, R. A review of pressure-driven membrane processes in wastewater treatment and drinking water production. Environ. Prog. 2003, 22, 46–56. [Google Scholar] [CrossRef]
- Wang, J.; Tian, Z.; Huo, Y.B.; Yang, M.; Zheng, X.C.; Zhang, Y. Monitoring of 943 organic micropollutants in wastewater from municipal wastewater treatment plants with secondary and advanced treatment processes. J. Environ. Sci. 2018, 67, 309–317. [Google Scholar] [CrossRef]
- Kudlek, E. Decomposition of Contaminants of Emerging Concern in Advanced Oxidation Processes. Water 2018, 10, 955. [Google Scholar] [CrossRef]
- Márquez, G.; Rodríguez, E.M.; Beltrán, F.J.; Álvarez, P.M. Solar photocatalytic ozonation of a mixture of pharmaceutical compounds in water. Chemosphere 2014, 113, 71–78. [Google Scholar] [CrossRef]
- De La Cruz, N.; Esquius, L.; Grandjean, D.; Magnet, A.; Tungler, A.; De Alencastro, L.; Pulgarin, C. Degradation of emergent contaminants by UV, UV/H2O2 and neutral photo-Fenton at pilot scale in a domestic wastewater treatment plant. Water Res. 2013, 47, 5836–5845. [Google Scholar] [CrossRef]
- Serna-Galvis, E.A.; Silva-Agredo, J.; Giraldo, A.L.; Flórez-Acosta, O.A.; Torres-Palma, R.A.; Torres, R. Comparative study of the effect of pharmaceutical additives on the elimination of antibiotic activity during the treatment of oxacillin in water by the photo-Fenton, TiO2-photocatalysis and electrochemical processes. Sci. Total Environ. 2016, 541, 1431–1438. [Google Scholar] [CrossRef]
- Shi, B.J.; Wang, Y.; Geng, Y.K.; Liu, R.D.; Pan, X.R.; Li, W.W.; Sheng, G.P. Application of membrane bioreactor for sulfamethazine-contained wastewater treatment. Chemosphere 2018, 193, 840–846. [Google Scholar] [CrossRef]
- Acero, J.L.; Benitez, F.J.; Leal, A.I.; Real, F.J.; Teva, F. Membrane filtration technologies applied to municipal secondary effluents for potential reuse. J. Hazard. Mater. 2010, 177, 390–398. [Google Scholar] [CrossRef] [PubMed]
- Dolar, D.; Vuković, A.; Asperger, D.; Kosutić, K. Effect of water matrices on removal of veterinary pharmaceuticals by nanofiltration and reverse osmosis membranes. J. Environ. Sci. 2011, 23, 1299–1307. [Google Scholar] [CrossRef]
- Ferrer-Polonio, E.; McCabe, M.; Mendoza-Roca, J.A.; Vincent-Vela, M.C. Fractionation of secondary effluents of wastewater treatment plants in view of the evaluation of membrane fouling in a further ultrafiltration step. J. Chem. Technol. Biotechnol. 2018, 93, 1495–1501. [Google Scholar] [CrossRef]
- Gupta, V.K.; Carrott, P.J.M.; Carrott, M.M.L.R.; Suhas. Low-Cost Adsorbents: Growing Approach to Wastewater Treatment—A Review. Crit. Rev. Environ. Sci. Technol. 2009, 39, 783–842. [Google Scholar] [CrossRef]
- Sanz, J.; Lombraña, J.I.; De Luis, A. Temperature-assisted UV/H2O2 oxidation of concentrated linear alkylbenzene sulphonate (LAS) solutions. Chem. Eng. J. 2013, 533–541. [Google Scholar] [CrossRef]
- Ferreiro, C.; Villota, N.; Lombraña, J.I.; Rivero, M.J.; Zúñiga, V.; Rituerto, J.M. Analysis of a Hybrid Suspended-Supported Photocatalytic Reactor for the Treatment of Wastewater Containing Benzothiazole and Aniline. Water 2019, 11, 337. [Google Scholar] [CrossRef]
- Villota, N.; Lomas, J.M.; Camarero, L.M. Effect of ultrasonic waves on the water turbidity during the oxidation of phenol. Formation of (hydro) peroxo complexes. Ultrason. Sonochem. 2017, 39, 439–445. [Google Scholar] [CrossRef]
- Benner, J.; Helbling, D.E.; Kohler, H.P.E.; Wittebol, J.; Kaiser, E.; Prasse, C.; Ternes, T.A.; Albers, C.N.; Aamand, J.; Horemans, B.; et al. Is biological treatment a viable alternative for micropollutant removal in drinking water treatment processes? Water Res. 2013, 47, 5955–5976. [Google Scholar] [CrossRef]
- Oller, I.; Malato, S.; Sánchez-Pérez, J. Combination of Advanced Oxidation Processes and biological treatments for wastewater decontamination—A review. Sci. Total Environ. 2011, 409, 4141–4166. [Google Scholar] [CrossRef]
- Uribe, I.O.; Mosquera-Corral, A.; Rodicio, J.L.; Esplugas, S. Advanced technologies for water treatment and reuse. AIChE J. 2015, 61, 3146–3158. [Google Scholar] [CrossRef]
- Mijangos, L.; Ziarrusta, H.; Olivares, M.; Zuloaga, O.; Moeder, M.; Etxebarria, N.; Prieto, A. Simultaneous determination of 41 multiclass organic pollutants in environmental waters by means of polyethersulfone microextraction followed by liquid chromatography-tandem mass spectrometry. Anal. Bioanal. Chem. 2018, 410, 615–632. [Google Scholar] [CrossRef] [PubMed]
- Association, A.P.H. Standard Methods for the Examination of Water & Wastewater; American Public Health Association: Washington, DC, USA, 2005; ISBN 978-0-87553-047-5. [Google Scholar]
- Bicudo, J.R.; Brown, T.; Waller, M.; Saint, W.; Summach, D. Addressing ammonia levels in the Grand River through nitrification upgrades at the Kitchener WWTP. Influents 2016, 11, 54–57. [Google Scholar]
- Mijangos, L.; Ziarrusta, H.; Ros, O.; Kortazar, L.; Fernández, L.A.; Olivares, M.; Zuloaga, O.; Prieto, A.; Etxebarria, N. Occurrence of emerging pollutants in estuaries of the Basque Country: Analysis of sources and distribution, and assessment of the environmental risk. Water Res. 2018, 147, 152–163. [Google Scholar] [CrossRef] [PubMed]
- ECHA. CoRAP List of Substances. Available online: https://echa.europa.eu/information-on-chemicals/evaluation/community-rolling-action-plan/corap-list-of-substances (accessed on 2 July 2019).
- De Luis, A.M.; Lombraña, J.I.; Menéndez, A.; Sanz, J. Analysis of the Toxicity of Phenol Solutions Treated with H2O2/UV and H2O2/Fe Oxidative Systems. Ind. Eng. Chem. Res. 2011, 50, 1928–1937. [Google Scholar] [CrossRef]
- García-Becerra, F.Y.; Ortiz, I. Biodegradation of Emerging Organic Micropollutants in Nonconventional Biological Wastewater Treatment: A Critical Review. Environ. Eng. Sci. 2018, 35, 1012–1036. [Google Scholar] [CrossRef]
- Behera, S.K.; Kim, H.W.; Oh, J.E.; Park, H.S. Occurrence and removal of antibiotics, hormones and several other pharmaceuticals in wastewater treatment plants of the largest industrial city of Korea. Sci. Total Environ. 2011, 409, 4351–4360. [Google Scholar] [CrossRef]
- Zhang, Y.; Geißen, S.U.; Gal, C. Carbamazepine and diclofenac: Removal in wastewater treatment plants and occurrence in water bodies. Chemosphere 2008, 73, 1151–1161. [Google Scholar] [CrossRef]
- Gómez, M.; Bueno, M.M.; Lacorte, S.; Fernández-Alba, A.; Agüera, A. Pilot survey monitoring pharmaceuticals and related compounds in a sewage treatment plant located on the Mediterranean coast. Chemosphere 2007, 66, 993–1002. [Google Scholar] [CrossRef]
- Kasprzyk-Hordern, B.; Dinsdale, R.M.; Guwy, A.J. The removal of pharmaceuticals, personal care products, endocrine disruptors and illicit drugs during wastewater treatment and its impact on the quality of receiving waters. Water Res. 2009, 43, 363–380. [Google Scholar] [CrossRef]
- Sui, Q.; Huang, J.; Deng, S.; Yu, G.; Fan, Q. Occurrence and removal of pharmaceuticals, caffeine and DEET in wastewater treatment plants of Beijing, China. Water Res. 2010, 44, 417–426. [Google Scholar] [CrossRef]
- Acero, J.L.; Benitez, F.J.; Teva, F.; Leal, A.I. Retention of emerging micropollutants from UP water and a municipal secondary effluent by ultrafiltration and nanofiltration. Chem. Eng. J. 2010, 163, 264–272. [Google Scholar] [CrossRef]
- Yoon, Y.; Westerhoff, P.; Snyder, S.A.; Wert, E.C.; Yoon, J. Removal of endocrine disrupting compounds and pharmaceuticals by nanofiltration and ultrafiltration membranes. Desalination 2007, 202, 16–23. [Google Scholar] [CrossRef]
- Hendricks, D. Fundamentals of Water Treatment Unit Processes: Physical, Chemical, and Biological, 1st ed.; CRC Press: Boca Ratón, FL, USA, 2010. [Google Scholar]
- Kimura, K.; Amy, G.; Drewes, J.; Watanabe, Y. Adsorption of hydrophobic compounds onto NF/RO membranes: An artifact leading to overestimation of rejection. J. Membr. Sci. 2003, 221, 89–101. [Google Scholar] [CrossRef]

| Application | Micropollutant | CAS Registry Number | Properties of Concern (European Chemicals Agency, ECHA) |
|---|---|---|---|
| Food additives | |||
| Acesulfame | 55589-62-3 | — | |
| Caffeine | 58-08-2 | — | |
| Methylparaben | 99-76-3 | Possibly endocrine disrupting | |
| Sucralose | 56038-13-2 | — | |
| Herbicides | |||
| Atrazine | 1912-24-9 | Skin sensitizing | |
| Diuron | 330-54-1 | Possibly carcinogenic Possibly endocrine disrupting Substance included in the Community Rolling Action Plan (CoRAP) | |
| Isoproturon | 34123-59-6 | Possibly carcinogenic | |
| Simasine | 122-34-9 | Possibly carcinogenic | |
| Industrial additives | |||
| 2-hydroxybenzothiazole | 934-34-9 | — | |
| Perfluorooctanesulfonamide (PFOSA) | 754-91-6 | — | |
| Perfluoro-n-nonanoic acid (PFNA) | 375-95-1 | Possibly carcinogenic Toxic to reproduction Persistent, bioaccumulative and toxic Substance of very high concern (SVHC) and included in the candidate list | |
| Potassium nonafluoro-1-butanesulfonate | 29420-49-3 | — | |
| Potassium perfluoro-1-octanesulfonate (PFOS) | 2795-39-3 | Possibly carcinogenic Toxic to reproduction | |
| Medicaments | |||
| Acetaminophen | 103-90-2 | — | |
| Amitriptyline hydrochloride | 549-18-8 | Skin sensitizing Respiratory sensitizing | |
| Bezafibrate | 41859-67-0 | — | |
| Carbamazepine | 298-46-4 | Skin sensitizing Respiratory sensitizing | |
| Ciprofloxacin | 85721-33-1 | — | |
| Clofibric acid | 882-09-7 | — | |
| Diclofenac | 15307-86-5 | — | |
| Eprosartan mesylate | 144143-96-4 | — | |
| Genistein | 446-72-0 | — | |
| Genistin | 529-59-9 | — | |
| Glycitin | 40246-10-4 | — | |
| Imipramine | 50-49-7 | — | |
| Irbesartan | 138402-11-6 | Toxic to reproduction | |
| Ketoprofen | 22071-15-4 | — | |
| Losartan Free Acid | 114798-26-4 | Toxic to reproduction Skin sensitizing | |
| Norfloxacin | 70458-96-7 | — | |
| Phenytoin | 57-41-0 | — | |
| Progesterone | 57-83-0 | Carcinogenic Toxic to reproduction | |
| Propranolol | 525-66-6 | — | |
| Sulfadiazine | 68-35-9 | Skin sensitizing Respiratory sensitising | |
| Sulfamethoxazole | 723-46-6 | Carcinogenic Skin sensitizing | |
| Telmisartan | 144701-48-4 | — | |
| Testosterone | 58-22-0 | — | |
| Trimethoprim | 738-70-5 | — | |
| Valsartan | 137862-53-4 | — | |
| Personal Care | |||
| Butylparaben | 94-26-8 | — |
| Micropollutant | Concentration (ng/L) | |||
|---|---|---|---|---|
| H1 | H2 | H3 | H4 | |
| Acetaminophen | 50,421 ± 3460 | 48,352 ± 1919 | 54,557 ± 1040 | 112,762 ± 4788 |
| Caffeine | 21,493 ± 1350 | 18,835 ± 382 | 16,047 ± 655 | 31,704 ± 1309 |
| Valsartan | 17,340 ± 245 | 10,072 ± 1220 | 12,143 ± 120 | 30,979 ± 1499 |
| Sulfamethoxazole | 8828 ± 119 | 2189 ± 62 | 135 ± 1 | 283 ± 4 |
| Trimethoprim | 5581 ± 116 | 851 ± 2 | 76 ± 1 | 82 ± 1 |
| Methylparaben | 5139 ± 119 | 2937 ± 100 | 2094 ± 67 | 8400 ± 250 |
| Acesulfame | 5041 ± 581 | 4102 ± 181 | 5851 ± 332 | 25,092 ± 1808 |
| Losartan free acid | 1267 ± 38 | 917 ± 168 | 1056 ± 4 | 1723 ± 125 |
| Genistein | 1191 ± 33 | 1198 ± 208 | 739 ± 97 | 1184 ± 131 |
| Eprosartan mesylate | 1049 ± 10 | 799 ± 108 | 874 ± 29 | 1588 ± 94 |
| Ketoprofen | 865 ± 99 | 643 ± 27 | 579 ± 42 | 1117 ± 86 |
| Irbesartan | 829 ± 4 | 714 ± 61 | 822 ± 24 | 1070 ± 42 |
| Diclofenac | 766 ± 18 | 692 ± 10 | 582 ± 17 | 458 ± 10 |
| Telmisartan | 593 ± 1 | 704 ± 30 | 1386 ± 129 | 1476 ± 67 |
| Norfloxacin | 452 ± 3 | 363 ± 5 | 233 ± 15 | 365 ± 10 |
| 2-hydroxybenzothiazole | 422 ± 9 | 240 ± 3 | 219 ± 27 | 271 ± 14 |
| Progesterone | 243 ± 8 | 205 ± 1 | — | 276 ± 33 |
| Bezafibrate | 207 ± 5 | 199 ± 10 | 272 ± 18 | 474 ± 22 |
| Perfluorosulfonamide | 203 ± 11 | 148 ± 22 | 196 ± 12 | 302 ± 27 |
| Diuron | 174 ± 1 | 147 ± 8 | 57 ± 1 | 76 ± 2 |
| Carbamazepine | 116 ± 1 | 86 ± 2 | 90 ± 2 | 120 ± 2 |
| Testosterone | 107 ± 4 | 74 ± 7 | 61 ± 2 | 101 ± 6 |
| Ciprofloxacin | 79 ± 5 | 63 ± 2 | 51 ± 1 | 69 ± 3 |
| Amitriptyline | 68 ± 1 | 68 ± 2 | 71 ± 3 | 112 ± 3 |
| Phenytoin | 45 ± 2 | 41 ± 1 | 36 ± 6 | 49 ± 4 |
| Propranolol | 24 ± 1 | 23 ± 5 | 23 ± 2 | 17 ± 2 |
| Isoproturon | 3 ± 1 | 2 ± 1 | 2 ± 1 | 2 ± 1 |
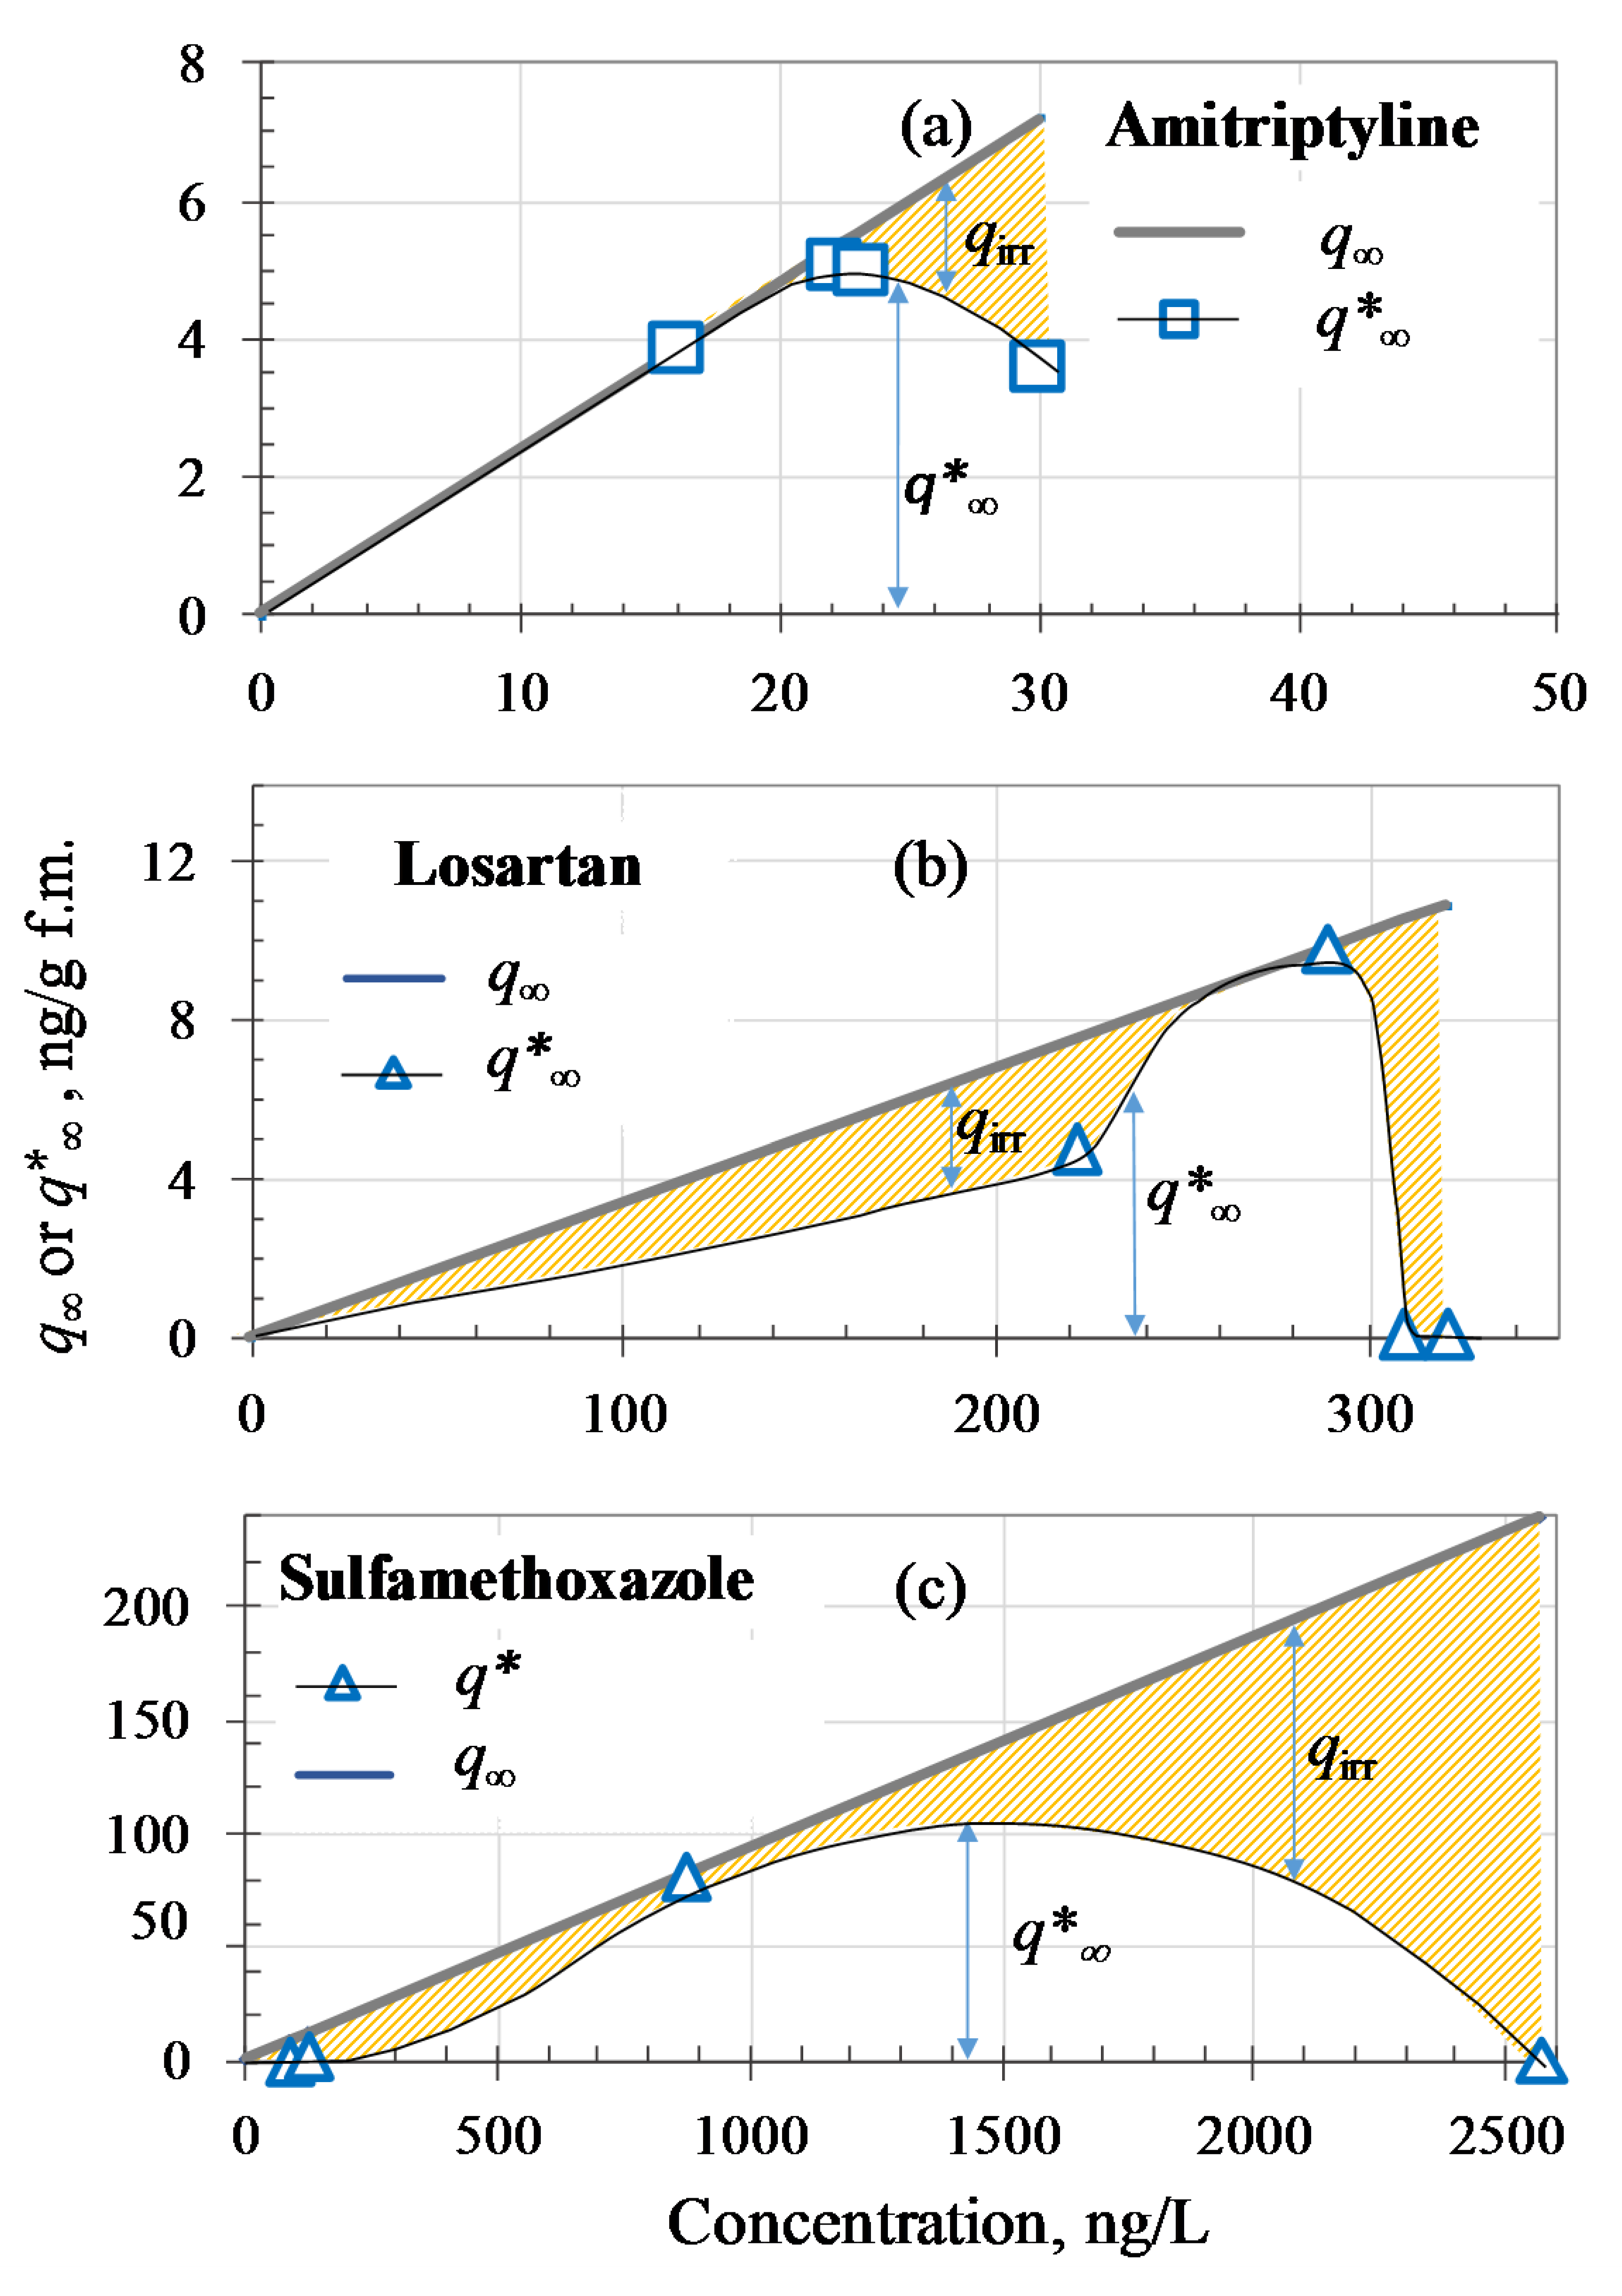
| Micropollutant | C0, ng/L | η, % | Cp, ng/L | KF, (ng/g) (L/ng)nF | q∞, ng/g | kads, g (ng min)−1 | qirr, ng/g | q∞*, ng/g | Fq |
|---|---|---|---|---|---|---|---|---|---|
| Amitriptyline | |||||||||
| 51 | 68.6 | 16 | 2.40 × 10⁻¹ | 3.8 | 11.9 | 0.0 | 3.8 | 0.000 | |
| 68 | 67.6 | 22 | 2.40 × 10⁻¹ | 5.3 | 11.9 | 0.2 | 5.0 | 0.044 | |
| 69 | 66.7 | 23 | 2.40 × 10⁻¹ | 5.5 | 11.9 | 0.5 | 5.0 | 0.086 | |
| 63 | 52.4 | 30 | 2.40 × 10⁻¹ | 7.2 | 11.9 | 3.6 | 3.6 | 0.497 | |
| Caffeine | |||||||||
| 90 | 27.0 | 65.5 | 6.80 × 10⁻² | 4.5 | 0.295 | 1.7 | 2.8 | 0.385 | |
| 116 | 24.0 | 88 | 6.80 × 10⁻² | 6.0 | 0.295 | 2.9 | 3.2 | 0.476 | |
| 107 | 0.1 | 107 | 6.80 × 10⁻² | 7.3 | 0.295 | 7.3 | 0.0 | 0.996 | |
| 145 | 38.0 | 90 | 6.80 × 10⁻² | 6.2 | 0.295 | 0.0 | 6.1 | 0.006 | |
| Telmisartan | |||||||||
| 597 | 5.7 | 563 | 8.15 × 10⁻² | 45.9 | 0.350 | 42.1 | 3.8 | 0.917 | |
| 627 | 20.7 | 497 | 8.15 × 10⁻² | 40.5 | 0.350 | 26.2 | 14.3 | 0.647 | |
| 690 | 26.2 | 509 | 8.15 × 10⁻² | 41.5 | 0.350 | 21.6 | 19.9 | 0.520 | |
| 749 | 42.6 | 430 | 8.15 × 10⁻² | 35.0 | 0.350 | 0.0 | 35.0 | 0.000 | |
| Losartan | |||||||||
| 262 | 15.6 | 221 | 3.40 × 10⁻² | 7.5 | 0.085 | 2.8 | 4.7 | 0.370 | |
| 375 | 23.2 | 288 | 3.40 × 10⁻² | 9.8 | 0.085 | 0.0 | 9.8 | 0.001 | |
| 309 | 0.1 | 309 | 3.40 × 10⁻² | 10.5 | 0.085 | 10.4 | 0.1 | 0.989 | |
| 320 | 0.1 | 320 | 3.40 × 10⁻² | 10.9 | 0.085 | 10.8 | 0.1 | 0.990 | |
| Norfloxacin | |||||||||
| 106 | 0.1 | 106 | 4.90 × 10⁻² | 5.2 | 0.056 | 5.1 | 0.1 | 0.986 | |
| 163 | 22.1 | 127 | 4.90 × 10⁻² | 6.2 | 0.056 | 1.9 | 4.3 | 0.309 | |
| 205 | 29.8 | 144 | 4.90 × 10⁻² | 7.1 | 0.056 | 0.0 | 7.1 | 0.001 | |
| 2203 | 0.1 | 2201 | 4.90 × 10⁻² | 107.8 | 0.056 | 107.4 | 0.4 | 0.996 | |
| Sulfamethoxazole | |||||||||
| 92 | 0.1 | 92 | 9.30 × 10⁻² | 8.6 | 0.056 | 8.5 | 0.1 | 0.992 | |
| 137 | 10.2 | 123 | 9.30 × 10⁻² | 11.4 | 0.056 | 9.6 | 1.9 | 0.838 | |
| 1608 | 45.8 | 872 | 9.30 × 10⁻² | 81.1 | 0.056 | 0.0 | 81.1 | 0.000 | |
| 2573 | 0.1 | 2570 | 9.30 × 10⁻² | 239.0 | 0.056 | 238.5 | 0.5 | 0.998 | |
| UF Influent | UF Effluent | ||
|---|---|---|---|
| Sampling Hour | TU50 | Sampling Hour | TU50 |
| H1 | 27.0 (± 5.2) | H1 | < 1 (Not Toxic) |
| H2 | 51.7 (± 12.8) | H2 | < 1 (Not Toxic) |
| H3 | 11.1 (± 4.5) | H3 | < 1 (Not Toxic) |
| H4 | 38.2 (± 7.4) | H4 | < 1 (Not Toxic) |
© 2020 by the authors. Licensee MDPI, Basel, Switzerland. This article is an open access article distributed under the terms and conditions of the Creative Commons Attribution (CC BY) license (http://creativecommons.org/licenses/by/4.0/).
Share and Cite
Ferreiro, C.; Gómez-Motos, I.; Lombraña, J.I.; de Luis, A.; Villota, N.; Ros, O.; Etxebarria, N. Contaminants of Emerging Concern Removal in an Effluent of Wastewater Treatment Plant under Biological and Continuous Mode Ultrafiltration Treatment. Sustainability 2020, 12, 725. https://doi.org/10.3390/su12020725
Ferreiro C, Gómez-Motos I, Lombraña JI, de Luis A, Villota N, Ros O, Etxebarria N. Contaminants of Emerging Concern Removal in an Effluent of Wastewater Treatment Plant under Biological and Continuous Mode Ultrafiltration Treatment. Sustainability. 2020; 12(2):725. https://doi.org/10.3390/su12020725
Chicago/Turabian StyleFerreiro, Cristian, Iker Gómez-Motos, José Ignacio Lombraña, Ana de Luis, Natalia Villota, Oihana Ros, and Nestor Etxebarria. 2020. "Contaminants of Emerging Concern Removal in an Effluent of Wastewater Treatment Plant under Biological and Continuous Mode Ultrafiltration Treatment" Sustainability 12, no. 2: 725. https://doi.org/10.3390/su12020725
APA StyleFerreiro, C., Gómez-Motos, I., Lombraña, J. I., de Luis, A., Villota, N., Ros, O., & Etxebarria, N. (2020). Contaminants of Emerging Concern Removal in an Effluent of Wastewater Treatment Plant under Biological and Continuous Mode Ultrafiltration Treatment. Sustainability, 12(2), 725. https://doi.org/10.3390/su12020725


