1. Introduction
As a key emergency infrastructure in the event of an earthquake, the urban water supply system is an important basic condition for earthquake relief and life safety guarantee [
1]. As a part of the lifeline system, a water distribution network (WDN) not only plays a momentous role in the normal operation of the city, but is also particularly important for water use in earthquake shelters and the rescue of secondary disasters. However, WDNs often suffer from varying degrees of earthquake damage, resulting in loss or weakening of functions, which cannot meet the post-earthquake emergency rescue service function. If the key user nodes cannot be guaranteed to use water after an earthquake, this will have a negative impact on the rescue. Therefore, it is crucial to place sensors for disaster prevention considering important users for strengthening the efficiency of post-earthquake monitoring of WDNs, ensuring the water demand of important user nodes, and improving the emergency repair ability of the lifeline system after a disaster.
The protection and monitoring of important nodes or pipelines are important aspects of improving the resilience of the lifeline network. Jie Li et al. [
2] introduced an element investment importance analysis in the seismic topology optimization research of the lifeline network, and analyzed the nodes and lines of high importance in the lifeline network in order to speed up the convergence of optimization processes. Considering node importance and power generation recovery capability, Can Zhang et al. [
3] proposed a two-stage grid reconfiguration strategy, which involves a node importance evaluation method based on the concept of regret. Wenli Fan et al. [
4] put forward a method for evaluating the importance of multi-attribute nodes in complex grids based on the Gini coefficient. They introduced the Gini coefficient, used in economics, to the importance evaluation of multi-attribute nodes as well as to determine the weights of indicators. Considering the node importance, Fei Wang et al. [
5] proposed a classification of emergency repair scope for urban WDNs, and grouped them from three aspects using graph theory: node importance, function importance and structure importance. Anne-Marie Kermarrec et al. [
6] introduced a novel form of centrality: the second order centrality, which can be used to accurately identify critical nodes as well as to globally characterize graphs’ topology in a distributed way. Through the application of the neighborhood rule, Ahmad Zareie et al. [
7] proposed an index to determine node centrality using the notions of Shannon entropy and Jensen–Shannnon divergence for ranking influential nodes. Michalis Fragiadakis et al. [
8] presented a methodology for the seismic assessment of the reliability of urban WDNs based on general seismic assessment standards, which incorporates data of past non-seismic damage, the vulnerabilities of the network components against seismic loading, and the topology of an urban WDN. The above research works evaluated the importance of network nodes or lines in terms of network functions, topological structure and post-disaster reliability. If the importance assessment is introduced into the monitoring sensor placement study, the priority of protection and monitoring of important nodes or pipelines in the network analysis can be improved.
The research studies on sensor placement are currently concentrated in the field of health monitoring. It is the focus of the problem to study the optimal placement of sensor from the aspects of the monitoring domain and sensitivity based on monitoring parameters. The existing research works mostly use optimization algorithms and clustering algorithms to solve these two requirements, such as sensitivity analysis, neural network algorithms, genetic algorithms [
9] and fuzzy clustering algorithms. Different clustering algorithms actually reflect the different levels of clustering parameters and different degrees of consideration. Lingli Chen [
10] used the effective independence method (EfI), the Fisher information matrix (FIM) maximization criterion, and the correlation coefficients method to achieve optimal sensor placement. It was concluded that the calculation process of the node correlation coefficient method is relatively simple and stable, which increases the consideration of the parameters’ difference in essence. D. Kowalski et al. [
11] proposed a fractal geometry method for water quality and pressure monitoring systems in WDNs, which incorporates the impact of network structure and user characteristics into the analysis. Jonas Kjeld Kirstein et al. [
12] used topological clustering as a tool for water supply utilities for monitoring preparation and contamination contingency plans. Using a pressure sensitivity matrix and an exhaustive search strategy, Fatiha Nejjarih et al. [
13] presented an optimal sensor placement strategy. In their work, the evidence C-means clustering method was applied to reduce the scale and complexity of the placement problem, and the effectiveness of this strategy was demonstrated by an example of a WDN in Barcelona. Adria Soldevila et al. [
14] proposed an approach for sensor placement in WDNs by using a classifier to locate leakage, which combines correlation and redundancy with a genetic algorithm by using a hybrid feature selection algorithm. These studies show the degree to which different methods consider the feature factors. In the research of disaster prevention monitoring layout, the introduction of the feature of important nodes that need to be protected and monitored after an earthquake can be used as the basic research idea of this paper.
In terms of post-earthquake hydraulic calculation, the University of Cornell has developed GIRAFFE software, which assumes that there are only two cases of node water demand after an earthquake in a WDN: fully supplied or completely not supplied [
15,
16,
17,
18]. In fact, WDN is in a low-pressure water supply state after an earthquake, and the nodes are partially supplied rather than fully supplied [
19,
20]. Zhao Han et al. [
21] presented a post-earthquake hydraulic analysis model of WDN based on the pressure-driven demand (PDD), which overcomes the above shortcomings.
In addition, most clustering algorithms are unstable, and mostly depend on parameters and initialization to a great extent, which may produce different results for the same dataset [
22,
23]. Therefore, the clustering integration method has been proposed and widely considered, and it shows higher robustness and stability than single clustering algorithms. LingChao Hu [
24] proposed a voting-based three-way decision clustering integration method, which is more robust than a single clustering method.
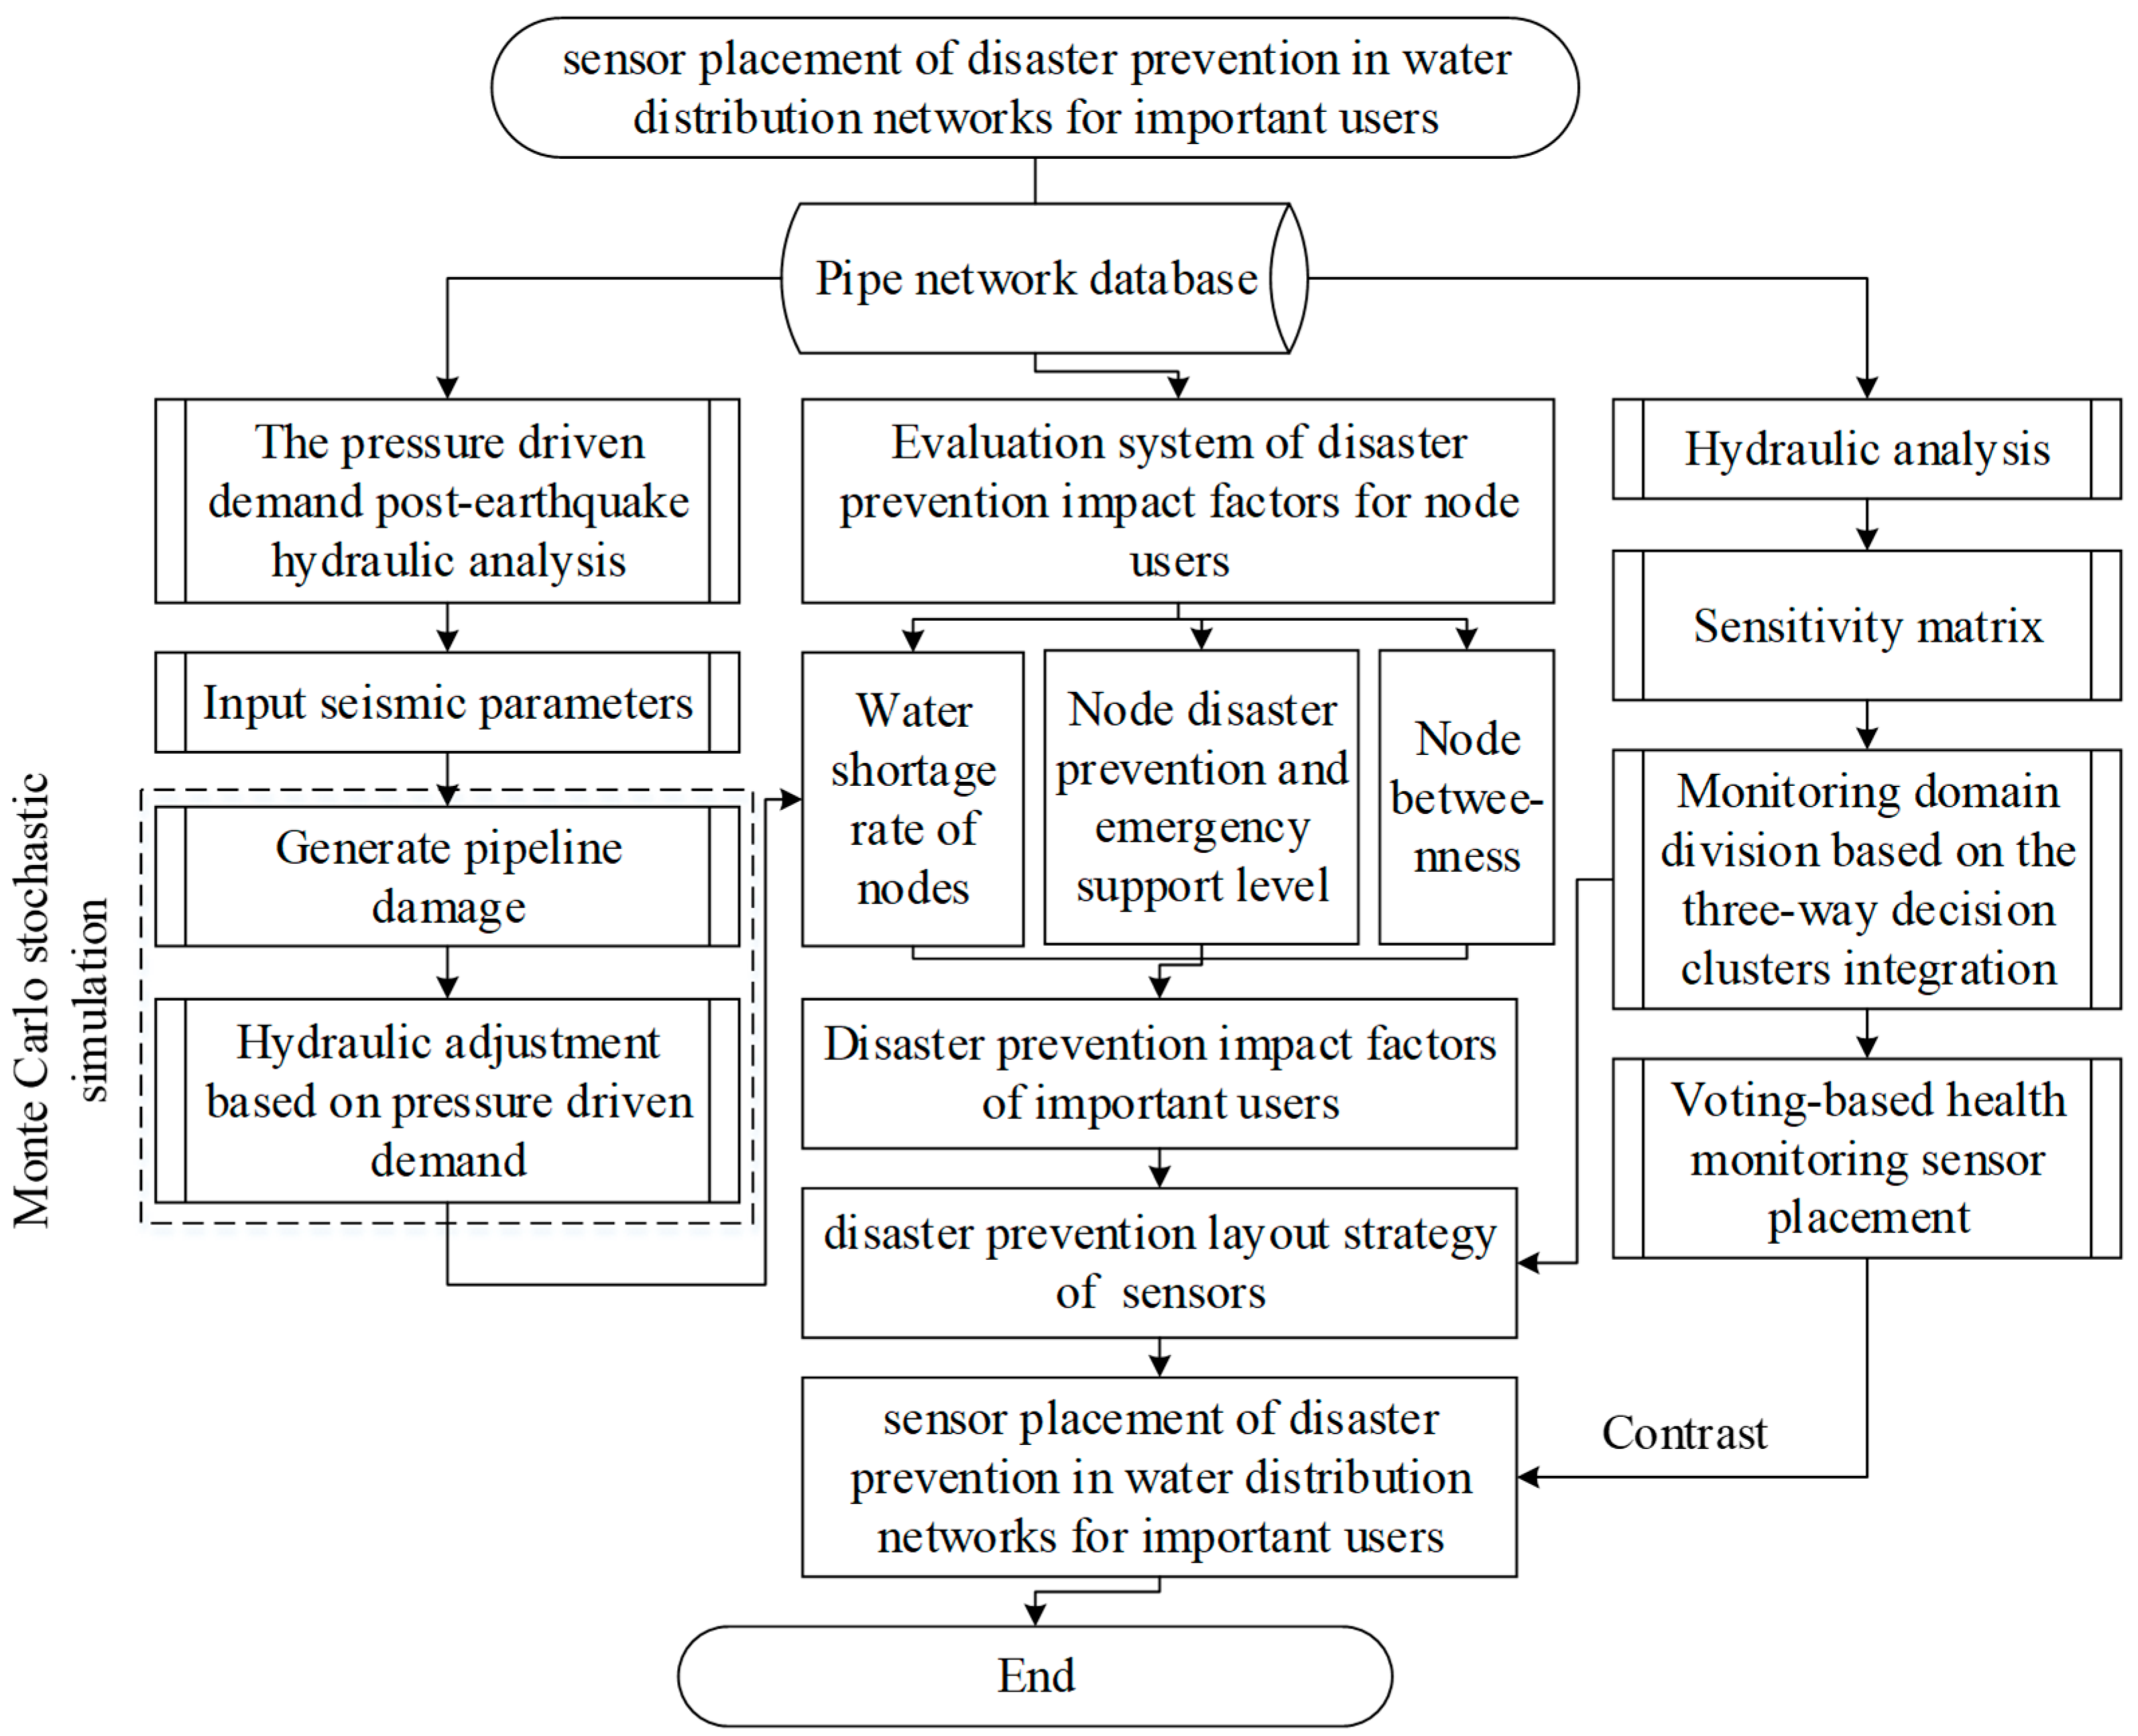
In this paper, we proposed a sensor placement strategy for disaster prevention for important users. Based on the hydraulic analysis, an evaluation system of node users’ disaster prevention impact factors was established, and the impact factor weight values of node users were calculated from the three aspects of post-earthquake water shortage, emergency support and topological structure. The post-earthquake hydraulic analysis model based on PDD was used to calculate the water shortage ratio of nodes, which was combined with the consideration of the importance features as the placement optimization parameter. On this basis, using the three-way decision cluster integration method and integrating four clustering methods to divide the monitoring domain, the decision-making value of different clustering methods can be reflected comprehensively. The structure of this paper is displayed in
Figure 1.
2. Disaster Prevention Impact Factors of Node Users
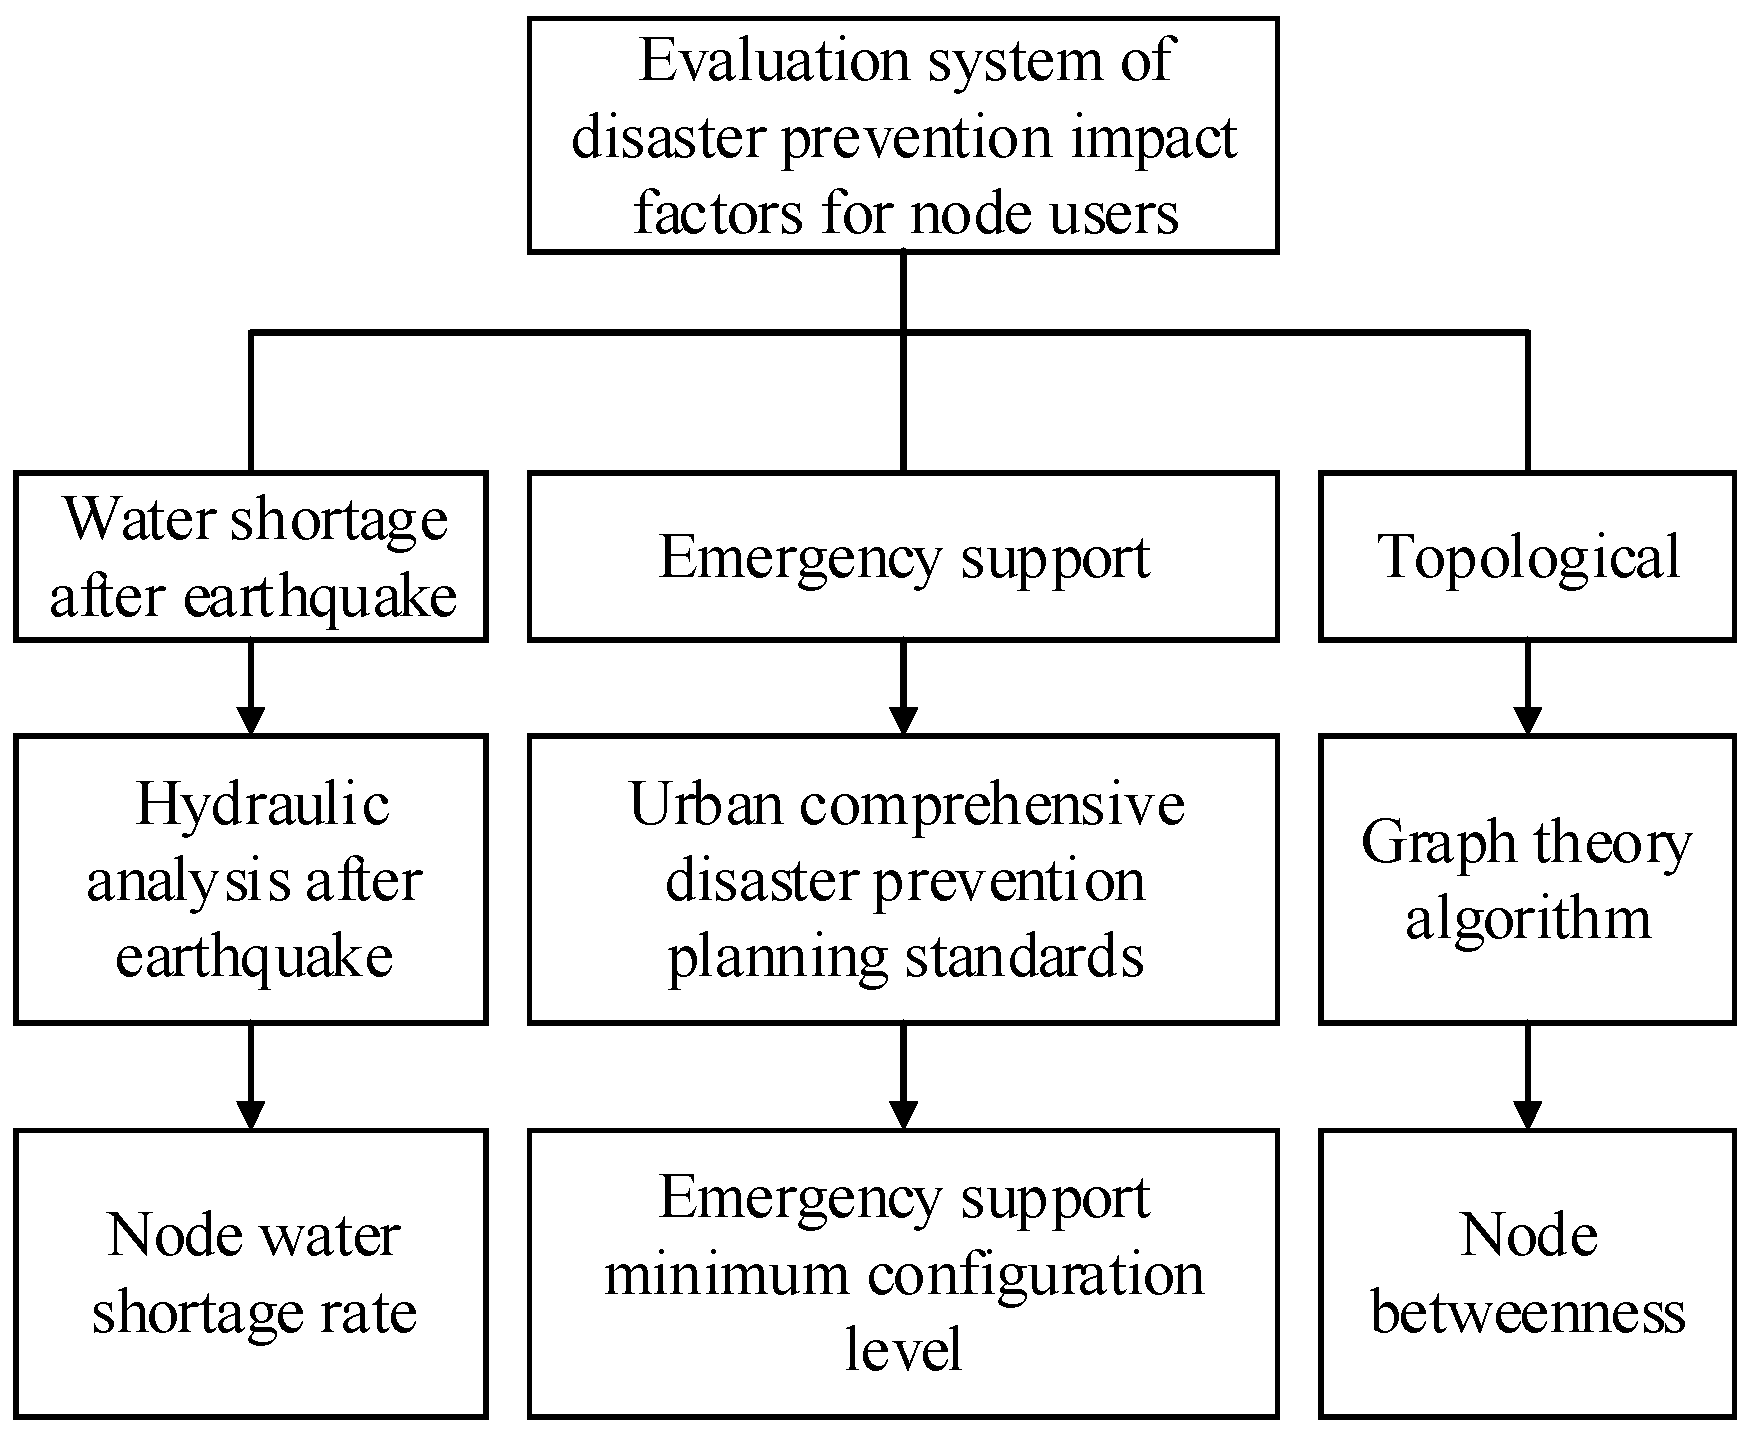
Sensor placement for health monitoring considers the sensor’s optimal placement during daily leakage. After an earthquake, the key node user of the WDN plays a decisive role in disaster relief and water use for victims. Therefore, for protecting people’s lives, it is necessary to evaluate the important nodes of WDNs before earthquakes. Thus, we proposed an evaluation system of disaster prevention impact factors for important node users of WDNs. The nodal leakage can reflect the strength of the nodal water transport function after an earthquake. In addition, considering that the locations of the nodes belong to different levels of disaster prevention emergency support objects, such as municipal emergency command centers, fire control centers, special service fire stations, and central evacuation sites, we thought that the minimum guarantee levels of these emergency protection objects can directly reflect the important position and influence degree of the nodes in a WDN after an earthquake. In terms of topology, the betweenness of a node indicates the importance of the node in the network. Therefore, from three aspects: water shortage, earthquake emergency prevention and topology, the evaluation system for node users’ impact factors in a WDN was constructed (
Figure 2).
2.1. Node Water Shortage Calculation Based on PDD
The PDD post-earthquake hydraulic analysis model [
21] assumes that the nodal water demand is supplied when the node water pressure reaches or exceeds the design water pressure. The node water supply is 0 when the node water pressure is lower than or equal to the minimum water pressure. The node water demand and node water pressure should meet a certain functional relationship, when the node water pressure is between the design water pressure and the minimum water pressure. The relationship between nodal water pressure and nodal water demand proposed by Wagner et al. [
25] was adopted, as shown in Equation (1):
where
Qi* is the water supply of node
i considering the relationship between node water pressure (m) and water demand (L/s),
Qi is the initial water demand of node
i (L/s),
Hi is the calculated water pressure of node
i (m),
Himin is the minimum node water pressure required for node
i water supply greater than 0 (m), and
Hides is the design water pressure required for node
i to meet the initial water demand
Qi (m).
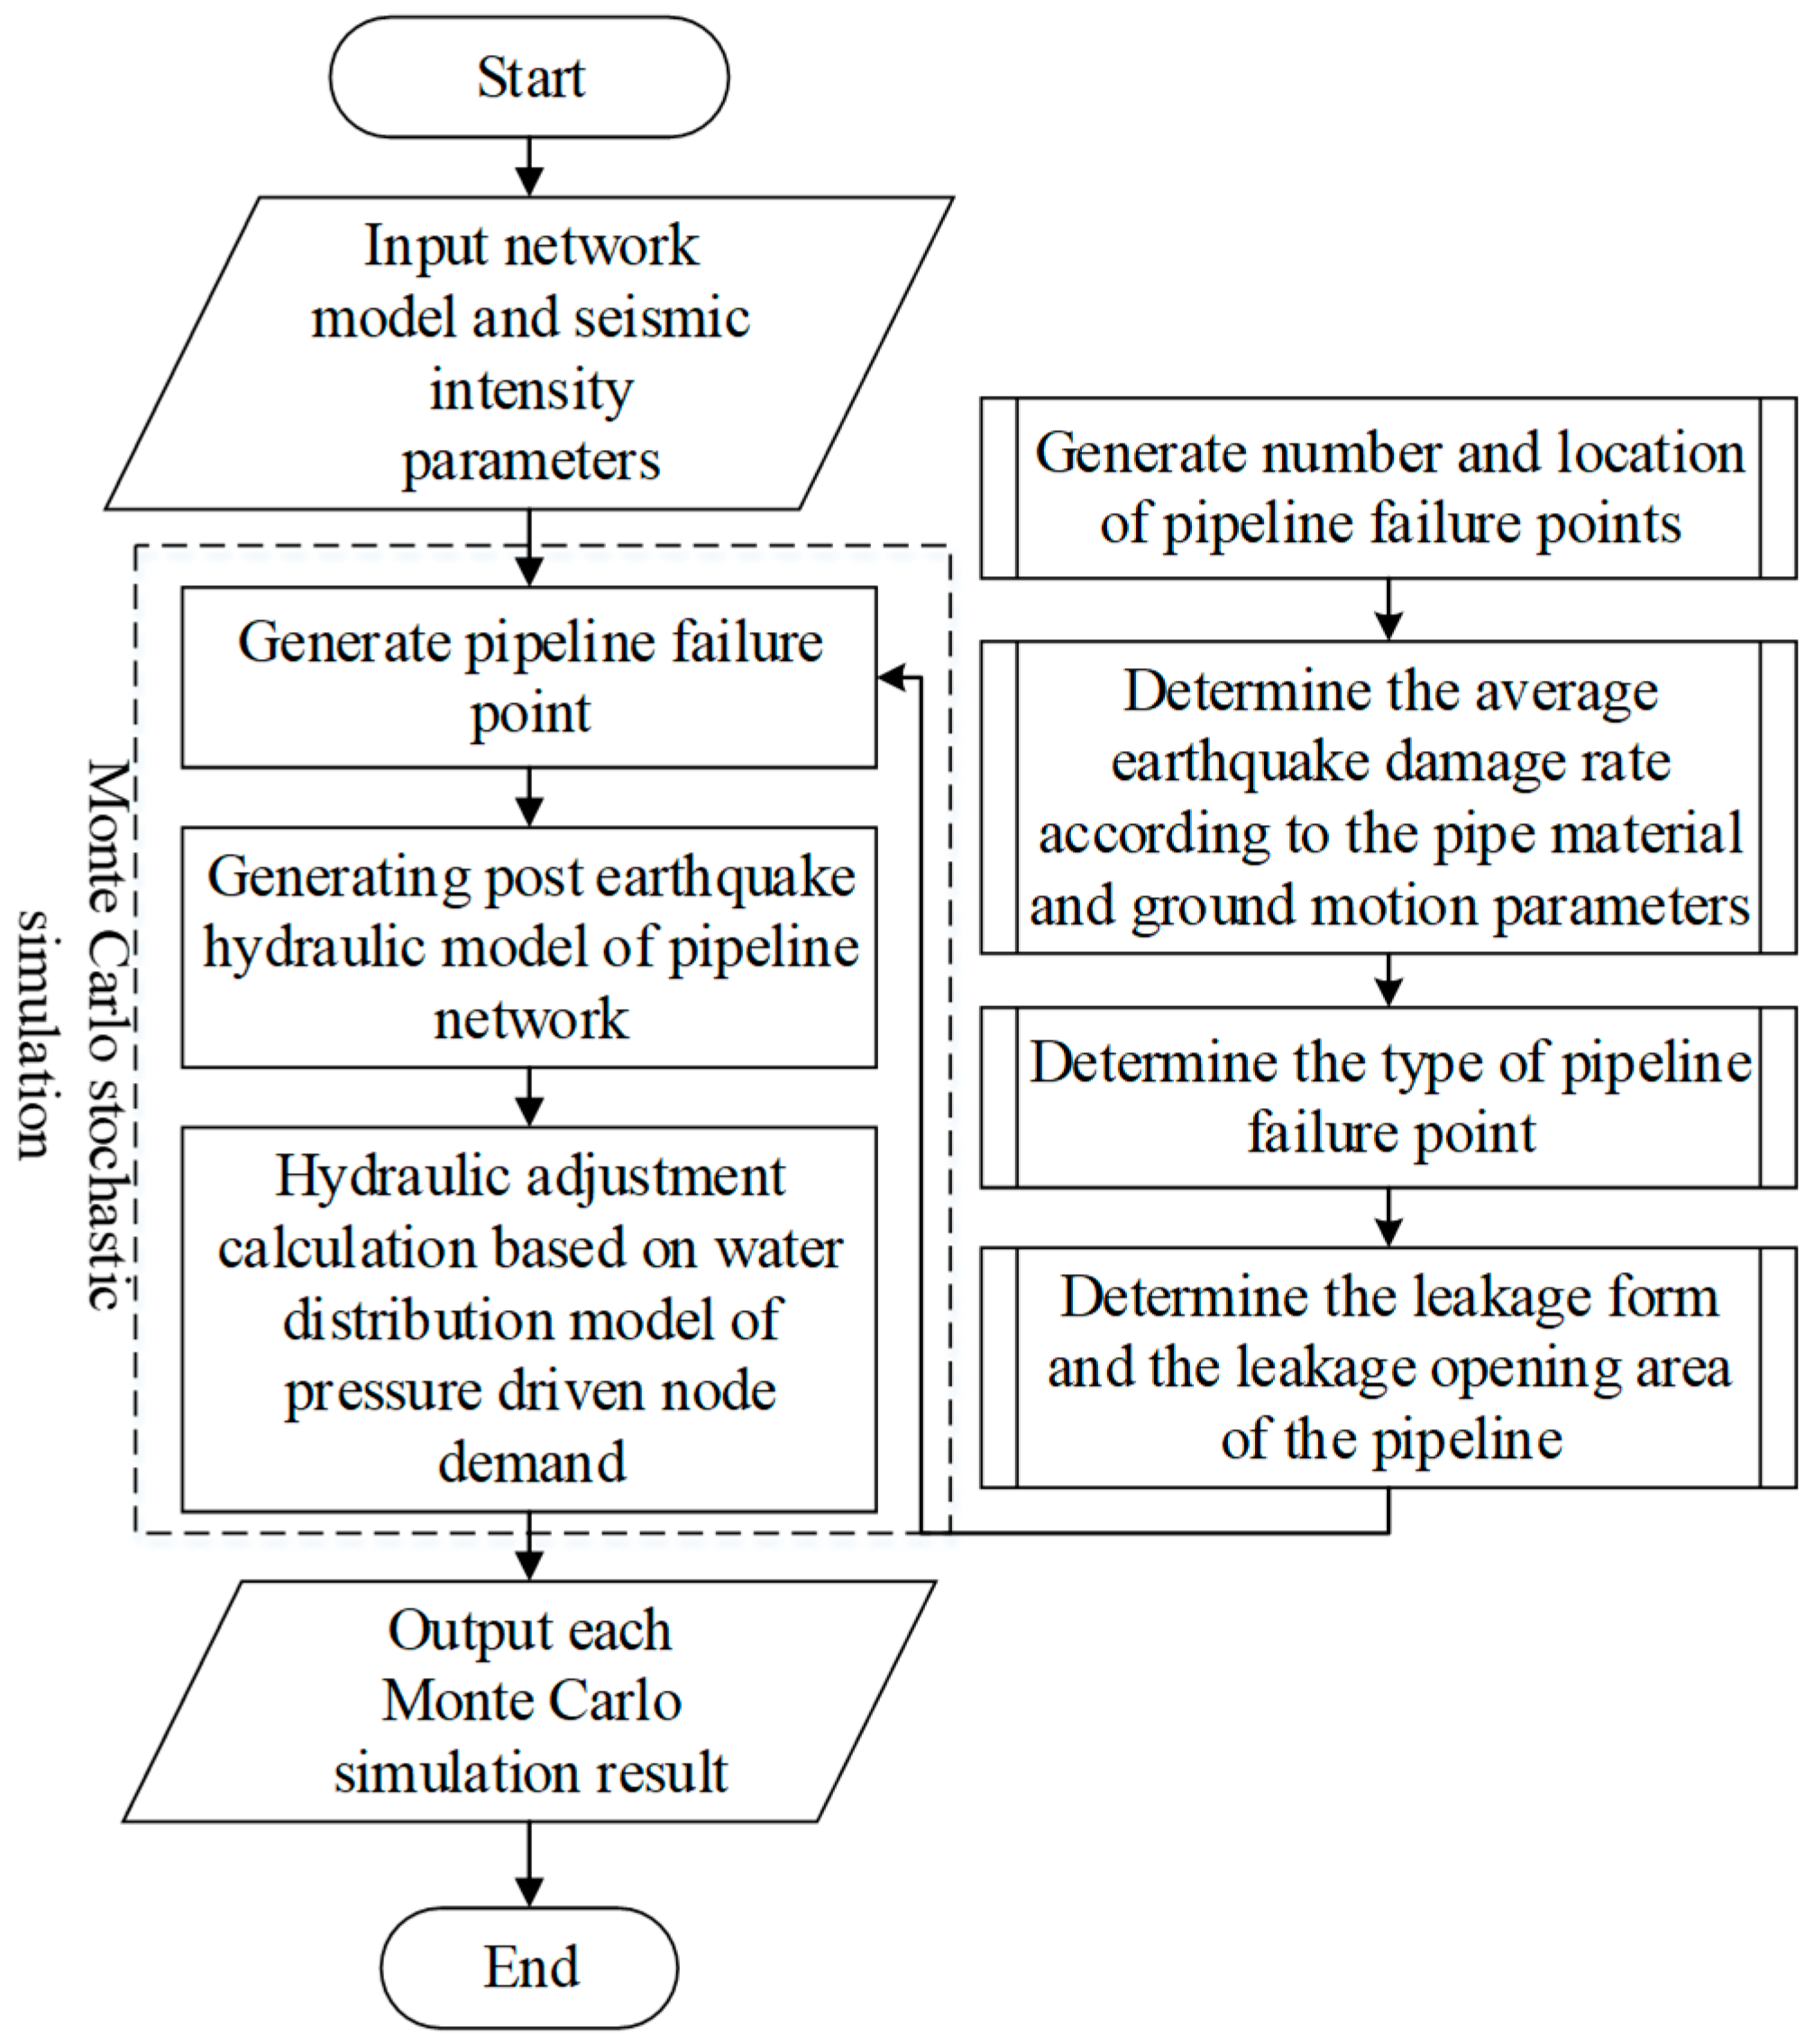
To determine the number and location of the damage points, we utilized Monte Carlo simulation to generate a series of random numbers of pipeline seismic damage that obey uniform distribution along the length of the pipeline. For each damage point, two damage states (break and leakage) were generated by a Monte Carlo simulation random process again to form the post-earthquake hydraulic model. Finally, epanet2.dll was used to calculate the hydraulic adjustment of WDN based on PDD. The calculations of the average repair rate,
RR, pipeline leakage form and leakage area are based on the statistical data of pipeline damage in the Northridge earthquake [
26]. The basic calculation flow of the PDD model is shown in
Figure 3.
The nodal demand pressure was set to 20 m; after simulating n times, the simulation results of the required water pressure were selected when the post-earthquake water pressure of the node was lower than the normal state. Note that when the water pressure of all nodes meets the minimum required water pressure in the simulation, the water demand of the simulation is the same as the water demand under normal conditions, so the calculation of the water demand in this situation was neglected.
Calculate the average water demand of the nodes after an earthquake, see Equation (2):
where
is the average post-earthquake water demand of node
i, and
Qik is the water demand of the node
I obtained by the
k-th simulation. The post-earthquake water shortage rate of the node is calculated by Equation (3):
where Δ
qi is the post-earthquake water shortage rate of node
i, and
Qi is the water demand of node
i under the normal condition. The greater the post-earthquake water shortage rate of the node, the greater the degree of influence of the node.
2.2. Emergency Support Level
The safety function guarantee level of an emergency support infrastructure, such as urban emergency traffic, water supply, power supply, communication, etc., specified in Article 6.1.2 of the “Urban Comprehensive Disaster Prevention Planning Standards” [
27] in China is divided into Ⅰ, Ⅱ and Ⅲ. The classification of emergency support level reflects the importance of urban emergency support objects after an earthquake. We associated the key emergency support objects of WDN with node users, which can reflect the post-earthquake significance of nodes. According to the emergency support objects corresponding to the nodes, the nodes’ levels were determined, and the emergency support levels of the nodes were scored (
Table 1).
2.3. Node Betweenness
A graph can be represented by Equation (4) [
28]:
where
V is a non-empty vertex set, and
E is the edge set.
A graph is uniquely determined by the association between its vertices and edges, and also by the adjacency between its vertices. The matrix A = A(G) = (aij)n×n is called the adjacency matrix of graph G, where aij is used to represent the number of edges between vertex vi and vertex vj, which may be 0,1.
According to the adjacency matrix of a graph, the betweenness of a graph can be calculated. The betweenness is divided into two types: node betweenness and edge betweenness. The minimum path between node
i and node
j in the network will pass through some nodes; if a node
k is passed by many shortest paths, it means that the node
k is very important in the network. The importance or influence of node
k can be expressed by the node betweenness, which is defined as:
where
Bk is the betweenness of node
k,
d(
i,
j) is the shortest path numbers between node
i and node
j, and
d(
i,
j)
k is the minimum number of paths between node
i and node
j passing through node
k.
2.4. Evaluation System of Disaster Prevention Impact Factors for Node Users
Factor index set
z = {
z1,
z2, …,
zk},
k = {1, 2, 3} is selected, where
z1 is the node water shortage rate,
z2 is the earthquake disaster prevention emergency support level score, and
z3 is the node betweenness. The influence value
under each factor indicator, indicating the influence value of node
i under the factor indicator
zk, is calculated. According to the influence value, the relative influence matrix
of the node under the factor index
zk is calculated by the formula (6), which measures the relative influence of each node under one index.
where
is the relative influence value of node
i and node
j under the factor indicator
zk, and
n is the total number of nodes. When
i =
j,
has no practical meaning and takes a value of 0; when
i ≠
j, it is calculated by Equation (7):
In order to obtain the relative influence vector of the node under the factor index
zk, the row vector elements of the relative influence matrix
of the node are summed by Equation (8):
The relative influence vector of the node only describes the relative influence of the node under one evaluation index. To synthesize the relative influence value of the node under different indicators, the node’s comprehensive influence matrix
F is constructed by using the relative influence vector of the node under different indicators (9):
The sum of each row of the node’s comprehensive influence matrix F is summed to obtain the comprehensive relative influence values F1, F2, …, Fn of the nodes, which reflect the comprehensive relative influence of the nodes under different factors. Finally, the normalization method based on degree of membership is used to process the node’s comprehensive relative influence values to obtain the node users’ impact factor values.
The Gaussian membership function expression is:
where
is the node
i user’s disaster prevention impact factor value of WDN,
Fmax is the maximum value of the comprehensive relative influence set {
F1,
F2, …,
Fn},
Fmin is the minimum value of the integrated relative influence set {
F1,
F2, …,
Fn},
ε is the normalized parameter, and the value range is
.
4. Simulation and Comparison
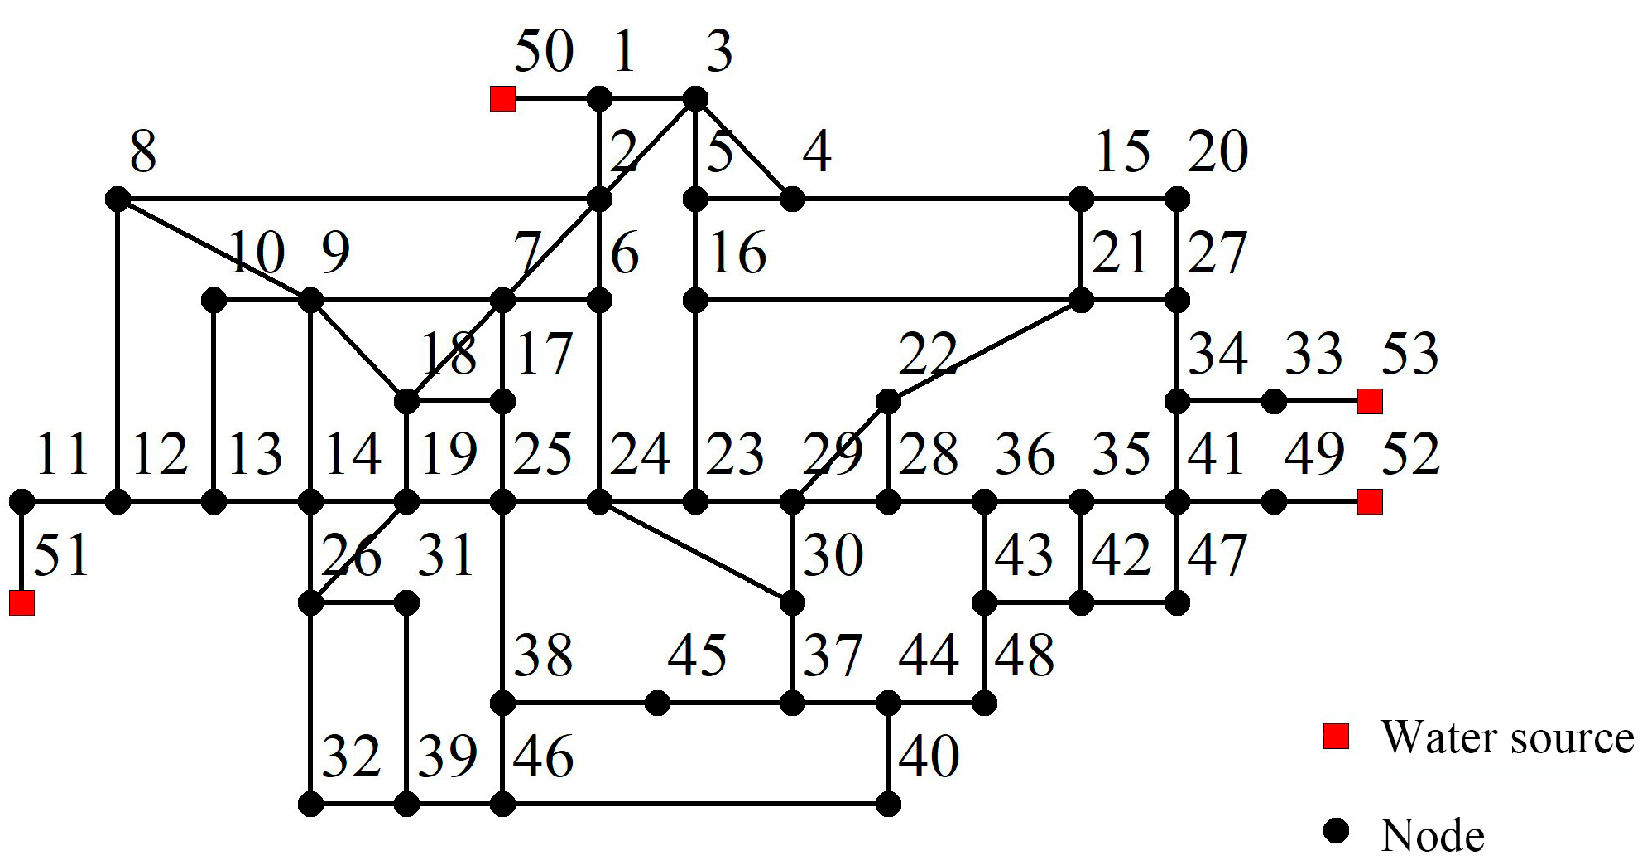
Figure 4 shows a water distribution model based on actual data from a region in China [
29], which has 53 nodes and 78 pipelines. Node 50 is a reservoir; node 51, node 52, and node 53 are water source nodes; and the total hydraulic heads are 76.95 m, 74.31 m, 83.58 m and 81.98 m, respectively. We assumed that pipes with a diameter greater than 600 mm are riveted steel pipes, while pipes with a diameter less than 600 mm are rubber sealed cast iron. It needs to be mentioned that all methods were based on Matlab software, and the hydraulic calculation was called epanet2.dll. For the basic data of the WDN, see [
29]:
Based on the hydraulic analysis, the nodal pressure sensitivity model was used to obtain the sensitivity matrix, and the extreme value processing method was used to normalize the node pressure sensitivity matrix. Xunjian Wang, Zengyi Wang [
30] suggested that the setting of the WDN monitoring points should be about
of the total number of nodes, and the number of monitoring points of a large pipe network is smaller than that of a small pipe network. Therefore, the ratio of the monitoring points number in this paper to the total number of nodes was selected as 1/7, that is, the number of monitoring points is 7.
4.1. Disaster Prevention Impact Factors of Node Users
4.1.1. Node Water Shortage Rate
According to the table of seismic intensity in China (GB/t 17742-2008) [
31], we chose the peak ground velocity (
PGV) of the IX seismic intensity to calculate the average repair rate,
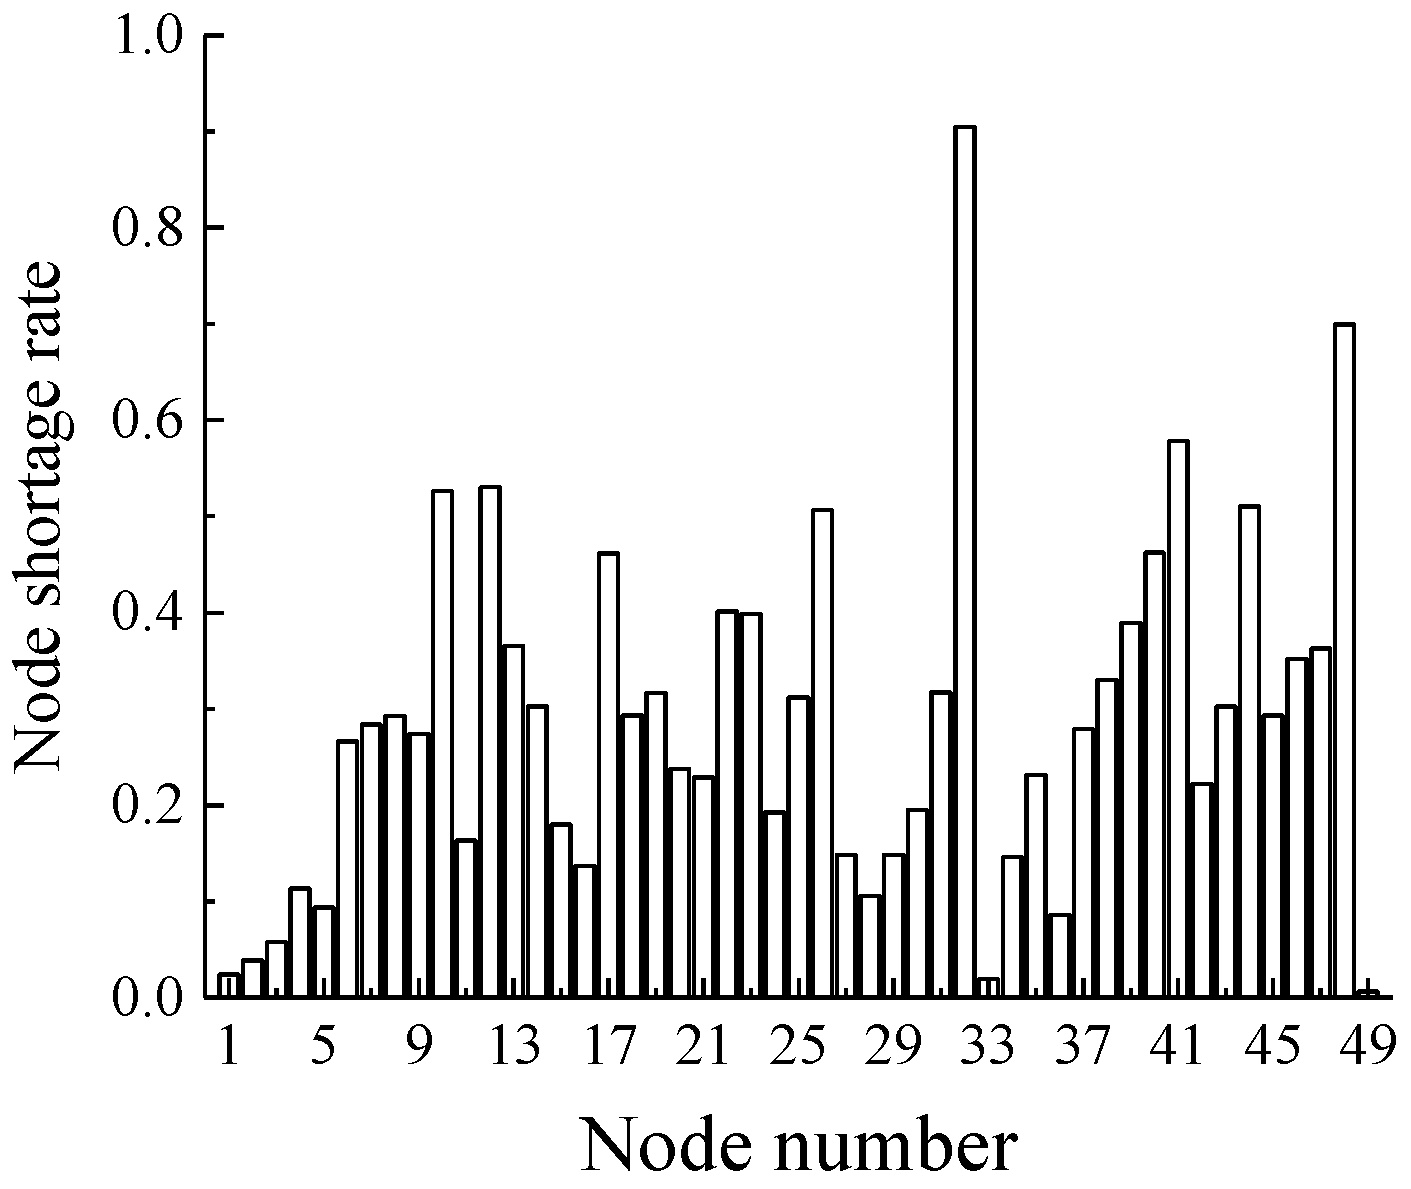
RR, in which the average repair rate of pipelines with diameter greater than 600 mm is 0.0690, and that of pipelines with diameter less than 600 mm is 0.1254. The PDD post-earthquake hydraulic analysis model was used to simulate a total of 25 times, and all nodes satisfied the water requirements in the sixth, 10th, 12th, 19th and 20th simulations. Therefore, when calculating the water shortage rate, we did not consider the results of the above five simulations. The remaining 20 simulation results of the node average shortage rate value are shown in
Figure 5.
4.1.2. Node Emergency Support Rating
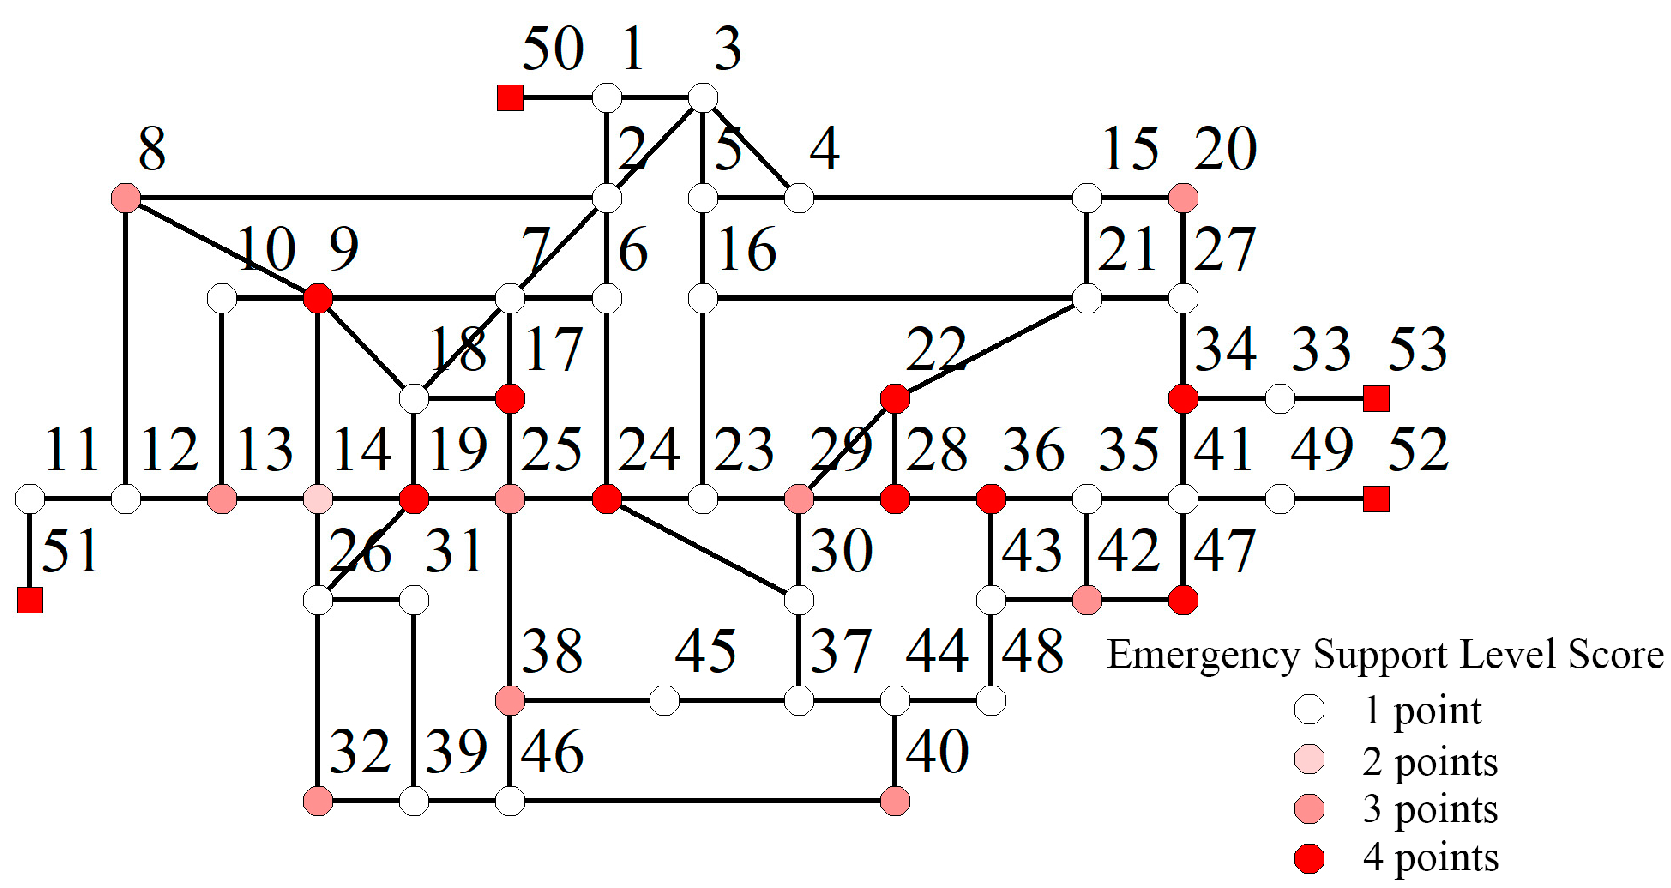
We assumed the emergency guarantee level of the node in this paper (
Figure 6), and we analyzed the node user impact factor values of the WDN according to the node users’ impact factor evaluation system proposed in the above section.
The nodes with an emergency protection level score of 3 or more are mainly concentrated in the eastern, northeastern, western and northwestern regions of the city (
Figure 6). The monitoring sensors should be placed as much as possible in these areas for better monitoring.
4.1.3. Node Betweenness
After calculation, the betweenness values of each node were obtained, as shown in
Table 2.
4.1.4. Node User Disaster Prevention Impact Factor Weight
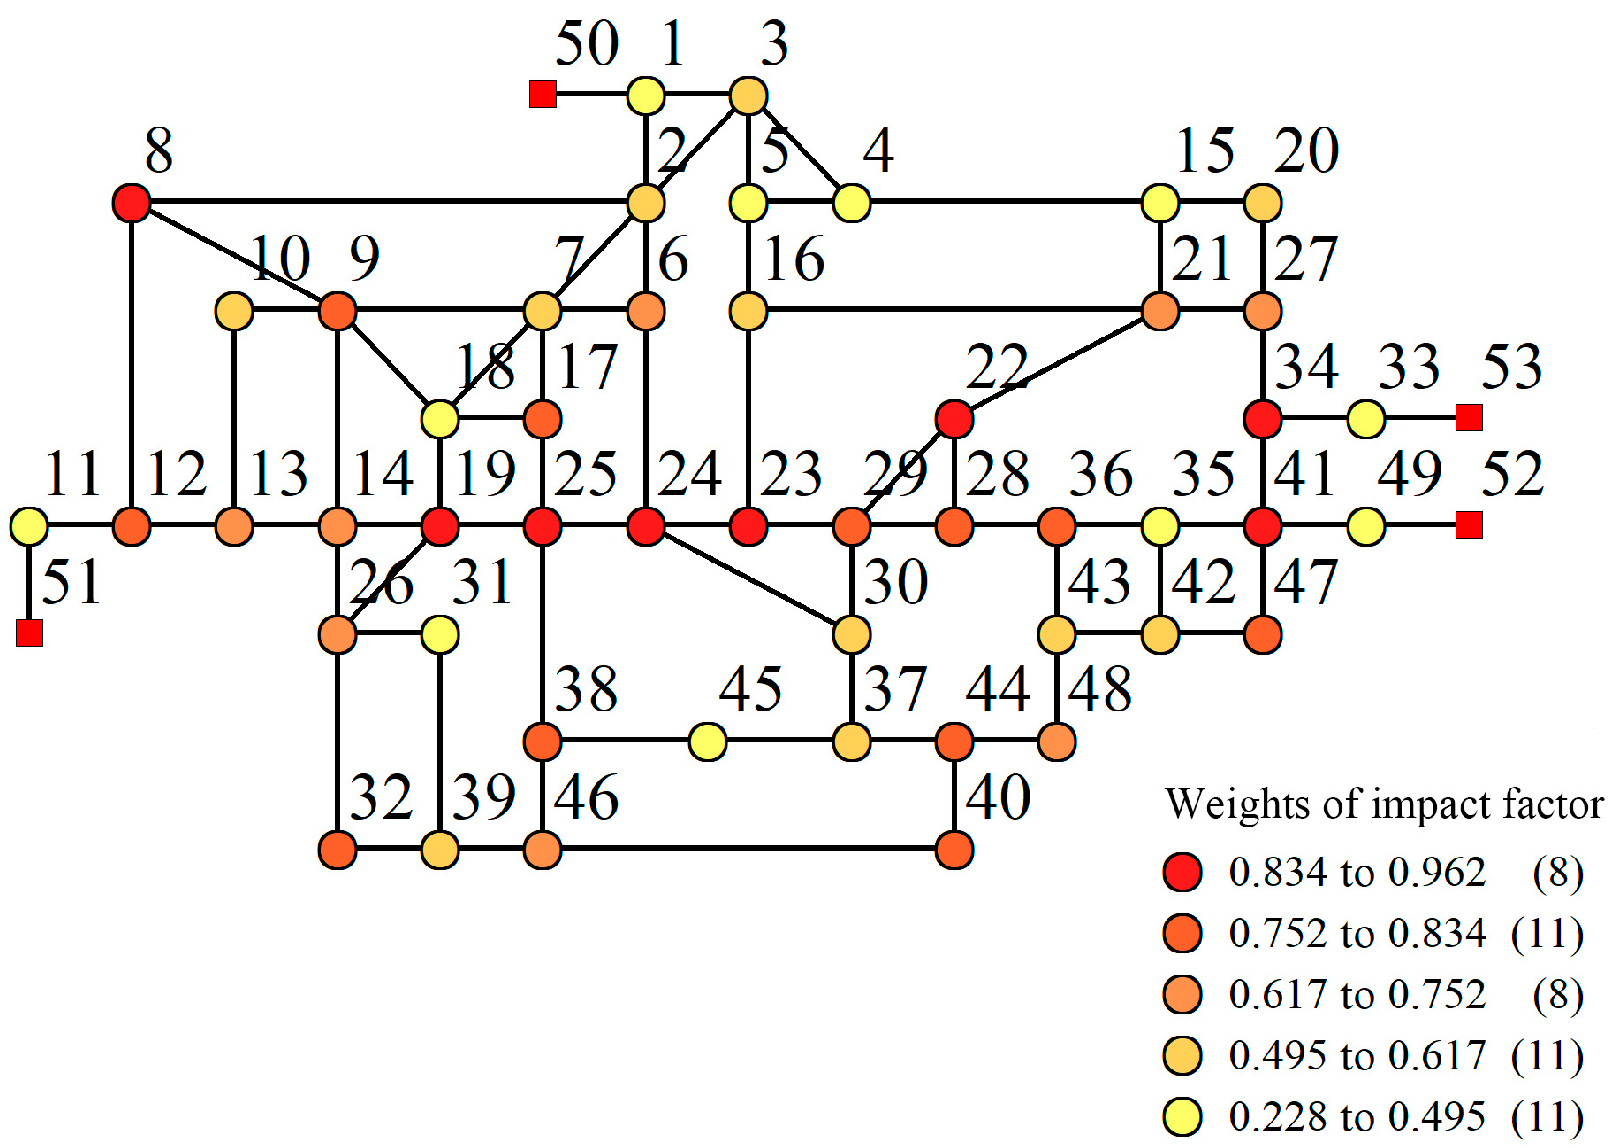
The node water shortage rate, the node emergency support level score and the node betweenness value were used as the impact factor indicators. The parameters of each node and the relative influence value were calculated by Matlab software programming, and the relative influence value of each node is normalized. The weight values of the node impact factor are shown in
Figure 7.
Figure 7 shows that the darker the node color, the higher the weight of the node impact factor, and the more important the node. The weight values of the node users’ impact factor reflect the post-earthquake functional importance of the node. The nodes with relatively high impact factor weights were node 19, node 25, node 24, node 23, node 22, node 8, node 34 and node 41. These nodes are very crucial for the shelter of residents after an earthquake and the rescue of secondary disasters, which should be protected.
4.2. Sensor Placement for Disaster Prevention in WDNs
4.2.1. Monitoring Domain Division Based on Three-Way Decision Cluster Integration
The K-means clustering method, fuzzy C-means clustering method, pedigree clustering method and dynamic classification method are common clustering methods for sensor placement. Each method has its own decision-making value. Based on the three-way decision cluster integration method, we integrated the K-means clustering method, fuzzy C-means clustering method, pedigree clustering method and dynamic classification method to divide the monitoring area of the WDN.
The three-way clustering integration method integrated four clustering methods to divide the monitoring domain of the WDN. As the three-way decision cluster integration method is not the focus of this article, the details can be found in [
32]. The clustering results obtained by the K-means clustering method were taken as a reference to carry out cluster label matching, and the nodes that clearly belong to the corresponding category were divided into the positive domain of the corresponding category. After the voting matrix was constructed, the monitoring domain classification of the nodes was obtained according to the previous dividing rules, as shown in
Table 3 and
Table 4. The nodes in the boundary domain belong to the boundary of the class, i.e., the nodes divided into the boundary domain can be effectively monitored by different monitoring points at the same time.
The three-way decision integration clustering method integrates two-way decision clustering results into one three-way decision clustering result, which makes each category more uniform (
Table 3 and
Table 4). When it is impossible to determine that an object belongs to a certain class of clusters, it is divided into boundary regions, indicating that the object may belong to multiple clusters, thus describing its fuzziness.
4.2.2. Sensor Placement for Disaster Prevention in WDNs for Important Users
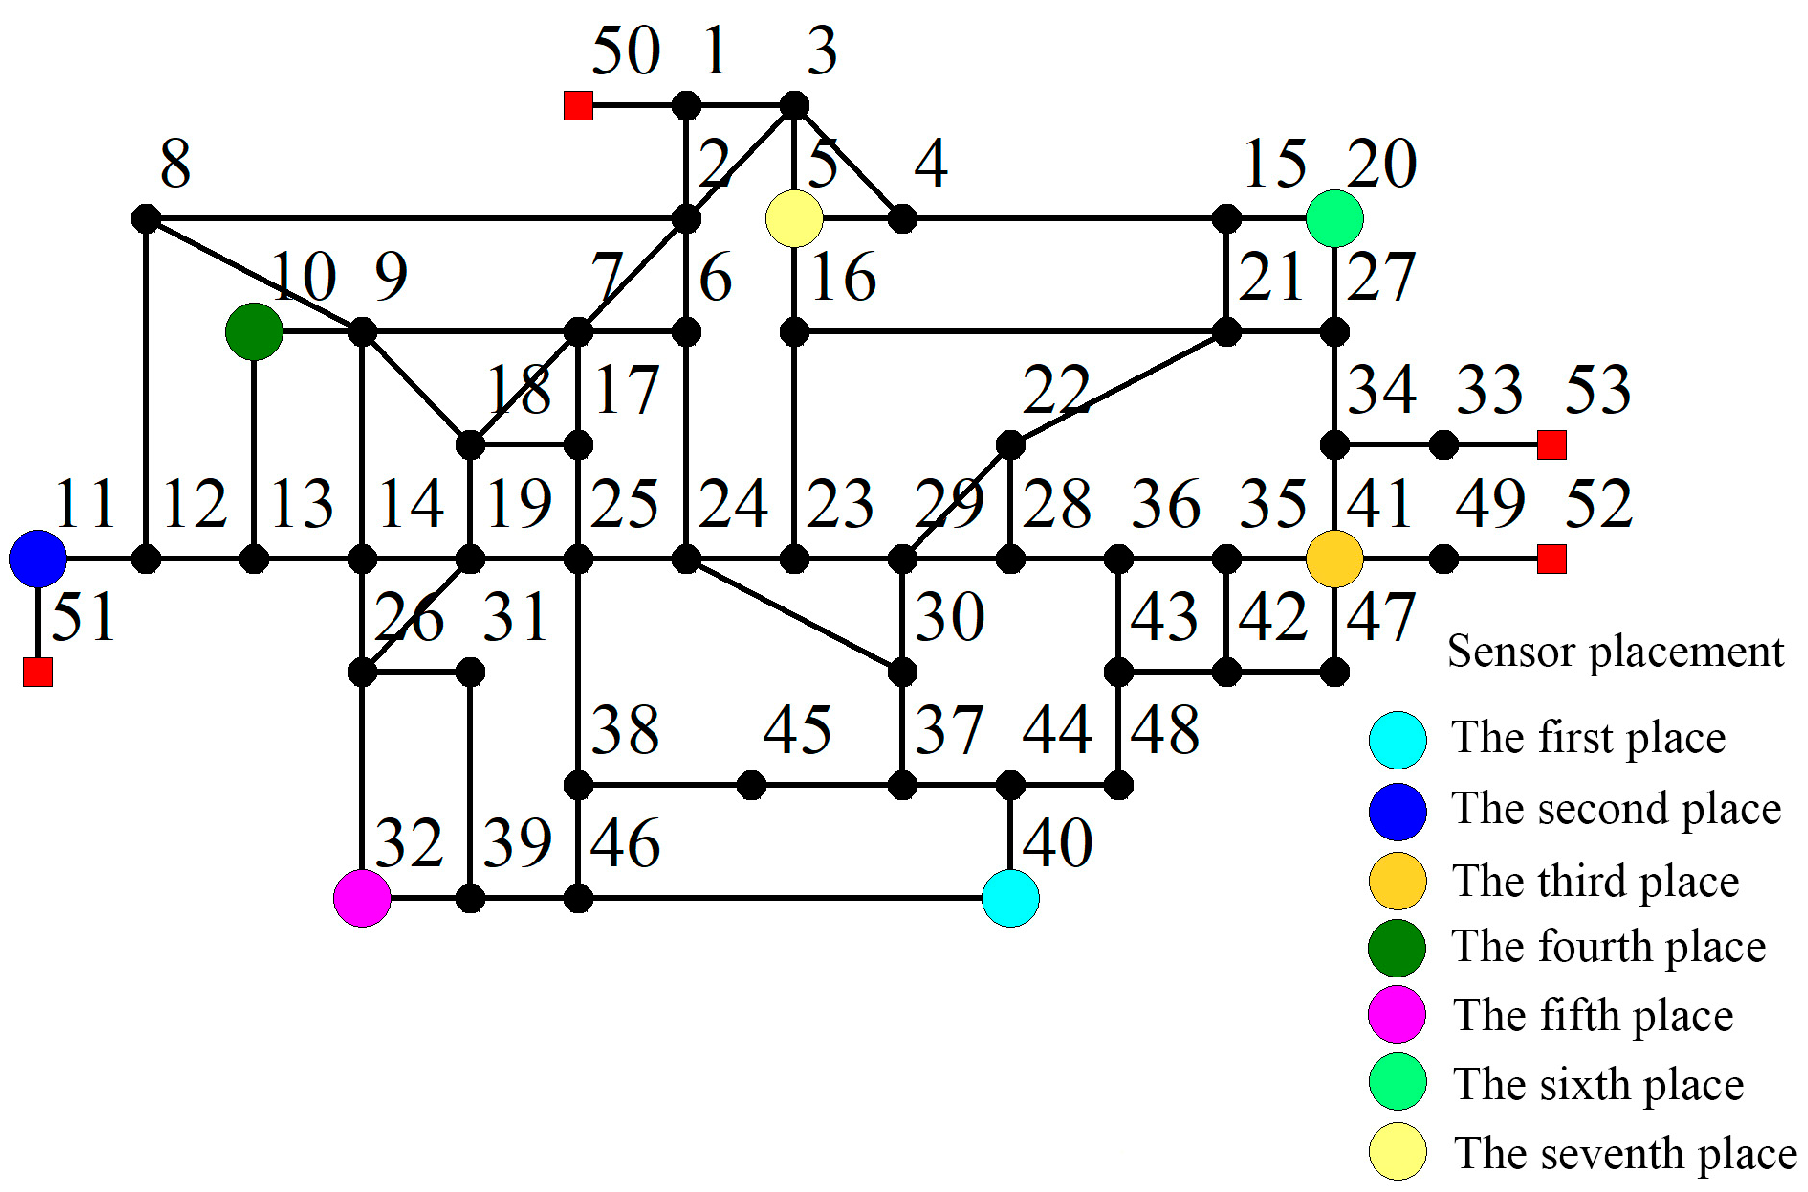
According to the classification of the monitoring domain and the comprehensive sensitivity of nodes, the sensitivity threshold is set as 0.85, so that we obtain the sensor placement nodes, which are node 44, node 14, node 23, node 10, node 32, node 20 and node 6. MapInfo software was used to draw the final placement diagram, as shown in
Figure 8.
4.3. Sensor Placement in WDNs Based on Traditional Models
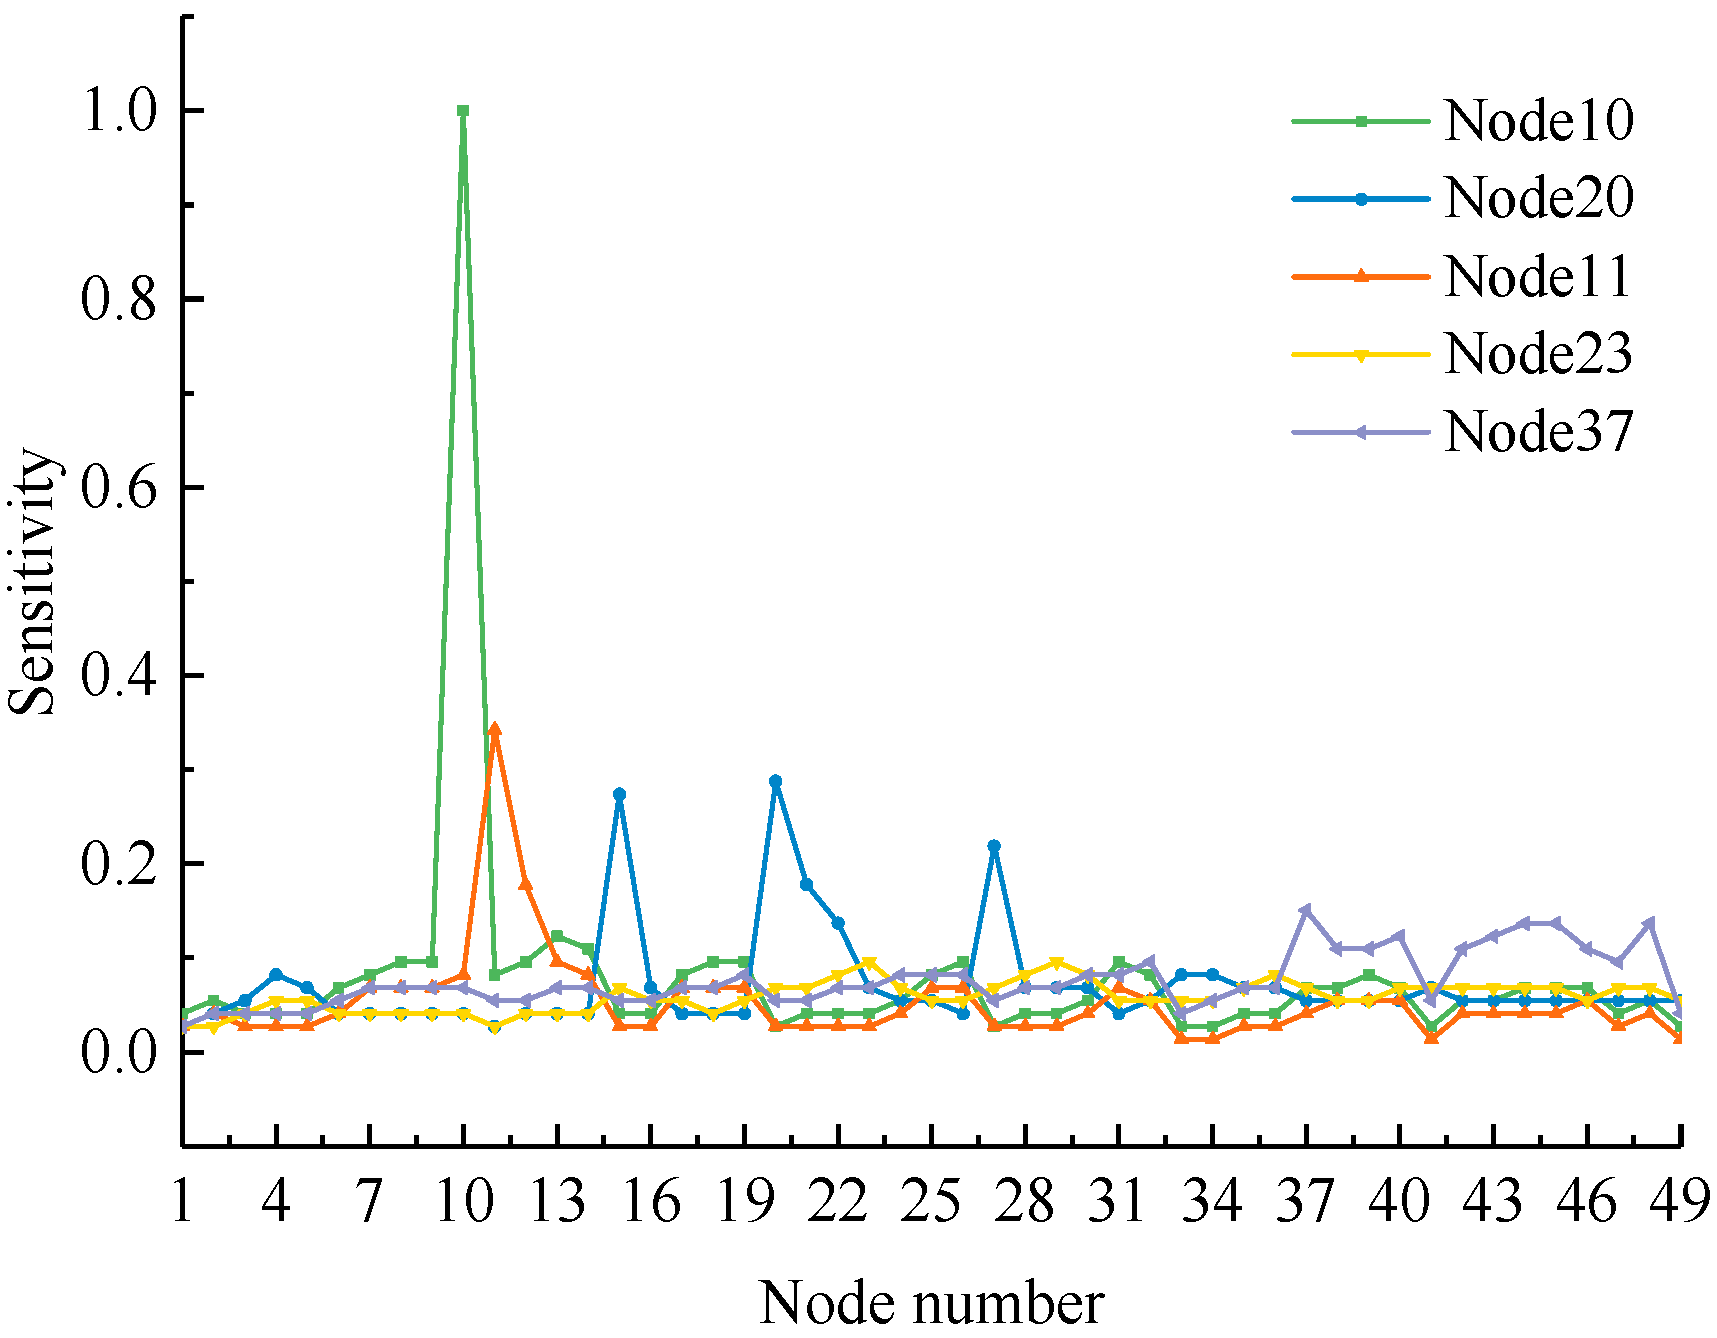
In traditional sensor placement, clustering algorithms are usually used to classify monitoring points based on the sensitivity matrix. Clustering centers are used as monitoring points where sensors are placed and corresponding categories are monitoring areas. The sensitivity curves of some nodes are shown in
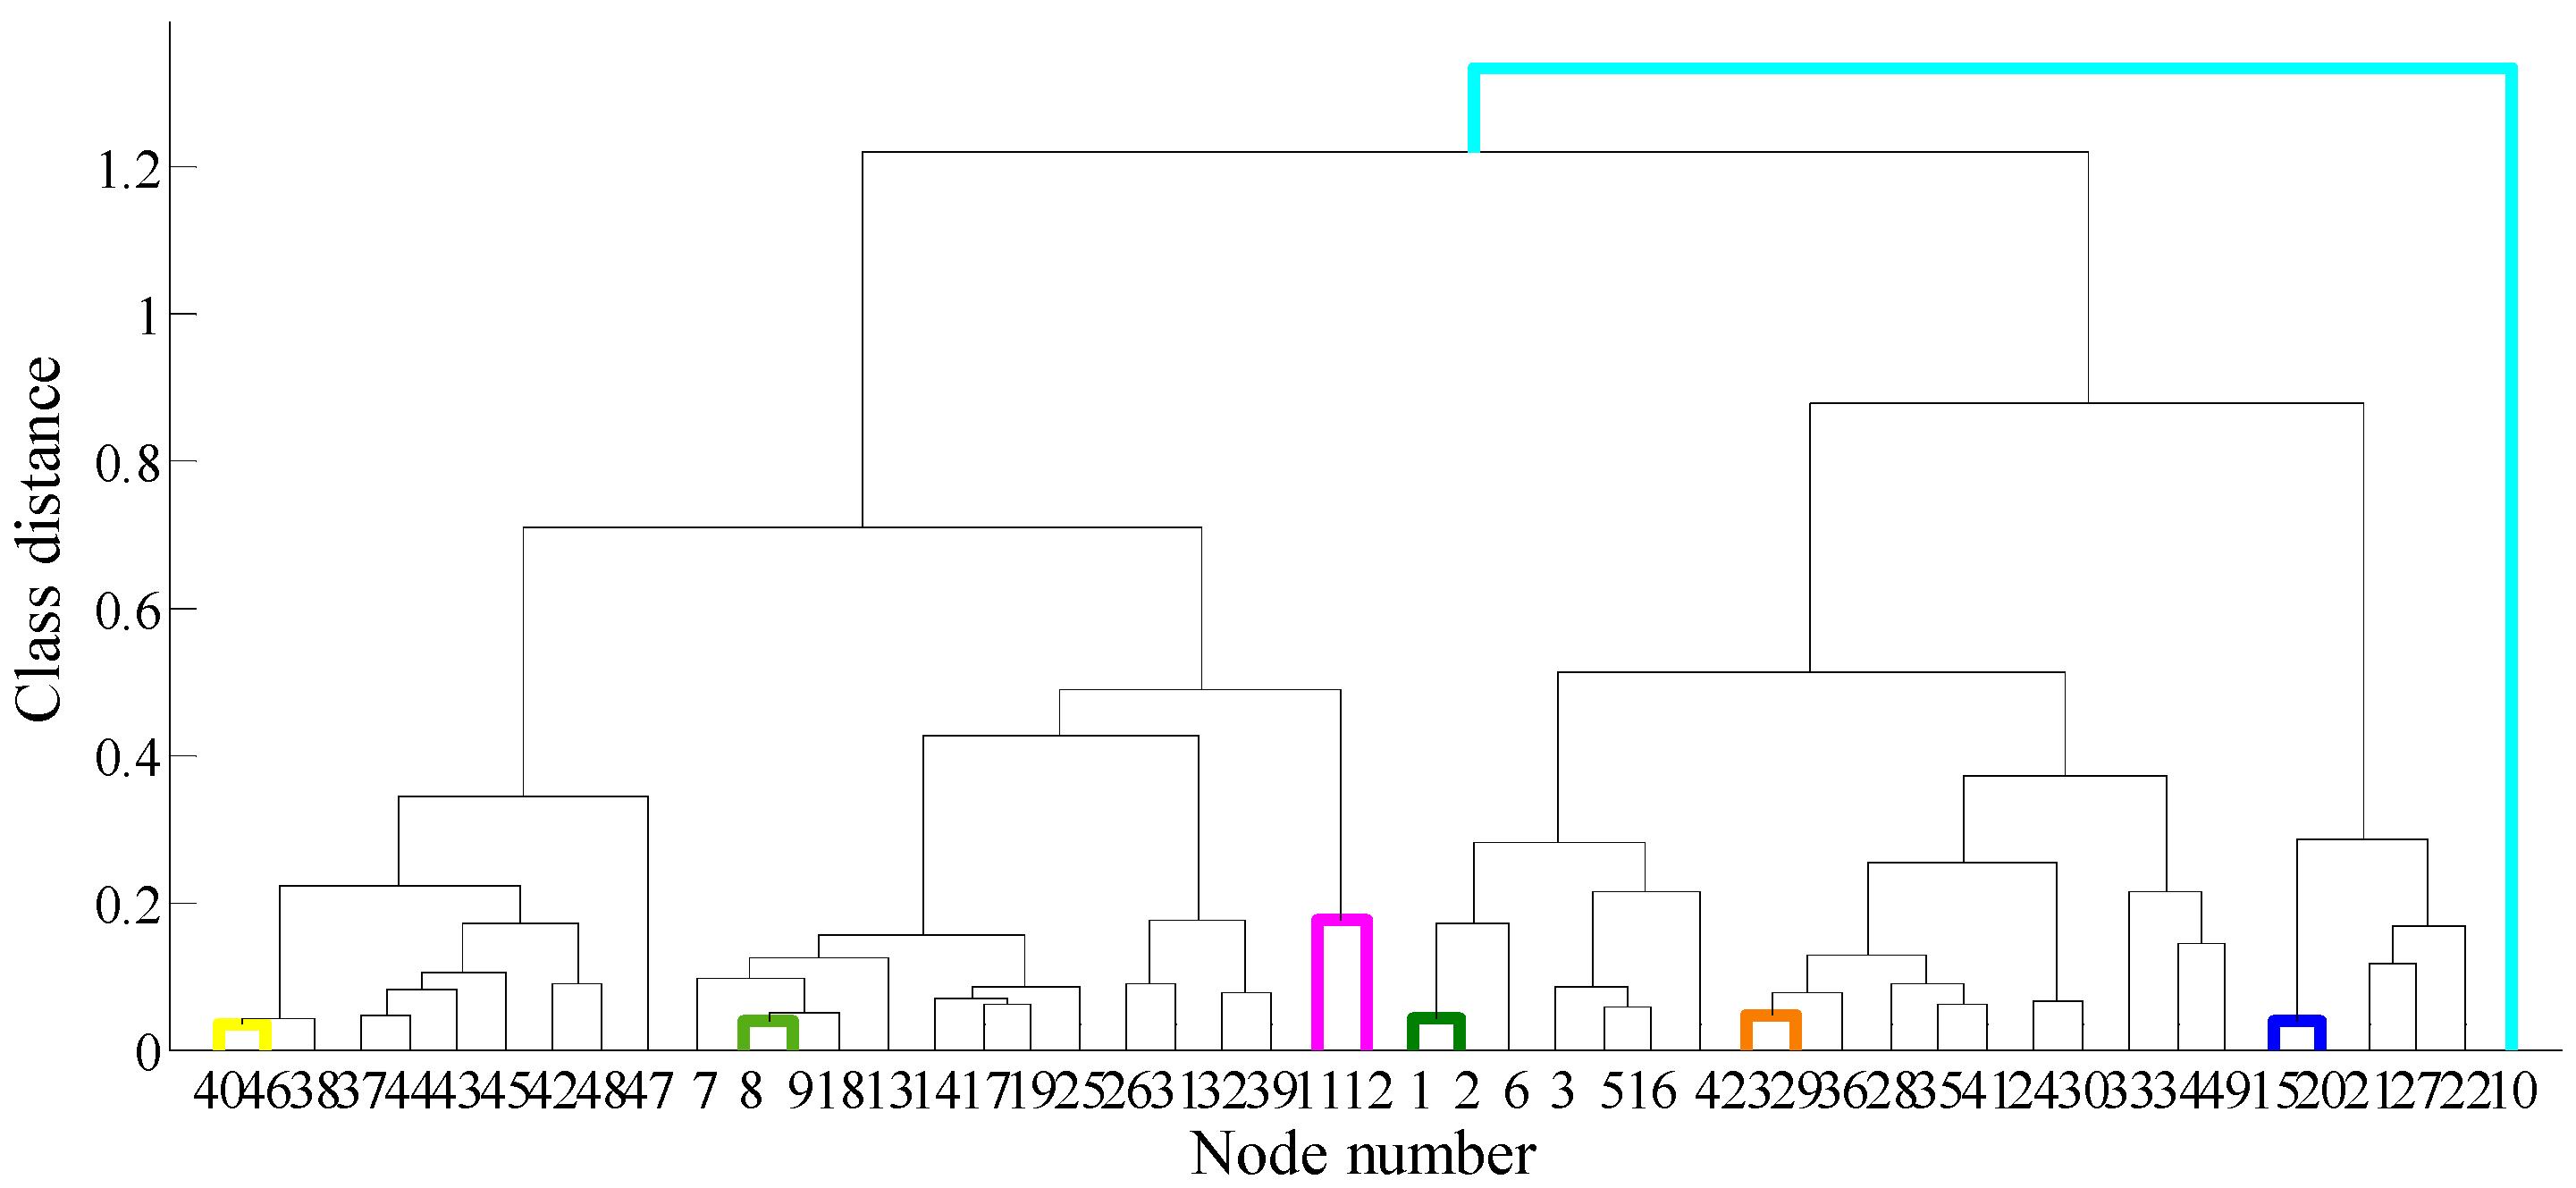
Figure 9, and the pedigree clustering tree is shown in
Figure 10. It should be noted that the fuzzifier parameter of the fuzzy C-means clustering method was 2, and the membership values are shown in
Table 5. The membership degree of the dynamic classification method was determined by the entropy weight method.
In this paper, we used eight methods for sensor placement in WDNs, and the sensor placements by the eight methods are shown in
Table 6. In addition to the four clustering algorithms used before, the node correlation coefficient method, the effective independence method, the improved Fisher information matrix maximization criterion and the impact ranking method were also used. The idea of voting was used to integrate the monitoring information as well as to fuse the consistency of various algorithms. The node numbers in parentheses indicate the nodes strongly related to the front nodes, which can also be used as monitoring points for the sensor installation.
Finally, based on the idea of voting, we carried out a statistical analysis of sensor placement nodes in
Table 6, selected the top 10 nodes as the alternative monitoring nodes, and the placement on the basis of the division of monitoring areas is shown in
Figure 11.
According to the hydraulic data of the WDN, it can be seen that pressure value of node 32 is the lowest, which is 19.32 m under the standard working condition, and the second lowest nodal pressure value is node 10, which is 20.13 m. The next lowest is node 41, for which the pressure value is 20.15 m. These three nodes are in a relatively low water pressure. The water demand of node 11 is the second lowest, at 97.2 m
3/h. Comparing the hydraulic information, we found that the nodes with lower pressure and water requirement are more sensitive to the changes of pressure and water requirement caused by leakage. The monitoring sensors should be placed at the end of pipework, which is more sensitive to pressure, as far as possible, which is consistent with that described in Jianwen Liang [
31].
5. Discussion
The sensor placement of the two models is as follows:
Sensor placement based on traditional models: node 40, node 11, node 41, node 10, node 32, node 20 and node 5.
Sensor placement for disaster prevention in WDNs for important users: node 44, node 14, node 23, node 10, node 32, node 20 and node 6.
In terms of the node location,
Figure 7 and
Figure 10 show that the sensors placed in node 40 and node 11 in the traditional model are close to node 44 and node 14, respectively, in the model presented herein. Node 10, node 32 and node 20 are selected as monitoring placements in both the two models. This means that the above three nodes are still suitable for monitoring the pressure changes of pipework as sensor placements, considering both sensitivity and node users’ impact factors.
In terms of node importance, the monitoring points node 40, node 11, node 41 and node 5 in the traditional model become node 44, node 14, node 23 and node 5 in the model presented herein. From
Figure 6, it can be seen that the sensor placements based on the model presented herein are located at or near the nodes with high impact factors, indicating that the placements are more important in post-earthquake emergency support, network topology and water shortage rate.
