Article

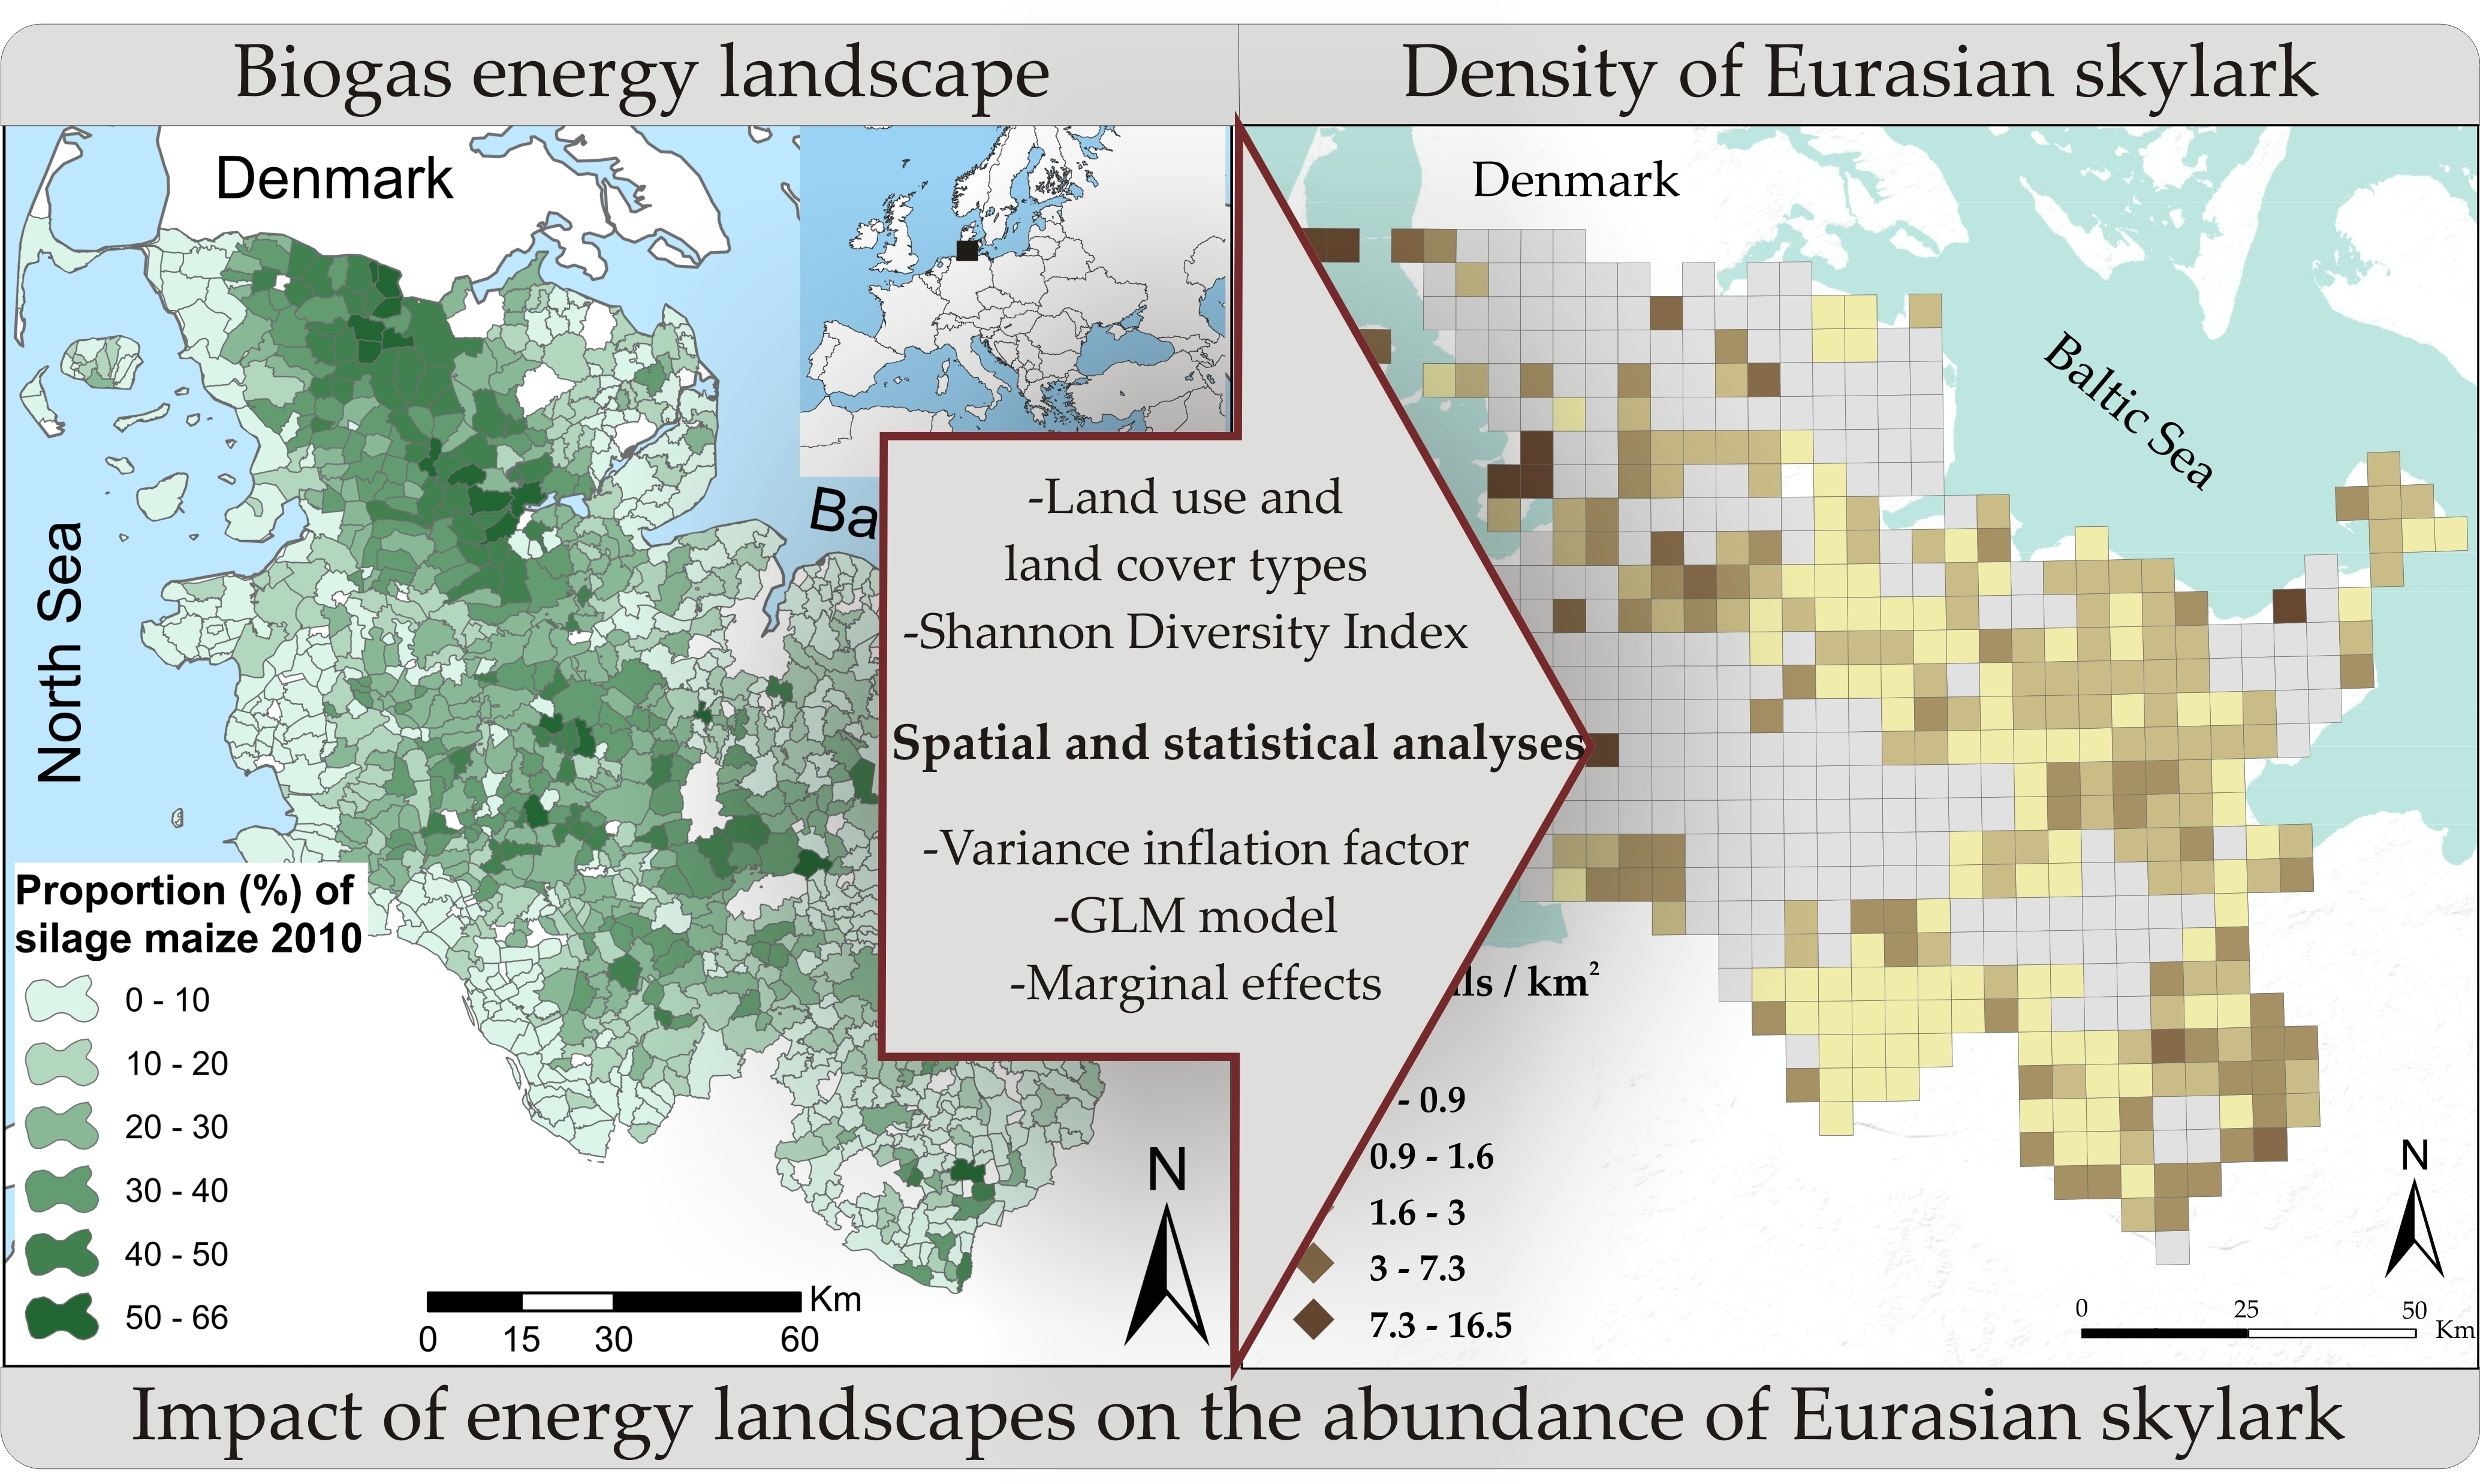
Impact of Energy Landscapes on the Abundance of Eurasian Skylark (Alauda arvensis), an Example from North Germany

Department of Physical Geography and Geoinformatics, University of Szeged, Egyetem u. 2–6, H-6722 Szeged, Hungary
*
Author to whom correspondence should be addressed.
Sustainability 2020, 12(2), 664; https://doi.org/10.3390/su12020664
Submission received: 5 December 2019 / Revised: 10 January 2020 / Accepted: 11 January 2020 / Published: 16 January 2020
(This article belongs to the Special Issue Landscape Ecology for Sustainability)

Abstract

:
The increasing use of biomass for energy production is reshaping landscapes into energy landscapes. Our study aims to analyze the impact of the biogas energy landscape on the abundance of Eurasian skylark. The biogas power plants have a high impact on the landscape, because of the energy crops like silage maize and rape. We analyze land-use and land-cover heterogeneity in connection with this bird species in the Federal State of Schleswig-Holstein. Three databases are used: abundance data of a typical farmland bird (Eurasian skylark), Corine land cover, and statistical land-use data from the German Agricultural Structure Survey. Several spatial analyses and statistical analyses were conducted. Generalized linear models are used with model averaging and predicted marginal effects were calculated. We estimate the changes in individuals per km2 by considering six crop types and the Shannon Diversity Index (SDI). The Eurasian skylark abundance has a significant negative correlation with the area of the inland wetlands, the Shannon Diversity Index (SDI), permanent crops, silage maize, and rape. We found significant positive correlation with the pasture, potato, and wheat. The replacement of pastures, Eurasian skylarks’ preferred habitat, with energy crops, mostly silage maize, and the ongoing homogenization of the landscape, negatively affected this species’ distribution in the study area.

Graphical Abstract

1. Introduction

Today, the usage of renewable energy sources is a common practice worldwide. Various renewable energy sources can be found in many countries, from the USA to China and across Europe [1,2,3]. Alternative energy systems are shaping the landscape, giving birth to a new term, energy landscape. Examples of ways in which these energy systems are changing the landscape include the wind turbines near the coast, biogas power plants in agricultural areas, and solar panels near roads. According to Calvert et al. [4], an energy landscape is defined as an area whose geomorphology is associated with a distinct type of energy production system, nowadays mainly renewable energy. Similar to other landscapes, they are also spatially and temporally dynamic.
The European energy sector has set up its own climate protection goals regarding greenhouse gas emissions. The European Union (EU) members decided to add more renewable energy sources to their national energy systems. The renewable energy production yield from biogas, mostly electricity [5], is 7.6% in the EU. The anaerobic co-digestion of waste and agricultural products, such as energy crops and manure, contributes to 69% of the biogas production [6].
Germany produces half of the total amount of biogas energy in the EU [6]. Most of the biogas is used to generate electricity, owing to the introduction of a renewable energy law in 2000, which was amended in 2004 and 2009 to encourage a boost in biogas production [7]. The law guarantees a high and constant feed-in tariff for new biogas power plants. It introduced a bonus for the use of renewable substrate materials, such as energy crops and manure [7]. More than 10,000 biogas power plants are operated mostly by local farmers with an installed capacity of 4500 MW [7]. The transformation from agrarian landscape to energy landscape has many consequences, mostly caused by the energy crop production. The changes generated by the adoption of biomass energy can be observed in ecosystem services [8], biodiversity (fauna and flora) [9,10], land use [11,12,13], and landscape structure [13,14]. The cultivation of pastures and cereals to silage maize is related to increased risk of soil erosion [15], nitrogen mineralization [16,17], and release of greenhouse gases [17], as well as to changes in local biodiversity [10,14]. Usually, the transformation from agrarian landscape into energy landscape causes changes in landscape (land cover and land use) heterogeneity.
To analyze the links between the Eurasian skylark and land-cover and land-use (crop) heterogeneity change, we need to first investigate the cause of these changes, which is the establishment of biogas power plants and the energy crop production, like silage maize and rape. Between 2002 and 2012, in Schleswig-Holstein, there was a significant change in the landscape. The landscape transformation changed mainly food-producing landscapes to energy landscapes [13]. This relatively fast and significant change in the landscape, as well as its impacts on biodiversity, crop heterogeneity, and the abundance of farmland birds, has not been clarified yet [13].
It is important to investigate the effects of land use, land cover, crop heterogeneity, and crop structure change on the abundance of farmland birds, because many studies have indicated that the abundance of farmland birds in Europe is significantly connected with the intensity of agricultural cultivation, crop heterogeneity, and land-use change [18,19,20,21,22]. The Eurasian skylark Alauda arvensis is the most common farmland bird in Europe, and is also found in the Americas, Australia, and New Zealand [23]. It always nests on the ground and also spends lot of time in the air [24].
So far, just a few papers have investigated the Eurasian skylark in the Federal State of Schleswig-Holstein. No studies have analyzed the link between the Eurasian skylark abundance and the energy landscape generated by landscape transformation. Therefore, the following are the objectives of this study:
  • To analyze the relationship between the abundance of Eurasian skylark, the land-cover and land-use (crop) types.
  • To analyze the statistical connection between the Eurasian skylark and landscape heterogeneity by the Shannon Diversity Index (SDI).
The results of this study are expected to be valuable in analyzing and forecasting the changes in the abundance of a farmland bird species generated by biomass energy production in a typical energy landscape (North Germany). Moreover, our findings could be used as a guide for studying other situations or can be a useful tool for studying the impacts of energy-landscape-generated land-cover changes on biodiversity in other study areas.

2. Materials and Methods
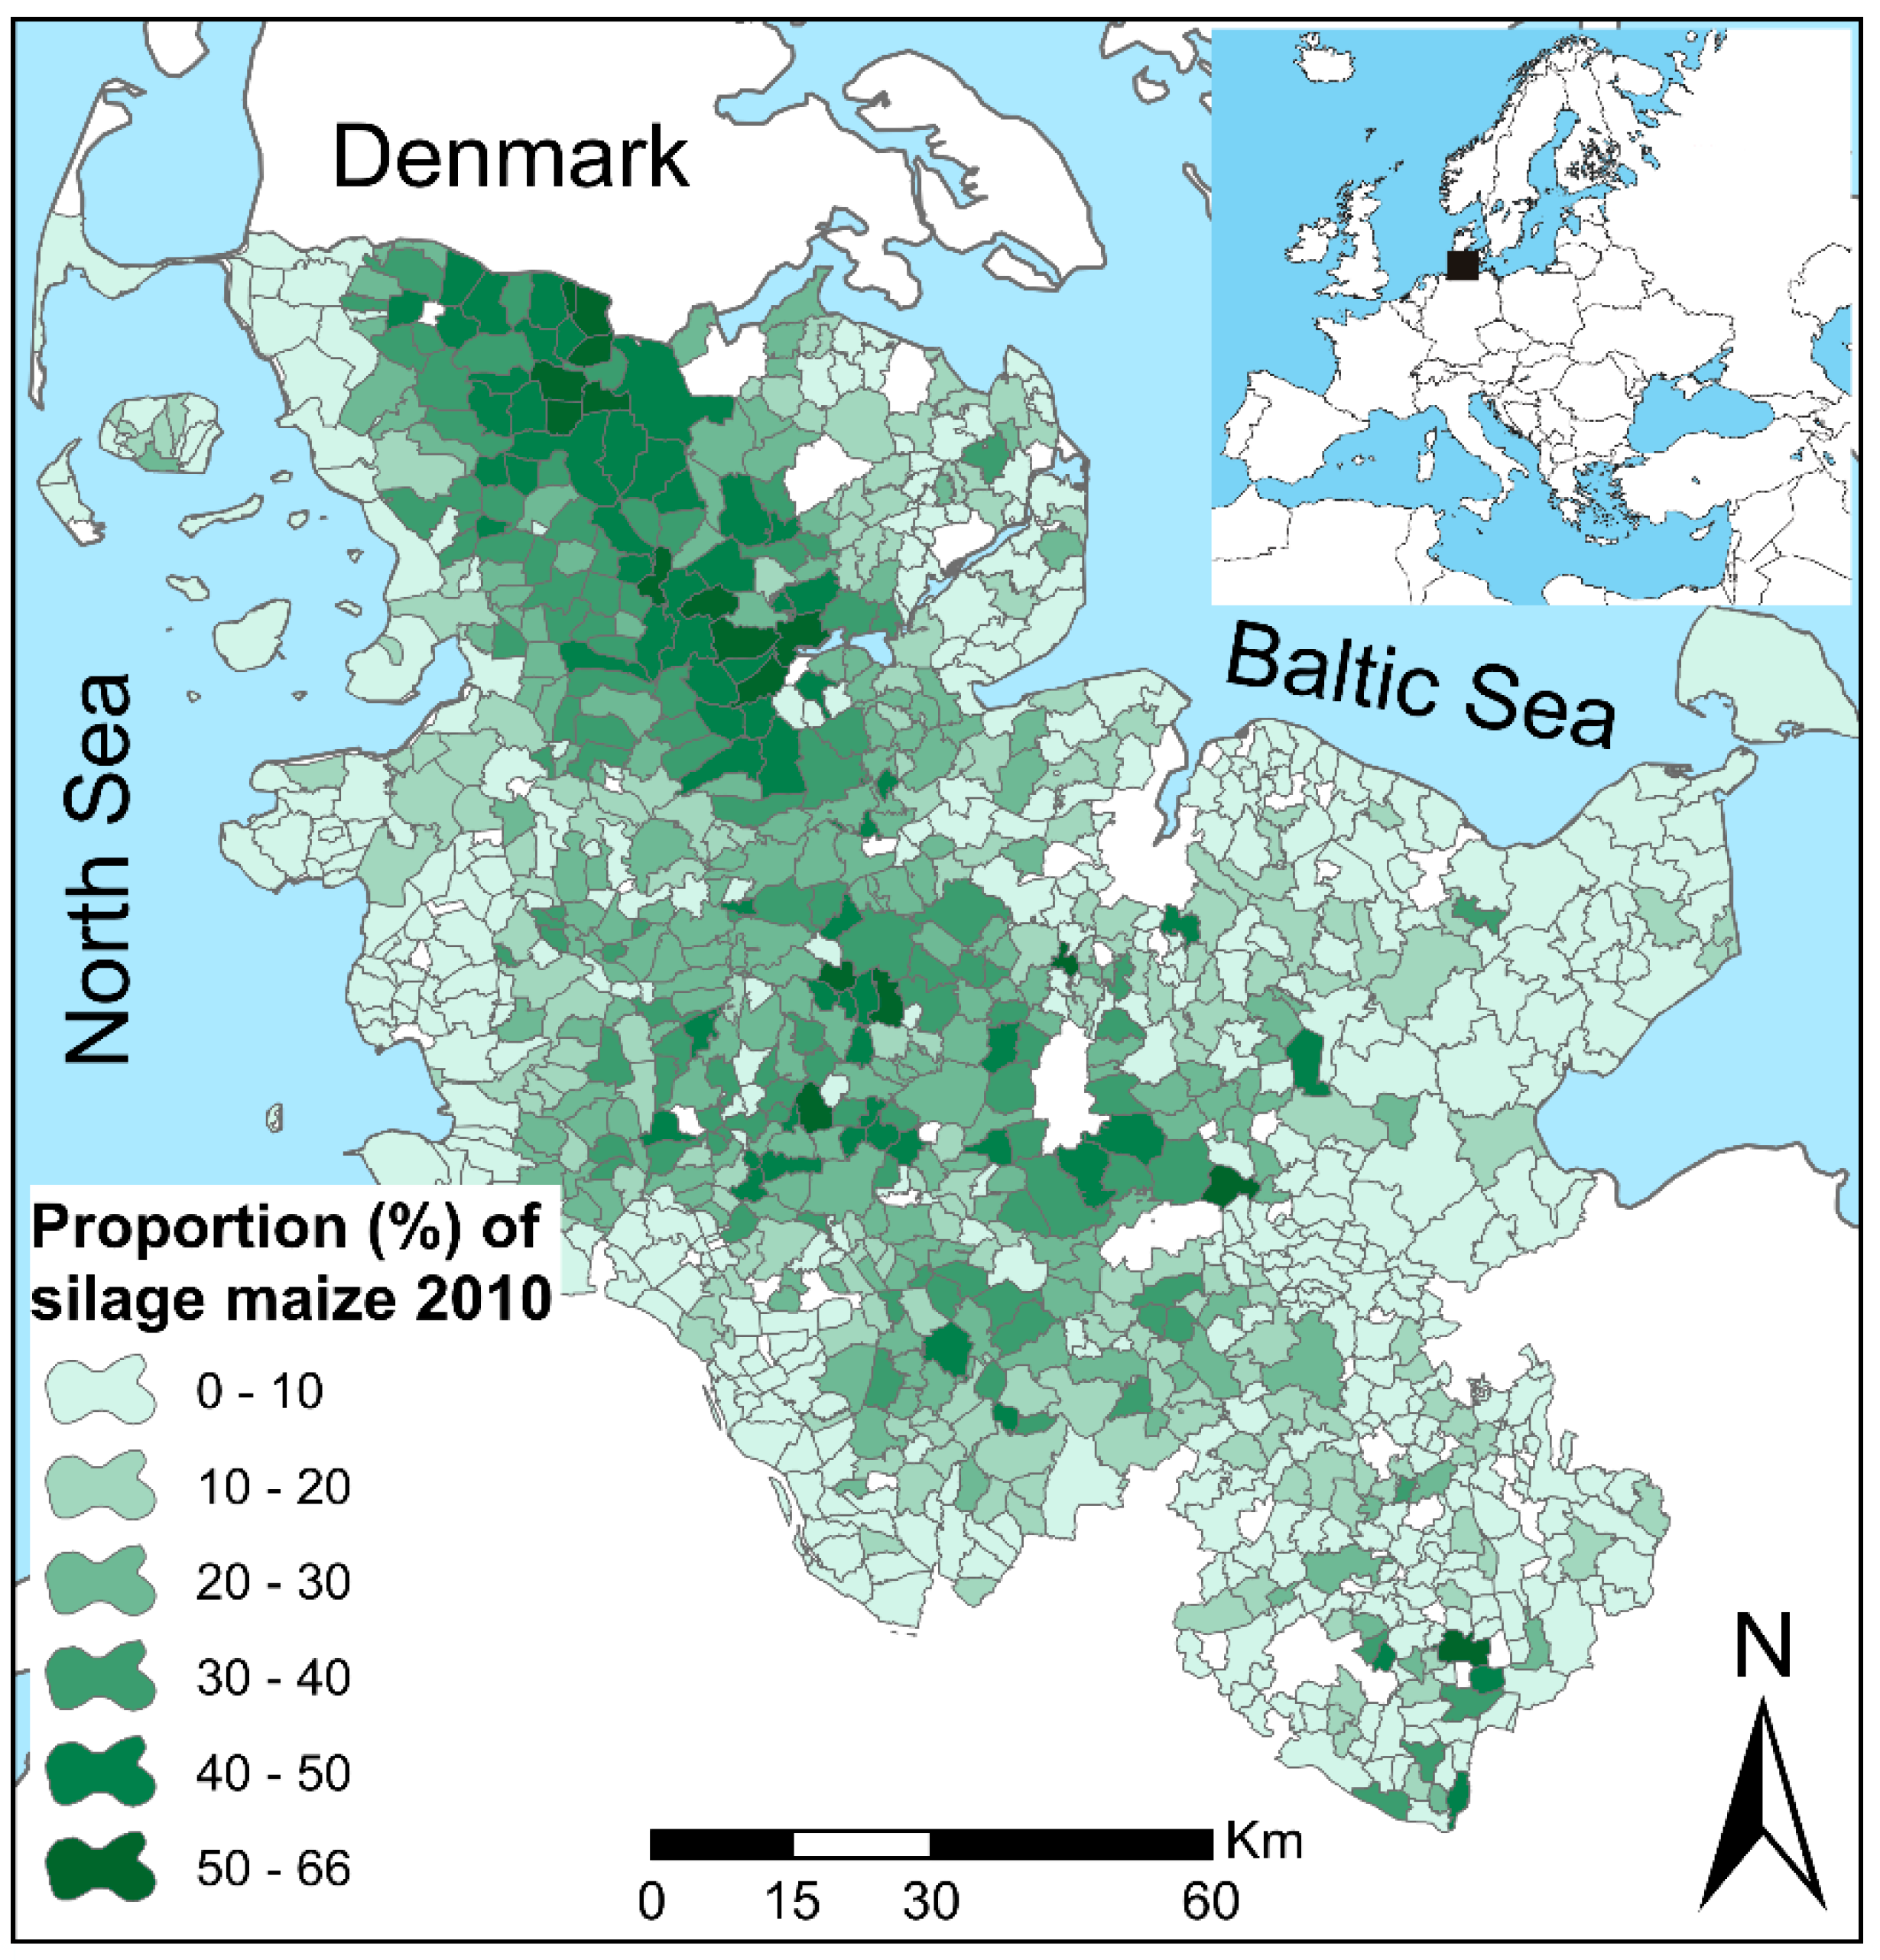
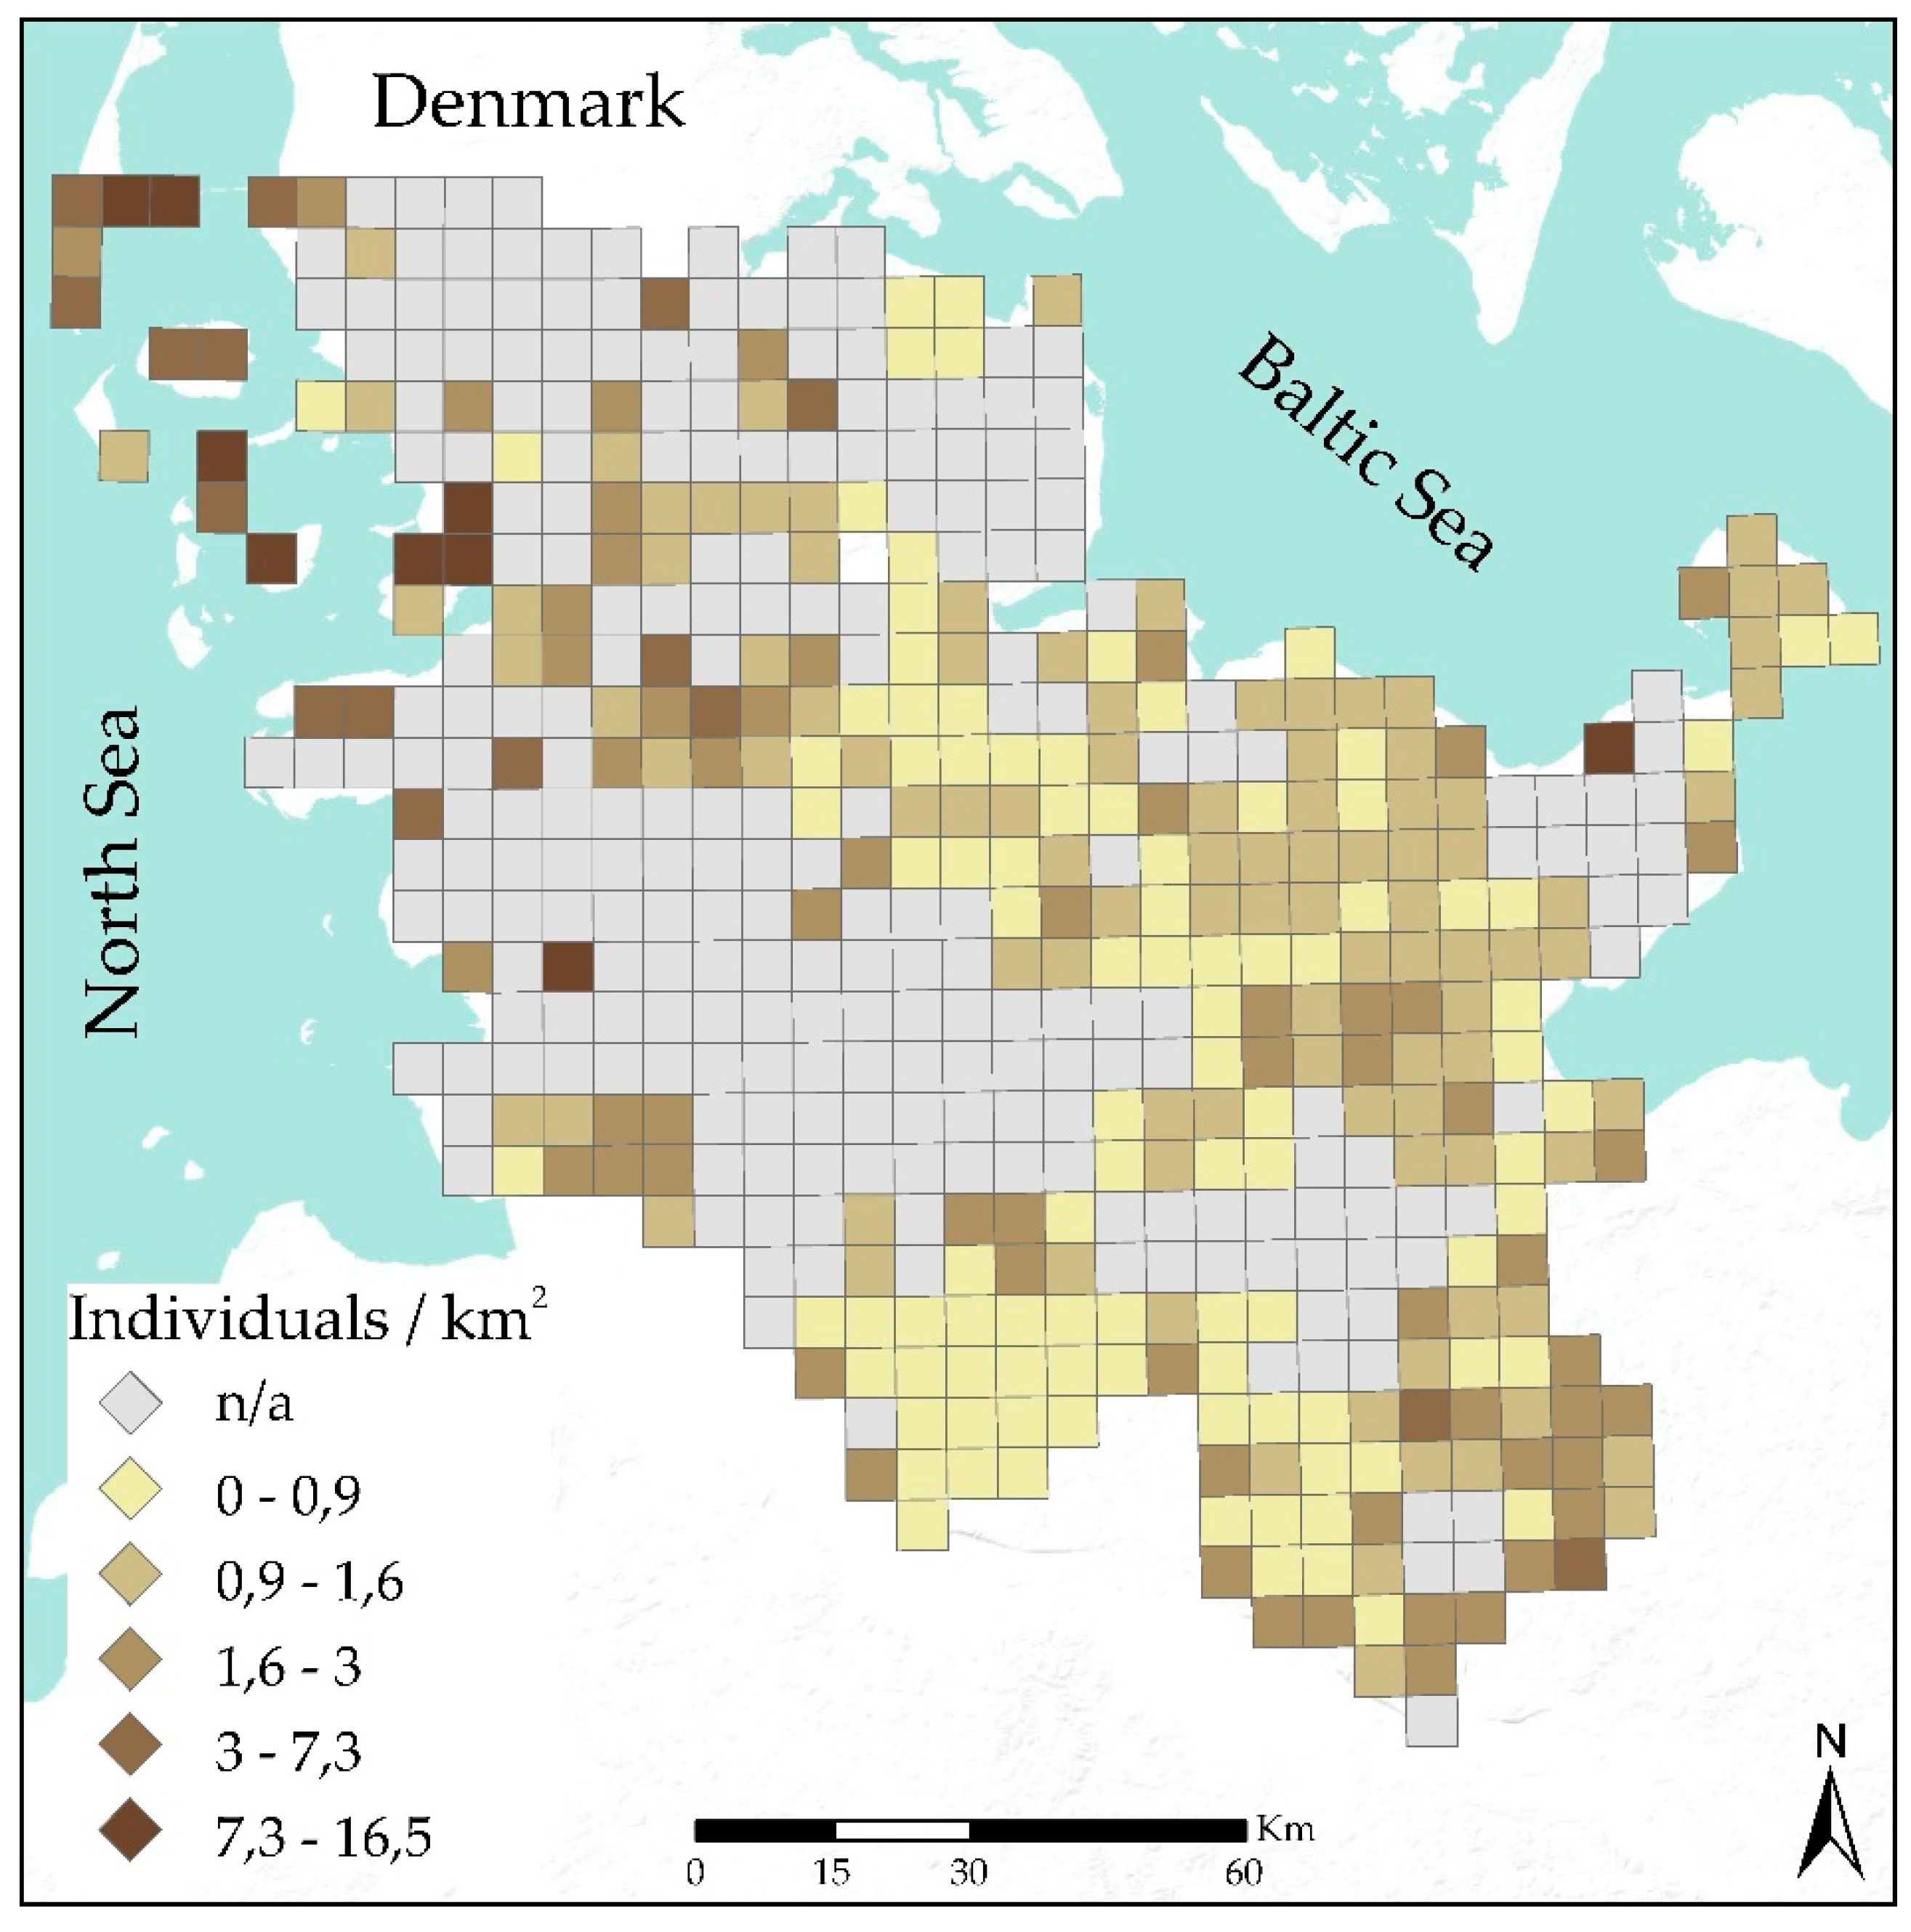
2.1. Study Area

The study area is Schleswig-Holstein, the northernmost Federal State of Germany. It is bordered by the North Sea in the west, Denmark to the north, and the Baltic Sea to the east (Figure 1). The climate is formed by the sea; it is humid with an average annual precipitation of 878 mm and a mean annual temperature of 8.6 °C (weather station Schleswig, data for 1981–2010, Deutscher Wetterdienst (DWD) [25]).
Schleswig-Holstein can be divided into three main landscapes. Marshlands have developed since the end of the last ice age, and these younger soils (calceric fluvisols/gleysols) are highly fertile [26]. The outwash plains (“Vorgeest” and “Hohe Geest”) are characterized by less productive soils, such as podzols and podsolic gleysols. The Younger Moraine Hill Country area is mainly used for crop production of winter wheat (Triticum aestivum L.), barley (Hordeum vulgare L.), and oilseed rape (Brassica napus L.).
In Germany, the greatest production of silage maize is achieved in the northern federal states of Lower-Saxony and Schleswig-Holstein [27]. Table 1 and Table 2 show the proportion of the land-cover and land-use types in Schleswig-Holstein.

2.2. Data Sources and Databases

2.2.1. Land-Cover Database

The European Corine land-cover (CLC) maps have been prepared using the same methodology for all EU countries [28,29]. The scale of the maps is 1:100,000, and the minimum mapping unit is 25 ha for land-cover patches with at least 100 m width for linear landscape elements. Mapping is repeated every six years, and thus, three assessments of land cover are available since 2000. They include 44 classes of land cover and land use, 37 of which are relevant for Germany [28] (Table A1). The study area contains 14 (level-2) CLC categories. We used the CLC dataset from 2006, because the bird field survey data was collected between 2005 and 2009 (Ornithologische Arbeitsgemeinschaft für Schleswig-Holstein 2009).

2.2.2. Land-Use Database

The German Agricultural Structure Survey (Agrar-Struktur-Erhebung, ASE, Hamburg, Germany 2010 was used to investigate the correlations among the Eurasian skylark abundance, land use, and crop types. This statistical survey obtained full census data on crop types and land use (Table A2). We used the census data from 2010, which were aggregated by municipality (1106 municipalities in Schleswig-Holstein).

2.2.3. Eurasian Skylark Abundance Data

Eurasian skylark abundance data were collected by the ornithological working group of Schleswig-Holstein and Hamburg (Ornithologische Arbeitsgemeinschaft für Schleswig-Holstein und Hamburg). The survey was supported by the ADEBAR (Der Atlas Deutscher Brutvogelarten) project between 2005 and 2009. Around 150 surveyors mapped all the breeding bird species in Schleswig-Holstein. The survey was conducted using the TK25 border grid (11 × 11 km2), where the area of one grid cell is around 120 km2 [30]. Each TK25 grid cell was divided into four quadrants with a size of 5.5 × 5.5 km2 each [31]. The federal state of Schleswig-Holstein has 646 TK25 quadrants, of which 380 quadrants were mapped (59%). We used 281 quadrants, which had the latest abundance data from 2009 (Figure 2). We used data just from 2009, because this year fits the best to the CLC land cover (2006) and the agrarian census database from 2010.

2.3. Spatial and Statistical Analyses

For the spatial analyses, we used the ArcMap module of the ArcGis 10.3 software package. (ESRI, Redland, CA, USA) Following Uuemaa et al. (2009) [32], SDI was applied to evaluate the connection between the Eurasian skylark abundance and the landscape structure. Land cover and the crop heterogeneity index (SDI) inside the municipality polygons in ASE were calculated using a Microsoft Excel add-in [33]. The SDI represents the number of different land-use types and the relative abundance:
S D I = i m ( P i ln ( P i ) )
where (m) represents the number of different land-cover types, Pi = the relative abundance of different land-cover types.
For the statistical analysis, we used the grid of the Eurasian skylark abundance data, the municipality layer from the ASE. We joined with the grid quadrants the municipality polygons whose centers were inside the bird survey quadrant. We conducted preliminary tests to identify any correlation between the skylark abundance and the explanatory variables, using the variance inflation factors (VIFs). The explanatory values that were not linearly connected were between VIF value of 0.44 and 8.89. We used generalized linear models (GLMs) to evaluate the effects of land-cover and land-use heterogeneity on the abundance data of Eurasian skylark (ESA). We set the skylark abundance as the response variable and the total area (ha) of the following land-use (crop) categories from ASE as explanatory variables: pasture, rape, silage maize and wheat, permanent crops, sugar beet, rye, and triticale. We used negative binominal models to take into account any overdispersion of the abundance data. We created models with all possible variations of explanatory variables, and used Akaike’s information criterion to rank them with the “dredge” function from the “MuMIn” package in R [34]. We achieved model averaging for competitive models (delta AICc < 2) by including the uncertainty arising from the high number of candidate models, as proposed by Burnham and Anderson [35]. We used the “LmerTest” package to estimate the significance of the variables.
The function ggpredict from the “ggeffects” package [36] was used to compute the predicted marginal effects of the various crops based on the crops’ heterogeneity in the population data of Eurasian skylark. The proportion of the crop types (ASE) and the number of skylarks per square kilometer were calculated inside the bird survey quadrants.

3. Results

3.1. Correlation Between Land Cover, Land-Use Types and ESA

We correlated ESA and the different CLC categories. Table 3 shows a summary of only the significant relationships. In the entire study area, four CLC categories show significant positive relationships with the Eurasian skylark abundance: categories of pasture land, shrub and/or herbaceous vegetation associations, and coastal wetlands. On the other hand, the skylark population is negatively correlated with the inland wetlands. The relationships with the heterogeneous agricultural areas, the inland wetlands, and the urban fabric categories are negative. SDI is negatively correlated with the Eurasian skylark population data in the entire study area (85% importance).
In the entire study area, we observed three positive relationships with land-use types, pasture, potato, and wheat (Table 3). There are also three negative relationships, with permanent crops, silage maize, and rape. SDI has a negative relationship with ESA in the entire study area.

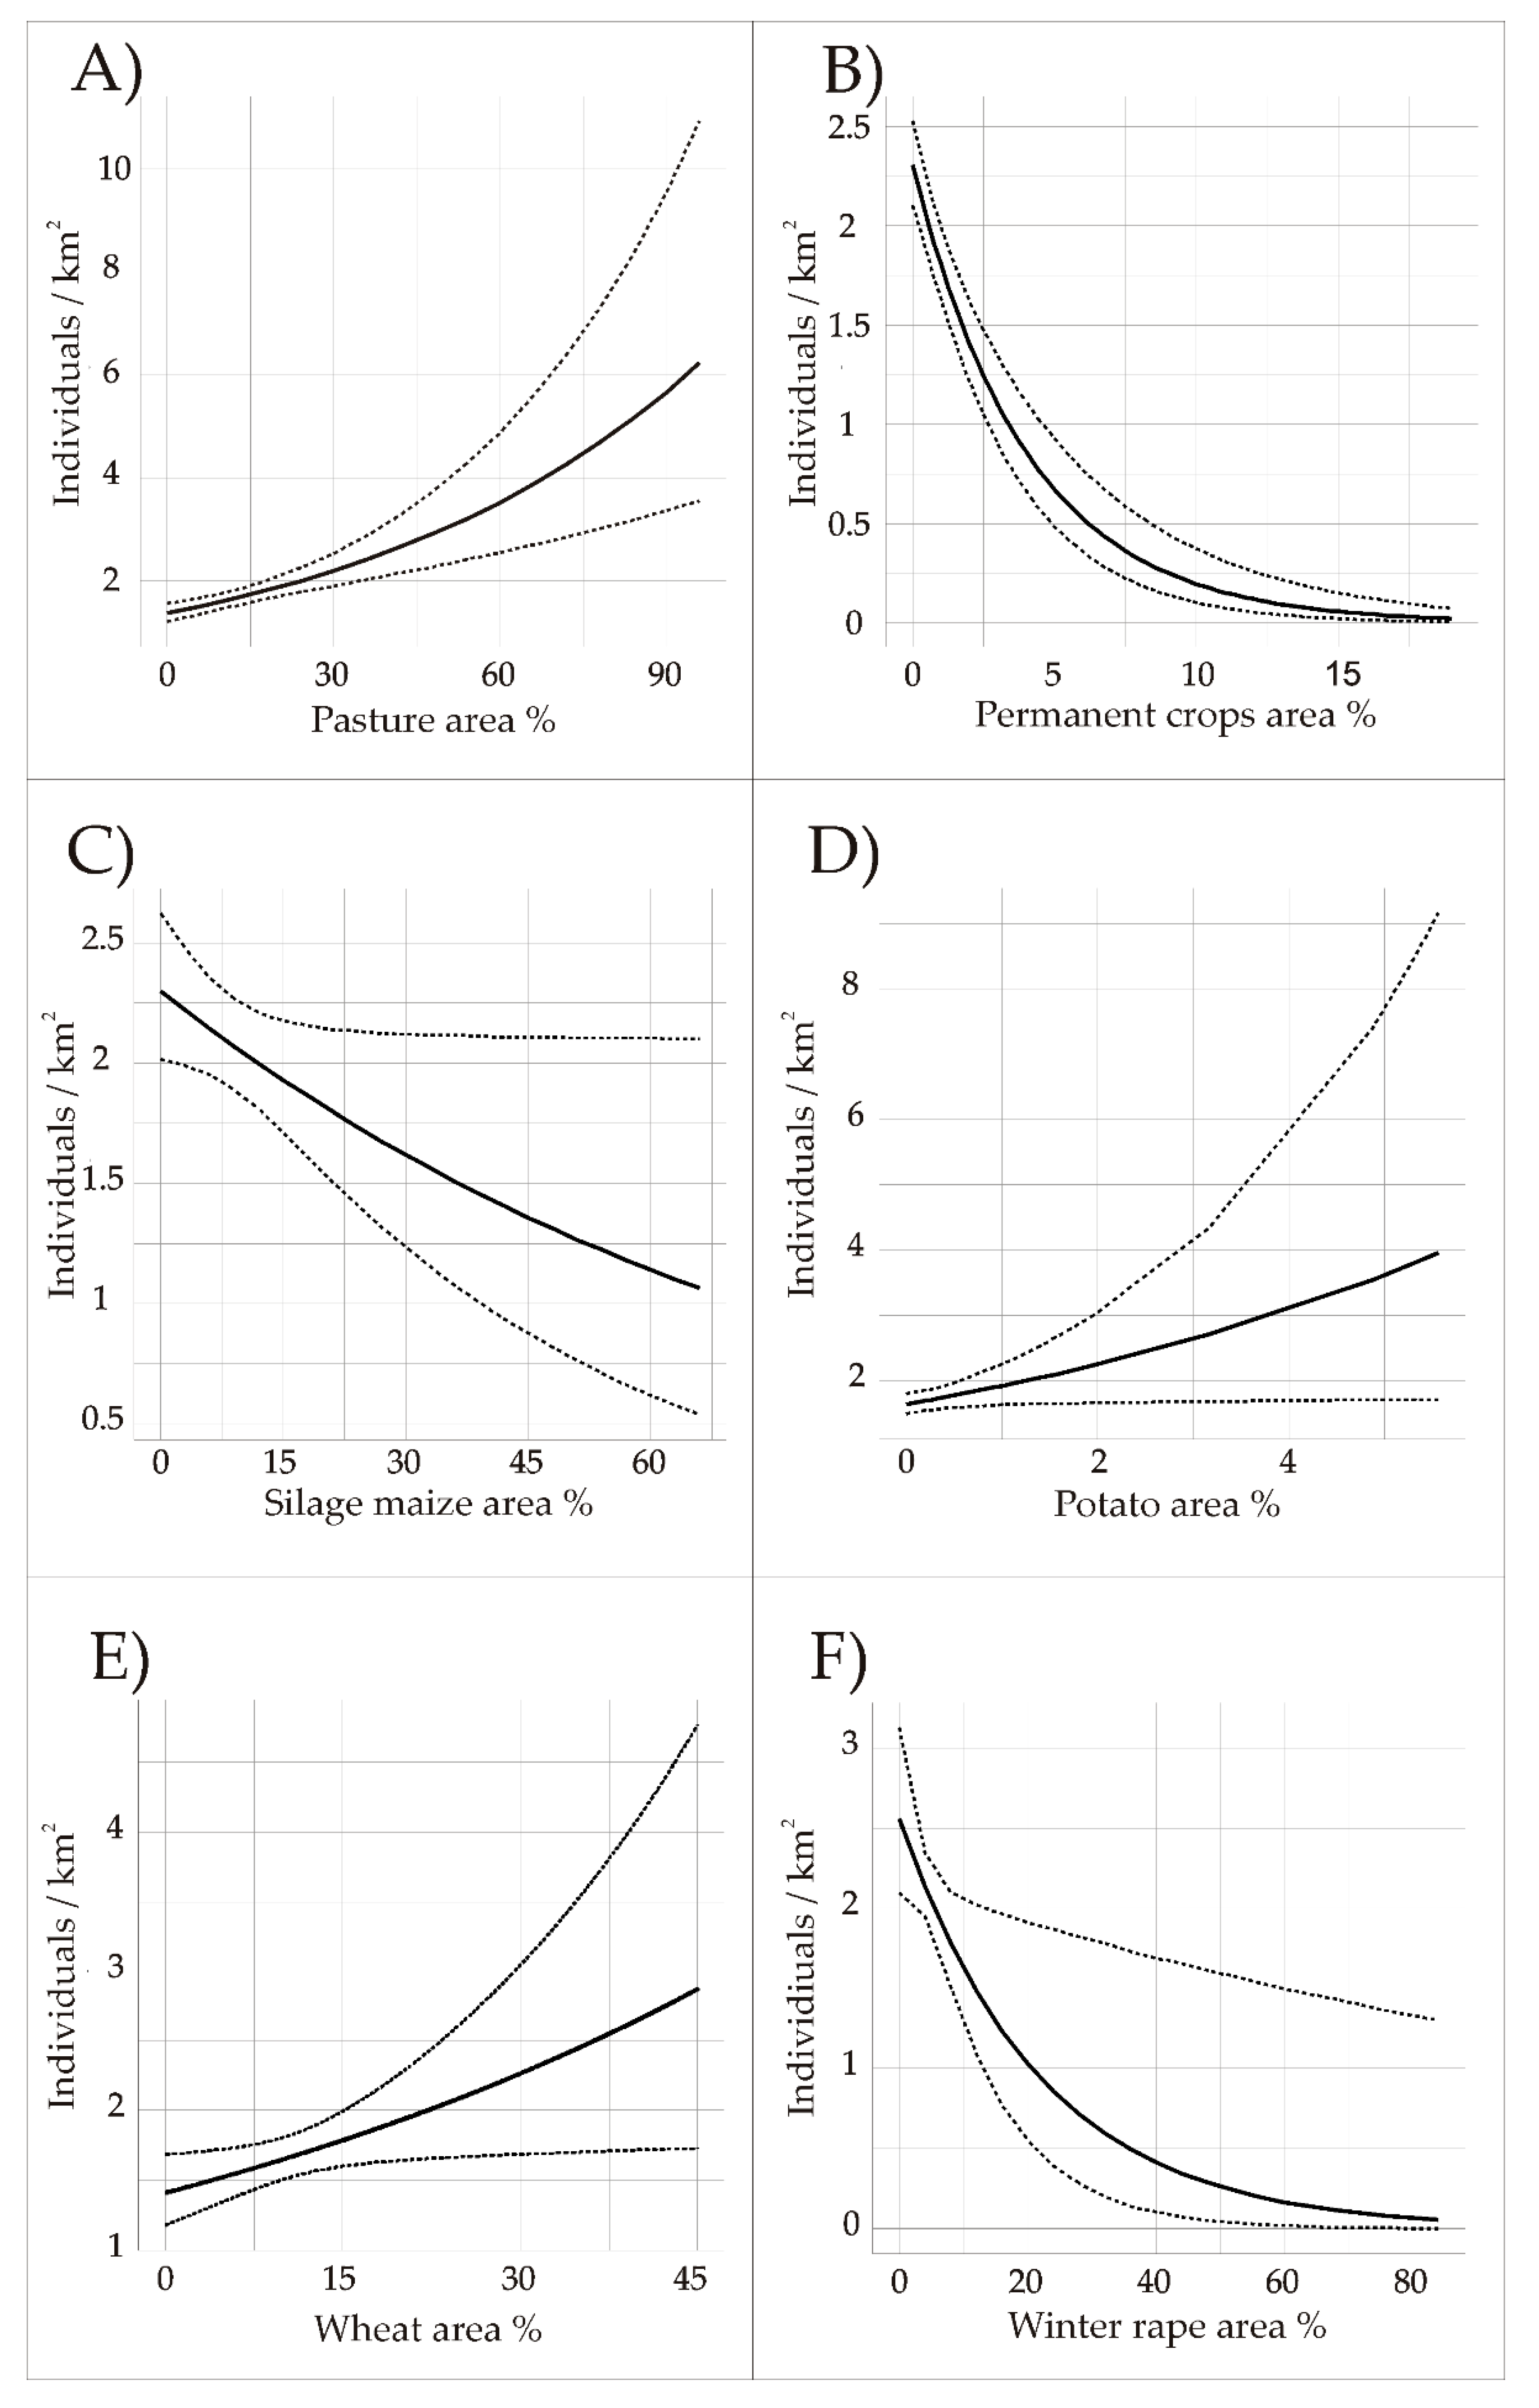
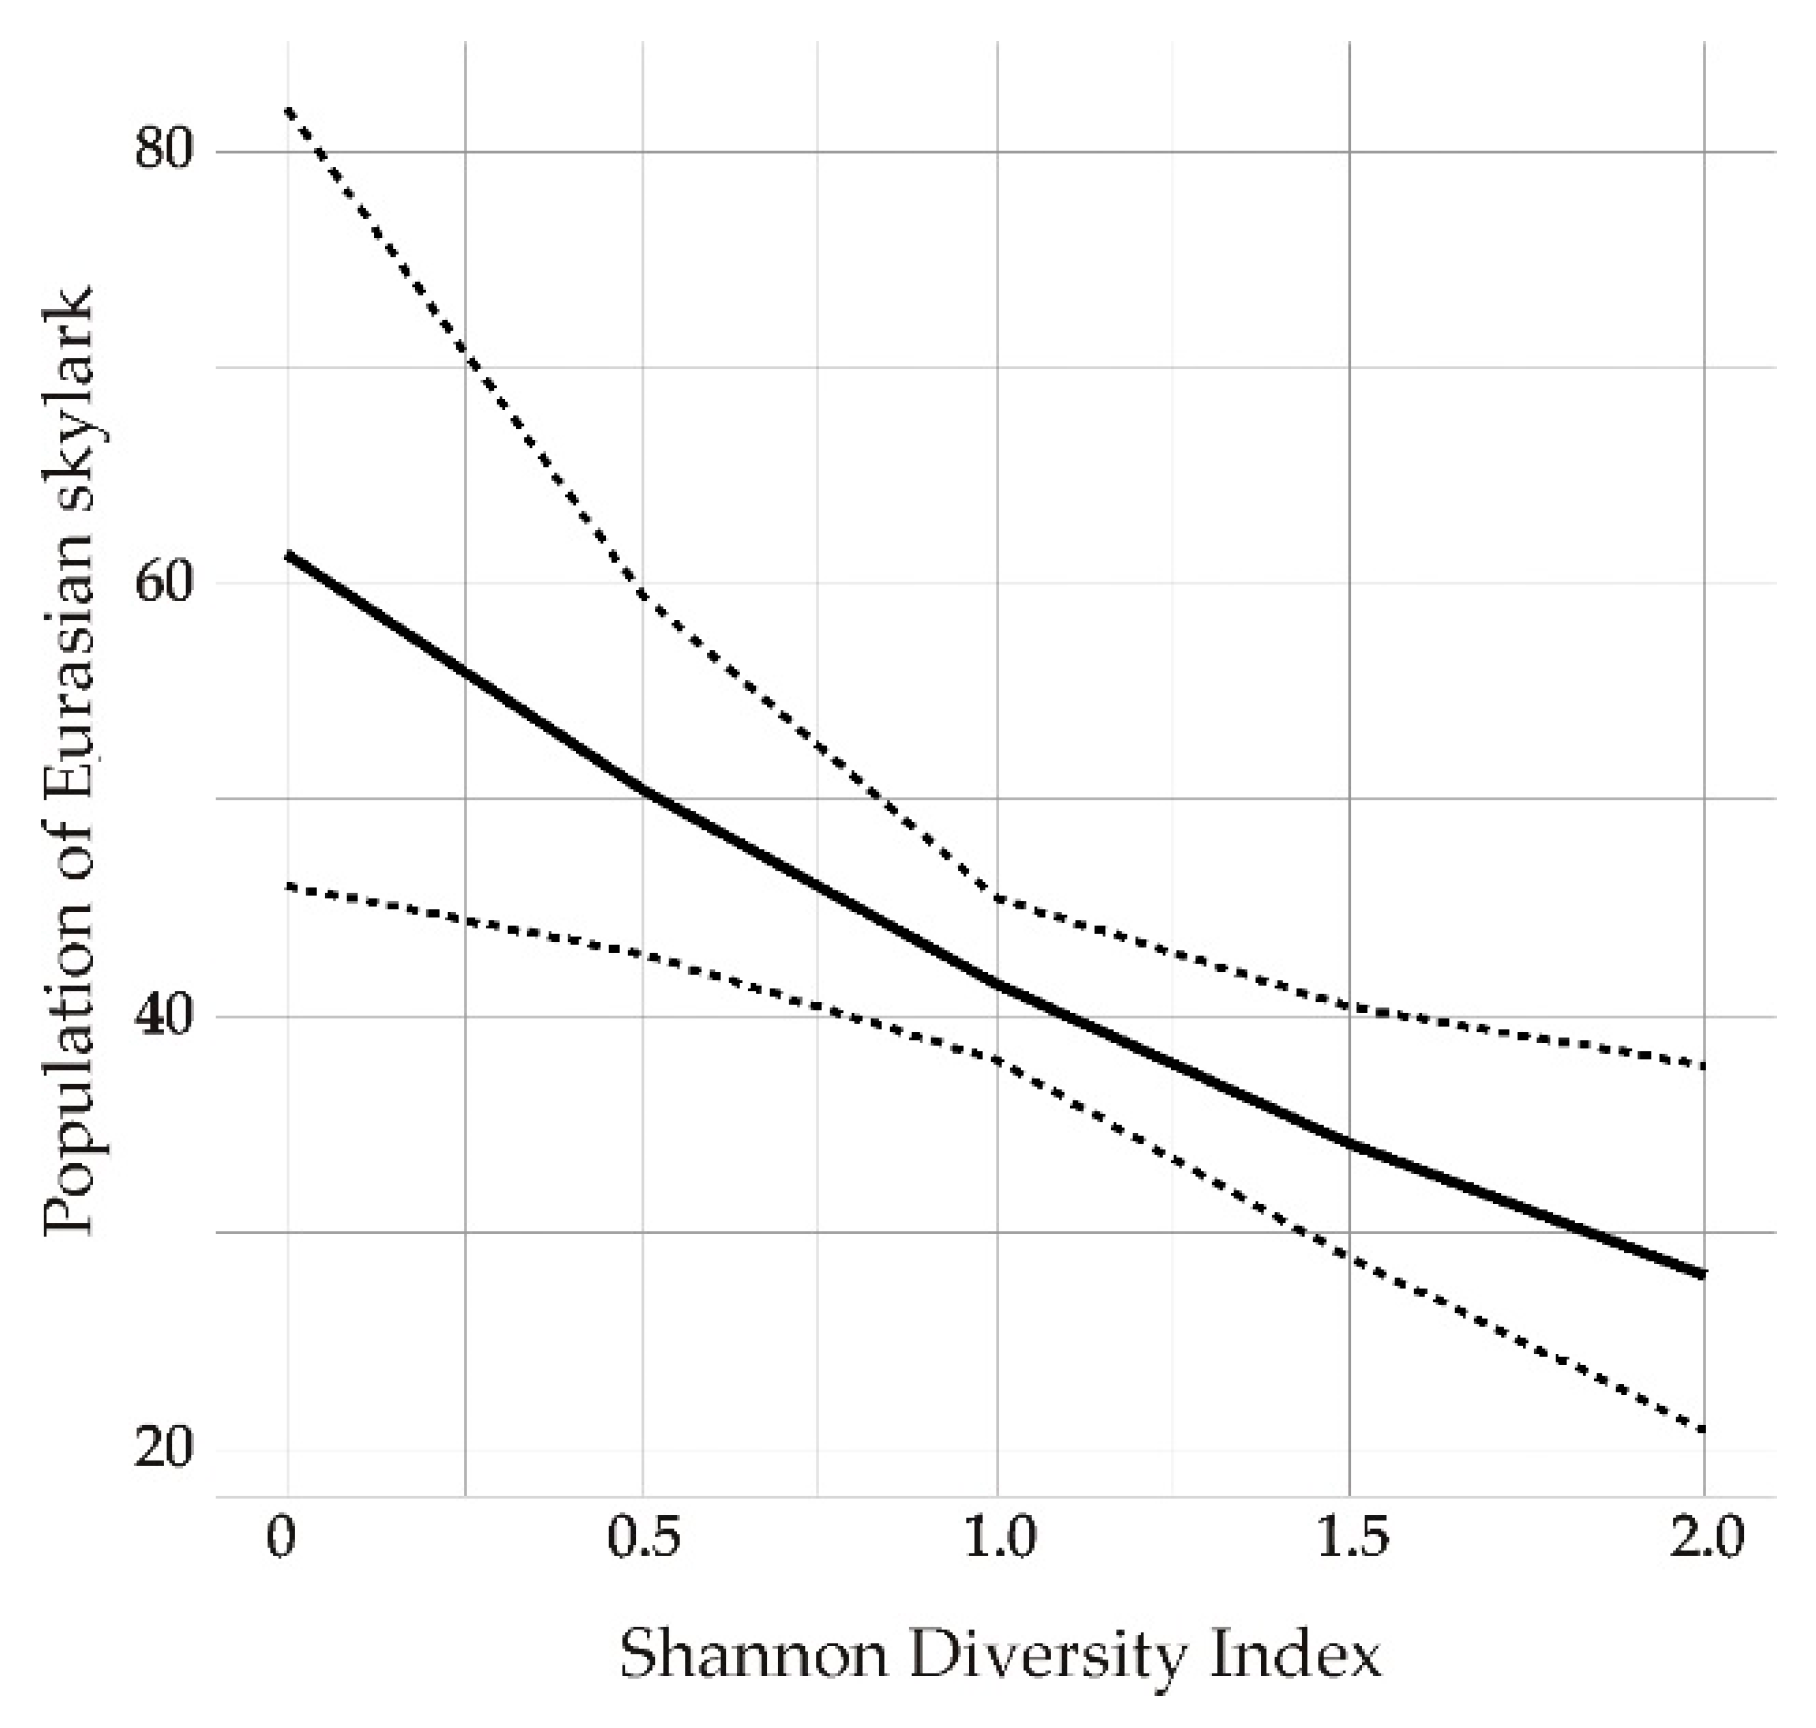
3.2. Predicted Marginal Effects of Different Crop Types and Heterogeneity on the Population Data of Eurasian Skylark

The predicted marginal effects of different crop types on the ESA in the entire study area are summarized in Figure 3. Each graph in Figure 3 shows a narrow confidence interval at the beginning, which widens gradually. According to Figure 3A, a maximum of 10 individuals/km2 is predicted within 90% of the pasture proportion. Silage maize (Figure 3C) and the winter rape (Figure 3F) both have strong negative impacts on the Eurasian skylark population. On these two graphs, the upper confidence value stagnates or slightly decreases. The predicted marginal effect of the proportion of wheat on Eurasian skylark/km2 increased almost linearly from 1.4 to 2.8 with a tight confidence interval until the 15% proportion of wheat.
The predicted marginal effects of SDI on the ESA in the entire study area are summarized in Figure 4.

4. Discussion

The GLM results for the entire study area show a significant correlation with four land-cover categories. The pasture and the shrub and/or herbaceous vegetation association categories show a positive significant relationship. This is expected since pasture is a typical habitat of the Eurasian skylark [23,37,38]. The positive correlation with the shrub and/or herbaceous vegetation category is more interesting. Szilassi et al. [37] found a negative connection between this CLC category and ESA data, which they attributed to the succession process of natural grasslands. This category contains natural grassland, hedgerows, shrubs, and low vegetation. Hedgerows can be found at the edges of arable or pasture lands in Schleswig-Holstein. According to Morelli [39], marginal vegetation types (hedgerows, isolated tree, and uncultivated patches) are rather highly important as a habitat for the Eurasian skylark. We found that the coastal wetland category has a significant positive correlation with skylark abundance in the entire study area. Coastal wetland contains two subcategories in Schleswig-Holstein: salt marshes and intertidal flats. Salt marshes can be a suitable habitat for the skylark, because they include salt pastures and meadows. This result can also be explained by the data scale; the 5.5 × 5.5 km2 quadrants can contain both a high proportion of arable land and coastal wetland in the same quadrant. This new biogas energy landscape has a strong effect on the recent land-use/land-cover changes. Due to the introduction of bioenergy plants (especially the silage maize), the area of pastures has been decreased dramatically [11]. Parallel with this process, the landscape heterogeneity also changed because of the fusion of the small parcels into homogeneous large silage maize fields without shrubs and natural grassland corridors.
We found a negative significant correlation between SDI and ESA. Our results confirm that, at the regional (CLC) scale, the increasing landscape heterogeneity has a negative effect on the population of the Eurasian skylark [19,21,37,40,41]. The increasing heterogeneity results in a lower abundance of the Eurasian skylark.
Based on the ASE database, we analyzed the relationship between agricultural land-use (crop) types and ESA on a large scale. The establishment of pastures has had a positive effect on the abundance of the Eurasian skylark. We found a negative correlation with the permanent crops category and this category takes the second place in the model, and therefore, has a significant impact on ESA. This negative correlation is probably due to the height and coverage of the vineyards and fruit plantations, which are not suitable habitats for this bird species [42,43]. In the literature, wheat is a well-known habitat type of the skylark [38,42,43,44]. We found a positive significant correlation between wheat and ESA. Silage maize is the next most important crop type of the study area, which also has a negative effect on ESA. We also found a negative correlation between winter rape and the Eurasian skylark in the entire study area. Strong negative impact of silage maize and winter rape can be explained based on the results of Hoffmann et al. (2018) [43]. According to these authors, these fields can provide a suitable habitat for the Eurasian skylark during the early breeding period, but later, these plants will grow too high and the ground coverage will be too much, and this area will not be suitable in the breeding periods of the year. Winter rape has the strongest negative effect, according to our multimodel estimate. The silage maize and winter rapes are the dominant land-use types of the energy landscapes. Based on Csikos et al. [13], there is a significant positive correlation between the capacity of the biogas power plants and the area of silage maize and rape.
The high heterogeneity of agricultural land, i.e., the crop types, also has a negative effect on this bird species. We found significant negative correlations in the entire study area. The relationship between crop heterogeneity and ESA has been analyzed in some previous studies. According to Chamberlain et al. (2001) [45], in England, the skylark density increased with habitat heterogeneity; nevertheless, farmland plots in the lowlands of England showed decreased skylark density with increasing habitat heterogeneity. These results suggest that the crop type is more important than the crop heterogeneity value [41]. According to Blaschke et al. [46], an increase in cultivation of bioenergy crops inside the biogas energy landscape will decrease the land availability for traditional agriculture and nature conservation.
The predicted marginal effect values are calculated based on the entire study area. Permanent crop has the largest negative effect on ESA and it can decrease the skylark individuals/km2 value. The wheat area is a well-known habitat of the Eurasian skylark and the predicted values show that an increasing proportion of the wheat area in the landscape can increase the skylark individuals/km2 value. The confidence interval for potato shows that potato can increase or maintain a constant individuals/km2 value. Piha et al. [47] found that the Eurasian skylark avoided potato, and in larger open farmland areas, the skylark population density was negatively correlated with the proportion of the potato crop area. According to Dietzen et al. [48] and Kragten et al. [49], potato fields are a suitable habitat for the Eurasian skylark, because the height of this plant is less than 50 cm, and the ground coverage proportion is low.
SDI has a negative effect on ESA, based on the predicted marginal effects. The optimum condition for the Eurasian skylark occurs when the landscape is homogeneous (one of the land uses is dominant, which supports the Eurasian skylark abundance around the birds’ nests).

5. Conclusions

We analyzed the relationships among the abundance data of Eurasian skylark and the land-cover/land-use type, and land-cover/land-use heterogeneity in a selected study area (Schleswig-Holstein). Based on the GLM model averaging, in Schleswig-Holstein, pastures and shrub and/or herbaceous vegetation associations provided suitable habitats for the Eurasian skylark. Among the land-use types inside the agricultural areas, pasture, wheat, and potato were found to be suitable habitat types for this bird. Land cover and crop heterogeneity had negative impacts on the population of the Eurasian skylark. We identified crop types, which had positive (potato and sugar beet) or negative (silage maize, permanent crops, and rape) effects on the abundance of this bird species. Furthermore, we ranked the variables based on their importance in the GLM models. We can state that introduction of energy crops (silage maize), and the homogenization process of energy landscape have a negative effect on the population of the Eurasian skylark in the entire study area.

Author Contributions

Conceptualization, N.C. and P.S.; methodology, N.C. and P.S.; software, N.C.; formal analysis, N.C.; data curation, N.C.; writing—original draft preparation, N.C.; writing—review and editing, P.S.; visualization, N.C.; supervision, P.S. All authors have read and agreed to the published version of the manuscript.

Funding

This research was funded by the “UNKP-19-3-SZTE-42 NEW NATIONAL EXCELLENCE PROGRAM OF THE MINISTRY FOR INNOVATION AND TECHNOLOGY” and the APC was funded by the University of Szeged Open Access Fund (grant number: 4497).

Acknowledgments

We express our sincere thanks to Bernd Koop (Ornithologische Arbeitsgemeinschaft für Schleswig-Holstein und Hamburg) for providing the abundance data of the Eurasian skylark. We thank the anonymous referees for their valuable recommendations and suggestions.

Conflicts of Interest

The authors declare no conflict of interest.

Appendix

Table A1. CLC nomenclature and CLC categories, Source: Bossard et al. 2000 [50], Cole et al. 2018 [51], Kosztra et al. 2019 [52].
CLC (code)Name of the CLC Category (Model)Description
11Urban fabric areaAreas mainly occupied by dwellings and buildings used by administrative/public utilities, including their connected areas (associated lands, approach road network, and parking lots).
12Industrial, commercial, and transport unitsAreas mainly occupied by industrial activities of manufacturing, trade, financial activities and services, transport infrastructures for road traffic and rail networks, airport installations, river and sea port installations, including their associated lands and access infrastructures. Includes industrial livestock rearing facilities.
14Artificial, non-agricultural vegetated areasAreas voluntarily created for recreational use. Includes green or recreational and leisure urban parks, and sport and leisure facilities.
22Permanent cropsAll surfaces occupied by permanent crops not under a rotation system. Includes ligneous crops of standard cultures for fruit production, such as extensive fruit orchards, olive groves, chestnut groves, walnut groves shrub orchards such as vineyards and some specific low-system orchard plantation.
23PasturesLands that are permanently used (at least for 5 years) for fodder production. Includes natural or sown herbaceous species, unimproved or lightly improved meadows, and grazed or mechanically harvested meadows. Regular agriculture impact influences the natural development of natural herbaceous species composition.
24Heterogeneous agricultural areasAreas of annual crops associated with permanent crops on the same parcel. Annual crops cultivated under forest trees. Areas of annual crops. Meadows and/or permanent crops that are juxtaposed. Landscapes where crops and pastures are intimately mixed with natural vegetation or natural areas.
31ForestsAreas occupied by forests and woodlands with a vegetation pattern composed of native or exotic coniferous and/or broad-leaved trees and which can be used for the production of timber or other forest products. The forest trees are under normal climatic conditions higher than 5 m with a canopy closure of at least 30%.
32Shrub and/or herbaceous vegetation associationsGrasslands under no or moderate human influence. Low-productivity grasslands. Often situated in areas of rough, uneven ground, steep slopes. Vegetation with low and closed cover dominated by bushes, shrubs, dwarf shrubs, and herbaceous plants, forming a climax stage of development. Transitional bushy and herbaceous vegetation with occasional scattered trees. Can represent woodland degradation, forest regeneration, recolonization, or natural succession.
41Inland wetlandsAreas flooded or liable to flooding during the great part of the year by fresh, brackish, or standing water with specific vegetation coverage made of low shrub. Semi-ligneous or herbaceous species. Includes water fringe vegetation of lakes, rivers, and brooks. Highly oligotrophic and strongly acidic communities composed mainly of sphagnum growing on peat and deriving moistures of raised bogs and blanket bogs.
42Coastal wetlandsAreas submerged by high tides at some stage of the annual tidal cycle. Includes salt meadows, faces of saltmarsh grass meadows, transitional or not to other communities, vegetation occupying zones of varying salinity and humidity, sands and muds submerged for part of every tide devoid of vascular plants, active or recently abandoned salt-extraction evaporation basins.
Table A2. ASE database nomenclature, source: Hessisches Statistisches Landesamt, 2016 [53].
Crop TypeDescription
OatCereal for grain production including seed production.
Permanent cropsTree and berry orchards, nuts, vineyards, tree nurseries and Christmas tree crops, and poplar plants outside the forest.
PasturePermanent pasture includes all grassland areas outside of crop rotation—without interruption by other cultures—are used and for fodder or litter production or for grazing are determined. Permanent grassland areas are accordingly meadows, mowing pastures, and pastures.
PotatoRoot crops category, potato fields.
RapeOil seed category, winter rape, and suitable for feeding biogas power stations.
Silage maizeGreen forage category, used for feeding biogas power stations or livestock.
Sugar beetRoot crops category, used for feeding biogas power stations or livestock.
WheatIn the category of winter crops, used for feeding biogas power stations or livestock.

References

  1. Sahoo, K.; Mani, S.; Das, L.; Bettinger, P. GIS-based assessment of sustainable crop residues for optimal siting of biogas plants. Biomass Bioenergy 2018, 110, 63–74. [Google Scholar] [CrossRef]
  2. Van der Horst, D.; Martinat, S.; Navratil, J.; Dvorak, P.; Chmielova, P. What can the location of biogas plants tell us about agricultural change? A Case Study from the Czech Republic. DETUROPE 2018, 10, 33–52. [Google Scholar]
  3. Gao, M.; Wang, D.; Wang, H.; Wang, X.; Feng, Y. Biogas potential, utilization and countermeasures in agricultural provinces: A case study of biogas development in Henan Province, China. Renew. Sustain. Energy Rev. 2019, 99, 191–200. [Google Scholar] [CrossRef]
  4. Calvert, K.; Greer, K.; Maddison-MacFadyen, M. Theorizing energy landscapes for energy transition management: Insights from a socioecological history of energy transitions in Bermuda. Geoforum 2019, 102, 191–201. [Google Scholar] [CrossRef]
  5. EEA. Renewable Energy in Europe 2017. Recent Growth and Knock-On Effects. EEA Report No 3/2017. Available online: https://www.eea.europa.eu/publications/renewable-energy-in-europe-2017 (accessed on 14 January 2020).
  6. EC (European Commission). Optimal Use of Biogas from Waste Streams. An Assessment of the Potential of Biogas from Digestion in the EU beyond 2020—European Commission. Available online: https://ec.europa.eu/energy/en/studies/optimal-use-biogas-waste-streams-assessment-potential-biogas-digestion-eu-beyond-2020 (accessed on 9 May 2018).
  7. Scheftelowitz, M.; Becker, R.; Thrän, D. Improved power provision from biomass: A retrospective on the impacts of German energy policy. Biomass Bioenergy 2018, 111, 1–12. [Google Scholar] [CrossRef]
  8. Lupp, G.; Steinhäußer, R.; Starick, A.; Gies, M.; Bastian, O.; Albrecht, J. Forcing Germany’s renewable energy targets by increased energy crop production: A challenge for regulation to secure sustainable land use practices. Land Use Policy 2014, 36, 296–306. [Google Scholar] [CrossRef]
  9. Schleupner, C.; Link, P.M. Potential impacts on important bird habitats in Eiderstedt (Schleswig-Holstein) caused by agricultural land use changes. Appl. Geogr. 2008, 28, 237–247. [Google Scholar] [CrossRef]
  10. Brandt, K.; Glemnitz, M. Assessing the regional impacts of increased energy maize cultivation on farmland birds. Environ. Monit. Assess. 2014, 186, 679–697. [Google Scholar] [CrossRef]
  11. Lüker-Jans, N.; Simmering, D.; Otte, A. The impact of biogas plants on regional dynamics of permanent grassland and maize area—The example of Hesse, Germany (2005–2010). Agric. Ecosyst. Environ. 2017, 241, 24–38. [Google Scholar] [CrossRef]
  12. Laggner, B.; Orthen, N.; Osterburg, B.; Röder, N. Ist die zunehmende Biogasproduktion die alleinige Ursache für den Grünlandschwund in Deutschland?—Eine Analyse von georeferenzierten Daten zur Landnutzung. Raumforsch. Raumordn. 2014, 72, 195–209. [Google Scholar] [CrossRef] [Green Version]
  13. Csikos, N.; Schwanebeck, M.; Kuhwald, M.; Szilassi, P.; Duttmann, R. Density of Biogas Power Plants as An Indicator of Bioenergy Generated Transformation of Agricultural Landscapes. Sustainability 2019, 11, 2500. [Google Scholar] [CrossRef] [Green Version]
  14. Link, P.M.; Schleupner, C. Agricultural land use changes in Eiderstedt: Historic developments and future plans. Coastline Rep. 2007, 9, 928–2734. [Google Scholar]
  15. Duttmann, R.; Hassenpflug, W.; Bach, M.; Lungershausen, U.; Frank, J.-H. Winderosion in Schleswig-Holstein; Landesamt für Landwirtschaft, Umwelt und ländliche Räume des Landes Schleswig-Holstein (LLUR): Hamburg, Germany, 2011; ISBN 978-3-937937-56-4. [Google Scholar]
  16. Svoboda, N.; Taube, F.; Kluß, C.; Wienforth, B.; Kage, H.; Ohl, S.; Hartung, E.; Herrmann, A. Crop production for biogas and water protection-A trade-off? Agric. Ecosyst. Environ. 2013, 177, 36–47. [Google Scholar] [CrossRef]
  17. KLU. Biogaserzeugung und-nutzung: Ökologische Leitplanken für die Zukunft Vorschläge der Kommission Landwirtschaft beim Umweltbundesamt (KLU); Dessau-Roßlau, Germany, 2013. Available online: https://www.umweltbundesamt.de/sites/default/files/medien/378/publikationen/biogaserzeugung_und_-nutzung_oekologische_leitplanken_fuer_die_zukunft.pdf (accessed on 11 March 2019).
  18. Gil-Tena, A.; De Cáceres, M.; Ernoult, A.; Butet, A.; Brotons, L.; Burel, F. Agricultural landscape composition as a driver of farmland bird diversity in Brittany (NW France). Agric. Ecosyst. Environ. 2015, 205, 79–89. [Google Scholar] [CrossRef]
  19. Gottschalk, T.K.; Dittrich, R.; Diekötter, T.; Sheridan, P.; Wolters, V.; Ekschmitt, K. Modelling land-use sustainability using farmland birds as indicators. Ecol. Indic. 2010, 10, 15–23. [Google Scholar] [CrossRef]
  20. Moreira, F.; Beja, P.; Morgado, R.; Reino, L.; Gordinho, L.; Delgado, A.; Borralho, R. Effects of field management and landscape context on grassland wintering birds in Southern Portugal. Agric. Ecosyst. Environ. 2005, 109, 59–74. [Google Scholar] [CrossRef]
  21. Guerrero, I.; Morales, M.B.; Oñate, J.J.; Geiger, F.; Berendse, F.; de Snoo, G.; Eggers, S.; Pärt, T.; Bengtsson, J.; Clement, L.W.; et al. Response of ground-nesting farmland birds to agricultural intensification across Europe: Landscape and field level management factors. Biol. Conserv. 2012, 152, 74–80. [Google Scholar] [CrossRef]
  22. Verhulst, J.; Báldi, A.; Kleijn, D. Relationship between land-use intensity and species richness and abundance of birds in Hungary. Agric. Ecosyst. Environ. 2004, 104, 465–473. [Google Scholar] [CrossRef]
  23. Cramp, S. The Birds of the Western Palearctic; Oxford University Press: Oxford, UK, 1988; Volume 5, ISBN 9780198575085. [Google Scholar]
  24. Donald, P.F.; Green, R.E.; Heath, M.F. Agricultural intensification and the collapse of Europe’s farmland bird populations. Proc. R. Soc. B Biol. Sci. 2001, 268, 25–29. [Google Scholar] [CrossRef]
  25. DWD Weather of Schleswig 1981–2010. Available online: https://www.dwd.de/EN/weather/weather_climate_local/schleswigholstein_hamburg/schleswig/_node.html (accessed on 13 October 2019).
  26. FAO. FAO World Reference Base for Soil Resources 2014 International Soil Classification System for Naming Soils and Creating Legends for Soil Maps; Update 2015 World Soil Resources Reports; FAO: Rome, Italy, 2014. [Google Scholar]
  27. Schmidt, C. Entwicklung der Anbauflächen für Silomais seit 1999. Available online: https://tu-dresden.de/bu/architektur/ila/lp/ressourcen/dateien/Forschung/abgeschlossene-forschung/monitoring-kula-kartenserie-arbeitspaket2/karte5?lang=de (accessed on 11 March 2019).
  28. EEA and ETC-TE CLC Update CLC 2000 Project. Technical Guidelines. Final Version. Available online: http://land.copernicus.eu/user-corner/technical-library/techrep89.pdf (accessed on 9 May 2018).
  29. EEA. The Thematic Accuracy of CLC 2000. Assessment Using LUCAS (Land Use/Cover Area Frame Statistical Survey); European Environment Agency: Coppenhagen, Denmark, 2006. [Google Scholar]
  30. Südbeck, P.; Andretzke, H.; Fischer, S.; Gedeon, K.; Schikore, T.; Schröder, K.; Sudfeldt, C. Methodenstandards zur erfassung der Brutvögel Deutschlands; Buch: Berlin, Germany, 2005; ISBN 300015261X. [Google Scholar]
  31. Brendt, R.K.; Koop, B.; Struwe-Juhl, B. Vogelwelt Schleswig-Holsteins, 2nd ed.; Wachholz Verlag: Neumünster, Germany, 2005. [Google Scholar]
  32. Uuemaa, E.; Antrop, M.; Roosaare, J.; Marja, R.; Mander, Ü. Landscape Metrics and Indices: An Overview of Their Use in Landscape Research. Living Rev. Landsc. Res. 2009, 3, 3. [Google Scholar] [CrossRef]
  33. Statistical Service Centre (SSC) Microsoft Excel Add-In Diversity Calculator, Reading University, 2010. Available online: http://www.geo.u-szeged.hu/~toto/Excel_Diversity_add-in/ (accessed on 15 January 2020).
  34. Barton, K. Package MuMIn, version 1.43.15; 2015. Available online: https://cran.r-project.org/web/packages/MuMIn/MuMIn.pdf (accessed on 15 September 2019).
  35. Burnham, K.P.; Anderson, D.R. Model Selection and Multi-Model Inference: A Practical Information—Theoretical Approach; Springer: Berlin/Heidelberg, Germany, 2002; Volume 3, pp. 2–3. [Google Scholar]
  36. Lüdecke, D. ggeffects: Tidy Data Frames of Marginal Effects from Regression Models. J. Open Source Softw. 2018, 3, 772. [Google Scholar] [CrossRef] [Green Version]
  37. Szilassi, P.; Csikos, N.; Galle, R.; Szep, T. Recent and Predicted Changes in Habitat of the Eurasian Skylark Alauda arvensis Based on the Link between the Land Cover and the Field Survey Based Abundance Data. Acta Ornithol. 2019, 54, 59–71. [Google Scholar] [CrossRef]
  38. Hoffmann, J.; Wittchen, U.; Stachow, U.; Berger, G. Moving Window Abundance—A method to characterise the abundance dynamics of farmland birds: The example of Skylark (Alauda arvensis). Ecol. Indic. 2016, 60, 317–328. [Google Scholar] [CrossRef]
  39. Morelli, F. Relative importance of marginal vegetation (shrubs, hedgerows, isolated trees) surrogate of HNV farmland for bird species distribution in Central Italy. Ecol. Eng. 2013, 57, 261–266. [Google Scholar] [CrossRef]
  40. Berg, Å.; Wretenberg, J.; Zmihorski, M.; Hiron, M.; Pärt, T. Linking occurrence and changes in local abundance of farmland bird species to landscape composition and land-use changes. Agric. Ecosyst. Environ. 2015, 204, 1–7. [Google Scholar] [CrossRef] [Green Version]
  41. Redlich, S.; Martin, E.A.; Wende, B.; Steffan-Dewenter, I. Landscape heterogeneity rather than crop diversity mediates bird diversity in agricultural landscapes. PLoS ONE 2018, 13, e0200438. [Google Scholar] [CrossRef] [Green Version]
  42. Praus, L.; Weidinger, K. Breeding Biology of Skylarks Alauda arvensis in Maize and Other Crop Fields. Acta Ornithol. 2015, 50, 59–68. [Google Scholar] [CrossRef]
  43. Hoffmann, J.; Wittchen, U.; Berger, G.; Stachow, U. Moving window growth—A method to characterize the dynamic growth of crops in the context of bird abundance dynamics with the example of Skylark (Alauda arvensis). Ecol. Evol. 2018, 8, 8880–8893. [Google Scholar] [CrossRef] [Green Version]
  44. Morris, A.J.; Holland, J.M.; Smith, B.; Jones, N.E. Sustainable Arable Farming For an Improved Environment (SAFFIE): Managing winter wheat sward structure for Skylarks Alauda arvensis. IBIS 2004, 146, 155–162. [Google Scholar] [CrossRef]
  45. Chamberlain, D.E.; Wilson, A.M.; Browne, S.J.; Vickery, J.A. Effects of habitat type and management on the abundance of skylarks in the breeding season. J. Appl. Ecol. 1999, 36, 856–870. [Google Scholar] [CrossRef]
  46. Blaschke, T.; Biberacher, M.; Gadocha, S.; Schardinger, I. “Energy landscapes”: Meeting energy demands andhuman aspirations. Biomass Bioenergy 2013, 55, 3–16. [Google Scholar] [CrossRef] [PubMed] [Green Version]
  47. Piha, M.; Pakkala, T.; Tiainen, J. Habitat preferences of the Skylark Alauda arvensis in southern Finland. Ornis Fenn. 2003, 80, 97–110. [Google Scholar]
  48. Dietzen, C.; Edwards, P.J.; Wolf, C.; Ludwigs, J.-D.; Luttik, R. Focal species of birds in European crops for higher tier pesticide risk assessment. Integr. Environ. Assess. Manag. 2014, 10, 247–259. [Google Scholar] [CrossRef]
  49. Kragten, S.; Trimbos, K.B.; de Snoo, G.R. Breeding skylarks (Alauda arvensis) on organic and conventional arable farms in The Netherlands. Agric. Ecosyst. Environ. 2008, 126, 163–167. [Google Scholar] [CrossRef]
  50. Bossard, M.; Feranec, J.; Otahel, J. CORINE Land Cover Technical Guide—Addendum 2000 Part I State-of-Play Production Methods of the CORINE Land Cover Database; European Environment Agency: Coppenhagen, Denmark, 2000. [Google Scholar]
  51. Cole, B.; Smith, G.; Balzter, H. Acceleration and fragmentation of CORINE land cover changes in the United Kingdom from 2006–2012 detected by Copernicus IMAGE2012 satellite data. Int. J. Appl. Earth Obs. Geoinf. 2018, 73, 107–122. [Google Scholar] [CrossRef]
  52. Kosztra, B.; Büttner, G.; Hazeu, G.; Arnorld, S. Updated CLC Illustrated Nomenclature Guidelines; European Environment Agency: Coppenhagen, Denmark, 2019. [Google Scholar]
  53. Statistisches Landesamt, H. Agrarstrukturerhebung 2016 Methoden und Vorbemerkungen; 2016., Wiesbaden, Gemany. Available online: https://www.destatis.de/GPStatistik/servlets/MCRFileNodeServlet/HEHeft_derivate_00006795/CIV9_13_3j16_a.pdf;jsessionid=0EF69FB253A89C34CED45195E4AD855C (accessed on 20 November 2019).
Figure 1. Proportions of the typical energy crop (silage maize) in the settlements of Schleswig-Holstein, based on Csikos et al. (2019) [13].
Sustainability 12 00664 g001
Figure 2. Density of Eurasian skylark populations in Schleswig-Holstein. Data source: Ornithologische Arbeitsgemeinschaft für Schleswig-Holstein, 2009.
Sustainability 12 00664 g002
Figure 3. Predicted marginal effects between the skylark individuals / km2 and different crop types: (A) Pasture area %; (B) Permanent crops area %; (C) Silage maize area %; (D) Potato area %; (E) Wheat area %; (F) Winter rape area % The confidence intervals (95%) of the prediction are shown between the dotted lines.
Sustainability 12 00664 g003
Figure 4. Predicted marginal effects of SDI on the population data of Eurasian skylark. The confidence intervals (95%) of the prediction are shown between the dotted lines.
Sustainability 12 00664 g004
Table 1. Proportion of the different land-cover types in Schleswig-Holstein, based on Corine Land Cover (CLC) 2006.
CLC CodeName of the CLC CategoryProportion
11Urban fabric area6.46%
12Industrial, commercial and transport units1.02%
13Mine, dump and construction sites0.38%
14Artificial, non-agricultural vegetated areas0.55%
21Arable land42.62%
23Pastures21.14%
24Heterogeneous agricultural areas11.46%
31Forests10.67%
32Shrub and/or herbaceous vegetation associations0.89%
33Open spaces with little or no vegetation0.30%
41Inland wetlands1.06%
42Coastal wetlands0.29%
51Inland waters3.10%
52Marine water0.13%
Table 2. Proportion of the different crop types from the total agricultural land area in Schleswig-Holstein, based on the German Agricultural Structure Survey (Agrar-Struktur-Erhebung, ASE) 2010 database.
Crop TypesProportion
Silage maize17.64%
Wheat20.68%
Pasture31.53%
Winter rape11.24%
Rye2.05%
Permanent crops0.67%
Potato0.55%
Sugar beet0.75%
Triticale0.64%
Other14.25%
Table 3. Summary table for the CLC categories, land-use types and Shannon Diversity Index (SDI), which shows the generalized linear model (GLM) results after multimodel averaging of the best candidate models, showing the relative importance of each explanatory variable on the skylark abundance based on the estimated parameter values ± the standard deviation.
Land Cover, Land Use, or Landscape Heterogeneity VariablesUnitRelative Importance
(z Value)
Multimodel Estimate ± Standard Deviation
Land Cover
(CLC Types)
Pasturesarea in quadrant100% (5.194)0.0005 ± 0.0001***
Shrub and/or herbaceous vegetation associationsarea in quadrant100% (5.387)0.0024 ± 0.0004***
Coastal wetlandsarea in quadrant100% (4.625)0.0017 ± 0.0004***
Inland wetlandsarea in quadrant100% (3.071)−0.0024 ± 0.0008**
Landscape heterogeneitySDIvalue85% (2.104)−0.2371 ± 0.1127*
Land Use
(ASE crop types)
Pasturearea in quadrant100% (4.322)0.0005 ± 0.0001***
Permanent cropsarea in quadrant100% (7.254)−0.0061 ± 0.0008***
Silage maizearea in quadrant100% (2.185)−0.0004 ± 0.0002*
Potatoarea in quadrant89% (1.991)0.0065 ± 0.0033*
Wheatarea in quadrant87% (2.239)0.0005 ± 0.0002*
Rapearea in quadrant87% (2.359)−0.0010 ± 0.0004*
Crop heterogeneitySDIvalue100% (2.073)−0.3940 ± 0.1415*
Significance levels: *: <0.05, **: <0.01, ***: <0.001.

