Article

Spatio-Temporal Dynamics of Feed Grain Demand of Dairy Cows in China

1
School of Geography and Tourism, Shaanxi Normal University, Xi’an 710119, China
2
Institute of Geographic Sciences and Natural Resources Research, Chinese Academy of Sciences, Beijing 100101, China
3
University of Chinese Academy of Sciences, Beijing 100049, China
*
Authors to whom correspondence should be addressed.
Sustainability 2020, 12(2), 663; https://doi.org/10.3390/su12020663
Submission received: 2 October 2019 / Revised: 10 January 2020 / Accepted: 12 January 2020 / Published: 16 January 2020
(This article belongs to the Section Sustainable Agriculture)

Abstract

:
As the income of urban and rural residents has increased in recent decades in China, dairy products have become an important part of the Chinese diet. Therefore, keeping up with the growing demand for feed grain for dairy cows is a critical issue of feed grain security. Utilizing traditional statistical and spatial statistical methods, this study analyzes the spatio-temporal dynamics of dairy cow feed grain (DCFG) demand on the provincial, regional, and national levels across China from 1990 to 2016. Additionally, this paper explores the impacts of various factors on the spatio-temporal dynamics of DCFG demand using the Geo-Detector method. The results demonstrate that: (1) the temporal dynamics of DCFG demand can be divided into three stages of slow growth, rapid growth, and high-level stability, and the relative level of DCFG demand in the whole animal husbandry tends to decline; (2) at the regional and national levels, the spatial concentration of high DCFG demand has intensified; in particular, North China was the region where the largest demand for DCFG was localized and was increasing at the highest rate; (3) based on the hot spot analysis of provincial DCFG demand, the high and low demand provinces of DCFG have sharp characteristic contrast from north to south China; (4) the spatio-temporal dynamics of DCFG demand in China were essentially co-affected by the four groups of factors (e.g., resource endowment, feeding scale, feeding technology, and market environment), of which resource endowment and feeding scale were the dominant factors. Therefore, in the future, dairy cow feeding in China should promote grain-saving feeding technology, improve the utilization of forage, expand large-scale feeding, and create a good market environment to ensure the reasonable development and sustainability of DCFG demand.

1. Introduction

A global consensus has been reached that livestock feed demand is a major component of the global demand for grain in the 21st century [1,2]. Global food supply poses a substantial challenge to governments as populations are being lifted out of poverty, resulting in an increased appetite for meat and dairy products [3]. Just like the rest of the world, the rapid development of China’s urbanization and increase in per capita income of urban and rural residents has led to significant changes in national dietary structure [4]. The changes are mainly manifested in the form of a decrease in the proportion of grain consumption and a relative increase in meat, egg, and milk consumption [4]. However, China’s per capita share of meat, egg, and milk consumption is still far less when compared with developed countries such as the United States of America, Australia, etc., and it is predicted that the population’s appetite for meat, egg, and milk products will push this growth even higher [5]. Thus, the increasing demand for livestock products has led to an increasing demand for feed grains [6,7]. It is estimated that the feed grain demand in 2020 and 2030 will account for 50% and 55%, respectively, of the total Chinese grain demand [5], and therefore, feed grain supply will be a major challenge to China’s grain security [8,9].
In 2000, the Chinese government launched the “School Milk Program” to improve the nutritional status of elementary and junior middle school students. In spring of 2017, approximately 21 million students benefited from this program, and the nationwide dairy average supply of daily drinking milk for these students reached 16.65 million servings [10]. There is a close relationship between residents’ per capita income and milk consumption. Statistically, for every 1% increase in income, urban residents’ and rural residents’ milk consumption increases by 67% and 27% respectively [11]. In 2017, the per capita milk consumption of urban and rural residents was 16.48 kg and 6.90 kg, respectively, which represents an increase of approximately 260% and 527% when compared to the amount of milk consumed in 1990 [12]. Dairy milk plays an increasingly important role in Chinese people’s diet [13]. In 1990, China had 2.69 million dairy cows, and by 2016, this number had surged to 10.37 million [14]. Compared with other countries, the number of China’s dairy cows were sustained at a relatively high level, comparatively, only India (48 million) and Brazil (21 million) had more dairy cows, while the United States (9.32 million) and Russia (8.25 million) had fewer dairy cows than China in 2016 [15]. In 2017, the total population of China was approximately 1.39 billion, while India, Brazil, the United States, and Russia had a population of 1.34 billion, 209 million, 326 million, and 145 million respectively. Thus, comparatively, the per capita number of dairy cows is still at a low level in China [12]. All of the above have stimulated the rapid development of China’s dairy cow husbandry.
Therefore, it is of great importance to the future of China to analyze the changing demand in dairy cow feed grain (hereinafter the DCFG). This study utilizes traditional and spatial statistical methods to analyze the spatio-temporal dynamics of DCFG demand at multiple spatial levels (provincial, regional, and national) from 1990 to 2016. Moreover, this study employs the GeoDetector method to explore the relative impact of various factors on the spatio-temporal dynamics of DCFG demand. This paper aims to reveal the spatio-temporal differentiation of DCFG demand and to provide reference for China’s food security policy-making.

2. Literature Review

According to the research content, the concept of feed grain is defined to include the grain directly used for feeding and the grain consumed for processing feed, specifically to include corn, soybean, sorghum, millet, barley, oats, and other minor grains [16,17,18]. The concept of concentrate feed is defined to include grain used for feeding, grain processing by-products used for feeding, additives, etc. [18,19]. Previous research on feed grain security mainly focused on the supply and demand, domestic circulation, international trade, etc.

2.1. Study on the Supply and Demand of Feed Grain

Supply and demand of feed grain has attracted significant attention both domestically and internationally [16], and most research focuses on either supply [20,21] or demand [17] or the supply and demand balance [4,22,23]. However, due to the differences in feed grain accounting methods and feed grain conversion ratios, there are great ambiguities amongst the research findings [17]. Among the various accounting methods, the demand method was most widely used, which simply involved multiplying the feed grain conversion ratio by the animal products [24,25,26]. This method is also employed by the US Department of Agriculture (USDA), the International Food Policy Research Institute (IFPRI), and the Food and Agriculture Organization (FAO) of the United Nations [27]. Extensive research has been done on the topic of supply and demand of feed grain in China. Many scholars believe that both sectors of supply and demand of feed grain are rising, yet the feed grain supply is lagging behind the increase in demand [4,7,22,23]. On the other hand, some scholars strongly believe that the demand of feed grain will decrease with the change in population structure [28]. More attention has been paid to the prediction of feed grain demand [29,30,31,32,33]. Despite the differences in prediction methods and results, many researchers agree that China’s feed grain demand will continue to rise in the next decades [32,33], thus demonstrating the importance of research in China’s feed grain demand.

2.2. Study on the Domestic Circulation and International Trade of Feed Grain

In the research of feed grain circulation, the main focus was on circulation path [34,35,36] and circulation system [37,38]. The basic pattern of circulation path is the transportation of feed grain from northern China to southern China [4]. In terms of specific circulation strategy for the feed grain, the researchers simulated the optimal circulation quantities and routes in the different regions in China with the end goal of minimizing the transportation cost [34]. The results indicated generally long transportation distance for regional distribution of feed grain in China [34]. The circulation system stresses the need to coordinate the cooperative relationship among the main bodies of the raw grain supply, as well as the relationship between the feed grain production and marketing areas [37,38]. On the other hand, studies on international trade of feed grain tended to focus on its evaluation of import and export [39,40,41], the driving forces of import and export [42], and the trade path [43], and researchers have found that international trade was an important solution to the problem encountered by satisfying both the supply and demand of domestic feed grain market. Additionally, researchers demonstrated that the main reason for the surge in feed grain imports was evident in the price difference between the domestic and foreign markets [42].

2.3. Research Review

Consequently, an important characteristic of feed grain research is to integrate feed grain into the overall structure of grain [32,44,45]. Furthermore, most research conducted on the topic of feed grain for animal husbandry as a whole is completed with less attention paid to different types of livestock and poultry, although some studies have been done for pig feed grain due to its huge demand [19,33,46]. Currently, only a few scholars have analyzed the DCFG demand [31,45,47], and most existing research has only regarded the demand accounting of DCFG as a part of the demand accounting of animal husbandry. Thus, it was easy to ignore the proportion of lactating cows when calculating the demand of DCFG based on the dairy milk yield. Additionally, existing research on feed grain has been focused either only at a certain time point or only at the national level. Time-series analysis at different spatial scales is still scant. What is the temporal trend of feed grain demand of domestic dairy cows in China? How has the DCFG demand changed at various spatial scales? Which factors have determined such spatio-temporal dynamics? The above issues about the DCFG demand in China deserve further discussion in order to better understand this immediate challenge of feed grain security.

3. Data and Methods

3.1. Data

3.1.1. Data Required for Feed Grain Demand Accounting

Data on dairy milk yield at the provincial level were collected from China Agriculture Statistical Report and China Agriculture Yearbook from 1990 to 2016. Due to changes in statistical standards, data on the average dairy milk yield and feed grain consumption per cow in dairy farmers and state-owned collectives between 1990 and 2003 were obtained from the 1991–2004 National Assembly of Cost and Benefit Analysis of Agricultural Products (hereinafter the National Assembly). The same two types of data raised in free-ranging, small-, medium-, or large-scale farms from 2004 to 2016 were derived from the 2005–2017 National Assembly. Data about forage corn and soybean meal consumption were obtained from the Wind Economic Database (https://www.wind.com.cn/en/edb.html).

3.1.2. Data Required for Influencing Factors

In the analysis of influencing factors, corn yield and pasture area were collected from the 1991–2017 China Statistical Yearbook. Soybean yield was obtained from the 1991–2017 China Agriculture Yearbook. Data related to the proportion of large-scale farms/households with more than 100 dairy cows were from the 2001–2017 China Animal Husbandry and Veterinary Yearbook. Data related to the proportion of mechanized milking in large-scale dairy farms, the average daily milk yield per cow, per capita milk consumption of urban residents, and the average price of fresh milk were collected from the 2006–2017 China Dairy Yearbook and 2017 China Statistical Yearbook.

3.1.3. Map Data

GIS shape files of China’s provincial administrative division were downloaded from the National Catalogue Service for Geographic Information [48]. In this study, the study area only includes the 31 provincial-level administrative units in mainland China. In addition, Chongqing was promoted to a centrally-administrated municipality in 1997. Data of Chongqing were included in those of the Sichuan Province before 1997. Therefore, Chongqing was not analyzed as a provincial unit from 1990 to 1996.

3.2. Feed Grain Conversion Ratio

Most existing research adopted the national average of feed grain conversion ratio for calculating the DCFG demand, which is not precise enough for either temporal or spatial levels [7,17]. Feed grain conversion ratio is the ratio measuring the efficiency that the bodies of livestock convert feed grain into the desired output [24,26]. For dairy cows, the output is dairy milk. Specifically, in this study, feed grain conversion ratio represents the amount of feed grain consumed by dairy cows per producing 1 kilogram of milk. The National Assembly did not report dairy milk yield and feed grain consumption data for all the provincial units during the 1990–2016 period. Therefore, for the provinces with statistical data tallied in the National Assembly, the feed grain conversion ratio was based on the average value of the conversion ratio of the dairy farmers and the state-owned collectives from 1990 to 2003. Also, the feed grain conversion ratio was based on the average value of the conversion ratio of free-range and medium-scale farms from 2004 to 2016. For provinces with missing values in the National Assembly, spatial interpolation based on neighboring provinces or temporal averaging was done to replace the missing values.
After the preprocessing of data, feed grain conversion ratio in the 31 provincial units from 1990 to 2016 was obtained. Table 1 shows the national average of feed grain conversion ratio in China from 1990 to 2016. Table 2 shows the values range and mean value of feed grain conversion ratio for each province.

3.3. Methods

3.3.1. Feed Grain Demand Estimation

Among the methods of feed grain demand estimation, the following method in Formula (1) is the most widely used in the existing research, because of data availability and its simple calculation [24,25,26].
F G D p = P m × γ m × 1 k ,   γ m = f m w m
where F G D p represents the DCFG demand; P m and γ m are dairy milk yield and feed grain conversion ratio, respectively; k is the proportion of lactating cows in all the dairy cows ( k is about 48%); f m and w m represent the amount of feed grain and dairy milk yield per dairy cow, respectively. This study added the proportion of lactating cows in the calculation of DCFG. During 2016–2017, the project’s research team conducted studies on more than 10 large modern ranch enterprises in Beijing, Inner Mongolia, Shandong, and Jiangsu. According to the survey results, it was determined that the proportion of lactating cows in all the dairy cows is about 48%.

3.3.2. Standard Deviational Ellipse

The standard deviation ellipse (SDE) method was proposed by Lefever in 1926 [49]. It is a common method to study the spatial distribution of geographical elements. Based on the method of SDE, the central trend, concentration degree, and direction trend of geographical elements distribution can be studied. Here, the SDE is used to analyze the spatial dynamics of DCFG demand. The long and short axes of SDE represent the main and sub-trend distribution directions of the features. The orientation represents the rotation of the long axis measured clockwise from noon, which also represents the main direction of the feature spread [49]. The formula is as follows:
t a n θ = { ( i = 1 n x ˜ i 2 i = 1 n y ˜ i 2 ) + ( i = 1 n x ˜ i 2 i = 1 n y ˜ i 2 ) 2 + 4 ( i = 1 n x ˜ i y ˜ i ) 2 } / 2 i = 1 n x ˜ i y ˜ i
σ x = i = 1 n ( x ˜ i c o s θ y ˜ i s i n θ ) 2 n ,   σ y = i = 1 n ( x ˜ i s i n θ y ˜ i c o s θ ) 2 n
where θ is the elliptic deflection angle, x ˜ i and y ˜ i are the deviation values of the element i coordinates x, y and the mean center of the element arithmetic, respectively; σx and σy represent the length of the ellipse X and Y axes, respectively; and n is the total number of features. This method is implemented by ArcGIS 10.2 software.

3.3.3. Hot Spot Analysis

Getis and Ord (1981) proposed the local statistics Getis-Ord Gi* [50], which is implemented by ArcGIS 10.2 software. The hot spot analysis calculates the Getis-Ord Gi* for each feature in a dataset. The resultant Z-score and p-value tell where features with either high or low values spatially cluster. The hot spot analysis is applied to investigate the changing spatial pattern of DCFG demand at the provincial level. The Getis-Ord local statistic Gi* is given as
G i * = j = 1 n w i , j x j X ¯ j = 1 n w i , j S [ n j = 1 n w i , j 2 ( j = 1 n w i , j ) 2 ] n 1
X ¯ = j = 1 n x j n ,   S = j = 1 n x j 2 n ( X ¯ ) 2
where x j is the attribute value of element j ; w i , j is the spatial weight between elements i and j ; and n is the total number of elements. The higher a positive Z-score of significance, the closer the clustering of high values (hot spots) will be; the lower a negative Z-score of significance, the closer the clustering of low values (cold spots). Based on Jenks natural breaks classification, the provincial DCFG demand was divided into five categories: hot spots, sub-hot spots, intermediate spots, sub-cold spots, and cold spots.

3.3.4. The Geo-Detector Method

Spatial differentiation is essentially co-affected by the various natural and socioeconomic factors. The Geo-Detector method is based on the assumption that if a factor plays an important role in the DCFG demand, the spatial distribution of the demand and the factor should present similar patterns. Geo-Detector was initially proposed by Wang et al. (2010) to detect disease risks and their influencing factors [51,52]. It has been widely applied in social, economic, and natural science studies [53,54]. Based on the variance analysis, Geo-Detector uses the power of determinant to measure the impact of a factor, which is as follows.
q D , F = 1 1 n σ F 2 i = 1 m n D , i σ D , i 2
where q D , F is the power of determinant of factor D ; m is the number of sub-regions; n is the number of spatial units in the whole region; n D , i is the number of spatial units in the sub-region; σ F 2 is the variance of dependent variables in the whole region; σ D , i 2 is the variance of dependent variables in the sub-region. Assuming σ D , i 2 0 , the model is established, and the value range of q D , F is [0,1]. When q D , F = 0 , factor D is unrelated to the dependent variable at all. When q D , F = 1 , the dependent variable is completely determined by factor D . The higher the value of q D , F , the higher the “power of determinant” of factor D on the dependent variable. This method is implemented by GeoDetector software.

4. Spatio-Temporal Dynamics of DCFG Demand in China

Feed grain conversion ratio is an important parameter to calculate the DCFG demand. The national average fluctuated dramatically in the 1990s but decreased gradually since 2000, which reflected the improved feed efficiency (Table 1). The mean value at the provincial level was generally lower in the northern China and higher in the southern China, indicating that feed efficiencies were noticeably higher in northern China than southern China. (Table 2).

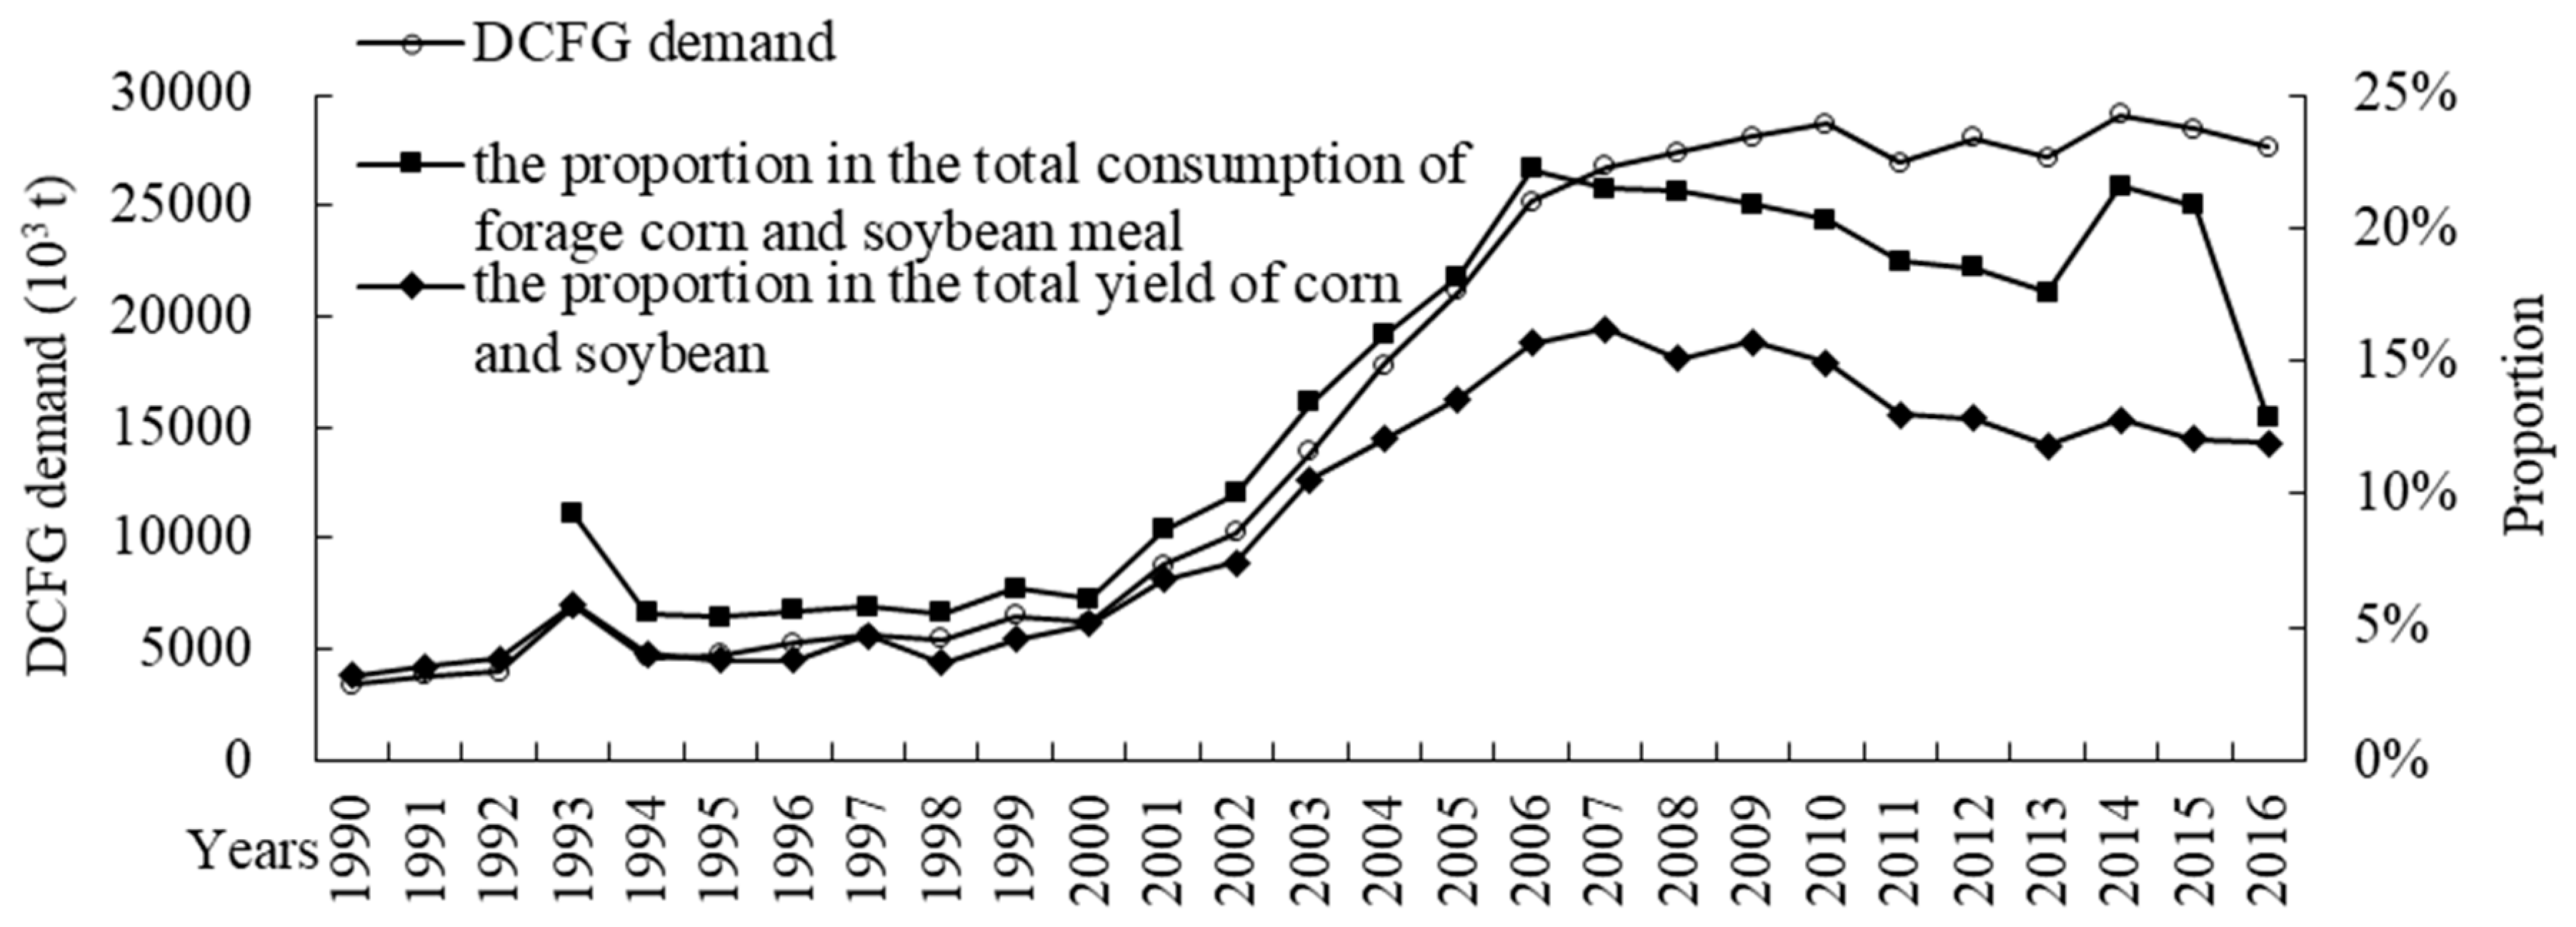
4.1. Temporal Dynamics of DCFG Demand at the National Level

China’s DCFG demand showed significant growth from 1990 to 2016. On the other hand, DCFG demand, as a proportion in the total consumption of forage corn and soybean meal, and in the total yield of corn and soybean, has declined since 2007 after a rapid growth in the early and mid-2000s (Figure 1).
As shown in Figure 1, the temporal dynamics of DCFG demand can be divided into three stages of slow growth, rapid growth, and high-level stability (slow growth from 1990 to 2000, rapid growth from 2001 to 2006, and high-level stability from 2007 to 2016). The absolute DCFG demand fluctuated slightly in the third stage, with an average demand of about 27,839.20 × 103 ton. The proportion of DCFG demand in the total consumption of forage corn and soybean meal, and in the total corn and soybean yields, generally declined in the third stage, with the former dropping from 21.46% in 2007 to 12.83% in 2016 with a sharp decline from 2015 to 2016, and the latter decreasing relatively steadily from 16.21% in 2007 to 11.89% in 2016. The Chinese Milk Scandal in 2008 significantly reduced the export of dairy products and increased the import of dairy products, which had a negative impact on China’s dairy cow feeding [55]. According to the statistics, China’s dairy milk yields have also changed from rapid growth to reach a stable level since 2007 [12]. In short, these indicate that the DCFG demand tends to develop steadily in China, and its relative level in the whole animal husbandry tends to decline. This is helpful for China’s dairy cow husbandry to turn to “grain-saving” development.

4.2. Spatio-Temporal Changes in DCFG at the Regional Level

This study also analyzes the spatio-temporal dynamics of DCFG demand at the regional level. We divide the 31 provincial units into seven regions: Northeast China (Heilongjiang, Jilin, and Liaoning), North China (Beijing, Tianjin, Shanxi, Hebei, and Inner Mongolia), Central China (Henan, Hubei Province, and Hunan), East China (Shanghai, Jiangsu, Zhejiang, Anhui, Jiangxi, Shandong, and Fujian), South China (Guangdong, Guangxi, and Hainan), Southwest China (Sichuan, Guizhou, Yunnan, Chongqing, and Tibet), and Northwest China (Shaanxi, Gansu, Qinghai, Ningxia, and Xinjiang).
From 1990 to 2016, the DCFG demand in the seven regions all showed a growing trend with an accelerated growth rate after 2000. The highest growth rate was in North China and the lowest in South China (Figure 2). The DCFG demand in North China was the largest and the fastest growing, from 767.34 × 10³ tons in 1990 to 10736.16 × 103 tons in 2016, accounting for 35% of the national total. This was mainly resulted from the universality of dairy cow feeding in Inner Mongolia and Hebei. North China is the dominant region impelling the overall change of DCFG demand across China. The second-highest demand and growth is in Northeast China, which increased from 1048.83 × 103 tons in 1990 to 5174.20 × 103 tons in 2016. However, the difference between North China and Northeast China became gradually greater since 2003. In addition, North China and Northeast China are also the major grain production bases of corn and soybean [56], which implies that dairy cow feeding in China still relies on raw grain. Compared with other regions, South China presents the smallest DCFG demand and the slowest growth rate, from 53.34 × 10³ tons in 1990 to 162.51 × 10³ tons in 2016, which may be related to the small size of dairy cow feeding and the poor natural endowment of feed grain in this region [56,57]. In short, these show that the regional characteristics of China’s DCFG demand are significant, and the high demand is in North China.

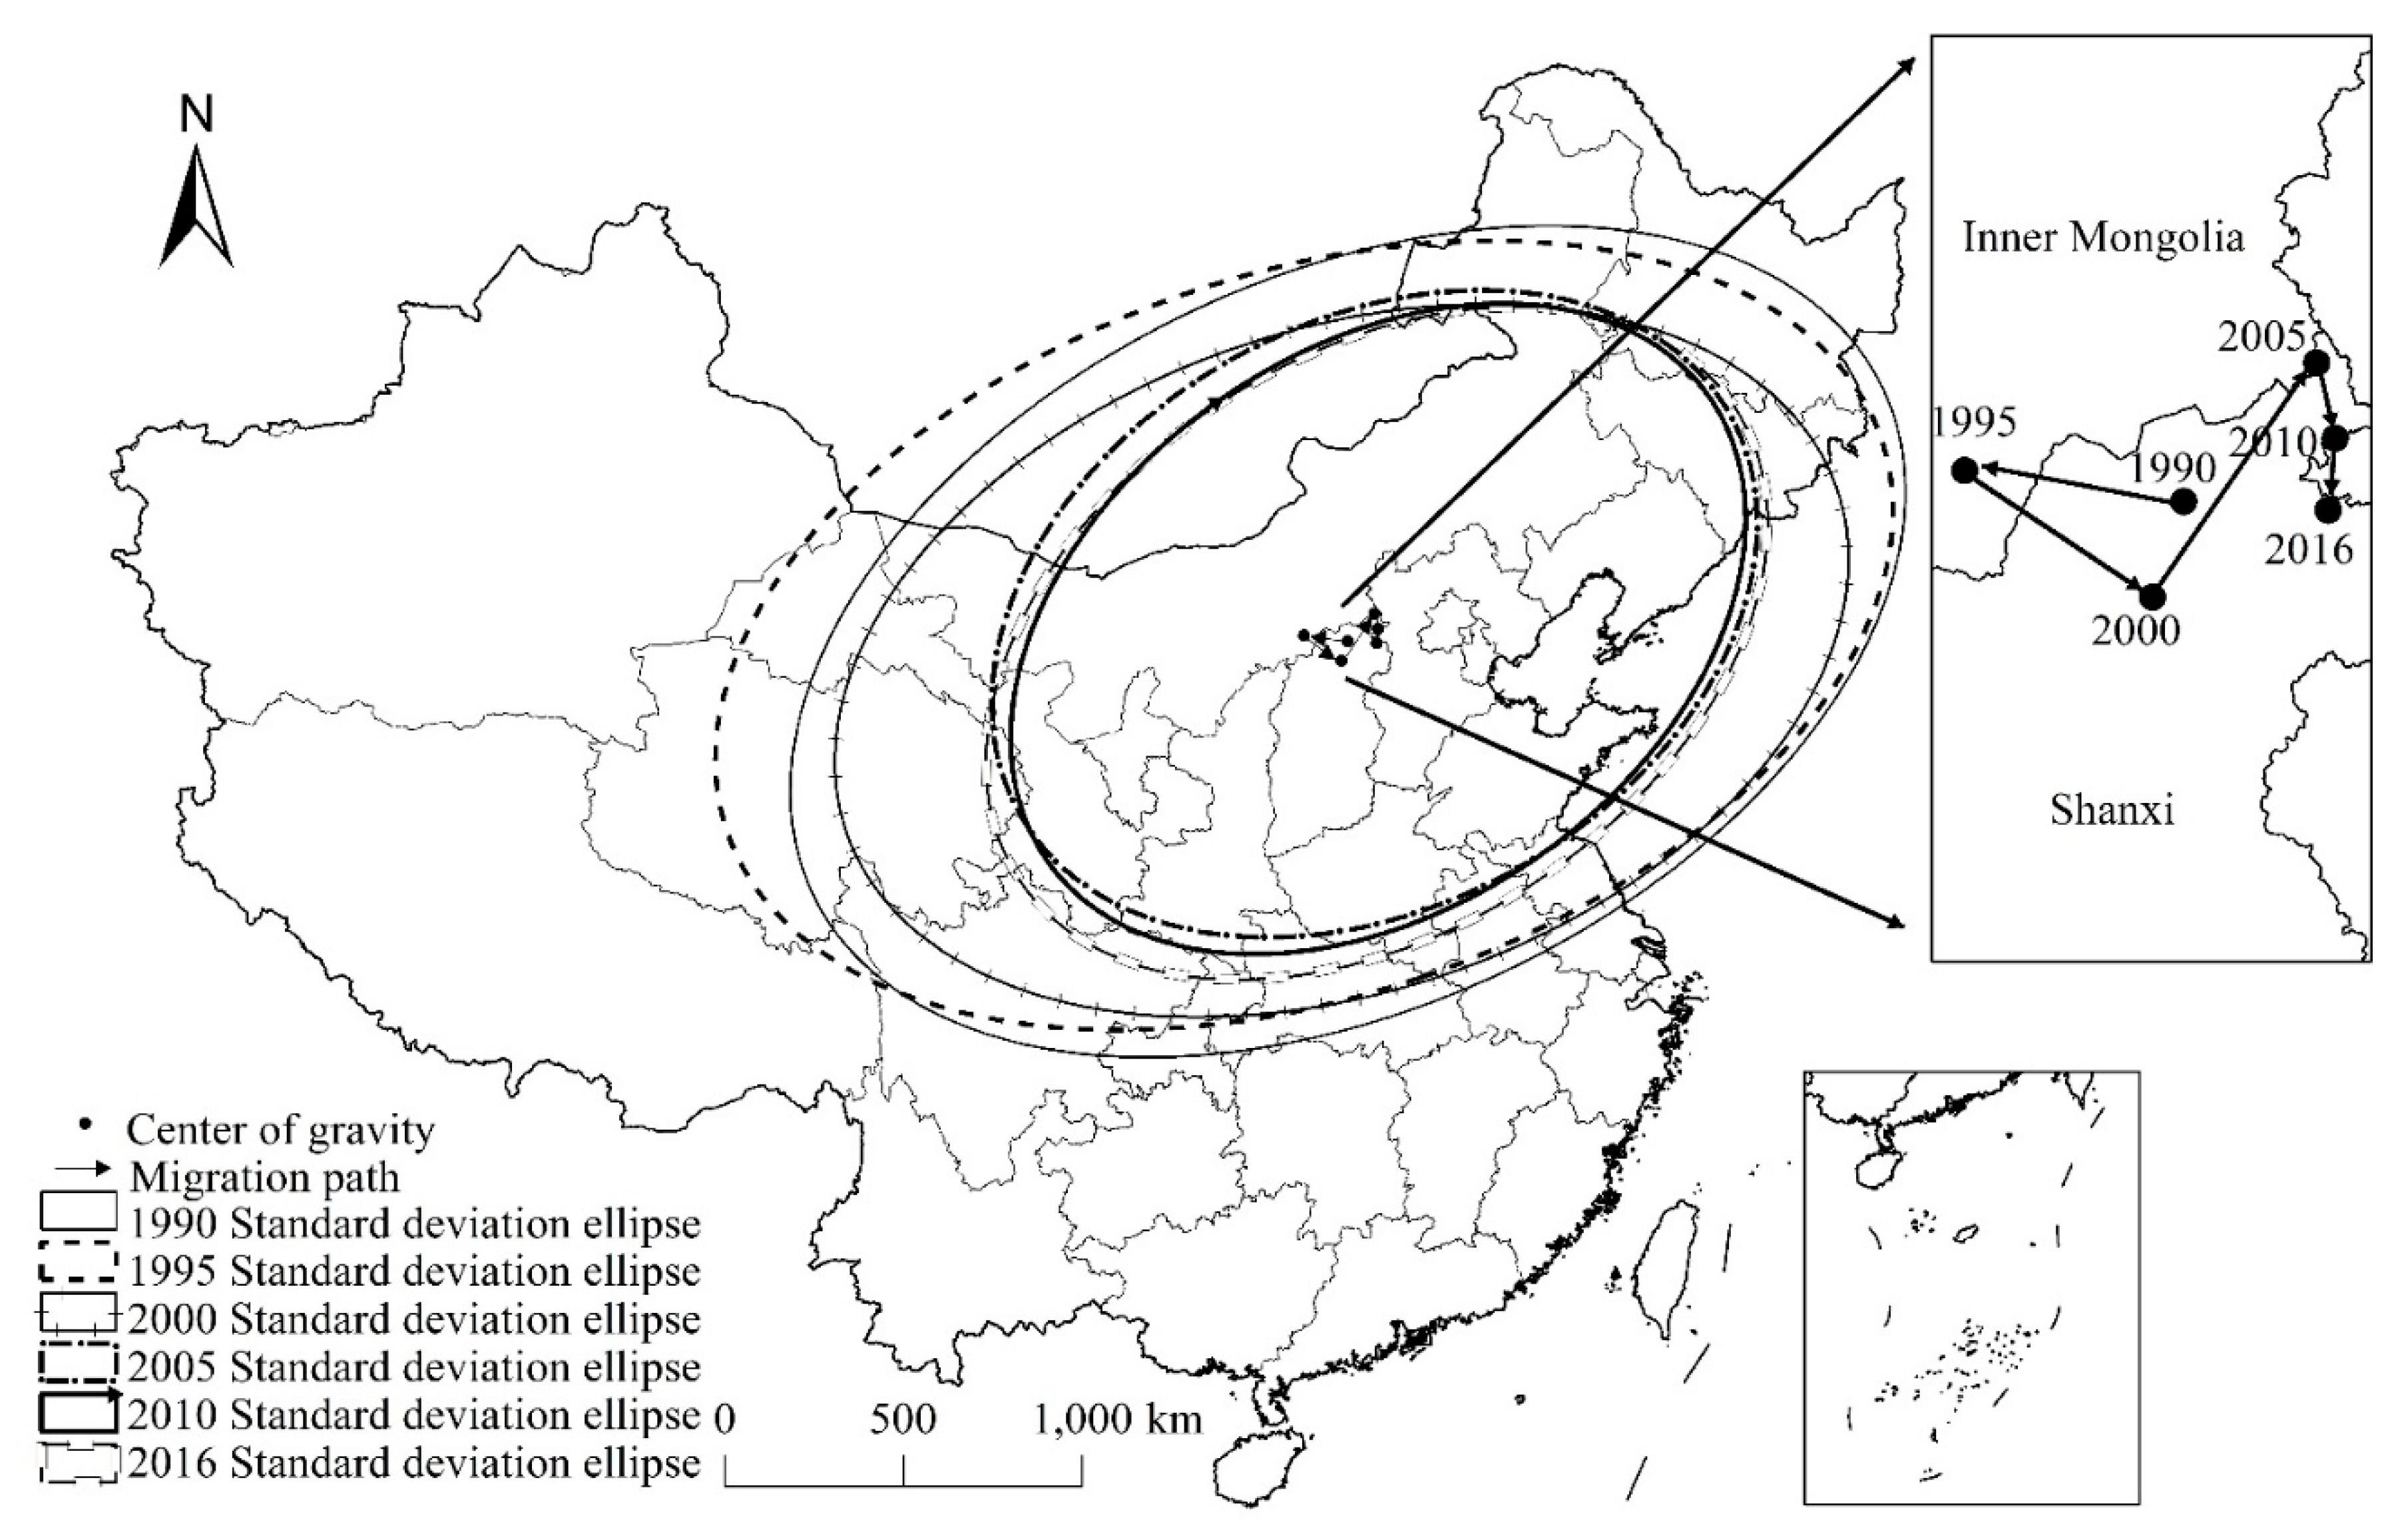
4.3. Changing Spatial Distribution of DCFG Demand

Based on the data of 31 provincial units in the six years of 1990, 1995, 2000, 2005, 2010, and 2016, multiple standard deviation ellipses (SDEs) are created to analyze how the spatial distribution of DCFG demand has evolved.
The SDEs of DCFG demand in 1990–2016 are mainly distributed within a large area north of the Yangtze River and east of the Qinghai-Tibet Plateau (Figure 3). The majority of this distribution is in northern China. It covers North China and Northeast China, and parts of Northwest China, Southwest China, Central China, and East China. This is consistent with the spatial distribution of major corn and soybean production bases and pastoral land in China. The elliptical area expanded in the 1990–1995 period, shrank during the 1995–2010 period, and rebounded slightly in the 2010–2016 period (Figure 3 and Table 3). The overall trend was the contraction of the spatial distribution, indicating the intensified agglomeration of high DCFG demand in northern China. To a certain extent, this also reflects the gradual concentration of dairy cow feeding areas, which is conducive to the formation of China’s superiority areas of dairy cow feeding, but this will also easily increase the regional supply pressure on feed grain.
Figure 3 shows the major axis of the SDEs is mostly along the northeast-southwest direction. The rotation of the SDEs varies from 54.92° to 71.21° in the six years. The ratio between the major axis and the minor axis is 1.62, 1.69, 1.59, 1.40, 1.45, and 1.49, respectively (the closer the ratio is to one, the weaker the directionality of the SDE [49]). The generally decreasing ratio between the two axes also indicates that the distribution of high DCFG demand tended to shrink and its concentration has been intensified. The high demand area of DCFG in China has the characteristics of spatial agglomeration.
As shown in Figure 3, the center of SDEs has a complex migration pattern from 1990 to 2016. The center is usually found around the border between Shanxi, Hebei, and Inner Mongolia. In addition, the migration pattern of the center can be divided into three stages: a westward migration from 1990 to 1995, an eastward migration in the 1995–2005 period, and a slightly southward migration from 2005 to 2016. Table 3 shows that the migration distance between different locations of the center increased from 1990 to 2005 and decreased since 2005. The longest migration distance occurred along the east direction. From 1990 to 2016, the overall trend of the center had moved to the east, but the migration distance from the center was relatively small, with spatial stability, indicating that northern China maintained the core location of high demand for DCFG.

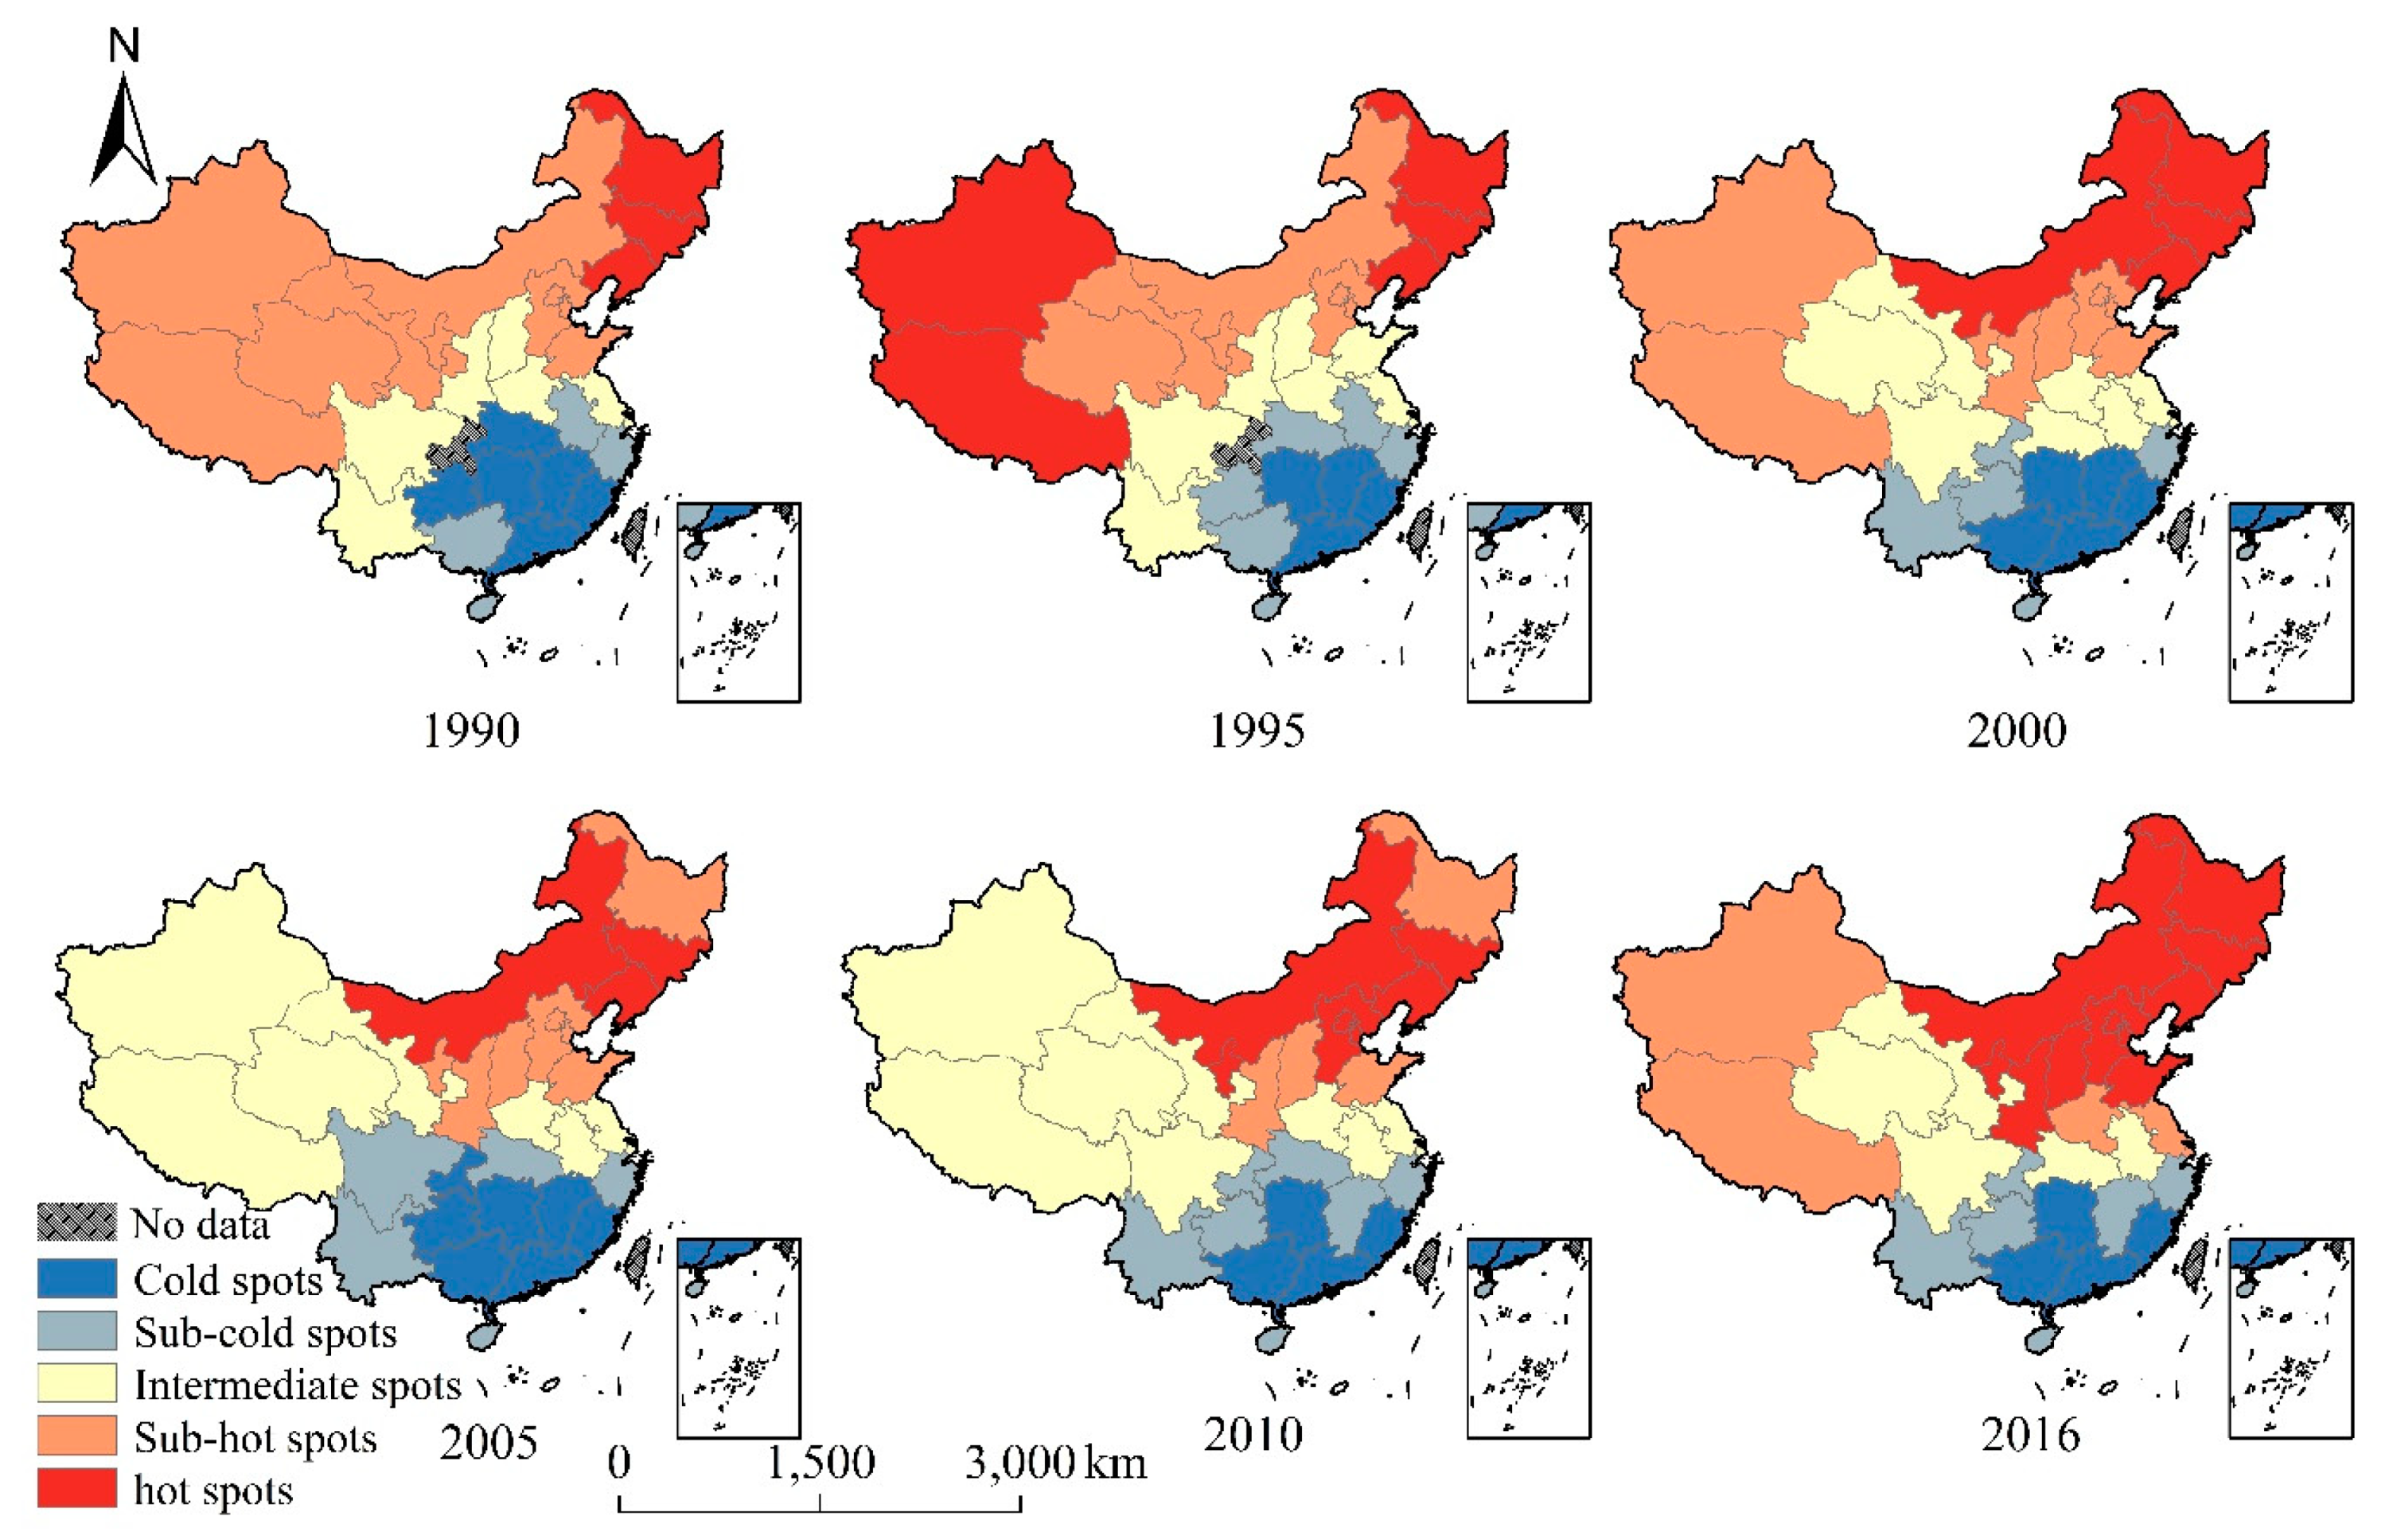
4.4. Spatio-Temporal Dynamics of DCFG Demand at the Provincial Level

Hot spots analyses in different years have revealed the dynamic concentration pattern of high values (hot spots) and low values (cold spots) of provincial DCFG demand. In 1990, the hot spots were concentrated in Northeast China (Heilongjiang, Jilin, and Liaoning). In 1995, Xinjiang and Tibet in Northwest China were also hot spots in addition to the original three northeastern provinces. In 2000 and 2005, hot spots were mostly concentrated in Northeast China and Inner Mongolia however Heilongjiang was absent in 2005. In 2010, hot spots expanded southward and included Beijing, Tianjin, and Hebei. In 2016, the expansion of hotspots was more obvious, with expansion in both north and south directions. Eventually, a cluster of hot spots consisting of 11 provinces formed in northern China. According to the spatio-temporal dynamics of hot spots from 1990 to 2016, the spatial distribution with high DCFG demand in China tended to gradually become more stable with increases in its concentration.
From 1990 to 2016, cold spots of provincial DCFG demand have been shrinking southward. Figure 4 shows that Hunan was always the cold spot. In 1990, the cold spots consisted of six provinces, including Jiangxi, Hubei, Hunan, Fujian, and Guangdong and Guizhou. In 1995, Hubei and Guizhou were no longer hot spots (four provinces retained). In 2005, however, Guangxi became a new cold spot (five provinces in total). In 2005, Guizhou and Chongqing became cold spots (a total of seven provinces). In 2010 and 2016, cold spots were the same four provinces including Hunan, Fujian, Guangdong, and Guangxi. From 1990 to 2016, the spatio-temporal dynamics of the cold spots indicates that the low demand areas for DCFG in China also tends to be stable in spatial distribution, and localizes to the south.
At the provincial level, the north-south spatial differences in provincial DCFG demand were significant. The concentrations of high and low values formed a “Hot North and Cold South” pattern. The spatial pattern of high demand and low demand for DCFG in China has fundamentally stabilized.

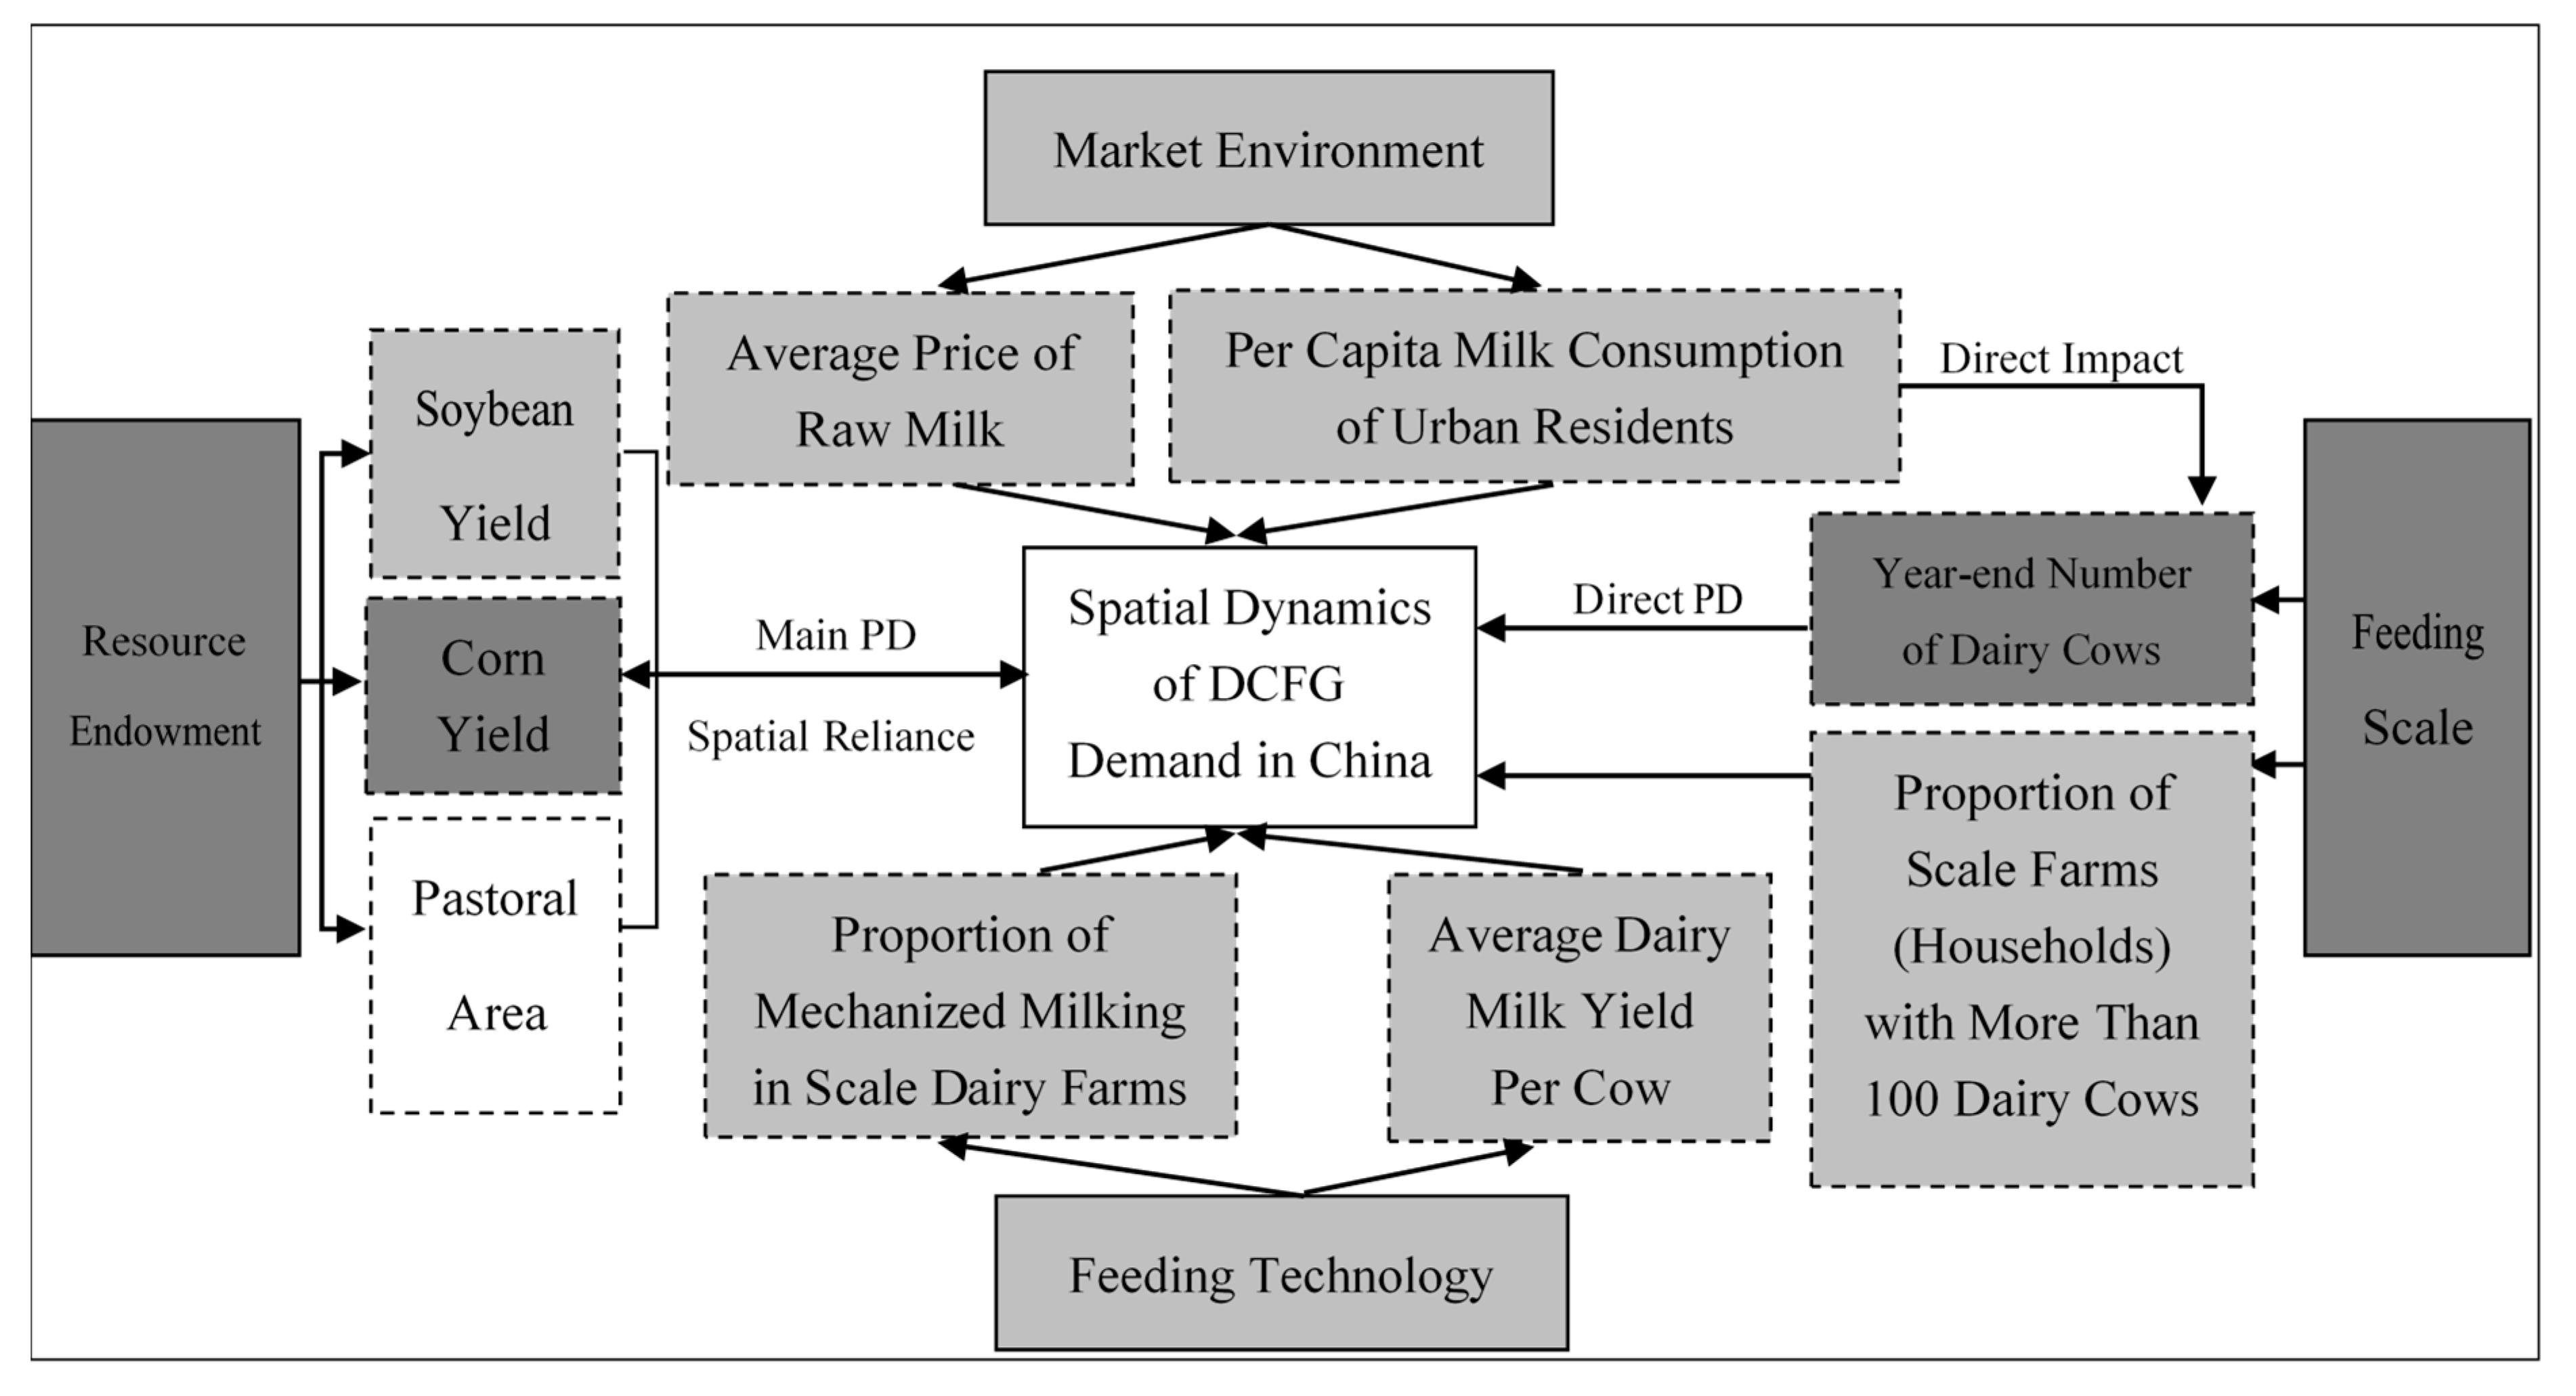
5. Results from the Geo-Detector Analysis

The Geo-Detector method aims to identify the degree of impact by the different factors on the spatial distribution pattern of DCFG demand. Based on previous studies [7,8,25,42] and the available data, this study focused on four main elements: resource endowment, feeding scale, feeding technology, and market environment. A total of nine individual factors were taken into consideration, which were corn yield (X1), soybean yield (X2), pastoral area (X3), year-end number of dairy cows (X4), the proportion of large-scale farms with more than 100 dairy cows (X5), the proportion of mechanized milking in large-scale dairy farms (X6), the average dairy milk yield per cow (X7), the average price of raw milk (X8), and per capita milk consumption of urban residents (X9). The Geo-Detector method was applied to explore the variation in q-value (power of determinant) of different factors on the spatio-temporal dynamics of DCFG demand (Table 4). The nine factors were discretized into four levels using the quantile method. All variables had a significance value of 0.00 and passed the test with a significance level of 0.05. In Figure 5, color depth is used to indicate the degree of influence; that is, the darker the color, the greater the influence.

5.1. Resource Endowment

DCFG is mainly composed of energy feeds (e.g., corn) and protein feeds (e.g., soybean); it has been estimated that forage corn accounted for 59.8% of the feed grain [4]. Although soybean accounts for a smaller proportion in feed grains, it is an important source of protein [58,59]. Forages and roughage are also important feed ingredients and they affect the quality of milk [60]. The power of determinant (PD) value for the variable X1 shows an increasing trend, indicating a significant effect of corn yield in the DCFG demand (Figure 5). Soybean yield (X2) has a smaller PD value than corn yield (X1). Pastoral area (X3), an indicator of availability of forages, has the smallest PD value for this element. The major corn production bases are located in the three provinces in Northeast China and the east Inner Mongolia in North China [56], which are ultimately consistent with the high value areas of DCFG demand. China’s major soybean production bases overlap with corn production bases [56], but the domestic soybean yields are rather limited [40]. Forage soybean and soybean meal used in dairy cow feeding depend significantly on imports [23,40]. Therefore, soybean yield (X2) does not have as large of an impact on the spatio-temporal dynamics of DCFG demand as corn yield (X1) does. Dairy farmers in China tend to rely on concentrate feed to increase dairy milk yield, which consumes a large amount of feed grain but does not utilize forage sufficiently [61]. The PD value of pastoral land (X3) also confirms the insufficient usage of forage as a significant feed. At present, dairy cow feeding in China needs to change the current feeding mode of “straw plus concentrate feed” and reduce the reliance on feed grains and utilize forage more efficiently [60].

5.2. Feeding Scale

The year-end number of dairy cows (X4) has the most direct influence on the DCFG demand (Figure 5). PD value for X4 had the largest value among all factors since 2000 (Table 4). The proportion of farms with more than 100 dairy cows (X5) reflects the feeding scale of dairy cows. The PD value for X5 indicates that this variable does not have a strong impact on the spatio-temporal dynamics of DCFG demand (Table 4, Figure 5). According to the statistics, the number of dairy cows in China increased from 2.69 million in 1990 to 10.37 million in 2016, one of the largest in the world [14]. In December 2018, the Ministry of Agriculture and Rural Affairs of China, the National Development and Reform Commission, and another nine ministries jointly issued Several Opinions on Revitalizing the Dairy Industry and emphasized the importance of large-scale dairy cow feeding [62]. Based on these opinions, China should stabilize the increasing number of dairy cows, reduce the proportion of free-range and small-scale dairy cow feeding, give full play to economies of scale, and reduce the pressure on feed grains from the increasing number of dairy cows.

5.3. Feeding Technology

The proportion of mechanized milking in large-scale dairy farms (X6) and the average daily milk yield per cow (X7) are selected to represent the feeding technology. In Table 4, the PD value for variable X6 was statistically significant only in 2005 and 2010 and had a relatively small value. The PD value for variable X7 increased from 2010 to 2016 and indicated a stronger influence on the DCFG demand (Figure 5). On the whole, the influence of feeding technology on spatial dynamics of DCFG demand is weaker than resource endowment and feeding scale (Figure 5). As we all know, the improvement of feeding technology can better secure the supply of milk and reduce the pressure on feed grain [56]. According to the FAO, the annual milk yield per cow in mainland China increased from 1544.80kg/cow in 1990 to 2421.00kg/cow in 2016. However, compared to the yield in the United States (10,348.20 kg/cow, 2016), the United Kingdom (7712.80 kg/cow, 2016), and Australia (5763.20 kg/cow, 2016) [63], a significant disparity can be identified. The higher dairy milk yield in developed countries has been mostly achieved through higher dairy milk yield efficiency per cow rather than the absolute numbers of dairy cows [64]. Higher milk yield per cow is the key to reducing the cost of dairy cow feeding in developed countries [64]. China should change the traditional growth model that relies on the increasing number of dairy cows, increase the dairy milk yield efficiency per cow, and improve the feeding technology.

5.4. Market Environment

The market environment is reflected through the average price of raw milk (X8) and per capita milk consumption of urban residents (X9). During the 2000–2010 period, the price of raw milk in China was lower in the north and higher in the south [65], which represented a spatial mismatch with the DCFG demand. At the same time, the domestic raw milk price was much higher than the international price which already has had a greater impact on the domestic dairy cow husbandry [15]. In 2016, the price of raw milk was $57.98/100 kg in China while it was only $26.02/100 kg, $25.44/100 kg, and $31.46/100 kg, respectively in New Zealand, Argentina, and the European Union [15]. Table 4 shows that the PD value for variable X8 has declined in recent years. With increasing income levels, urban residents substantially increased their milk consumption (Figure 5). The PD value for variable X9 has increased since 2010. The per capita milk consumption of rural residents has been increasing at a lower rate, but there is a great potential for it to grow. Overall, the impact of the market environment on the spatial dynamics of DCFG demand in China is comparable to that of any changes or development in feeding technology (Figure 5). To meet the nutritional needs, an adult needs to drink 300 g of liquid milk every day, according to the Chinese Nutritional Society [66]. However, annual per capita milk consumption of the Chinese population was only 12.1 kg (about 33 g per capita per day) in 2017 [12], far below suggested nutritional requirement. There is a great potential for the milk consumption to increase in China. Figure 5 shows that the market environment has a direct impact on the year-end number of dairy cows, which relates directly to the demand for feed grain.

6. Conclusions and Discussion

6.1. Conclusions

Based on the calculation of feed grain conversion ratio of dairy cows in the 31 provincial units, this study uses traditional statistics, spatial statistics, and the Geo-Detector method to explore the spatio-temporal dynamics of DCFG demand and its underlying influencing factors in China from 1990 to 2016. The following conclusions can be drawn from the results.
(1) At the national level, the scale and spatial pattern of DCFG demand in China have gradually stabilized. However, the relative scale of DCFG demand in animal husbandry generally declined overall. In the third stage (2007–2016), the demand scale of DCFG retained high-level stability, while its proportion in the total consumption of forage corn and soybean meal, and in the total corn and soybean yields, generally declined. Northern China was the most important area to DCFG demand where it remained high and concentrated. At the same time, the location for the DCFG central area was relatively stable, and the concentration is becoming more localized.
(2) At the regional and provincial levels, the scale of DCFG demand and its growth rate in China are characterized by regional polarization. Specifically, the high and low demand provinces of DCFG have the sharp characteristic contrast from north to south regions. North China is the region with the largest demand for DCFG and is increasing at the highest rate compared to other regions. South China has the smallest DCFG demand and the slowest growth rate.
(3) The spatio-temporal dynamics of DCFG demand in China are impacted by various factors in resource endowment, feeding scale, feeding technology, and market environment, but the way and degree of impact of each element are different. Among them, resource endowment and feeding scale have the most significant impact on the spatio-temporal dynamics of DCFG demand. The necessary measures to develop the grain-saving dairy husbandry in China are to improve the use of pastoral land, to endorse a balanced ration of concentrate feed and roughage feed, to improve in the feeding technology, to expand large-scale feeding, and to create a healthy and orderly market environment.

6.2. Discussion

This paper calculated the feed grain conversion ratio of dairy cows in the 31 provinces in China from 1990 to 2016, which can provide useful references for future research. In this study, the calculated DCFG demands are higher than those of previous research. This is because most existing research did not take into account the proportion of lactating cows in the total, which is about 48%. The main data of this study were sourced from official statistics. Some Chinese statistics are known to be unreliable, while the research on milk yield is considered accurate [7]. In many cases, unreliable data may be used due to the lack of better information sources. In this case, it is inevitable for different researchers to analyze the same phenomenon at the same time or at different times [7].
In recent years, the number of dairy cows and dairy milk yield growth rates have decreased [12], which were mainly impacted by the low-priced international raw milk. With the increasing consumption potential of Chinese rural residents, the realization of a self-sufficiency ratio of 70% of raw milk [62], and the mature global dairy market, new requirements may be put forth in order to keep up with DCFG demand. It is undeniable that the DCFG demand is a comprehensive and complex problem, and the DCFG demand may not increase significantly with the influence of feeding technology and diet structure. Compared with developed countries, there is still much room for the feeding technology to improve. With a rapid internationalization of dairy cow husbandry in China, market environment is bound to play an increasingly important role in the DCFG demand.
The feed grain conversion ratio varies under different feeding scales. If the milk yield data of different dairy feeding scales can be obtained, combined with the feed grain conversion ratio of corresponding scales, the accuracy of DCFG demand accounting would be further improved. The DCFG demand is a comprehensive problem, and there are many factors that affect the spatio-temporal dynamics of feed grain demand. Limited by the availability of data, this study only analyzed four elements (resource endowment, breeding scale, breeding technology, and market environment). In the future, research that includes the impact of national policies, company organization model, imports and exports, and feed grain quality could provide greater insight into the field. In addition, the impact of China’s existing dietary structure on global sustainable development needs further study. Soybean is an important component of feed grain [58]. Soybean trade has a negative impact on the ecological environment of both importing and exporting countries [67,68]. According to some studies, given the current global soybean demand scale, China adopts the import method, which alleviates the negative effect of global soybean production to some extent [67]. However, from the perspective of long-term development of ecological environments, how to balance the benign development of soybean trade and the ecological environment remains to be further studied.

Author Contributions

Conceptualization, C.X.L., C.Y.D. and B.B.M.; Methodology, C.Y.D. and B.B.M.; Formal Analysis, C.Y.D.; Investigation, C.Y.D. and C.X.L.; Data Curation, C.Y.D.; Writing-Original Draft Preparation, C.Y.D.; Writing-Review & Editing, C.X.L., B.B.M. and C.Y.D.; Visualization, C.Y.D.; Supervision, C.X.L. and B.B.M.; Funding Acquisition, C.X.L. All authors have read and agreed to the published version of the manuscript.

Funding

This research was funded by Key Deployment Project of the Chinese Academy of Sciences (No. KJZD-EW-G20-04) and National Key Research and Development Project of China (No. 2018YFD1100100).

Conflicts of Interest

The authors declare no conflict of interest.

References

  1. Mergos, G.J. Feed use of grain: On trends and determinants. Eur. Rev. Agric. Econ. 1989, 16, 1–17. [Google Scholar] [CrossRef]
  2. Spiertz, J.H.J.; Ewert, F. Crop production and resource use to meet the growing demand for food, feed and fuel: Opportunities and constraints. NJAS Wagening. J. Life Sci. 2009, 56, 281–300. [Google Scholar] [CrossRef] [Green Version]
  3. Godfray, H.C.J.; Beddington, J.R.; Crute, I.R.; Haddad, L.; Lawrence, D.; Muir, J.F.; Pretty, J.; Robinson, S.; Thomas, S.M.; Toulmin, C. Food security: The challenge of feeding 9 billion people. Science 2010, 327, 812–818. [Google Scholar] [CrossRef] [PubMed] [Green Version]
  4. Xin, L.J.; Wang, L.X.; Liu, A.M. Regional production and consumption equilibrium of feed grain in China and its policy implication. J. Nat. Resour. 2018, 33, 965–977. (In Chinese) [Google Scholar]
  5. Wang, M.L. China’s livestock industry development: Achievements, experiences and future trends. Issues Agric. Econ. 2018, 8, 60–70. (In Chinese) [Google Scholar]
  6. Rae, A. China’s agriculture, smallholders and trade: Driven by the livestock revolution? Aust. J. Agric. Resour. Econ. 2008, 52, 283–302. [Google Scholar] [CrossRef] [Green Version]
  7. Zhou, Z.Y.; Tian, W.M.; Malcolm, B. Supply and demand estimates for feed grains in China. Agric. Econ. 2008, 39, 111–122. [Google Scholar] [CrossRef]
  8. Tian, W.M.; Chudleigh, J. China’s feed grain market: Development and prospects. Agribus. Int. J. 1999, 15, 393–409. [Google Scholar] [CrossRef]
  9. Hou, X.Y.; Zhang, Y.J. Analysis on driving factors of improvement of quality and efficiency and transformation development of grasslands and animal husbandry industry. Chin. Sci. Bull. 2018, 63, 1632–1641. (In Chinese) [Google Scholar] [CrossRef] [Green Version]
  10. IDDCDA (Industry Development Department of China Dairy Association). 2017 China “School Milk Programme” Promotion and Exchange Conference Held. Available online: http://www.dac.com.cn/read/newxhdt1-17122507465539510742.jhtm (accessed on 25 April 2019).
  11. Liu, C.G. China Dairy Yearbook; China Agriculture Press: Beijing, China, 2006. (In Chinese) [Google Scholar]
  12. NBSC (National Bureau of Statistics of China). China Statistical Yearbook 2018; China Statistics Press: Beijing, China, 2018. (In Chinese)
  13. Liu, C.Q.; Han, L.; Zhang, Y.H. International comparison and development suggestions of China’s dairy industry competitiveness. Chin. Rural Econ. 2018, 7, 130–144. (In Chinese) [Google Scholar]
  14. RSID, NBSC (Rural Socioeconomic Investigation Department, National Bureau of Statistics of China). China Rural Statistical Yearbook 2018; China Statistics Press: Beijing, China, 2018. (In Chinese)
  15. Ministry of Agriculture of PRC. China Dairy Yearbook 2017; China Agriculture Press: Beijing, China, 2018. (In Chinese)
  16. Zhou, Z.Y.; Tian, W.M.; Liu, X.A.; Wan, G.H. An Issue of Debate: China’s Feedgrain Demand and Supply; AARC Working Paper Series No. 15; Asian Agribusiness Research Centre: The University of Sydney: Sydney, Australia, 2001. [Google Scholar]
  17. Han, X.R.; Chen, Y.F.; Qian, X.P. Demand of feed grain in China. J. Agrotech. Econ. 2014, 8, 60–68. (In Chinese) [Google Scholar]
  18. PDNDRC (Price Department of National Development and Reform Commission). National Assembly of Cost and Benefit Analysis of Agricultural Products 2018; China Statistics Press: Beijing, China, 2018. (In Chinese)
  19. Hu, X.D.; Wang, J.M. Estimation and structure of pig’s feed grain consumption in China. J. Agrotech. Econ. 2015, 10, 4–13. (In Chinese) [Google Scholar]
  20. Ding, X.M. Develop forage-saving feed-strategic choice on adjusting dietary pattern of urban and rural residents in China. China Soft Sci. 1991, 6, 41–44. (In Chinese) [Google Scholar]
  21. Li, H.M.; Li, B.; Tang, Q.Y. Influencing factors of maize yield in southern China-based on the survey of farmers in Hunan province. Chin. Rural Econ. 2010. (In Chinese) [Google Scholar]
  22. Ran, J.; Sun, Z. Feed grain consumed from 1984 to 2013 in China. Chin. Agric. Sci. Bull. 2017, 33, 153–158. (In Chinese) [Google Scholar]
  23. Xie, G.D.; Cheng, S.K.; Xiao, Y.; Lu, C.X.; Liu, X.J.; Xu, J. The balance between grain supply and demand and the reconstruction of China’s food security strategy in the new period. J. Nat. Resour. 2017, 32, 895–903. (In Chinese) [Google Scholar]
  24. Brown, L.R. Who Will Feed China? Wake-Up Call for a Small Planet; WW Norton & Company: New York, NY, USA, 1995. [Google Scholar]
  25. Tian, W.M.; Zhou, Z.Y. Methodology Issues on Studying the Feedgrain’s Supply and Demand; China Agriculture Press: Beijing, China, 2007. [Google Scholar]
  26. Aubert, C. Food security and consumption patterns in China: The grain problem. China Perspect. 2008, 2, 5–23. [Google Scholar] [CrossRef] [Green Version]
  27. Qu, W.S. A Comparison Framework of Seven China Agriculture Models; Ash, K., Ma, X., Eds.; China in the Global Economy Agriculture in China and OECD Countries: Past Policies and Future Challenges; OECD–Organisation for Economic Co-operation and Development: Paris, France, 1999. [Google Scholar]
  28. Liu, N. Impact of population structure and food consumption differences on China’s food demand. Lanzhou Acad. J. 2015, 11, 164–170. (In Chinese) [Google Scholar]
  29. Crompton, P.; Phillips, B.; Gunasekera, D. Effect on feed grains of China’s rising demand for livestock products. Chin. Rural Econ. 1994, 3, 27–32. [Google Scholar]
  30. Yang, S.Q.; Yang, G.H.; Feng, Y.Z.; Yang, Z.L.; Gao, W.S. Demand prediction of agricultural products in northwest of China in 2010. Chin. J. Eco-Agric. 2007, 15, 159–161. (In Chinese) [Google Scholar]
  31. Zhou, D.W.; Liu, H.W.; Sun, H.X.; Zhong, R.Z. Meat supply security and strategy of guaranteeing the production of meat in China. Bull. Chin. Acad. Sci. 2013, 28, 733–739. (In Chinese) [Google Scholar]
  32. Yang, T.J.; Yang, N.; Zhu, C.H. A forecasting model for feed grain demand based on combined dynamic model. Comput. Intell. Neurosci. 2016, 2016, 1–6. [Google Scholar] [CrossRef] [PubMed] [Green Version]
  33. Ran, J.; Wang, J.M. Prediction and analysis of feed grain demand based on feed demand in China. J. China Agric. Univ. 2017, 22, 190–198. (In Chinese) [Google Scholar]
  34. Xin, X.; Wan, G.H.; Liu, X.R. China’s regional feed grain trade flows and responses to price changes. China Rural Surv. 2002, 1, 22–29. (In Chinese) [Google Scholar]
  35. Xin, X.; Jiang, N.H.; Zhou, Z.Y. The impact of livestock produce consume increases on grain market of fodder in China. Issues Agric. Econ. 2003, 1, 60–64. (In Chinese) [Google Scholar]
  36. Liang, S.M. Optimization of feed circulation - based on spatial equilibrium model and GIS network analysis. J. Agrotech. Econ. 2010, 1, 80–87. (In Chinese) [Google Scholar]
  37. RGRFGCS (Research Group on Reform of Feed Grain Circulation System). Reform of feed grain circulation system in China. Chin. Rural Econ. 1998, 8, 33–40. (In Chinese) [Google Scholar]
  38. Zhou, H.C.; Chen, D.Q.; Zhang, L.X. Pattern of Supply of Raw Grain Feed in China. Lanzhou Acad. J. 2011, 6, 66–71. (In Chinese) [Google Scholar]
  39. Tian, W.M.; Zhou, Z.Y. International agricultural trade reforms and implications on China’s feed grain demand. China Agric. Econ. Rev. 2003, 1, 202–224. [Google Scholar]
  40. Mao, X.F.; Liu, D.M.; Liu, J. The present and future picture of large scale grain import in China. China Soft Sci. 2016, 1, 59–71. (In Chinese) [Google Scholar]
  41. Gu, G.D.; Yin, J.H. Measurement of Chinese Food Trade Safety from the Non-Traditional Security Perspective. J. Zhejiang Univ. (Humanit. Soc. Sci.) 2014, 44, 35–49. (In Chinese) [Google Scholar]
  42. Zhao, J.X.; Pan, B.; Tian, H.Z. Drived by price difference or rigid demand: Motivation of the increase in China’s feed grain imports. Issues Agric. Econ. 2019, 5, 98–109. (In Chinese) [Google Scholar]
  43. Li, J.R.; Barrett, C.B. Distinguishing between equilibrium and integration in markets analysis. Soc. Sci. Electron. Publ. (SSRN) 1999. [Google Scholar] [CrossRef] [Green Version]
  44. Sun, B.M. Index system and model design of grain supply and demand forecast in China. Econ. Probl. 2012, 3, 39–43. (In Chinese) [Google Scholar]
  45. Li, G.X. Grain production capacity and national food security level in China in 2020. Chin. Rural Econ. 2014, 5, 4–12. (In Chinese) [Google Scholar]
  46. Fang, C.; Fuller, F.H. Feed-Grain Consumption by Traditional Pork-Producing Households in China; Food and Agricultural Policy Research Institute (FAPRI) Publications: Ames, IA, USA, 1998. [Google Scholar]
  47. Zhang, X.M.; Dong, Y.H.; Shen, W.Z. Estimation of the main livestock and poultry breeding and feed grain demand in China. Feed Res. 2015, 4, 8–11. (In Chinese) [Google Scholar]
  48. NGCC (National Geomatics Center of China). National Basic Geographic Database (1:100 Million). Available online: http://www.webmap.cn/commres.do?method=result100W (accessed on 25 April 2019).
  49. Fischer, M.M.; Getis, A. Handbook of Applied Spatial Analysis: Software Tools, Methods and Applications; Springer: Berlin, Germany, 2010. [Google Scholar]
  50. Cliff, A.D.; Processes, O.S. Spatial Processes, Models and Applications; Pion: London, UK, 1981. [Google Scholar]
  51. Wang, J.F.; Xu, C.D. Geodetector: Principle and prospective. Acta Geogr. Sin. 2017, 72, 116–134. (In Chinese) [Google Scholar]
  52. Wang, J.F.; Li, X.H.; Christakos, G.; Liao, Y.L.; Zhang, T.; Gu, X.; Zheng, X.Y. Geographical detectors-based health risk assessment and its application in the neural tube defects study of the Heshun region, China. Int. J. Geogr. Inf. Sci. 2010, 24, 107–127. [Google Scholar] [CrossRef]
  53. Liu, Y.S.; Yang, R. The spatial characteristics and formation mechanism of the county urbanization in China. Acta Geogr. Sin. 2012, 67, 1011–1020. (In Chinese) [Google Scholar]
  54. Wang, J.F.; Zhang, T.L.; Fu, B.J. A measure of spatial stratified heterogeneity. Ecol. Indic. 2016, 67, 250–256. [Google Scholar] [CrossRef]
  55. Yu, H.L.; Li, B.L. Analysis on international competitiveness and influencing factors of Chinese dairy products. J. Int. Trade 2011, 10, 14–24. (In Chinese) [Google Scholar]
  56. Dao, R.N.; Luo, Y.F. From resources to capital: The cause analysis of the regional structure change in China’s dairy industry. Res. Agric. Mod. 2016, 2, 205–213. (In Chinese) [Google Scholar]
  57. Sun, X.Z. Evolution and tendency of Chinese agricultural production pattern. China Popul. Resour. Environ. 2010, 20, 107–111. (In Chinese) [Google Scholar]
  58. Zhou, Z.Y.; Gao, M.J.; Li, Q.X.; Zhang, Q.; Luo, Q.Y. Estimation of the primary products demand in China based on the balanced diet. Chin. J. Agric. Resour. Reg. Plan. 2015, 4, 85–90. (In Chinese) [Google Scholar]
  59. Hu, X.P.; Guo, X.H. Analysis and forecast of China’s grain demand structure in 2020—Based on the perspective of nutrition standards. Chin. Rural Econ. 2010, 6, 4–15. (In Chinese) [Google Scholar]
  60. Wang, M.L. Comprehensively upgrade the dairy industry in China through promoting the development of alfalfa Industry. Issues Agric. Econ. 2010, 5, 22–26. (In Chinese) [Google Scholar]
  61. Liu, Y.N.; Shi, Y.H.; Yan, X.B.; Wang, C.Z.; Liang, M.G.; Zhou, L. Effect of alfalfa hay substituting for part of the concentrate, on the production of cows and economic profit. Acta Prataculturae Sin. 2013, 22, 190–197. (In Chinese) [Google Scholar]
  62. GOSC (General Office of the State Council of the People’s Republic of China). Opinions of the General Office of the State Council on Promoting the Revitalization of the Dairy Industry to Ensure the Quality and Safety of Dairy Products. 2018. Available online: http://www.gov.cn/zhengce/content/2018-06/11/content_5297839.htm (accessed on 27 April 2019).
  63. FAO Database. Production. Available online: http://www.fao.org/faostat/zh/#data (accessed on 27 April 2019).
  64. Wei, Y.J.; Zhu, J. International experience in the development of the dairy industry: An analysis from the perspective of supply agents. Chin. Rural Econ. 2019, 2, 115–130. (In Chinese) [Google Scholar]
  65. Liu, C.G. China Dairy Yearbook; China Agriculture Press: Beijing, China, 2011. (In Chinese) [Google Scholar]
  66. CNS (Chinese Nutrition Society). Dietary Guidelines for Chinese Residents (2016); People’s Medical Publishing House: Beijing, China, 2016. (In Chinese) [Google Scholar]
  67. Qiang, W.L.; Liu, A.M.; Cheng, S.K. An ecological and socio-economic impact assessment of China’s soybean trade based on multi-attributes theory. Resour. Sci. 2013, 11, 2174–2180. (In Chinese) [Google Scholar]
  68. Luo, Y.; Qiao, Y.H.; Wu, W.L. Environment impact assessment of organic and conventional soybean production with LCA method in China Northeast Plain. Acta Ecol. Sin. 2011, 23, 7170–7178. (In Chinese) [Google Scholar]
Figure 1. National dairy cow feed grain (DCFG) demand and as a proportion of the total consumption of forage corn and soybean meal, and in the total yield of corn and soybean.
Sustainability 12 00663 g001
Figure 2. Temporal changes of DCFG demand in seven regions, 1990 to 2016.
Sustainability 12 00663 g002
Figure 3. Standard deviation ellipses of DCFG demand in China, 1990–2016.
Sustainability 12 00663 g003
Figure 4. Hotspot analysis of DCFG demand at the provincial level in China. (“Sub-cold” spots and “sub-hot” spots are not statistically significant. They are usually not included in the analysis.).
Sustainability 12 00663 g004
Figure 5. Process mechanism of spatial differentiation of Chinese DCFG demand.
Sustainability 12 00663 g005
Table 1. National average feed grain conversion ratio of dairy cows in China, 1990 to 2016.
YearsFeed Grain Conversion RatioYearsFed Grain Conversion RatioYearsFeed Grain Conversion Ratio
19900.3919990.4620080.37
19910.3920000.4020090.37
19920.4520010.4020100.38
19930.4920020.3720110.38
19940.4820030.3920120.38
19950.4120040.3720130.39
19960.4220050.3820140.38
19970.4520060.3920150.37
19980.4220070.3720160.37
Table 2. Value Range and Mean Value of feed grain conversion ratio by provinces in China, 1990 to 2016.
ProvincesFeed Grain Conversion RatioProvincesFeed Grain Conversion Ratio
RangeMeanRangeMean
Beijing0.25–0.810.38Hubei0.27–0.520.38
Tianjin0.32–0.570.42Hunan0.21–1.330.59
Hebei0.35–0.570.41Guangdong0.21–0.780.44
Shanxi0.28–0.630.39Guangxi0.26–0.570.39
Inner Mongolia0.16–0.810.37Hainan0.37–1.680.48
Liaoning0.24–0.390.34Chongqing0.26–0.570.42
Jilin0.26–0.470.36Sichuan0.26–0.570.41
Heilongjiang0.30–0.550.36Guizhou0.30–0.660.46
Shanghai0.32–0.540.39Yunnan0.22–0.670.38
Jiangsu0.27–0.470.37Tibet0.31–0.670.40
Zhejiang0.25–0.490.40Shaanxi0.28–0.570.40
Anhui0.26–0.620.38Gansu0.13–0.800.40
Fujian0.30–0.490.36Qinghai0.29–0.610.39
Jiangxi0.32–0.560.40Ningxia0.25–0.640.42
Shandong0.21–0.480.38Xinjiang0.26–0.560.37
Henan0.22–0.670.39---
Table 3. Parameters of Standard Deviation Ellipse for DCFG demand in China, 1990–2016.
YearsMajor Axis (km)Minor Axis (km)Rotation (°)Barycentric CoordinatesMigration Distance (km)Elliptical Area (103 km2)
19901022.771656.8364.76113.13° E, 39.93° N532.32
19951012.181706.6771.21111.71° E, 40.14° N123.62542.65
2000925.131467.4070.82112.90° E, 39.46° N126.78426.45
2005817.111140.5060.53114.06° E, 40.59° N160.32292.75
2010779.521131.3954.92114.15° E, 40.20° N43.46277.05
2016803.121200.2656.43114.07° E, 39.84° N40.34302.81
Table 4. Geo-Detector analysis of DCFG demand in China, 1990–2016.
Main ElementsVariables199019952000200520102016
Resource endowmentX10.150.180.300.410.500.61
X20.140.12 0.090.220.240.25
X3---0.100.080.08
Feeding scaleX4--0.590.480.590.68
X5----0.160.19
Feeding technologyX6---0.100.15-
X7----0.070.23
Market environmentX8--0.290.120.20-
X9----0.130.23

