An Econophysics Study of the S&P Global Clean Energy Index


Abstract
1. Introduction
2. A Literature Review on the Efficient Market Hypothesis (EMH)
3. Materials and Methods
4. Results
5. Discussion and Concluding Remarks
Author Contributions
Funding
Conflicts of Interest
References
- Bachelier, L. Théorie de la spéculation. Ann. Sci. Éc. Norm. Supér. 1900, 17, 21–86. [Google Scholar] [CrossRef]
- Fama, E. Mandelbrot and the Stable Paretian Hypothesis. J. Bus. 1963, 36, 420–429. [Google Scholar] [CrossRef]
- Fama, E. Efficient capital markets: A review of theory and empirical work. J. Financ. 1970, 25, 383–417. [Google Scholar] [CrossRef]
- Gallegati, M. Beyond econophysics (not to mention mainstream economics). Eur. Phys. J. Spec. Top. 2016, 225, 3179–3185. [Google Scholar] [CrossRef]
- Jovanovic, F.; Schinckus, C. Breaking down the barriers between econophysics and financial economics. Int. Rev. Financ. Anal. 2016, 47, 256–266. [Google Scholar] [CrossRef]
- Schinckus, C. 1996–2016: Two decades of econophysics: Between methodological diversification and conceptual coherence. Eur. Phys. J. Spec. Top. 2016, 225, 3299–3311. [Google Scholar] [CrossRef][Green Version]
- Pereira, E.; Silva, M.; Pereira, H. Econophysics: Past and present. Physica A 2017, 473, 251–261. [Google Scholar] [CrossRef]
- Osborne, M. Brownian motion in the stock market. Oper. Res. 1959, 7, 145–173. [Google Scholar] [CrossRef]
- Osborne, M. Periodic structure in the Brownian motion of stock prices. Oper. Res. 1962, 10, 345–379. [Google Scholar] [CrossRef]
- Alexander, S. Price movements in speculative markets: Trends or random walks. Ind. Manag. Rev. 1961, 2, 7–26. [Google Scholar]
- Cootner, P. Stock prices: Random vs. systematic changes. Ind. Manag. Rev. 1962, 3, 24–45. [Google Scholar]
- Samuelson, P. Proof that properly anticipated prices fluctuate randomly. Ind. Manag. Rev. 1965, 6, 41–49. [Google Scholar]
- Granger, C.; Morgenstern, O. Spectral analysis of New York stock market prices. Kyklos 1963, 16, 1–27. [Google Scholar] [CrossRef]
- Mandelbrot, B. The variation of certain speculative prices. J. Bus. 1963, 36, 394–419. [Google Scholar] [CrossRef]
- Mandelbrot, B.; Wallis, J. Some long-run properties of geophysical records. Water Resour. Res. 1969, 5, 321–340. [Google Scholar] [CrossRef]
- Cont, R. Empirical properties of asset returns: Stylized facts and statistical issues. Quant. Financ. 2001, 1, 223–236. [Google Scholar] [CrossRef]
- Parisi, D.; Sornette, D.; Helbing, D. Financial price dynamics and pedestrian counterflows: A comparison of statistical stylized facts. Phys. Rev. E 2013, 87, 012804. [Google Scholar] [CrossRef]
- Yen, G.; Lee, C. Efficient market hypothesis (EMH): Past, present and future. Rev. Pac. Basin Fin. Mark. Policies. 2008, 11, 305–329. [Google Scholar] [CrossRef]
- Titan, A. The Efficient Market Hypothesis: Review of Specialized Literature and Empirical Research. Proc. Econ. Financ. 2015, 32, 442–449. [Google Scholar] [CrossRef]
- Kyriazis, N. A Survey on Efficiency and Profitable Trading Opportunities in Cryptocurrency Markets. J. Risk. Fin. Manag. 2019, 12, 67. [Google Scholar] [CrossRef]
- Fama, E. Market efficiency, long-term returns, and behavioral finance. J. Fin. Econ. 1998, 49, 283–306. [Google Scholar] [CrossRef]
- Granger, C.; Maasoumi, E.; Racine, J. A dependence metric for possibly nonlinear processes. J. Time Ser. Anal. 2004, 25, 649–669. [Google Scholar] [CrossRef]
- Andreou, E.; Pittis, N.; Spanos, A. On modelling speculative prices: The empirical literature. J. Econ. Surv. 2001, 15, 187–220. [Google Scholar] [CrossRef]
- McCauley, J.; Bassler, K.; Gunaratne, G. Martingales, detrending data, and the efficient market hypothesis. Physica A 2008, 387, 202–216. [Google Scholar] [CrossRef][Green Version]
- Shiller, R. From efficient markets theory to behavioral finance. J. Econ. Perspect. 2003, 17, 83–104. [Google Scholar] [CrossRef]
- Farmer, D.; Lo, A. Frontiers of finance: Evolution and efficient markets. Proc. Natl. Acad. Sci. USA 1999, 96, 9991–9992. [Google Scholar] [CrossRef]
- Peng, C.; Buldyrev, S.; Havlin, S.; Simons, M.; Stanley, E.; Goldberger, A. Mosaic organization of DNA nucleotides. Phys. Rev. E 1994, 49, 1685–1689. [Google Scholar] [CrossRef]
- Vandewalle, N.; Ausloos, M. Coherent and random sequences in financial fluctuations. Physica A 1997, 246, 454–459. [Google Scholar] [CrossRef]
- Liu, Y.; Cizeau, P.; Meyer, M.; Peng, C.; Stanley, H. Correlations in economic time series. Physica A 1997, 245, 437–440. [Google Scholar] [CrossRef]
- Ausloos, M.; Vandewalle, N.; Boveroux, P.; Minguet, A.; Ivanova, K. Applications of statistical physics to economic and financial topics. Physica A 1999, 274, 229–240. [Google Scholar] [CrossRef]
- Ausloos, M. Statistical physics in foreign exchange currency and stock markets. Physica A 2000, 285, 48–65. [Google Scholar] [CrossRef]
- Cao, G.; Zhang, M. Extreme values in the Chinese and American stock markets based on detrended fluctuation analysis. Physica A 2015, 436, 25–35. [Google Scholar] [CrossRef]
- Anagnostidis, P.; Varsakelis, C.; Emmanouilides, C. Has the 2008 financial crisis affected stock market efficiency? The case of Eurozone. Physica A 2016, 447, 116–128. [Google Scholar] [CrossRef]
- Ferreira, P.; Loures, L.; Nunes, J.; Dionísio, A. The behaviour of share returns of football clubs: An econophysics approach. Physica A 2017, 472, 136–144. [Google Scholar] [CrossRef]
- Alvarez-Ramirez, J.; Alvarez, J.; Rodriguez, E. Short-term predictability of crude oil markets: A detrended fluctuation analysis approach. Energy Econ. 2008, 30, 2645–2656. [Google Scholar] [CrossRef]
- Wang, Y.; Wei, Y.; Wu, C. Detrended fluctuation analysis on spot and futures markets of West Texas Intermediate crude oil. Physica A 2011, 390, 864–875. [Google Scholar] [CrossRef]
- Gu, R.; Chen, H.; Wang, Y. Multifractal analysis on international crude oil markets based on the multifractal detrended fluctuation analysis. Physica A 2010, 389, 2805–2815. [Google Scholar] [CrossRef]
- Cajueiro, D.; Tabak, B. The Hurst exponent over time: Testing the assertion that emerging markets are becoming more efficient. Physica A 2004, 336, 521–537. [Google Scholar] [CrossRef]
- Cajueiro, D.; Tabak, B. Evidence of long range dependence in Asian equity markets: The role of liquidity and market restrictions. Physica A 2004, 342, 656–664. [Google Scholar] [CrossRef]
- Cajueiro, D.; Tabak, B. Testing for predictability in equity returns for European transition markets. Econ. Syst. 2006, 30, 56–78. [Google Scholar] [CrossRef]
- Cajueiro, D.; Tabak, B. Testing for time-varying long-range dependence in real estate equity returns. Chaos Soliton. Fract. 2008, 38, 293–307. [Google Scholar] [CrossRef]
- Kristoufek, L.; Vosvrda, M. Measuring capital market efficiency: Global and local correlations structure. Physica A 2013, 392, 184–193. [Google Scholar] [CrossRef]
- Podobnik, B.; Stanley, H. Detrended Cross-Correlation Analysis: A new method for analyzing two nonstationary time series. Phys. Rev. Lett. 2008, 100, 084102. [Google Scholar] [CrossRef] [PubMed]
- Zebende, G. DCCA cross-correlation coefficient: Quantifying level of cross-correlation. Physica A 2011, 390, 614–618. [Google Scholar] [CrossRef]
- Kristoufek, L. Measuring cross-correlation between non-stationary series with DCCA coefficient. Physica A 2014, 402, 291–298. [Google Scholar] [CrossRef]
- Zhao, X.; Shang, P.; Huang, J. Several fundamental properties of DCCA cross-correlation coefficient. Fractals 2017, 25, 1750017. [Google Scholar] [CrossRef]
- Filho, A.; Silva, M.; Zebende, G. Autocorrelation and cross-correlation in time series of homicide and attempted homicide. Physica A 2014, 400, 12–19. [Google Scholar] [CrossRef]
- Zebende, G.; Fernandez, B.; Pereira, M. Analysis of the variability in the sdB star KIC 10670103: DFA approach. Mon. Not. R. Astron. Soc. 2017, 464, 2611–2642. [Google Scholar] [CrossRef]
- Zebende, G.; Brito, A.; Filho, A.; Castro, A. ρDCCA applied between air temperature and relative humidity: An hour/hour view. Physica A 2017, 494, 17–26. [Google Scholar] [CrossRef]
- Reboredo, J.; Rivera-Castro, M.; Zebende, G. Oil and US dollar exchange rate dependence: A detrended cross-correlation approach. Energ. Econ. 2014, 42, 132–139. [Google Scholar] [CrossRef]
- Hussain, M.; Zebende, G.; Bashir, U.; Donghong, D. Oil price and exchange rate co-movements in Asian countries: Detrended cross-correlation approach. Physica A 2017, 465, 338–346. [Google Scholar] [CrossRef]
- Ferreira, P.; Pereira, É.; Silva, M.; Pereira, H. Detrended correlation coefficients between oil and stock markets: The effect of the 2008 crisis. Physica A 2019, 517, 86–96. [Google Scholar] [CrossRef]
- Wang, G.; Xie, C.; Chen, S.; Yang, J.; Yang, M. Random matrix theory analysis of cross-correlations in the US stock market: Evidence from Pearson’s correlation coefficient and detrended cross-correlation coefficient. Physica A 2013, 392, 3715–3730. [Google Scholar] [CrossRef]
- Ferreira, P.; Dionísio, A. How long is the memory of the US stock market? Physica A 2017, 451, 502–506. [Google Scholar] [CrossRef]
- Podobnik, B.; Jiang, Z.; Zhou, W.; Stanley, H. Statistical tests for power-law cross-correlated processes. Phys. Rev. E 2011, 84, 066118. [Google Scholar] [CrossRef]
- Ferreira, P.; Loures, L.; Nunes, J.; Brito, P. Are renewable energy stocks a possibility to diversify portfolios considering an environmentally friendly approach? The view of DCCA correlation coefficient. Physica A 2018, 512, 675–681. [Google Scholar] [CrossRef]
- Dang, C.; Li, Z.; Yang, C. Measuring firm size in empirical corporate finance. J. Bank. Financ. 2018, 86, 159–176. [Google Scholar] [CrossRef]
- Li, Z.; Minor, D.; Wang, J.; Yu, C. A learning curve of the market: Chasing alpha of socially responsible firms. J. Econ. Dyn. Control 2019, 109, 103772. [Google Scholar] [CrossRef]
- Ausloos, M.; Jovanovic, F.; Schinckus, C. On the ‘‘usual’’ misunderstandings between econophysics and finance: Some clarifications on modelling approaches and efficient market hypothesis. Int. Rev. Financ. Anal. 2016, 47, 7–14. [Google Scholar] [CrossRef]


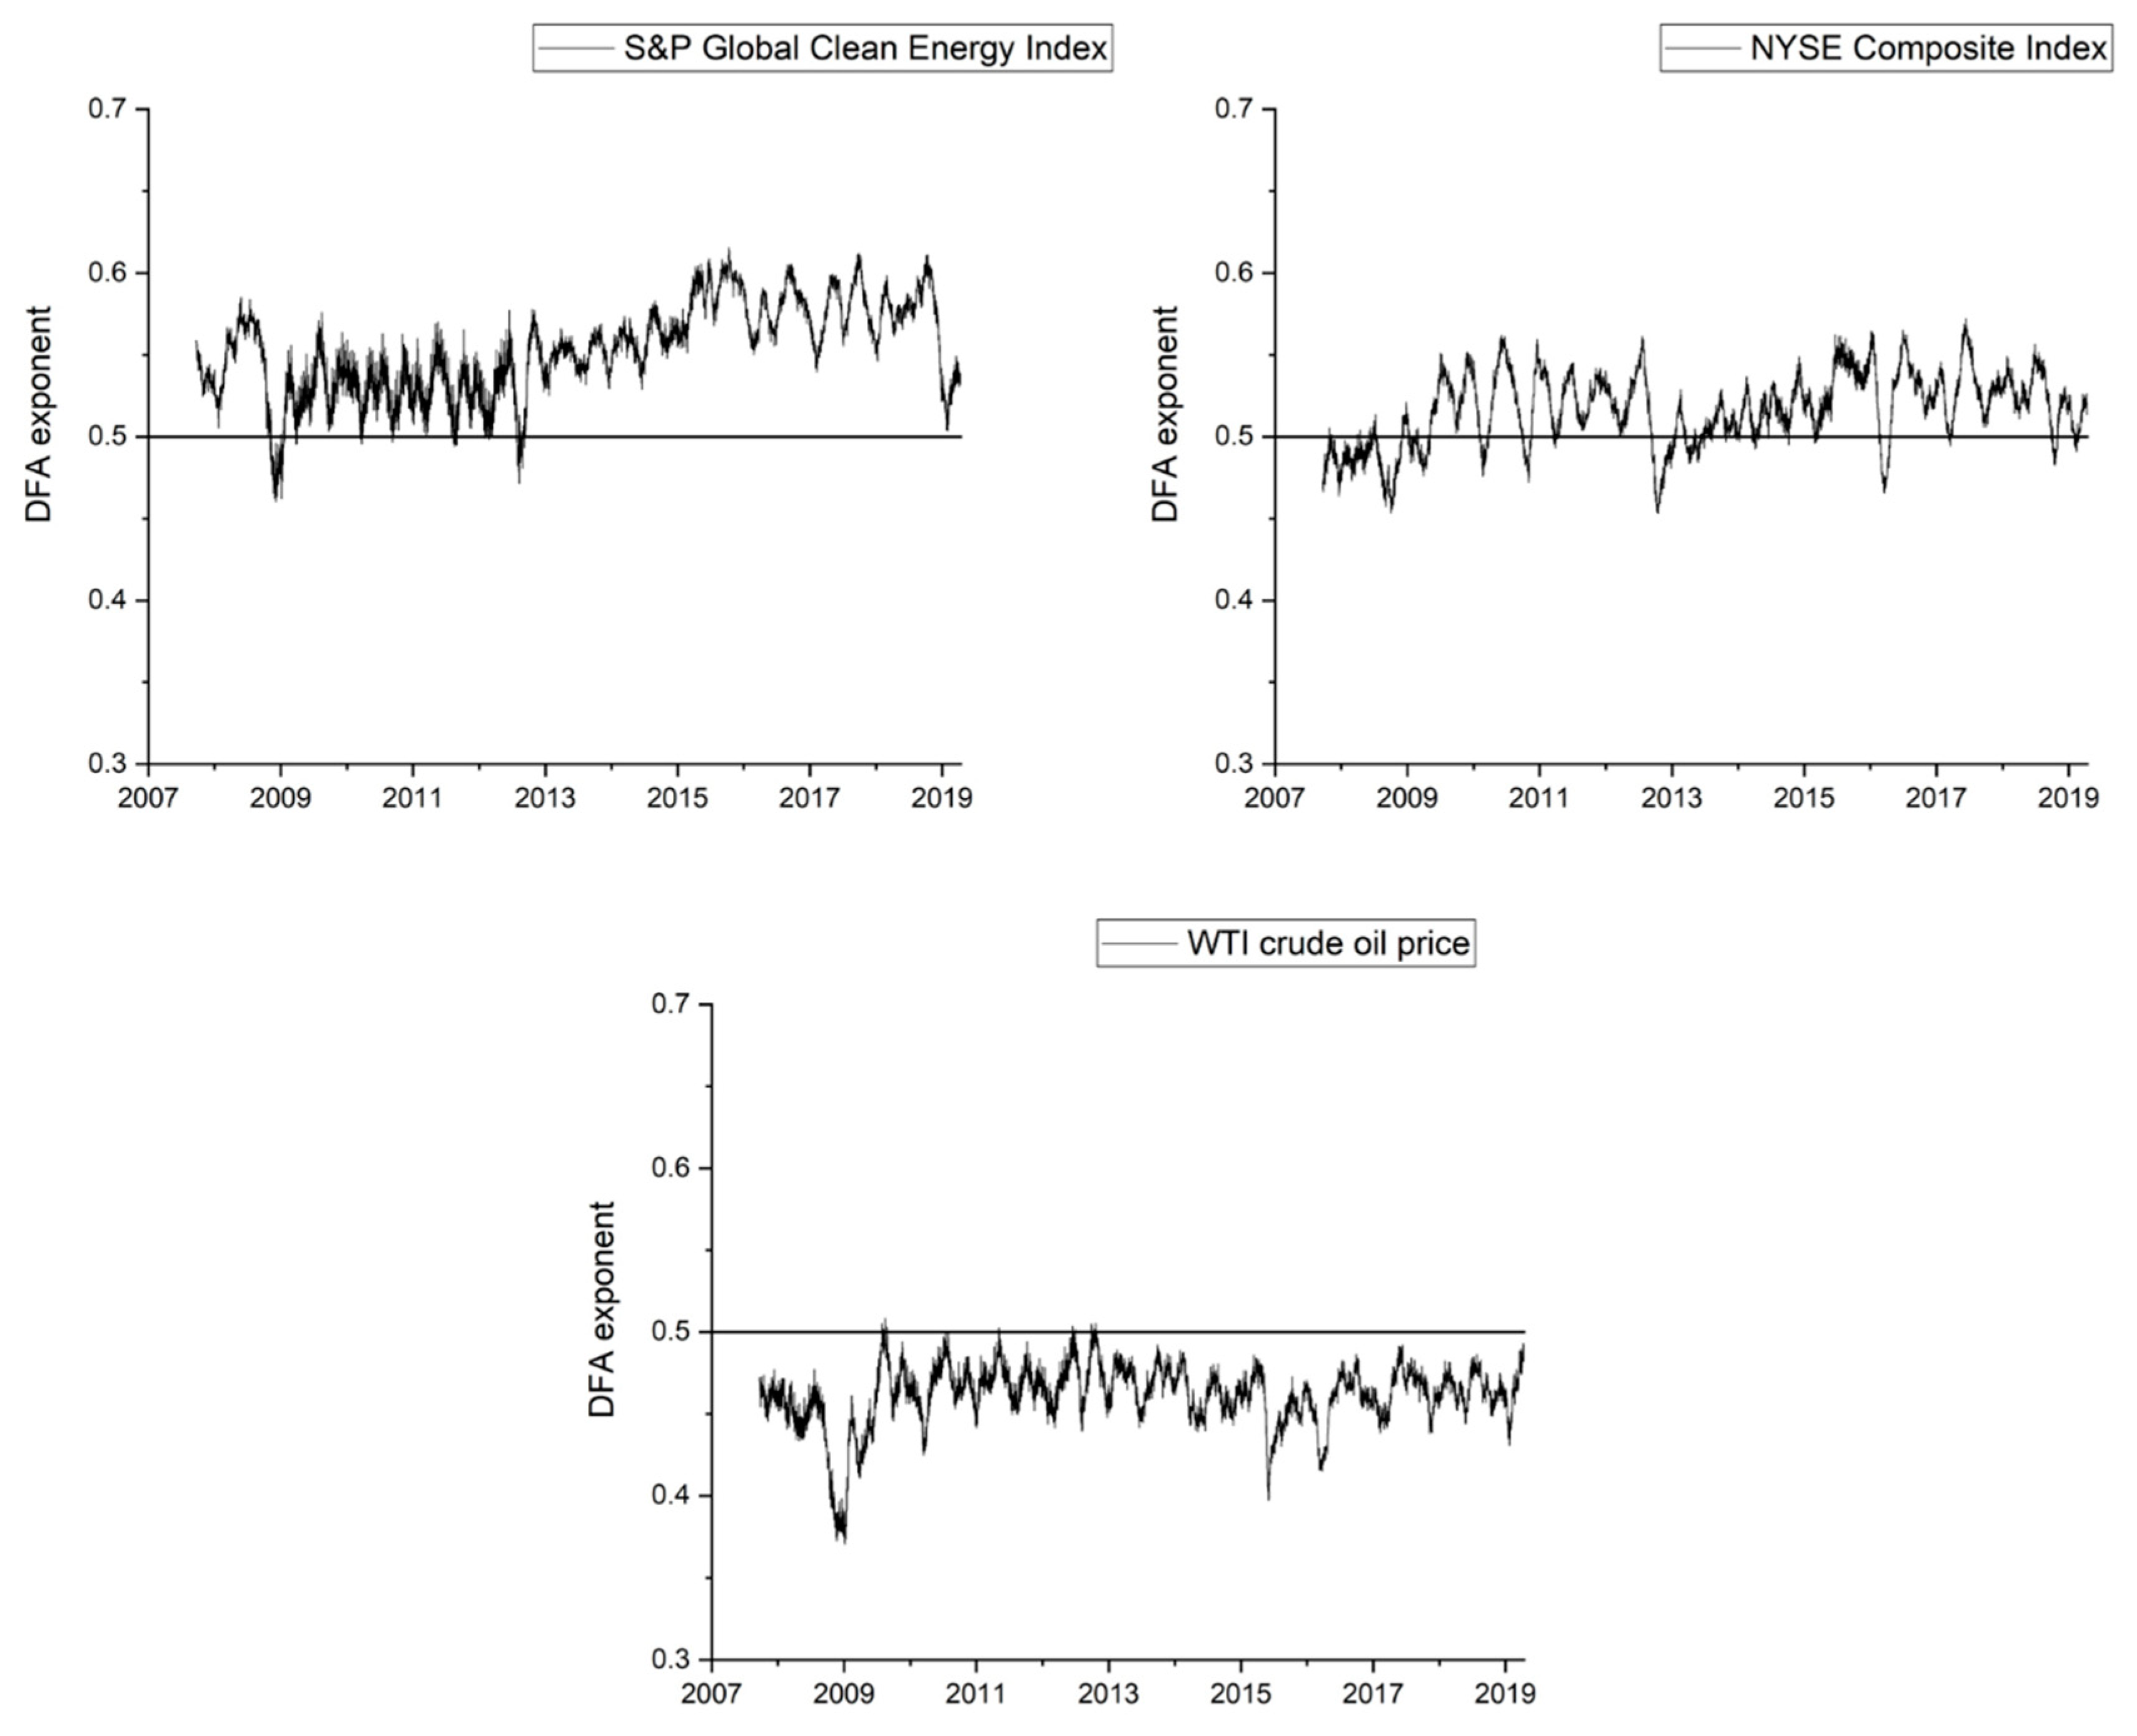
| Asset | DFA Exponent |
|---|---|
| S&P Global Clean Energy Index | 0.5124 ± 0.0041 |
| New York Stock Exchange (NYSE) Composite Index | 0.5178 ± 0.0079 |
| West Texas Intermediate (WTI) crude oil price | 0.4788 ± 0.0093 |
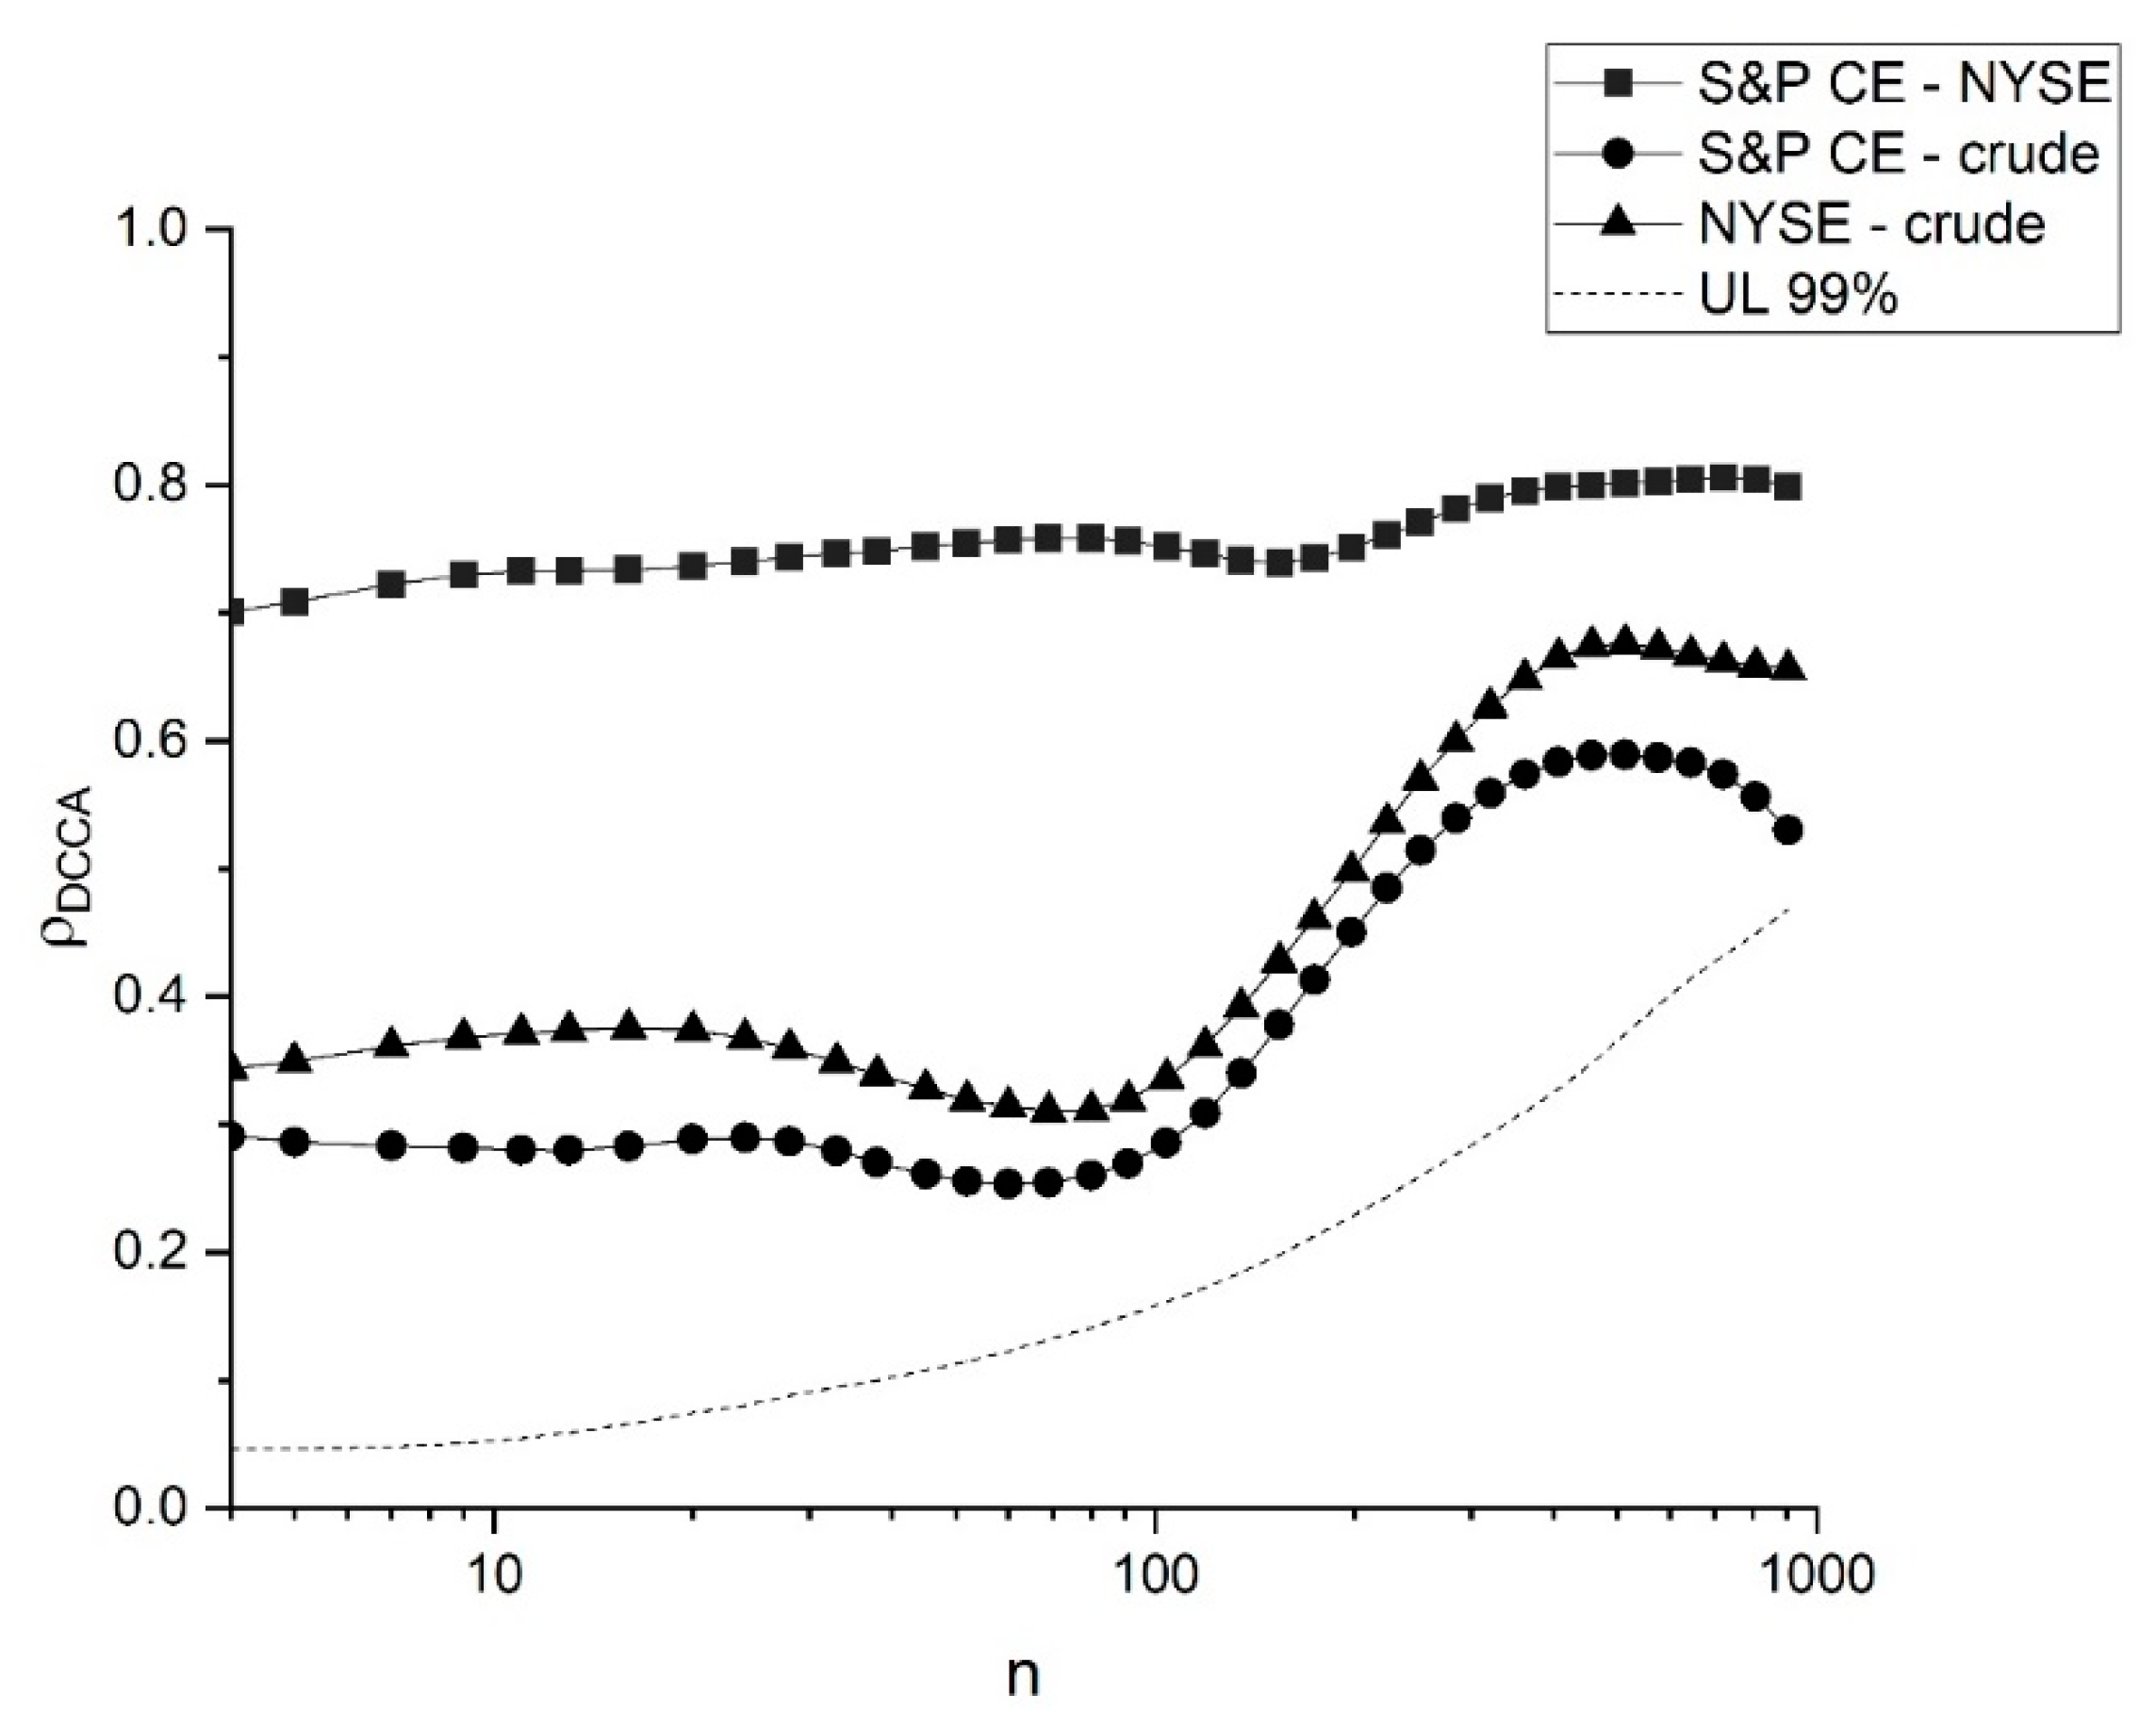
| Asset | DFA Exponent |
|---|---|
| S&P Global Clean Energy Index | 0.0036 |
| NYSE Composite Index | 0.0008 |
| WTI crude oil price | 0.0019 |
© 2020 by the authors. Licensee MDPI, Basel, Switzerland. This article is an open access article distributed under the terms and conditions of the Creative Commons Attribution (CC BY) license (http://creativecommons.org/licenses/by/4.0/).
Share and Cite
Ferreira, P.; Loures, L.C. An Econophysics Study of the S&P Global Clean Energy Index. Sustainability 2020, 12, 662. https://doi.org/10.3390/su12020662
Ferreira P, Loures LC. An Econophysics Study of the S&P Global Clean Energy Index. Sustainability. 2020; 12(2):662. https://doi.org/10.3390/su12020662
Chicago/Turabian StyleFerreira, Paulo, and Luís Carlos Loures. 2020. "An Econophysics Study of the S&P Global Clean Energy Index" Sustainability 12, no. 2: 662. https://doi.org/10.3390/su12020662
APA StyleFerreira, P., & Loures, L. C. (2020). An Econophysics Study of the S&P Global Clean Energy Index. Sustainability, 12(2), 662. https://doi.org/10.3390/su12020662