1. Introduction
Sustainability in global food systems is one of the most relevant goals in this century [
1]. If one considers agri-food production, this may be achieved by reducing trade-offs between productivity and sustainability, by choosing appropriate production methods [
2,
3]. On the other hand, fostering sustainable food consumption addresses the sustainability goal emphasizing the relevance of consumers’ choices. In this regard, over the years, changes in consumer behavior have been observed, with increasing number of individuals choosing more sustainable products in their daily dietary choice [
4]. This is due to the spreading awareness of environmental impacts of the agri-food sector [
5], as well as the growing interest for the health dimension of food related to nutrients intake [
6] and food safety [
7].
Within this scenario, consuming organic foods has become one of the most popular sustainable consumption options among the several alternatives to conventional food [
7,
8]. According to the latest available data, organic food consumption in the world continues to grow with a consolidated trend in every country [
9]. Organic produce counts on a market of 90 billion euros in the world, with the United States as the top market with 40 billion euros, followed by Germany (10 billion euros), France (7.9 billion euros), China (7.6 billion euros), and Italy (3.1 billion euros).
Studies undertaken in different countries, using different empirical strategies, identify common attributes associated with organic products [
10,
11,
12]. These attributes are, in order of relevance to consumers: healthiness [
13], food safety [
14], environmental protection [
15], animal welfare [
16], and the support of the local economy [
17,
18,
19]. Literature informing consumers’ choice for organic food states that, although the attitude of consumers for animal welfare and environmental consequences is a determining factor, the attitude and the awareness of health represent the main factor that influences willingness to pay (WTP) [
20]. Among others, Li and colleagues [
21] found that the higher is consumers’ concern about health, the greater is their willingness to pay for organic food. Furthermore, consumers who believe that organic food is healthier are less likely to purchase a conventional product, even if the organic product is more expensive than they expected [
22,
23]. According to Massey et al. [
24] and Krystallis and colleagues [
25], the most important arguments used to justify consumers’ price premium for organic foods is the health attribute recognized to organic food, followed by the nature conservation attribute and the perception that it has a good taste. Despite the extensive literature providing a list of the main reasons to buy organic food (e.g., [
10,
12]), to the best of our knowledge, the relative importance of organic food attributes to determine consumers’ preferences and WTP has received scant attention. Based on the studies reporting healthiness as the primary consumers’ motivation for purchasing organic foods (e.g., [
21,
22,
23,
24,
25,
26]), the current study seeks to assess the relative weight of this attribute among other recognized organic food attributes. More specifically, the following research objectives are addressed: 1) to find the contribution of the health attribute in determining consumers’ WTP a premium price for organic food products, and 2) to explore the drivers behind consumers’ WTP for the health attribute. Discovering the contribution of each attribute to consumers’ preferences would provide a better understanding of consumers’ valuation of organic food products, generating, as a consequence, managerial implications to support the further expansion of this sustainable market, thus contributing to the goal of more sustainable food systems.
The remainder of this paper unfolds as follows. Following this introduction,
Section 2 describes the empirical strategy adopted in the study. In
Section 3, findings are shown and discussed.
Section 4 concludes the work by providing implications and suggestions for future research.
2. Empirical Strategy
The empirical strategy adopted assumes to derive consumers’ preferences for the health attribute of the organic extra virgin olive oil (EVOO) by comparing this product with a counterpart conveying to consumers food healthiness as unique attribute, i.e., functional EVOO. Food products can be considered functional if, together with the basic nutritional impact, they have beneficial effects on one or more functions of the human organism, thus either improving the general and physical conditions or/and decreasing the risk of the evolution of diseases [
27]. In this regard, with the Reg. (UE) 432/2012, the EFSA (European Food Safety Authority, Parma, Italy) has authorized some functional health claims (hc) to apply to EVOO. The rationale to compare organic EVOO with its functional counterpart lies in the assumption that a functional product brings, somehow clearly isolated, the health attribute [
28,
29]. Therefore, by comparing the two products, it is possible to isolate consumers’ preference for the health attribute in the organic version. This empirical strategy was, to the best of our knowledge, never applied before in other studies.
A structured and closed online questionnaire on the consumption of EVOO was submitted. Data were collected between Spring and Winter 2018. Consumers were invited, via social networks and e-mail, to participate in the online survey. There were no restrictions except for being older than 18 years old (adult age in Italy) and a regular EVOO consumer (at least once per month). Though not statistically representative, a convenient sampling strategy allows to target a wide number of consumers.
The questionnaire was structured in four sections, lasting about 20 min. In the first section, information was collected regarding: frequency of EVOO consumption; whether respondents were responsible for the family’s olive oil purchases; the prevailing EVOO purchase channel (i.e., supermarket, specialty shop, direct selling by farmers, etc.); the most frequent consumption circumstance; the annual quantity consumed.
In the second section, WTP for EVOO was elicited by using an elicitation mechanism named Multiple Price List (MPL) [
30,
31]. Prices were presented as an array of ordered prices in a table (ranging from €7.50 to €12.00 at €0.50 intervals), one per row, and respondents asked to indicate whether they were willing to buy the specific product at each price level (i.e., yes/no). Respondents were informed of the average market price of conventional EVOO (€7 per liter).
It is known that food is not only a mean to satisfy basic needs, but plays a key role in preventing food-related diseases and improving physical and mental well-being [
32]. Therefore, in the third section, different measures have been used to understand whether the preference for the two versions of EVOO is influenced by extra-mercantile factors such as, attitudinal or psychological ones. To analyze constructs related to these factors, measurement scales developed in the field of generic foods can be used also in the domain of organic and functional products. First, Roininen et al. [
33] developed an attitude scale to measure general health interest (GHI) in food choices. As functional foods differ from conventionally healthy foods, this scale is expected to correlate positively, but only moderately, with attitudes towards functional foods. Second, the same authors developed a scale for measuring natural product interest (NPI) [
33]. Under the hypothesis that functional foods are considered by consumers as less natural than conventional ones [
34], this scale is expected to have a negative correlation with functional food attitudes. Third, in order to assess the interviewees’ specific attitudes towards functional products, a short version of the scale defined by Urala and Lähteenmäki [
34] was used. The dimension taken into consideration is defined “perceived reward for the use of functional foods” (FF REW) which includes statements expressing personal fulfillment derived from the use of such foods, intended as a tool to improve health and to take care of oneself. Fourth, NEP scale [
35] was used to predict environmental activism, environmentally significant behaviors, people’s real environmental behavior, awareness for environmental problems, and emotional connectedness to nature [
36]. These validated GHI, NPI, FF REW, and NEP attitude scales were collected by means of seven-point Likert scales. The different items taken into consideration were formulated in such a way that respondents with opposing attitudes provided different answers by positioning on the various anchors: 1 = totally disagree; 2 = disagree; 3 = partially disagree; 4 = uncertain; 5 = partially agree; 6 = agree; 7 = totally agree, so as to be able to detect and quantify the variables.
In the fourth and last section, socio-demographic information of participants is requested, namely: region of origin, age, gender, number of members and presence of minors in the family, educational qualifications, profession, and income of the interviewee.
Statistical Analysis
In order to find the relative contribution of the health attribute in an organic product, and then, to explore the drivers behind consumers’ willingness to pay for the health attribute, the data collected through the online platform questionnaire were processed in three distinct phases, using the Stata integrated statistical software.
In the first phase descriptive analysis of the data were conducted in order to define the socio-demographic characteristics of the sample and the consumer purchasing behavior; in the second phase the psycho-attitudinal scales were decoded; in the final part, after a description of the WTPs detected for the two types of EVOO, a Tobit Regression was performed to measure how the individual variables examined in the analysis can influence the price premium.
This stochastic model may be expressed by the following relationship:
| yt = Xtβ + ut | ifXtβ + ut > 0 |
| yt = 0 | ifXtβ + ut ≤ 0 |
| *** | t = 1,2,…, N |
where
is the number of observations,
is the dependent variable,
is a vector of independent variables,
β is a vector of unknown coefficients, and
is an independently distributed error term assumed to be normal, with zero mean and constant variance
ϑ². Thus, the model assumes that there is an underlying, stochastic index equal to (
) which is observed only when it is positive, and hence qualifies as an unobserved, latent variable.
3. Results and Discussion
3.1. Socio-Demographic Characteristics
The questionnaire was correctly filled in by 867 consumers, who are equally distributed in gender, with 441 females (51%) and 426 males (49%). The questionnaire was administered to adult consumers, and this resulted in a respondents’ age distribution ranging from 18 to 73 years, with an average age of 42 years.
Except for 11% of respondents who declared themselves single, the average number of members of the households was 3. Specifically, there were families of four components (34%), three components (23%), two components (20%), five components (11%), and more than five components (1%). Minors were present in 33% of the sampled households.
The highest percentage of the participants had a high education degree, while 32% of the sample had a high school degree, 47% had a bachelor’s degree, 18% had master or a doctorate and the remaining 3% had secondary school education. Further, 77% of the sample declared that their monthly income falls in the class between 1080 and 4320 euros, 10% ranked between less than 540 and up to 1080 euros, and the remaining 13% had income of between 4320 and over 8100 euros.
As for profession, 43.6% of respondents claimed to be public or private employees, in second place were the unemployed (18%) and freelancers (18%), followed by teachers with 8.5%, entrepreneurs with 7.3%, executives and pensioners with a percentage just over 4.6%.
Furthermore, 79% of the sample were concentrated in the South and Islands, compared to 21%, which includes the remaining regions, so the data are not representative of the Italian population. This distribution is part of the sample selection process, as we wanted to detect the largest number of respondents in the regions with the highest oil production and daily use in the normal daily diet. In fact, presented with the question “With what frequency do you consume EVOO?”, 90% of the interviewees declared “every day”.
For the evaluation of purchasing habits, the survey showed that 39% of consumers purchase EVOO personally, 35% together with another family member, and the remaining 26% said that EVOO’s purchasing manager was another family member. The descriptive analyzes of the sample are summarized in
Table 1.
3.2. Psycho-Attitudinal Scales
Attitude can be defined as “a psychological tendency that is expressed by evaluating a particular entity with some degree of favour or disfavour” [
37]. Because attitudes strongly affect food choice behavior, they can be used to explain consumers’ food choices by means of appropriate attitudinal scales [
38].
The used attitudinal scales concerning the general interest for health (GHI), for natural products (NPI), the perceived reward for the use of functional foods (FF REW), and the attitude towards the environment (NEP) have already been presented in the second section. Each interviewee expressed his or her degree of agreement or disagreement, positioning himself on the seven-point Likert scale for each individual statement reported (item). The average and standard deviation of each item were calculated and are shown in
Table 2,
Table 3,
Table 4 and
Table 5.
In order to verify the internal validity of the four used scales, the Cronbach’s alpha was computed. This coefficient is a statistical indicator used to measure the consistency or reliability of a score in psychological tests for a sample of subjects examined. It is calculated as follows:
where
k is the number of items;
is the variance of the total score and
is the variance of the items, for the sample of individuals under examination.
In general, high reliability values are to be considered as those greater than or equal to 0.65; therefore, from the results reported in
Table 6 relating to the 4 scales, we can confirm a good internal consistency for the different items.
From the correlation analysis, it turned out that the four scales are interrelated (especially GHI and NPI, with 57% correlation). Except for the NEP scale, which turns out to be inversely related to the others since it presents reverse items, all the scales show direct proportionality, that is, as one increases, the other considered increases (
Table 7).
3.3. Willingness to Pay
The growing awareness of the link between food and health has led consumers to perceive and associate an additional value to those products that lead back to health attributes. The questionnaire included, after providing information on the health value of the organic and functional EVOO, a question through which it was asked to express the willingness to pay a price premium for the two types of EVOO.
As mentioned in
Section 2, the elicitation method adopted in the study is the Multiple Price List (MPL). In the context of eliciting willingness to pay for some good, MPL confronts the interviewee with an array of ordered prices in a table, one per row, and asks him/her to indicate “yes” or “no” for each price. WTP values were based on the average calculated on the highest price for which the respondent indicated “yes” and the first price for which he/she responded “no”. It was also allowed an opt-out. In the event, a price premium of zero was associated.
Findings reveal that 76.7% of sampled consumers are willing to pay a premium price for the organic EVOO, against the remaining 23.3% who do not believe that the health attribute of organic EVOO justifies a premium price. For the functional EVOO, 67.6% of respondents declared to be willing to pay a premium price for its health claim, against the remaining 32.4%.
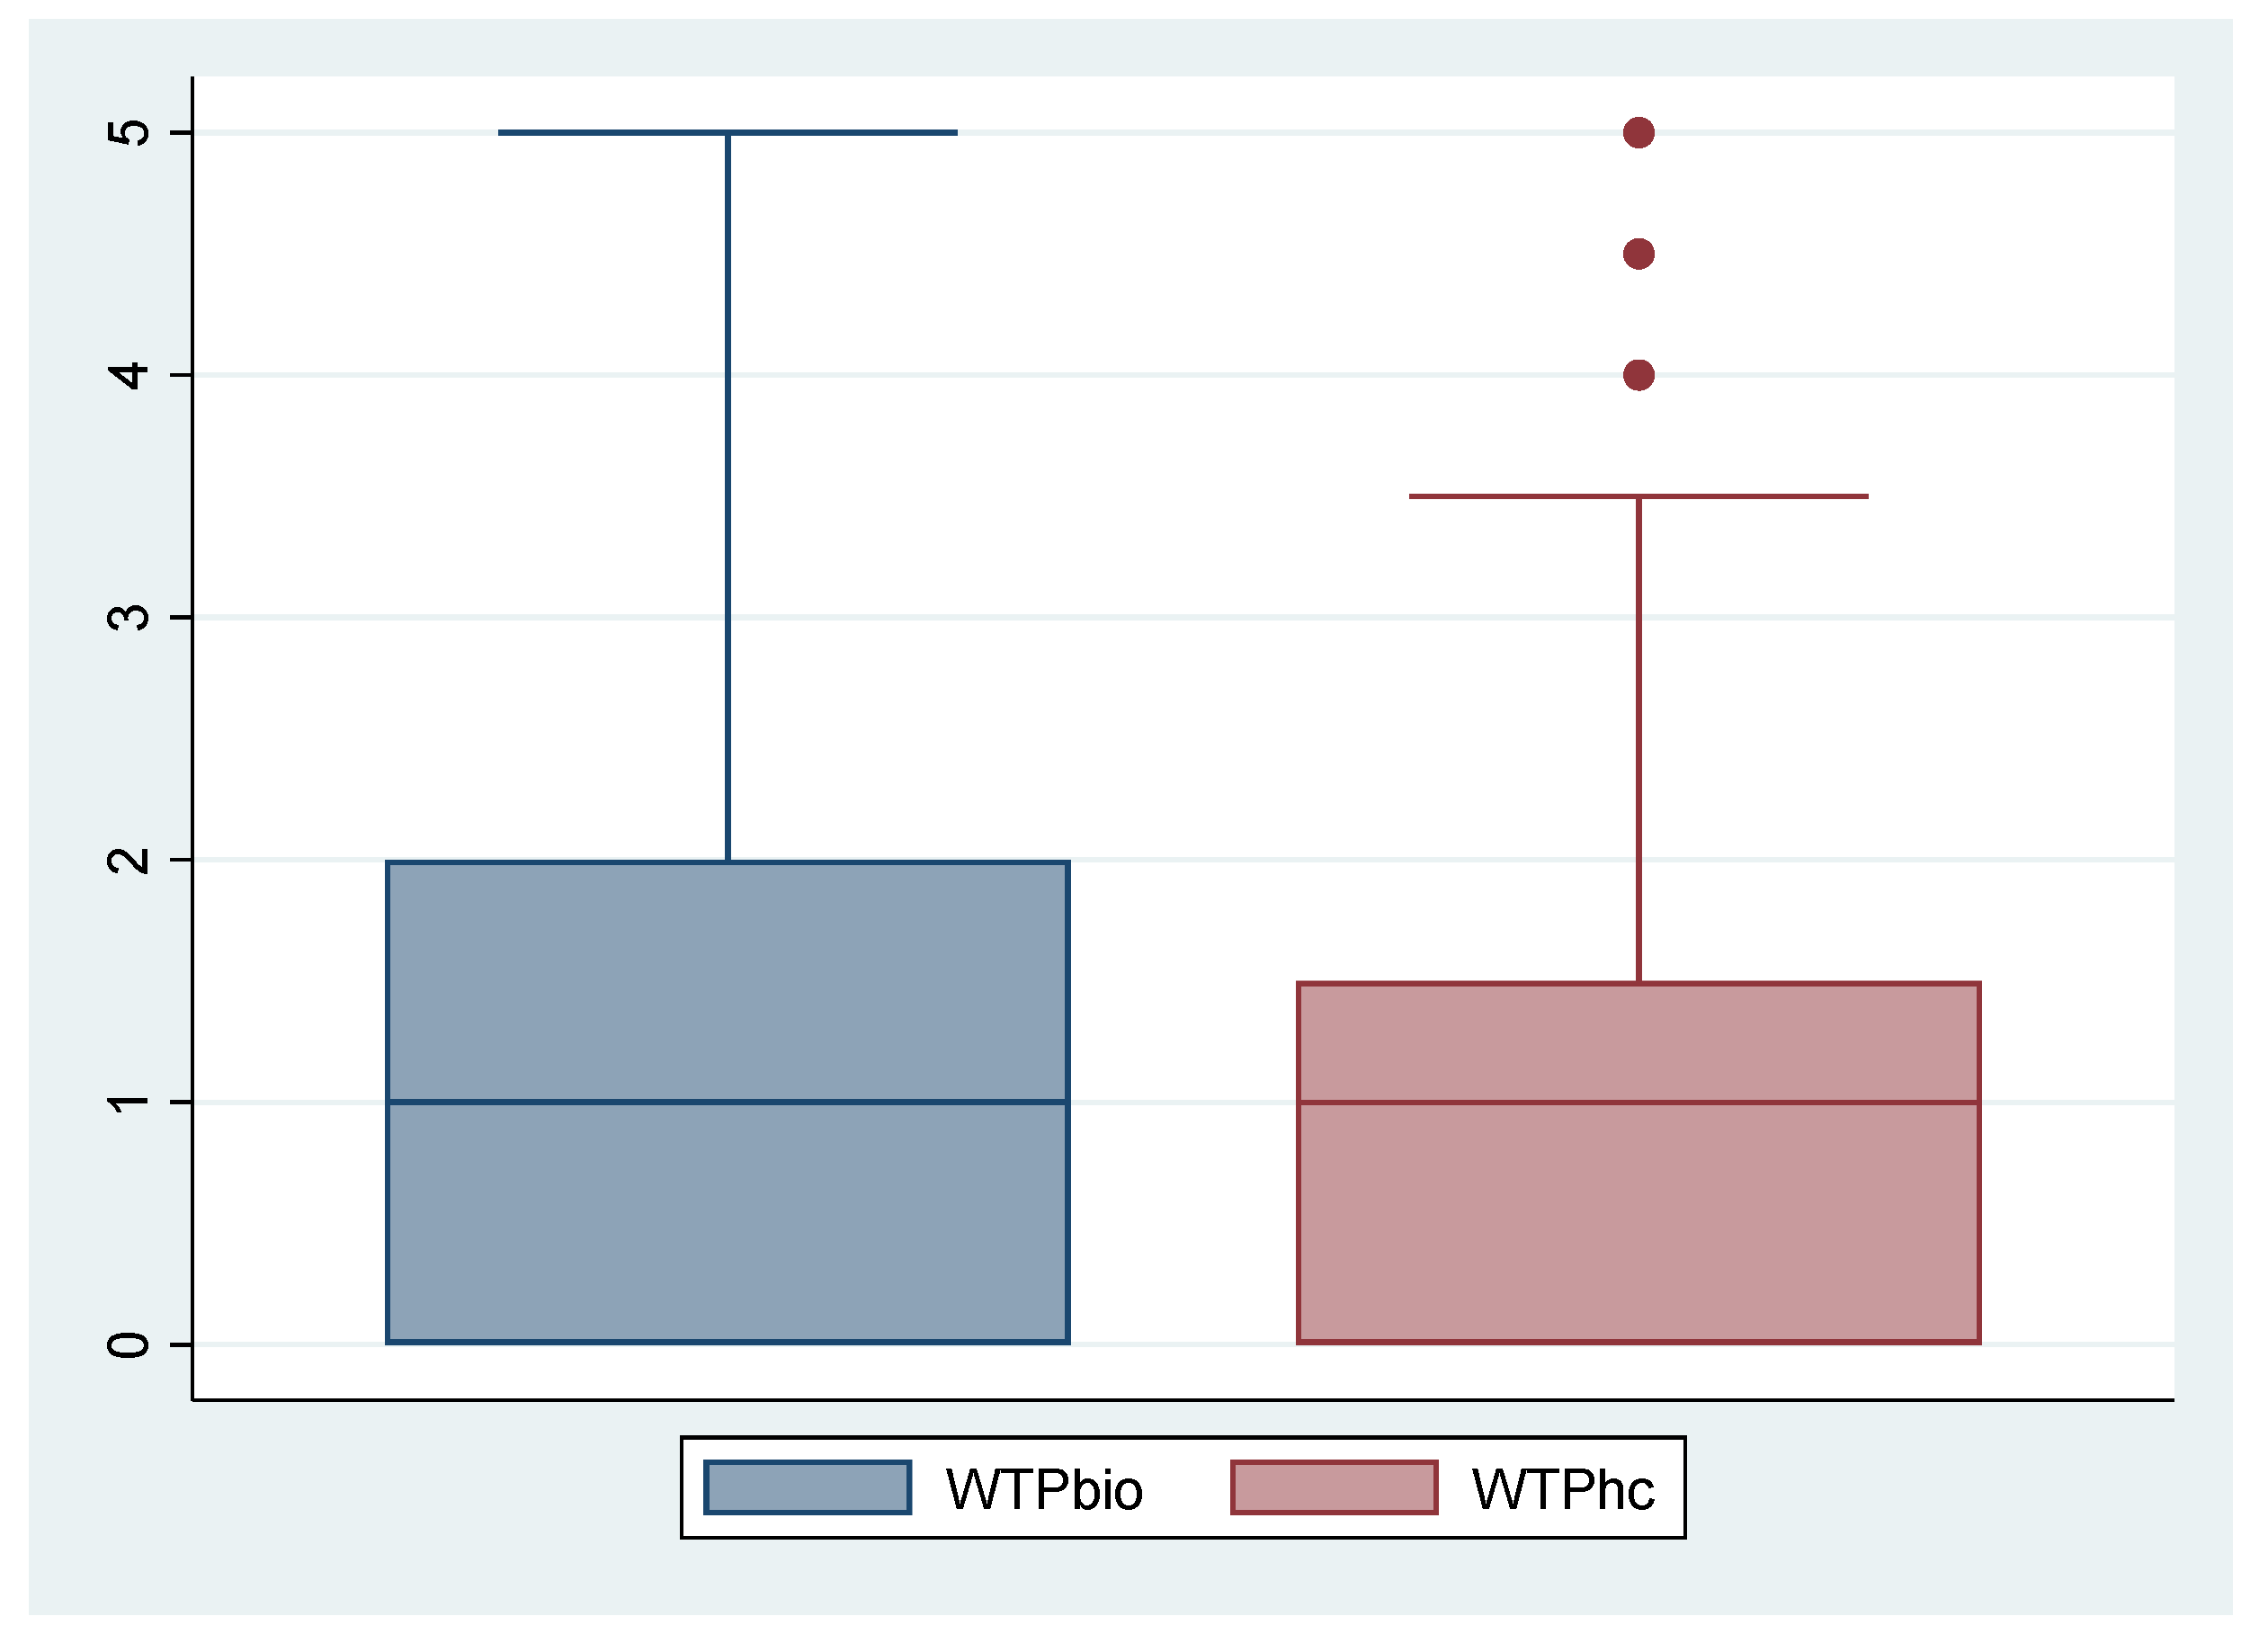
The averages of the price premium for the two types of EVOO were calculated. The willingness to pay a price premium for organic EVOO (WTPbio) is €1.405, while that for functional EVOO (WTPhc) is €1.109 (
Table 8).
Figure 1 and
Figure 2 show WTPbio and WTPhc Kdensity and box-plot.
Parametric (
t-test) [
39] and non-parametric tests (Wilcoxon tests) [
40] demonstrate that the value of WTPbio is significantly different and greater than that of WTPhc, with an average delta of about €0.30. This delta represents the value of all attributes associated to organic food, once that the health attribute is isolated by difference between the WTP of the two EVOO versions. Therefore, and answering to the first research question of the current paper, the contribution of the health attribute to determine the average premium price for organic EVOO is €1.109 (78.9% of its total premium price), corresponding to the respondents’ average premium price for the health claim of functional EVOO (WTPhc).
3.4. Drivers behind Consumers’ WTP for the Health Attribute
It has been previously emphasized that consumers’ choice depends on a multitude of factors. A Tobit regression model having as dependent variable the relative contribution of the EVOO health attribute (euro amount of WTP for the health attribute) and as regressors the other variables collected in the questionnaire—i.e., the socio-demographic characteristics and psycho-attitudinal scales—was implemented to find the main drivers of consumer’ willingness to pay for the EVOO health attribute.
Table 9 shows the estimated coefficients, with relative statistical significance, for the model. Only statistically significant variables are reported.
As the Tobit regression model shows, the expected value of
y in the model is:
where
is a vector of independent variables,
β is a vector of unknown coefficients, z is the unit normal density,
is the cumulative normal distribution function and
is the normal probability density function. A Tobit model is a regression in which the observed range of the dependent variable is censored/truncated in some way. In the presence of a censored dependent variable, usual ordinary least squares regression does not yield consistent parameter estimates, while Tobit estimates are consistent [
41].
In
Table 10, marginal effects are shown. They are the variation of the dependent variable y when one explanatory variable x varies of one unit, considering all the other x variables to the average; if the independent variable x is a dummy, the marginal effect indicates the variation in the dependent variable y, in the passage of the x variable from 0 to 1.
What emerges from the analysis is the relevance of the general interest scale for health (GHI), the reward scale perceived by the consumption of functional products (FF REW), monthly income, presence of minors, age, and gender. In particular, it is possible to notice that the two scales and the monthly income are positively correlated (+0.11, +0.24 and +0.04, respectively) with the dependent variable and therefore as the value of these regressors increases, the average of the dependent variable tends to increase. On the contrary, the negative coefficients of the presence of minors, gender, and age variables suggest that as they increase, the dependent variable tends to decrease. The data elaboration shows that being a female reduces WTP for healthy attribute of organic EVOO by 0.19 euro/L relative to male. The presence of children in households decreases WTP for the same attribute by 0.15 euro/L, and as age increases the WTP decreases by 0.004 euro/L.
These results are only partially in line with previously published literature. For example, Gunduz and colleagues [
42] found that monthly income is positively correlated with the WTP for organic chicken, while Krystallis and colleagues [
25] argue that income affects mainly the quantity of organic products bought by households and not their willingness to buy them.
The negative effect of being a woman in determining WTP for the health attribute of organic EVOO contradicts existing literature; this is probably due by the fact that, even if women are more careful and aware of the health dimension of their food choices, men are generally inclined to pay a higher price premium than women [
43].
Finally, in agreement with Charatsari and Tzimitra-Kalogianni [
44,
45] and Magnusson et al. [
46], the age factor does not seem to play an important role, with younger consumers showing only a slightly higher WTP (as in our results where age is not significant).
4. Conclusions
Organic food is peculiar since it is associated by consumers with an array of attributes, among which the perceived positive impact on human health has been shown as the main one to drive consumer preferences [
47]. Informed by these evidences and adopting extra-virgin olive oil (EVOO) as contextual example, the current research was aimed to evaluate the relative contribution of the health attribute to determine consumers’ preference and WTP for organic products and to explore the factors behind consumers’ WTP for the health attribute. To achieve this goal, an online survey of 867 consumers of Italian EVOO was conducted, in which a multiple price list (MPL) mechanism was adopted to elicit consumers’ WTP. WTP was elicited for organic EVOO and for a functional counterpart in order to isolate the health attribute of the organic product.
Results show the fundamental role of the health attribute to generate consumers’ preferences for organic EVOO. Particularly, our findings show that the relative contribution of the health attribute amounts to about four fifths of the total value attributed by consumers to the organic EVOO. It was also found that the willingness to pay for the health attribute under study is positively influenced by the consumers’ interest in health, the perceived personal fulfillment generated by the consumption of functional products and monthly income, while gender negatively affected the consumer’s willingness to pay.
It is recognized that food is one of the three consumption domains responsible for the largest share of environmental impact [
48] and that, at the same time, environmental sustainability is a fundamental determinant of human health [
49,
50]. In this regard, global calls for sustainable food systems solicit market strategies to foster the consumption of food products coming from sustainable alternatives to conventional agriculture [
51,
52,
53]. Among the several sustainable alternatives to conventional food production, certified organic foods undoubtedly represent those that have gained greatest momentum.
The new EU regulation on organic production recognizes that “Organic production is an overall system of farm management and food production that combines the best environmental and climate action practices, a high level of biodiversity, and the preservation of natural resources” [
54]. Thus, fostering organic food consumption by studying the drivers that guide consumer preferences for this category of products is a crucial strategy to preserve environmental sustainability [
55]. Based on this assumption, this study was designed with the aim to gain more insights on consumers’ perception of organic food characteristics, as well as on the main drivers of organic food purchase.
Further research is expected to follow the lead of our study to make findings generalizable to the reference population. The current study did not seek statistical representativeness of the sample. Such a strategy implies that the data generating process does not allow to infer the unknown population. If known, that population would be made of adult Italian regular consumers of EVOO. Based on this, we had no chance for a comparison with the whole population, even though we believe it would make results more robust with a wider external validity. Moreover, consumers with different demographic profiles, such as age, education background, occupation, and income should be considered. As follow up of this research, another organic food product should be considered to validate our findings, as it would also be relevant to evaluate the relative weight of other attributes of organic products.


 ,
, 


