Modeling Impacts of Speed Reduction on Traffic Efficiency on Expressway Uphill Sections


Abstract
1. Introduction
2. Methods
2.1. Variable Definition
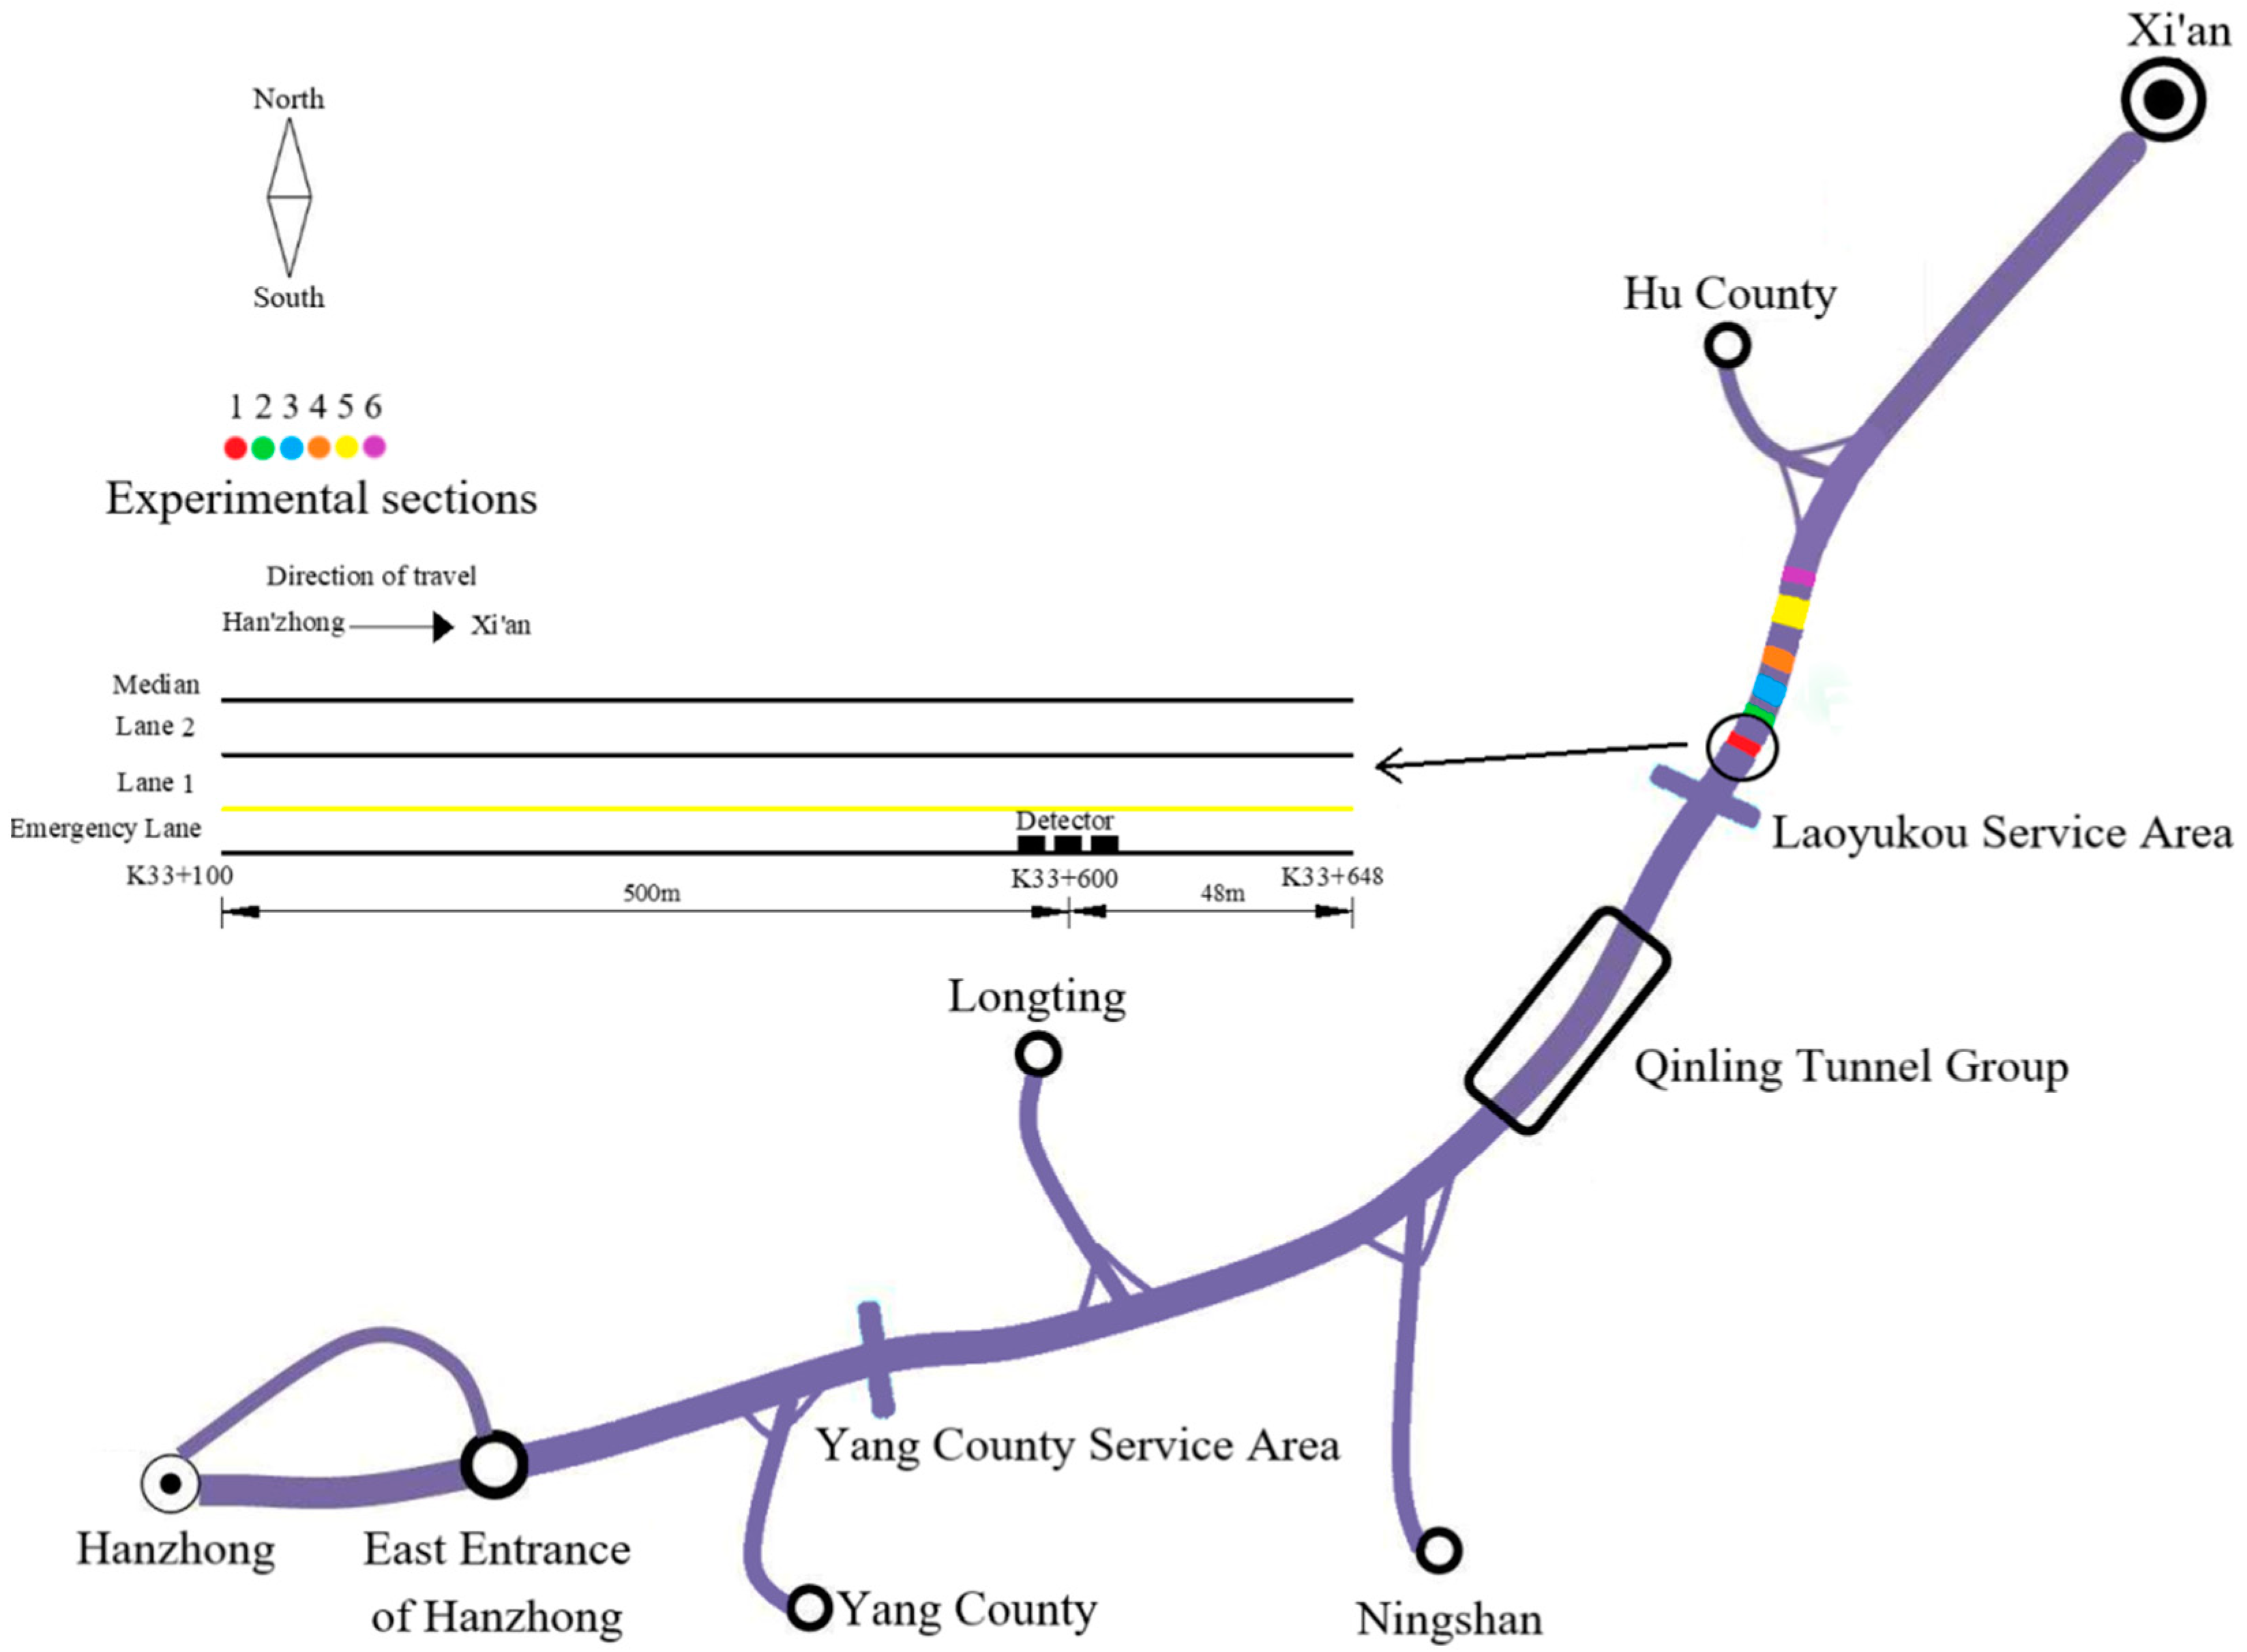
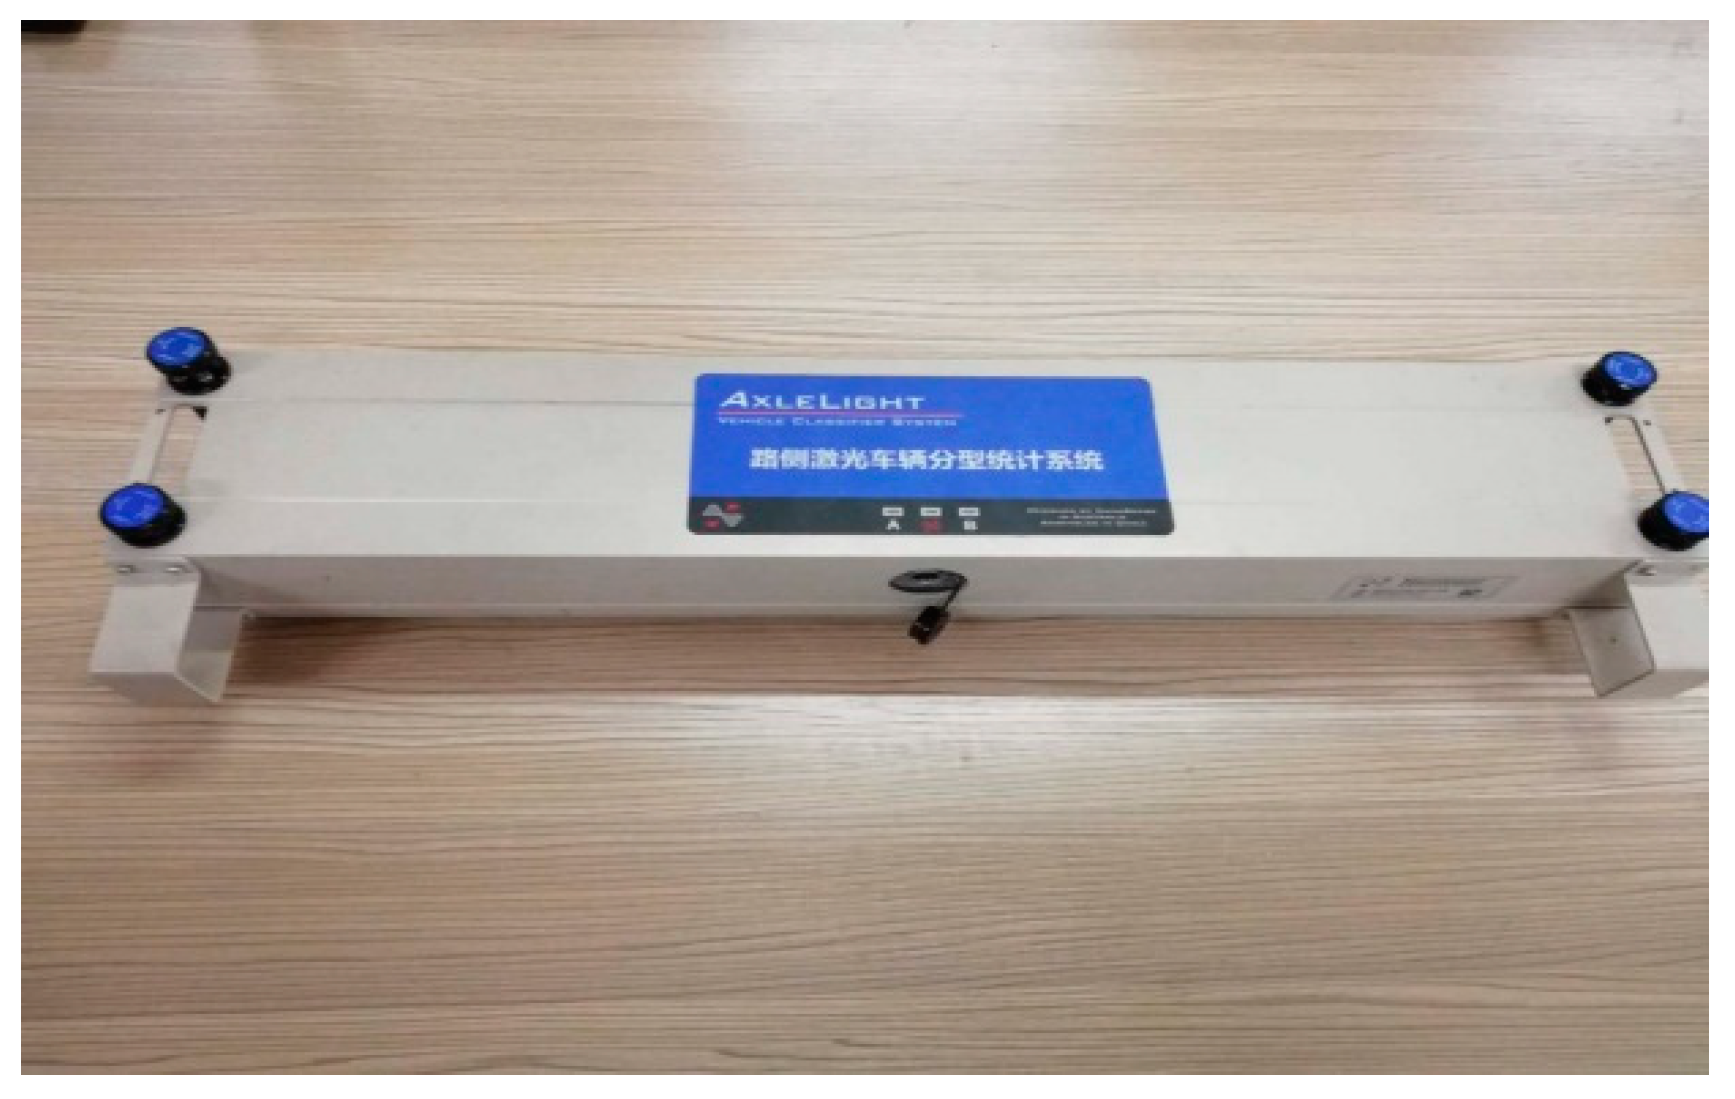
2.2. Field Experiment
2.3. Data Processing
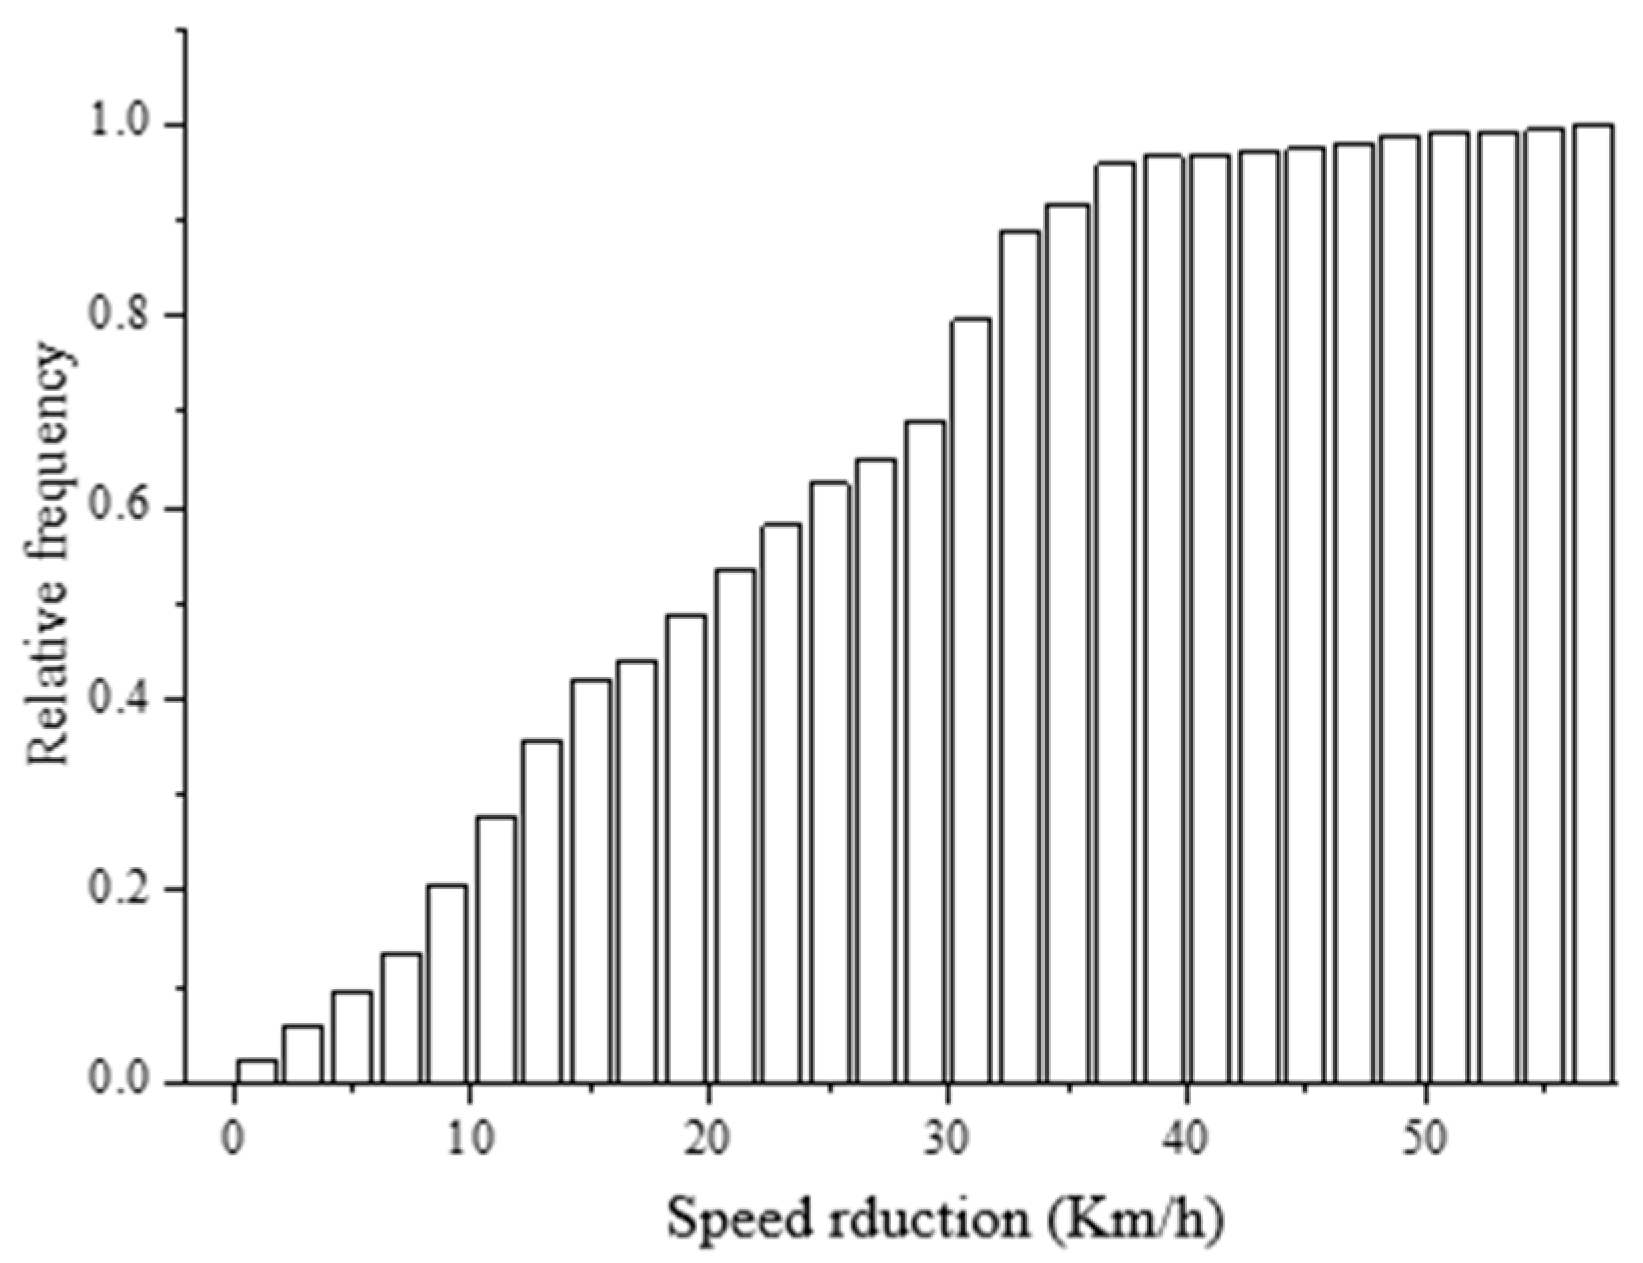
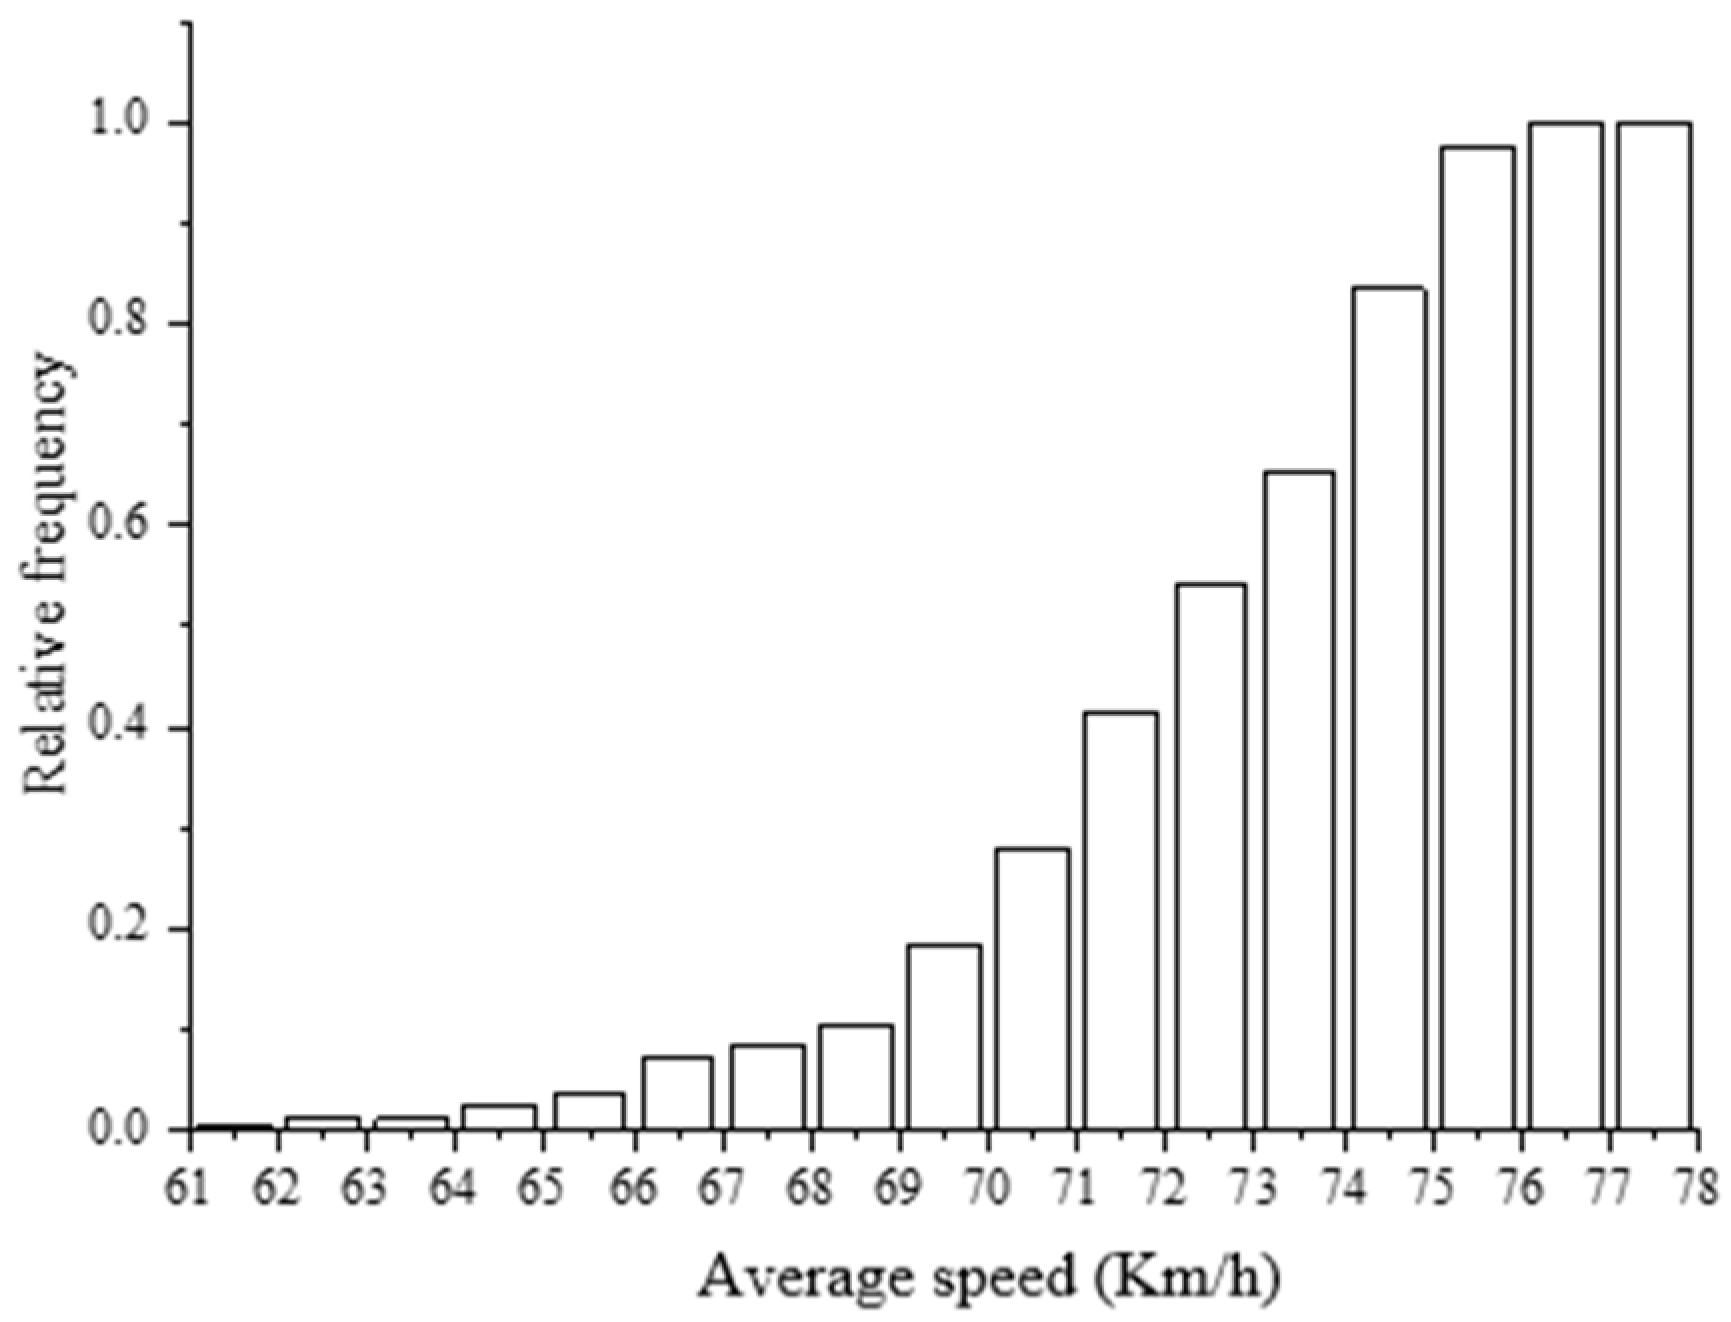
3. Results
4. Discussion
5. Conclusions
Author Contributions
Funding
Acknowledgments
Conflicts of Interest
References
- Ke, X.; Shi, L.; Guo, W.; Chen, D. Multi-Dimensional Traffic Congestion Detection Based on Fusion of Visual Features Convolutional Neural Network. IEEE Trans. Intell. Transp. Syst. 2018, 6, 2157–2170. [Google Scholar] [CrossRef]
- Torbic, D.J.; Harwood, D.W.; Richard, K.R.; Glauz, W.D. Determining critical length of grade for geometric design of vertical alignments. Transp. Res. Rec. 2004, 1881, 36–45. [Google Scholar] [CrossRef]
- Wang, F.; Chen, Y.; Guo, J.; Yu, C.; Stevenson, M.; Zhao, H. Middle-aged Drivers’ subjective categorization for combined alignments on mountainous freeways and their speed choices. Accid. Anal. Prev. 2019, 127, 80–86. [Google Scholar] [CrossRef]
- Pan, B.H.; Sun, Y.Q.; Cao, J. Research on gentle slope design parameters of continuous uphill slope section of mountainous highway based on speed recovery. Highway 2014, 2, 77–84. [Google Scholar]
- Wang, Y.; Luo, Y.; Chen, F. Interpreting risk factors for truck crash severity on mountainous freeways in Jiangxi and Shaanxi, China. Eur. Transp. Res. Rev. 2019, 11, 26. [Google Scholar] [CrossRef]
- Willey, W.E. Survey of uphill speeds of trucks on mountain grades. Highw. Res. Board Proc. 1950, 29, 304–310. [Google Scholar]
- AASHTO. A Policy on Geometric Design of Rural Highways; American Association of State Highway and Transportation Officials: Washington, DC, USA, 2011. [Google Scholar]
- Glennon, J.C. An evaluation of design criteria for operating trucks safely on grades. Highw. Res. Rec. 1970, 312, 93–112. [Google Scholar]
- Brilon, W. Traffic Flow Analysis beyond Traditional Methods; Transportation Research Board and National Research Council: Washington, DC, USA, 2000; pp. 26–41. [Google Scholar]
- Lave, C. Speeding, coordination, and the 55 mph limit. Am. Rev. 1985, 75, 1159–1164. [Google Scholar]
- Garber, N.; Ehrhart, A. The effect of speed, flow, and geometric characteristics on crash frequency for two-lane highways. Transp. Res. Rec. 2000, 1717, 76–83. [Google Scholar] [CrossRef]
- McCarthy, P. Effect of speed limits on speed distributions and highway safety: A survey of the literature. In Managing Speed: Review of Current Practice for Setting and Enforcing Speed Limits; Special Report 254; Transportation Research Board: Washington, DC, USA, 1998; pp. 277–358. [Google Scholar]
- Shinar, D. Speed and crashes: A controversial topic and an elusive relationship. In Managing Speed: Review of Current Practice for Setting and Enforcing Speed Limits; Special Report 254; Transportation Research Board: Washington, DC, USA, 1998; pp. 221–276. [Google Scholar]
- Wang, H.; Wang, W.; Chen, X.; Chen, J.; Li, J. Experimental features and characteristics of speed dispersion in urban freeway traffic. Transp. Res. Rec. J. Transp. Res. Board 2007, 1999, 150–160. [Google Scholar] [CrossRef]
- Chung, C.; Recker, W. Characteristics of speed dispersion and its relationship to fundamental traffic flow parameters. Transp. Plan. Technol. 2014, 37, 581–597. [Google Scholar] [CrossRef]
- Wang, H.; Wang, W.; Chen, J. Effects of Speed Dispersion on Capacity of Freeways. J. Beijing Univ. Technol. 2010, 10, 1389–1395. [Google Scholar]
- Zhong, L.; Sun, X.D.; Chen, Y.S.; Zhang, J.; Zhang, G.W. The relationships between crash rates and average speed difference between cars and large vehicles on freeway. J. Beijing Univ. Technol. 2007, 33, 185–188. [Google Scholar]
- Hou, D.; Han, J.; Sun, X.; He, Y. Study on the relationship between speed difference and crash Rate on freeway. In Proceedings of the Tenth International Conference of Chinese Transportation Professionals, Beijing, China, 4–8 August 2010; pp. 354–359. [Google Scholar]
- Kockelman, K.M.; Ma, J. Freeway Speeds and Speed Variations Preceding Crashes, Within and Across Lanes. Res. Agric. Appl. Econ. 2007, 200, 43–61. [Google Scholar] [CrossRef]
- Davis, G.A. Is the claim that ‘variance kills’ an ecological fallacy? Accid. Anal. Prev. 2002, 34, 343–346. [Google Scholar] [CrossRef]
- Ministry of Transport of the People’s Republic of China. Design Specification for Highway Alignment; GTG D20-2017; Ministry of Transport of the People’s Republic of China: Beijing, China, 2017.
- Zheng, K.; Rong, J.; Ren, F. Analysis of relation between curve’s radius and steering speed on expressway. J. Highw. Transp. Res. Dev. 2003, 20, 28–30. [Google Scholar]
- Ota, H. Distance headway behavior between vehicles from the viewpoint of proxemics. Iatss Res. 1994, 18, 5–14. [Google Scholar]
- Winsum, W.V.; Heino, A. Choice of time-headway in car-following and the role of time-to-collision information in braking. Ergonomics 1996, 39, 579–592. [Google Scholar] [CrossRef]
- Taiebmaimon, M.; Shinar, D. Minimum and comfortable driving headways: Reality versus perception. Hum. Factors 2001, 43, 159–172. [Google Scholar] [CrossRef]
- Transportation Research Board. Highway Capacity Manual 2010; Transportation Research Board: Washington, DC, USA, 2010. [Google Scholar]
- Standardization Administration of People’s Republic of China (SAC). Safety Specifications for Power-driven Vehicles Operating on Roads; GB 7258-2012; Standardization Administration of People’s Republic of China (SAC): Beijing, China, 2012. [Google Scholar]
- Sil, G.; Nama, S.; Maji, A.; Maurya, A.K. Effect of horizontal curve geometry on vehicle speed distribution: A four-lane divided highway study. Transp. Lett. Int. J. Transp. Res. 2019, 1942–7867. [Google Scholar] [CrossRef]
- Yagar, S.; Aerde, M.V. Geometric environmental effects on speeds of 2-lane highways. Transp. Res. Part A (Gen.) 1983, 17, 315–325. [Google Scholar] [CrossRef]
- Cherry, C.R.; Adelakun, A.A. Truck driver perceptions and preferences: Congestion and conflict, managed lanes, and tolls. Transp. Policy 2012, 24, 1–9. [Google Scholar] [CrossRef]


| Section | Station | Slope (%) | Slope Length (m) | Radius (m) |
|---|---|---|---|---|
| 1 | K33 + 100–K33 + 648 | 1.34 | 548 | 2600 |
| 2 | K39 + 217–K39 + 633 | 2.00 | 416 | 2460 |
| 3 | K40 + 600–K41 + 220 | 3.10 | 620 | 1175 |
| 4 | K43 + 250–K43 + 750 | 3.90 | 500 | ∞ |
| 5 | K51 + 620–K52 + 740 | 2.582 | 1120 | 1000 |
| 6 | K53 + 691–K54 + 341 | 4.50 | 650 | ∞ |
| Number | Speed Reduction (km/h) | Average Speed (km/h) | Number of Vehicles (veh) | Number of Heavy Trucks (veh) |
|---|---|---|---|---|
| 1 | 1.41 | 65.16 | 18 | 3 |
| 2 | 6.82 | 75.12 | 16 | 4 |
| 3 | 13.67 | 72.86 | 17 | 2 |
| 4 | 19.20 | 73.23 | 19 | 3 |
| 5 | 24.93 | 67.19 | 16 | 2 |
| 6 | 2.31 | 66.42 | 16 | 3 |
| 7 | 8.23 | 69.17 | 19 | 4 |
| 8 | 14.47 | 77.18 | 18 | 3 |
| 9 | 20.84 | 73.28 | 20 | 2 |
| 10 | 26.48 | 69.89 | 19 | 3 |
| Number | Speed Reduction (km/h) | Average Speed (km/h) | Number of Vehicles (veh) | Number of Light Trucks (veh) |
|---|---|---|---|---|
| 1 | 3.54 | 88.73 | 17 | 3 |
| 2 | 3.58 | 74.94 | 18 | 4 |
| 3 | 4.01 | 84.28 | 17 | 2 |
| 4 | 4.08 | 82.21 | 19 | 3 |
| 5 | 5.93 | 78.06 | 16 | 2 |
| 6 | 5.97 | 83.67 | 20 | 3 |
| 7 | 6.38 | 83.04 | 17 | 4 |
| 8 | 6.46 | 82.00 | 18 | 3 |
| 9 | 7.92 | 81.59 | 19 | 2 |
| 10 | 3.65 | 86.69 | 20 | 3 |
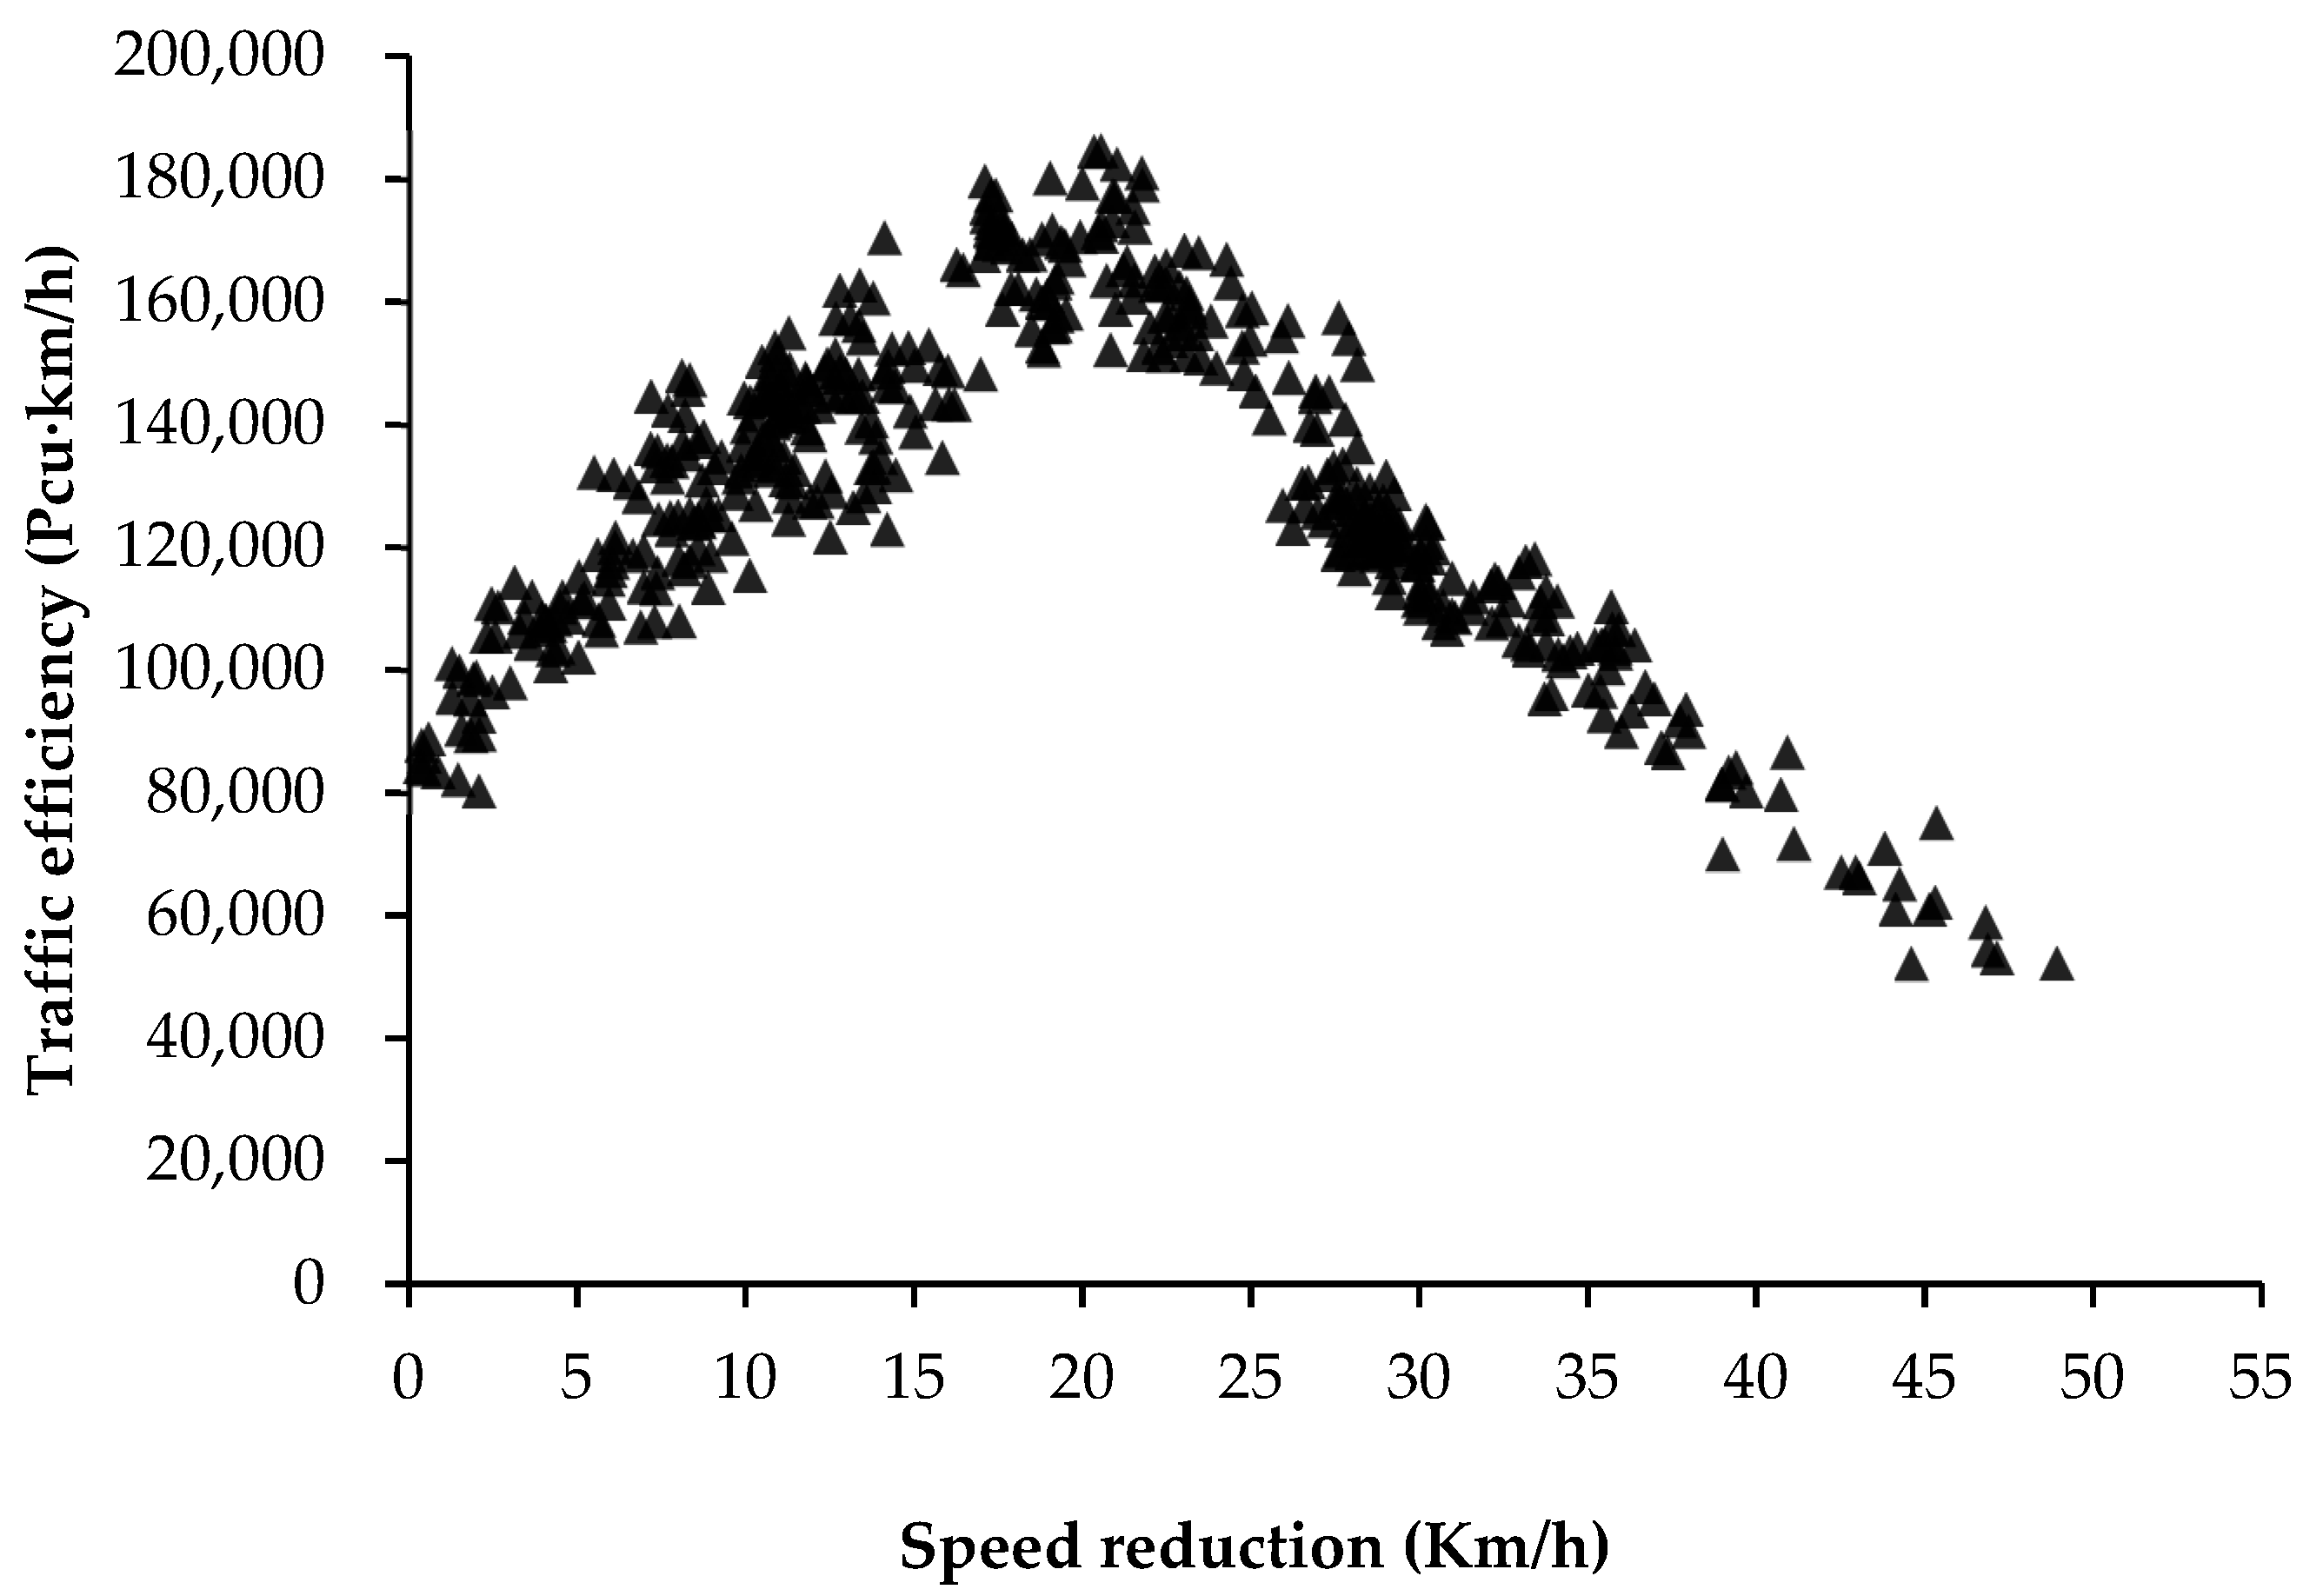
| Model | Type | R2 | Sig. F | Constant | a | b | c |
|---|---|---|---|---|---|---|---|
| 1 | Quadratic | 0.754 | 0.000 | 90036.718 | 6726.495 | −160.016 | — |
| 2 | Cubic | 0.803 | 0.000 | 71297.478 | 10759.106 | −364.327 | 2.852 |
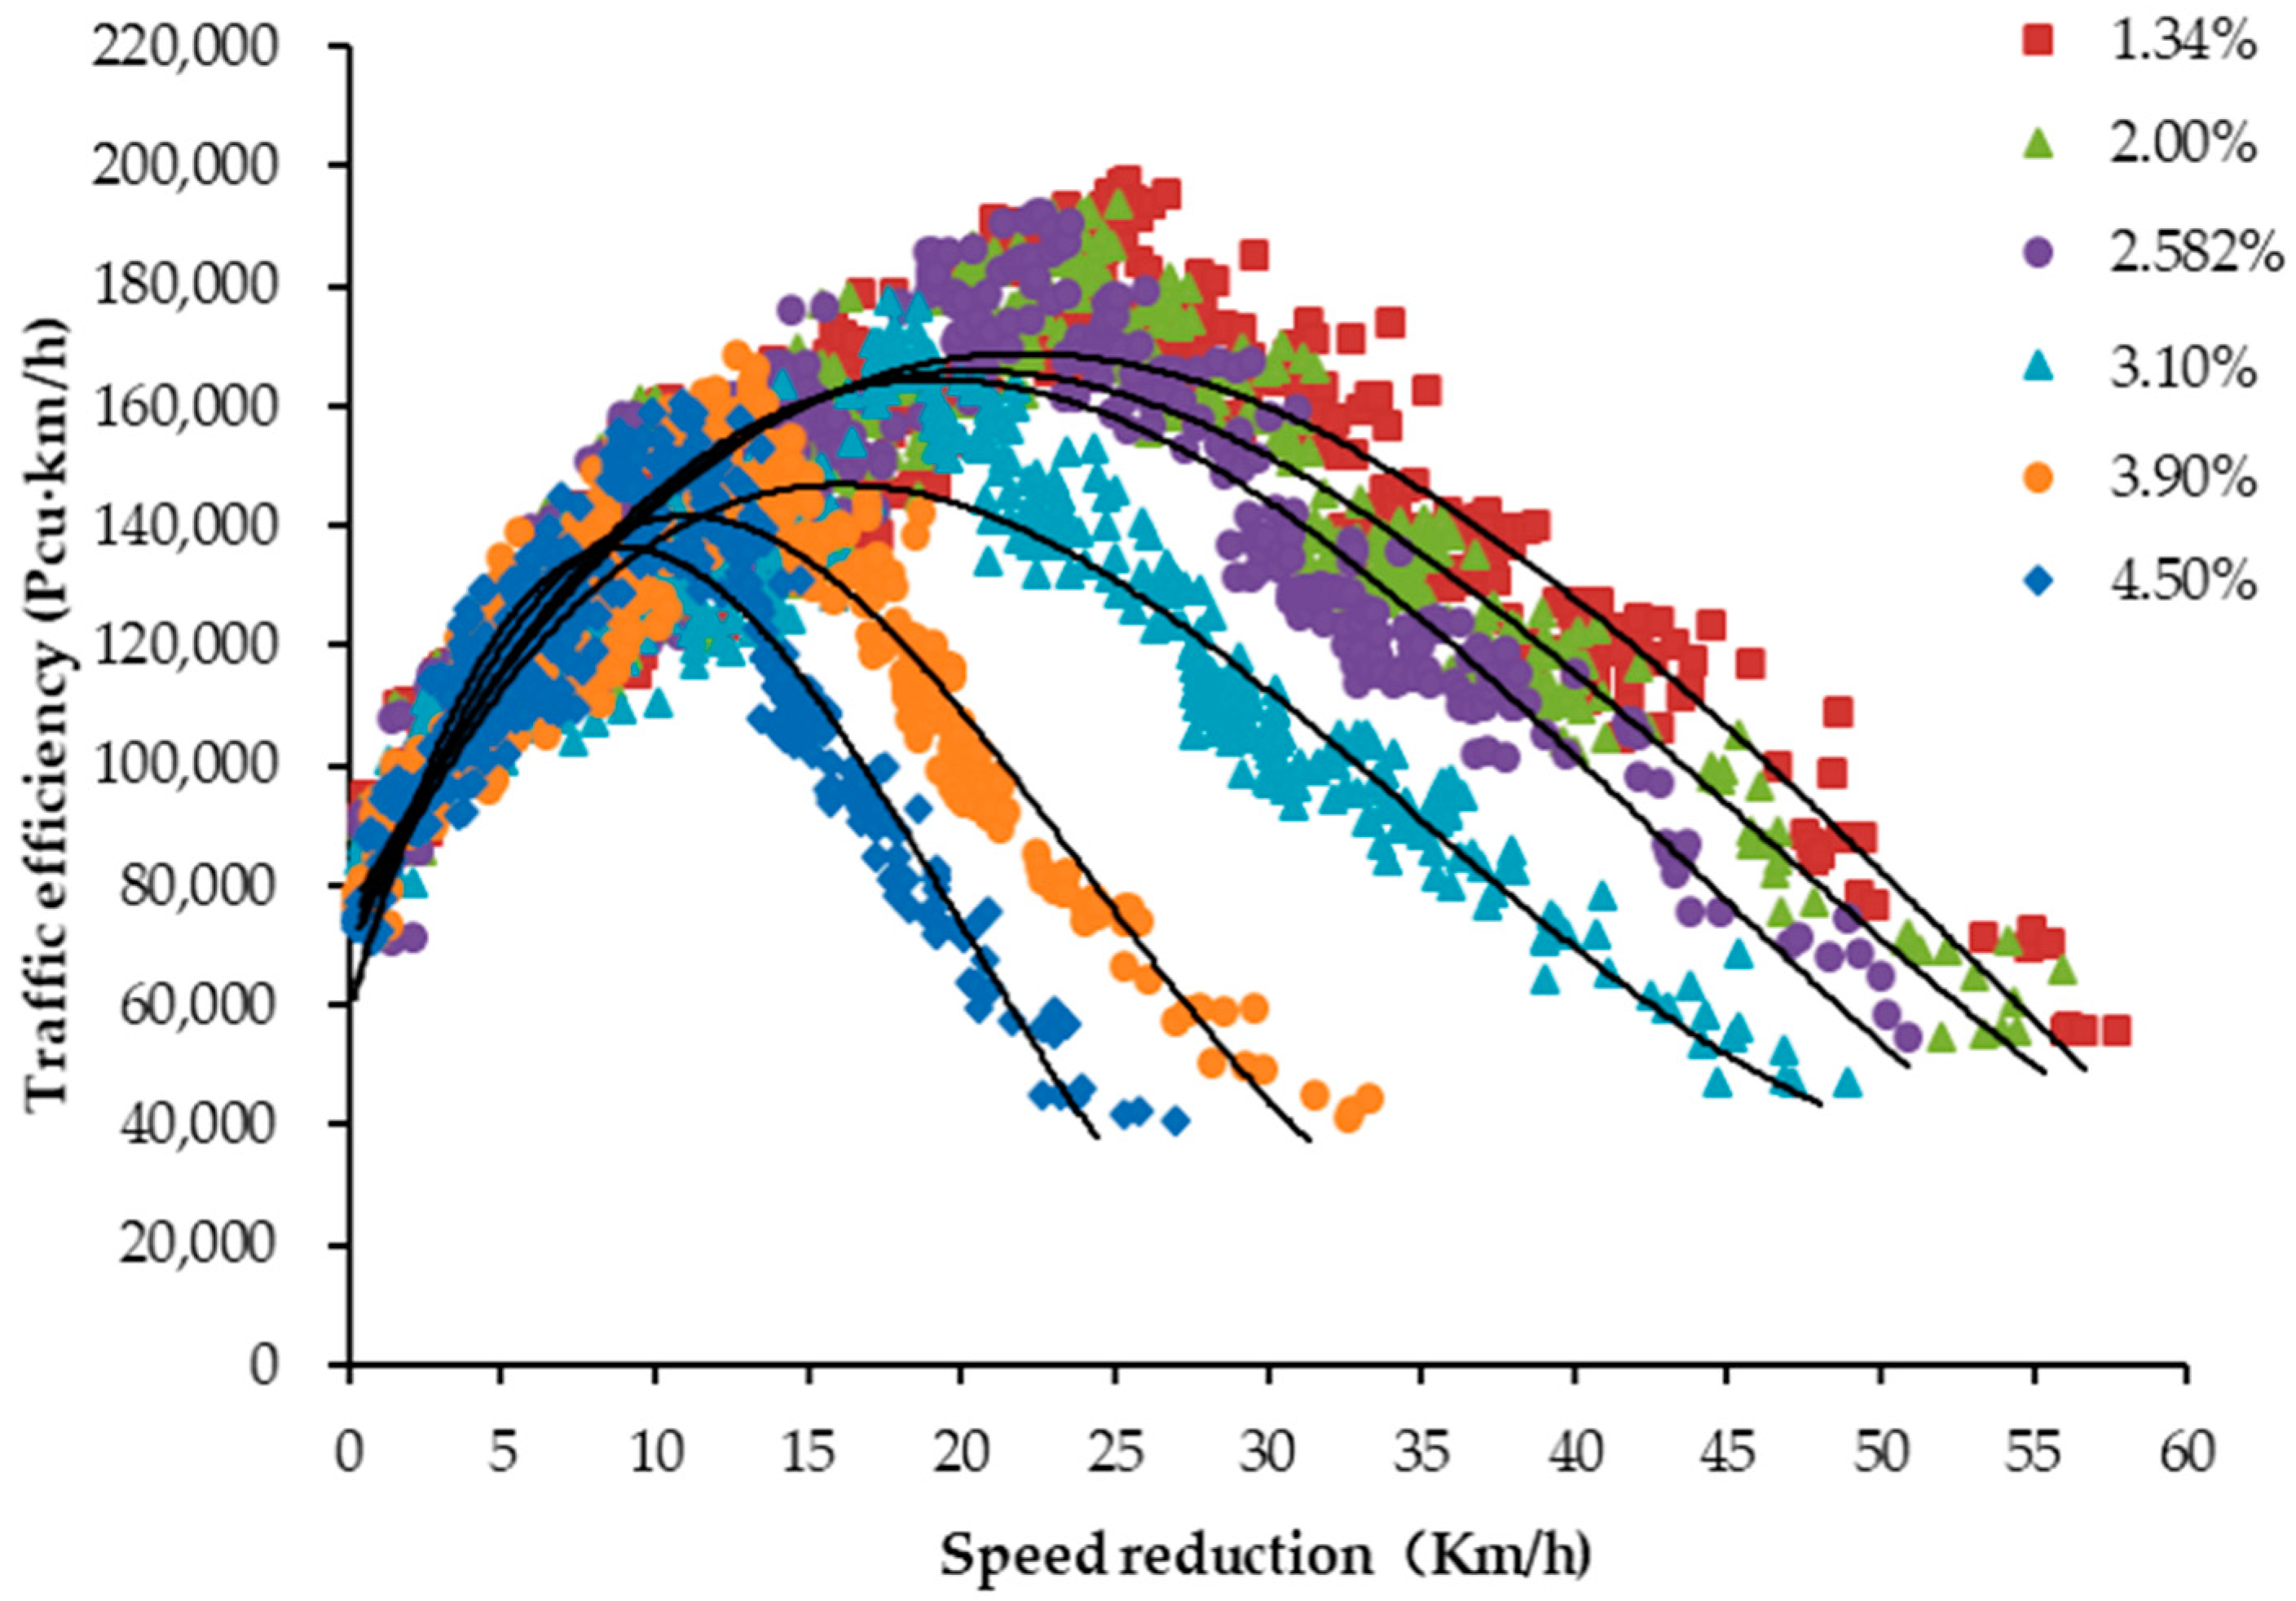
| Vertical Slope | Type | R2 | Regression Model |
|---|---|---|---|
| 1.34% | Quadratic | 0.784 | E = 90653.756 + 6330.856 − 131.982 |
| Cubic | 0.816 | E = 75339.487 + 9257.203 − 263.6372 + 1.6263 | |
| 2.00% | Quadratic | 0.775 | E = 93566.028 + 6040.980 − 133.8282 |
| Cubic | 0.831 | E = 72926.802 + 10056.760 − 316.6542 + 2.2953 | |
| 2.582% | Quadratic | 0.754 | E = 90036.718 + 6726.495 − 160.0162 |
| Cubic | 0.803 | E = 71297.478 + 10759.106 − 364.3272 + 2.8523 | |
| 3.10% | Quadratic | 0.744 | E = 92869 + 5383 − 1502 |
| Cubic | 0.825 | E = 69325 + 10738 − 435.182 + 4.17313 | |
| 3.90% | Quadratic | 0.753 | E = 81717.693 + 8911.328 − 358.8722 |
| Cubic | 0.840 | E = 60169.267 + 16389.945 − 963.4592 + 13.3113 | |
| 4.50% | Quadratic | 0.758 | E = 76791.458 + 11174.221 − 558.2242 |
| Cubic | 0.824 | E = 57999.642 + 19379.605 − 1395.5872 + 23.2633 |
| Design Speed (km/h) | 120 | 100 | 80 | 60 | 40 | 30 | 20 | |
|---|---|---|---|---|---|---|---|---|
| Vertical slope (%) | 3 | 900 | 1000 | 1100 | 1200 | — | — | — |
| 4 | 700 | 800 | 900 | 1000 | 1100 | 1100 | 1200 | |
| 5 | — | 600 | 700 | 800 | 900 | 900 | 1000 | |
| 6 | — | — | 500 | 600 | 700 | 700 | 800 | |
| 7 | — | — | — | — | 500 | 500 | 600 | |
| 8 | — | — | — | — | 300 | 300 | 400 | |
| 9 | — | — | — | — | — | 200 | 300 | |
| 10 | — | — | — | — | — | — | 200 | |
© 2020 by the authors. Licensee MDPI, Basel, Switzerland. This article is an open access article distributed under the terms and conditions of the Creative Commons Attribution (CC BY) license (http://creativecommons.org/licenses/by/4.0/).
Share and Cite
Zhang, X.; Xu, J.; Liang, Q.; Ma, F. Modeling Impacts of Speed Reduction on Traffic Efficiency on Expressway Uphill Sections. Sustainability 2020, 12, 587. https://doi.org/10.3390/su12020587
Zhang X, Xu J, Liang Q, Ma F. Modeling Impacts of Speed Reduction on Traffic Efficiency on Expressway Uphill Sections. Sustainability. 2020; 12(2):587. https://doi.org/10.3390/su12020587
Chicago/Turabian StyleZhang, Xiaodong, Jinliang Xu, Qianqian Liang, and Fangchen Ma. 2020. "Modeling Impacts of Speed Reduction on Traffic Efficiency on Expressway Uphill Sections" Sustainability 12, no. 2: 587. https://doi.org/10.3390/su12020587
APA StyleZhang, X., Xu, J., Liang, Q., & Ma, F. (2020). Modeling Impacts of Speed Reduction on Traffic Efficiency on Expressway Uphill Sections. Sustainability, 12(2), 587. https://doi.org/10.3390/su12020587