Article

Influence of the Fiber Volume Content on the Durability-Related Properties of Polypropylene-Fiber-Reinforced Concrete

1
School of Civil Engineering & Architecture, Xiamen University of Technology, Xiamen 361024, China
2
College of Civil Engineering, Huaqiao University, Xiamen 361024, China
3
School of Civil Engineering, Xi’an University of Architecture and Technology, Xi’an 710055, China
*
Author to whom correspondence should be addressed.
Sustainability 2020, 12(2), 549; https://doi.org/10.3390/su12020549
Submission received: 8 December 2019 / Revised: 3 January 2020 / Accepted: 8 January 2020 / Published: 11 January 2020

Abstract

:
Polypropylene-fiber-reinforced concrete impacts the early shrinkage during the plastic stage of concrete, and the fiber volume content influences the durability-related properties of concrete. The purpose of this paper was to investigate the influence of fiber volume content on the mechanical properties, durability, and chloride ion penetration of polypropylene-fiber-reinforced concrete in a chloride environment. Tests were carried out on cubes and cylinders of polypropylene-fiber-reinforced concrete with polypropylene fiber contents ranging from 0% to 0.5%. Extensive data from flexural strength testing, dry–wet testing, deicer frost testing, and chloride penetration testing were recorded and analyzed. The test results show that the addition of the fiber improves the failure form of the concrete specimens, and 0.1% fiber content maximizes the compactness of the concrete. The flexural strength of specimen C2 with 0.1% fiber shows the highest strength obtained herein after freeze–thaw cycling, and the water absorption of specimen C2 is also the lowest after dry–wet cycling. The results also indicate that increasing the fiber volume content improves the freeze–thaw resistance of the concrete in a chloride environment. Chlorine ions migrate with the moisture during dry–wet and freeze–thaw cycling. The chlorine ion diffusion coefficient (Dcl) increases with increasing fiber content, except for that of specimen C2 in a chloride environment. The Dcl during freeze–thaw cycling is much higher than that during dry–wet cycling.

1. Introduction

Concrete is an effective material for civil infrastructure construction due to its durability, economic advantages, and excellent compressive strength. However, the low tensile strength and quasi-brittle nature of cover concrete can lead to the development and localization of cracks in reinforced-concrete (RC) structures under mechanical or environmental loading. This disadvantage has led to the extensive study of strength-related concrete materials over the last several decades. Various alternatives, such as reactive powder concrete, polymer concrete, and fiber-reinforced concrete, have been proposed to strengthen the performance of concrete and RC structures. Due to the convenience of their construction, several researchers have focused on the development and application of fiber-reinforced cement composites, such as polypropylene (PP)-fiber-reinforced concrete (PPFC), high-performance fiber-reinforced cement composites (HPFRCC), engineered cementitious composites (ECC), and strain-hardening cement composites (SHCC). Hannawi et al. [1] investigated the effect of adding different types of fibers on the microstructure and mechanical behavior of ultrahigh-performance concrete (UHPC). The experimental results showed that the addition of the fiber significantly reduced the lateral strain at peak loading and increased the threshold of initial cracking. Yu et al. [2] investigated the strain-hardening and multiple-crack characteristics and the high strength of a mortar matrix. The tensile strength and elongation of the ultrahigh-performance engineered cementitious composite (UHP-ECC) were 20 MPa and 8.7%, respectively.
When in service, concrete tends to crack at an early age under the action of temperature and humidity changes and as a result of constraints. The early-age cracking of concrete has become the main reason for a decrease in its bearing capacity and the durability of structures. PPFC limits early shrinkage in the plastic stage of concrete and delays crack development in the service stage. Medina et al. [3] investigated the effects of polypropylene fibers (PPFs) on early cracking due to drying shrinkage in concretes with natural pozzolan cement (NPC) and different fiber volume fractions (0.03%, 0.06%, 0.09%, and 0.12%). The results indicated that a PPF volume fraction of 0.06% reduced the cracking area due to drying shrinkage of the NPC by 66%, but larger volume fractions did not linearly increase this effect, and even worse results were obtained. Khan and Sharma [4] investigated the strength and water permeation properties of rice-husk ash (RHA) concrete reinforced with PPFs. Ordinary Portland cement (OPC) was partially replaced with 10%, 15%, and 20% RHA, and 0.5%, 0.75%, and 1% PP by weight of the binder was added. The splitting tensile strength was found to increase with the RHA as well as PP for all concrete mixes. There was a significant enhancement in the flexural strength with an increase in the PP content, especially at late aging times. Karahan and Atis [5] reviewed the durability properties of concrete containing PPFs and fly ash, and the fiber volume fraction was 0%, 0.05%, 0.10%, and 0.20% on a volume basis. The laboratory results showed that the addition of PPFs did not improve the compressive strength and elastic modulus. The freeze–thaw resistance of PPFC was found to slightly increase when compared to that of concrete without fibers. Islam and Gupta [6] evaluated the strength, plastic shrinkage, and permeability (of gas and water) of concrete incorporating PPFs (with an aspect ratio 300) in various proportions (viz., 0.10%, 0.15%, 0.2%, 0.25%, and 0.3%) by volume of concrete. The experimental results indicated that with the inclusion of 0.1%–0.3% fiber in the concrete, the plastic shrinkage cracks were reduced by 50%–99% compared to those in the plain concrete. With the inclusion of 0.1% fiber, the crack width decreased to 1 mm, and the trend continued with the addition of the fibers. Zhang and Li [7] investigated the effect of PPFs on the workability and durability of concrete composites containing fly ash and silica fume. Four different fiber volume fractions (0.06%, 0.08%, 0.1%, and 0.12%) were used. The length of the water permeability, dry shrinkage strain, and carbonation depth of concrete containing fly ash and silica fume decreased gradually with increasing fiber volume fractions if the fiber volume fraction was below 0.12%. All of the research shows that PPFs significantly improve concrete performance, but the relationship between the fiber content and performance improvement is not clear. Thus, when considering the published results involving the testing of concrete with PPFs, it is not possible to draw definite conclusions about the influence of volume on the durability of concrete. The objective of this study is to investigate the PPF volume’s influence on the durability of concrete.
Chloride-induced corrosion is one of the major causes of concrete structure deterioration. Chloride ions from seawater or deicing salt induce corrosion of the reinforcement materials [8,9]. The influence of fiber volume content on the durability-related properties of PPFCs under dry–wet and freeze–thaw cycling in a chloride environment was investigated in this paper. The authors of this paper interpreted the durability of the PPFC by investigating the relative dynamic modulus of elasticity, mass loss, and internal frost damage when exposed to a chloride environment. The chloride ingress behavior of PPFC was also studied to identify a suitable PPF content in order to enhance the durability of the PPFC. The results make it possible to establish the influence of the micro PPF volume content on the durability of fiber-reinforced concrete in a chloride environment.

2. Materials and Methods

2.1. Materials

This study adopted Grade 42.5 cement and fly ash as the binder. Table 1 shows the chemical compositions of the cement and fly ash. The alkali content of the cement is 0.92%. The fine aggregate and coarse aggregate that were used were qualified according to Chinese standard JGJ 52-2006 [10]. The modulus of fineness of the fine aggregate was 2.62, with a soil content of less than 1%. The crushed limestone had a continuous grade with a size range of 5–15 mm. The physical and mechanical properties of the PPFs are given in Table 2.

2.2. Component Amounts in the Samples and Specimen Preparation

To investigate the durability-related properties of the PPFC under different chloride environments, four groups of specimens were produced, representing a wide range of PPF volume fractions. The water-to-binder ratio was 0.43 and the sand percentage was 40.7%, while 2% of air was entrained. Four mix designs were used: One comprising plain concrete (C1) and three PPFCs named C2, C3, and C4 with PPF volume fractions of 0.1%, 0.3%, and 0.5%, respectively; the volume of the fibers was normalized to the volume of concrete. The detailed component amounts in all samples are shown in Table 3.
The mixtures were prepared using a concrete mixer with a capacity of 60 L. At the beginning, the coarse aggregate and sand were homogenized with half of the amount of water. Subsequently, cement, fly ash, and the remaining water were added. After the components had been thoroughly mixed, polypropylene fibers were added by hand to obtain a good workability.
Freshly mixed prisms with a cross section of 100 × 100 mm and a length of 400 mm were produced. In addition, cubes with a side length of 100 mm were produced. The fresh concrete was compacted in steel molds and allowed to harden in the laboratory under plastic sheets. After casting, the specimens were cured in a standard environment with a relative humidity of 95% ± 5% and a temperature of 20 ± 2 °C for 28 days.

2.3. Exposure to Dry–Wet Cycles

The mechanism used to alternate the dry–wet cycles had a great influence on the chloride ion transport in the specimen. The ratio of the drying to wetting times affected the position of the drying and wetting front when the moisture was transferred in the concrete, which influenced the depth of the moisture and thus affected the transmission of chloride ions in the specimen. To analyze the effect of the fiber content on the chloride ion transport during dry–wet cycling, the experimental mechanism was determined by the time to reach the mass stability state (the mass of the specimen unchanged) during the dry–wet cycling in a laboratory environment, and the influence of the test mechanism on the depth of the moisture was eliminated. After the specimens were cured for 28 days, the specimens were placed in a laboratory with a controlled temperature of 20 ± 2 °C and a relative humidity (RH) of 60% ± 5%. The method was as follows. The water loss and water absorption of the specimen during each dry–wet cycle in the laboratory were defined as the mass stability state. First, the cured specimen was naturally dried (T = 20 ± 2 °C, RH = 60% ± 5%) in the laboratory until the mass of the specimen did not change, and the drying time was determined to be 2 days. Second, the specimen was placed in a chloride solution until the mass of the specimen remained constant, and the soaking water absorption time was determined to be 1 day. Finally, the alternating dry–wet cycle included 2 days to dry and 1 day to soak (shown in Figure 1). A total of 30 cycles were conducted in accordance with the approach above, with every 10 cycles being one test cycle; the NaCl solution was replaced after each test cycle.

2.4. Exposure to Freeze–Thaw Cycles

To simulate actual freeze–thaw conditions with deicing salt, the concrete specimens were subjected to repeated cycles of freezing and thawing in accordance with Gb/T 50082-2009 (standard rapid freeze–thaw test method) [11], and the deterioration during the test was assessed. After the specimens were cured for 28 days, they were immersed in a 3.5% NaCl solution for 4 days, and then specimens were placed in an appropriate chamber containing a 3.5% NaCl solution (shown in Figure 2). During the test, each freeze–thaw cycle lasted 2–4 h. The temperature obtained by embedded sensors in the centers of specimens varied between −18 ± 2 °C and 5 ± 2 °C. The specimens were exposed to freeze–thaw cycles, and the mass and dynamic elastic moduli of the concrete specimens were measured after 20 cycles.

2.5. Capillary Absorption and Chloride Penetration

The concrete specimens were used to measure the chloride penetration after the test. The test was run according to Chinese Standard JTJ 270-98 [12], and the acid-soluble chloride ion concentrations in various depths were tested. After 0, 50, and 100 freeze–thaw cycles, 2 cm from the specimen surface—except the collection surface—were cut, which was determined by a spray with 0.1 mol/L AgNO3 solution on the split surface in previous experimental studies. Then, 1 mm thick layers from the non-pouring surface were milled consecutively. The chloride content of the specimen powder was finally determined by nitration. After 0, 10, 20, and 30 dry–wet cycles, the chloride content of the specimens was also determined.
In addition, concrete specimens that were exposed to 0, 10, 20, and 30 dry–wet cycles were used to measure the capillary absorption. The specimens were placed in a room with a controlled temperature of T = Temperature. After a certain number of dry–wet cycles, the increase in the mass of the specimen resulting from absorption of water was measured.

3. Results and Discussion

3.1. Flexural Strength

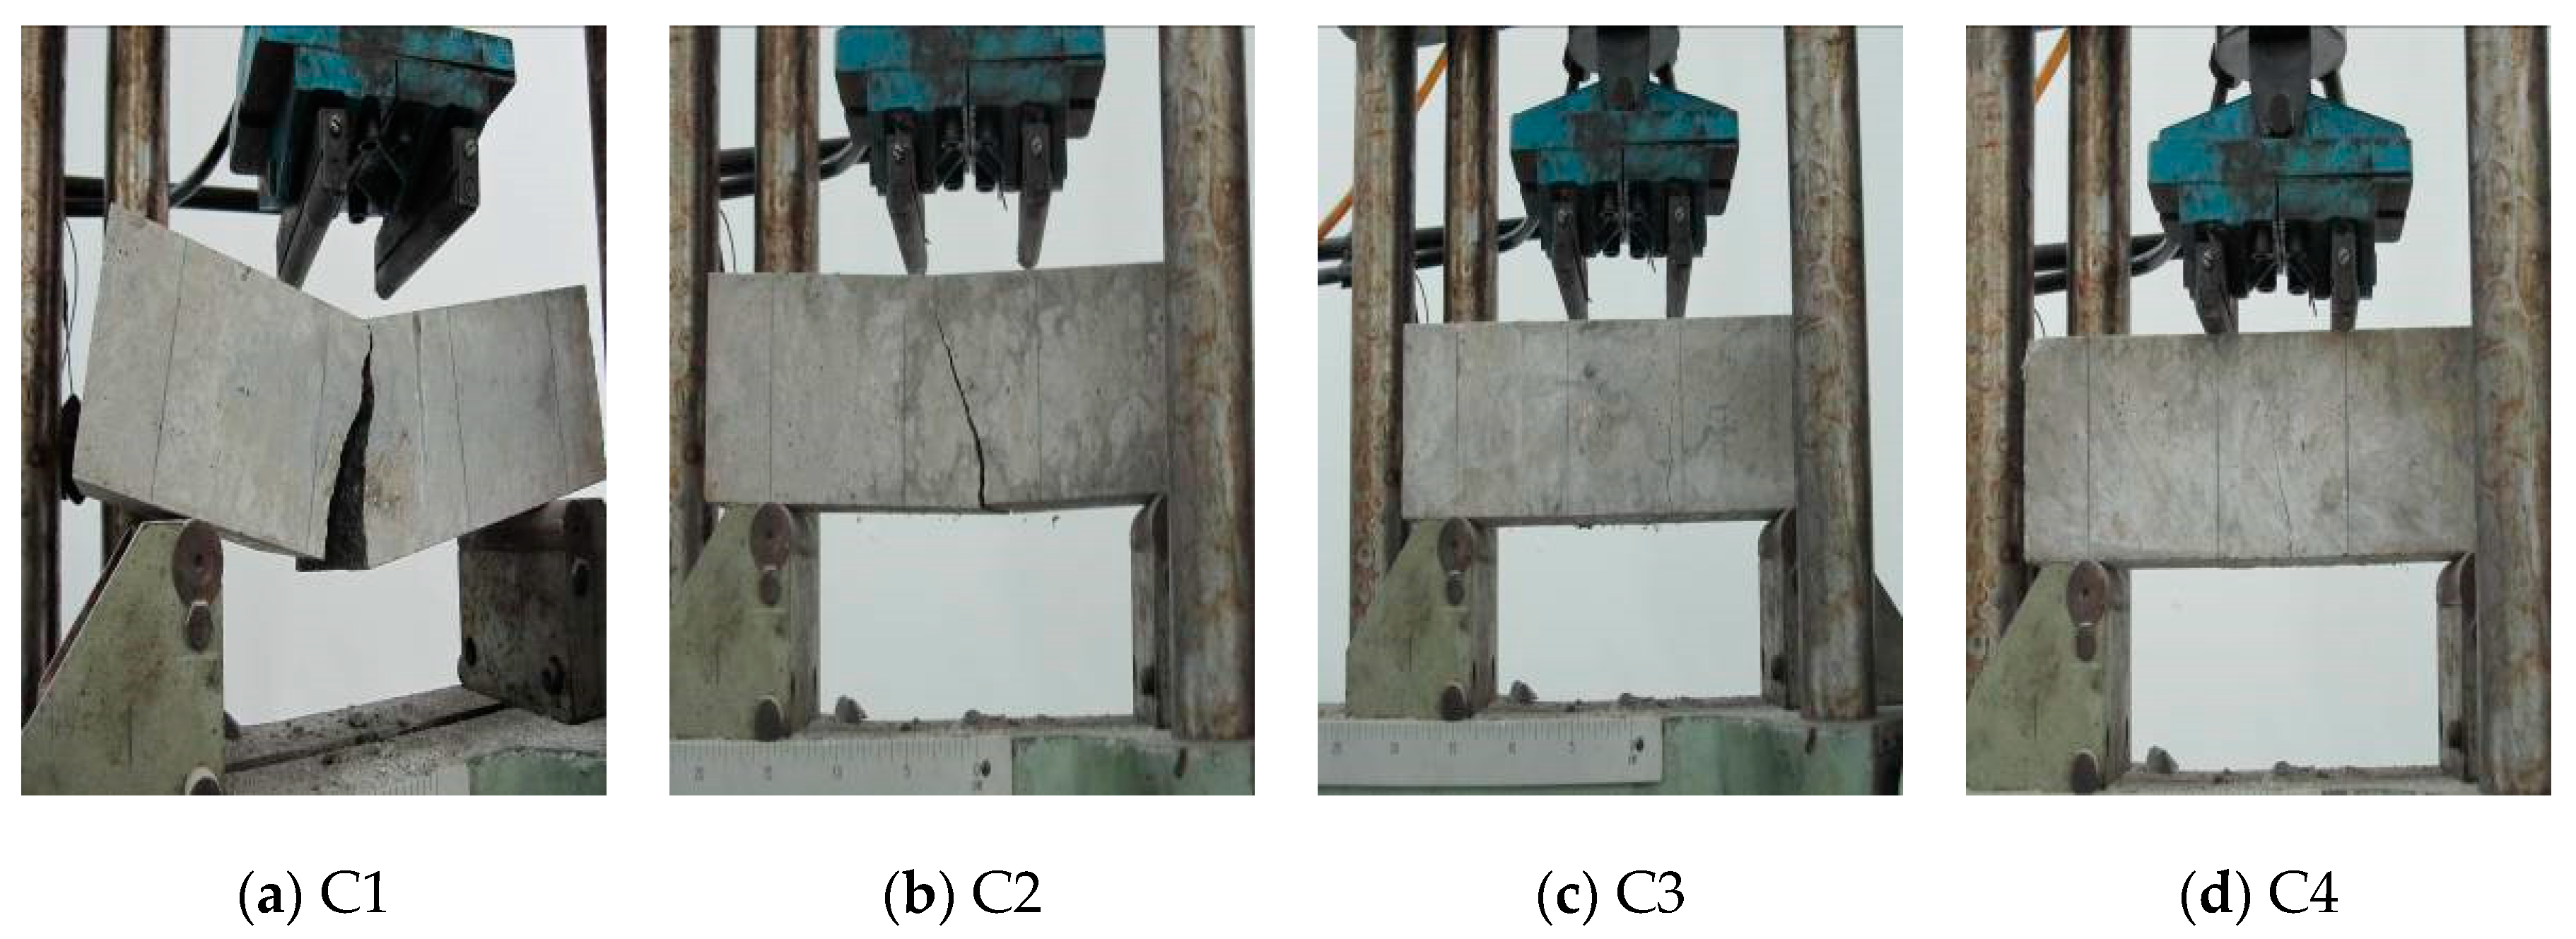
Figure 3 shows the bending failure state of the specimens with different fiber contents. The failure of all specimens occurred as a result of cracking of the bottom concrete. When the ultimate strength of ordinary concrete reached the ultimate strength of bending failure, the specimen broke in half with a clear cracking sound. Figure 3a shows that ordinary concrete exhibited a regular vertical crack in the range of the loading points. As PPFs were added, no brittle failure occurred when the specimen reached its ultimate strength. Due to the characteristics of the random fiber distribution, fiber bridges cracked on the fracture surface during the loading and delayed cracking, and the path of the crack became tortuous; a fine oblique crack was produced during failure, and the specimens maintained a certain level of integrity. With increasing load, the crack gradually extended to the loading end, and the crack tended to be subtle in nature with increasing fiber content.
Table 4 shows the flexural strengths of the specimens during freeze–thaw cycling. The flexural strength did not change monotonously with increasing fiber content. The flexural strength of specimen C2 with 0.1% fiber content was the highest obtained herein. The flexural strength of all specimens decreased as the number of freeze–thaw cycles increased. As a low-elastic-modulus fiber, the elastic modulus of PPFs is only 1/4 of that of hardened concrete. According to the theory of composite materials, the addition of the PPFs should reduce the bending strength of the concrete. However, because the strengthening mechanism of the PPFs mainly involved reducing the number of primary cracks in the plastic phase, the compactness and flexural strength of the specimen improved. The large number of fibers inhibited the formation of a uniform dispersion during the mixing process, and bubbles were introduced into the concrete at the same time, thus reducing the bending strength.

3.2. Water Absorption

Concrete is a multiphase porous material that is composed of cement paste and aggregates wrapped in the cement paste. A substantial number of pores exist in the cement paste, in the aggregates, and at the interface between the cement paste and aggregates, and the pores are classified as primary pores and secondary pores. These pores are distributed in the concrete network and change under the influence of internal and external conditions. The pores in hardened cement pastes include gel pores, capillary pores, and regular pores. The complexity of the internal microstructure in concrete determines the complexity of the transmission performance of the concrete. Corrosive gases, ions, and solutions in the external environment enter through the pores in concrete, thus affecting the durability of the concrete structure.
According to the water absorption measured by different immersion times of the specimen:
ω t = m 1 m 0 m 0 × 100 %
where m l is the saturated mass of the specimen after immersion, and m 0 is the mass of the specimen after drying.
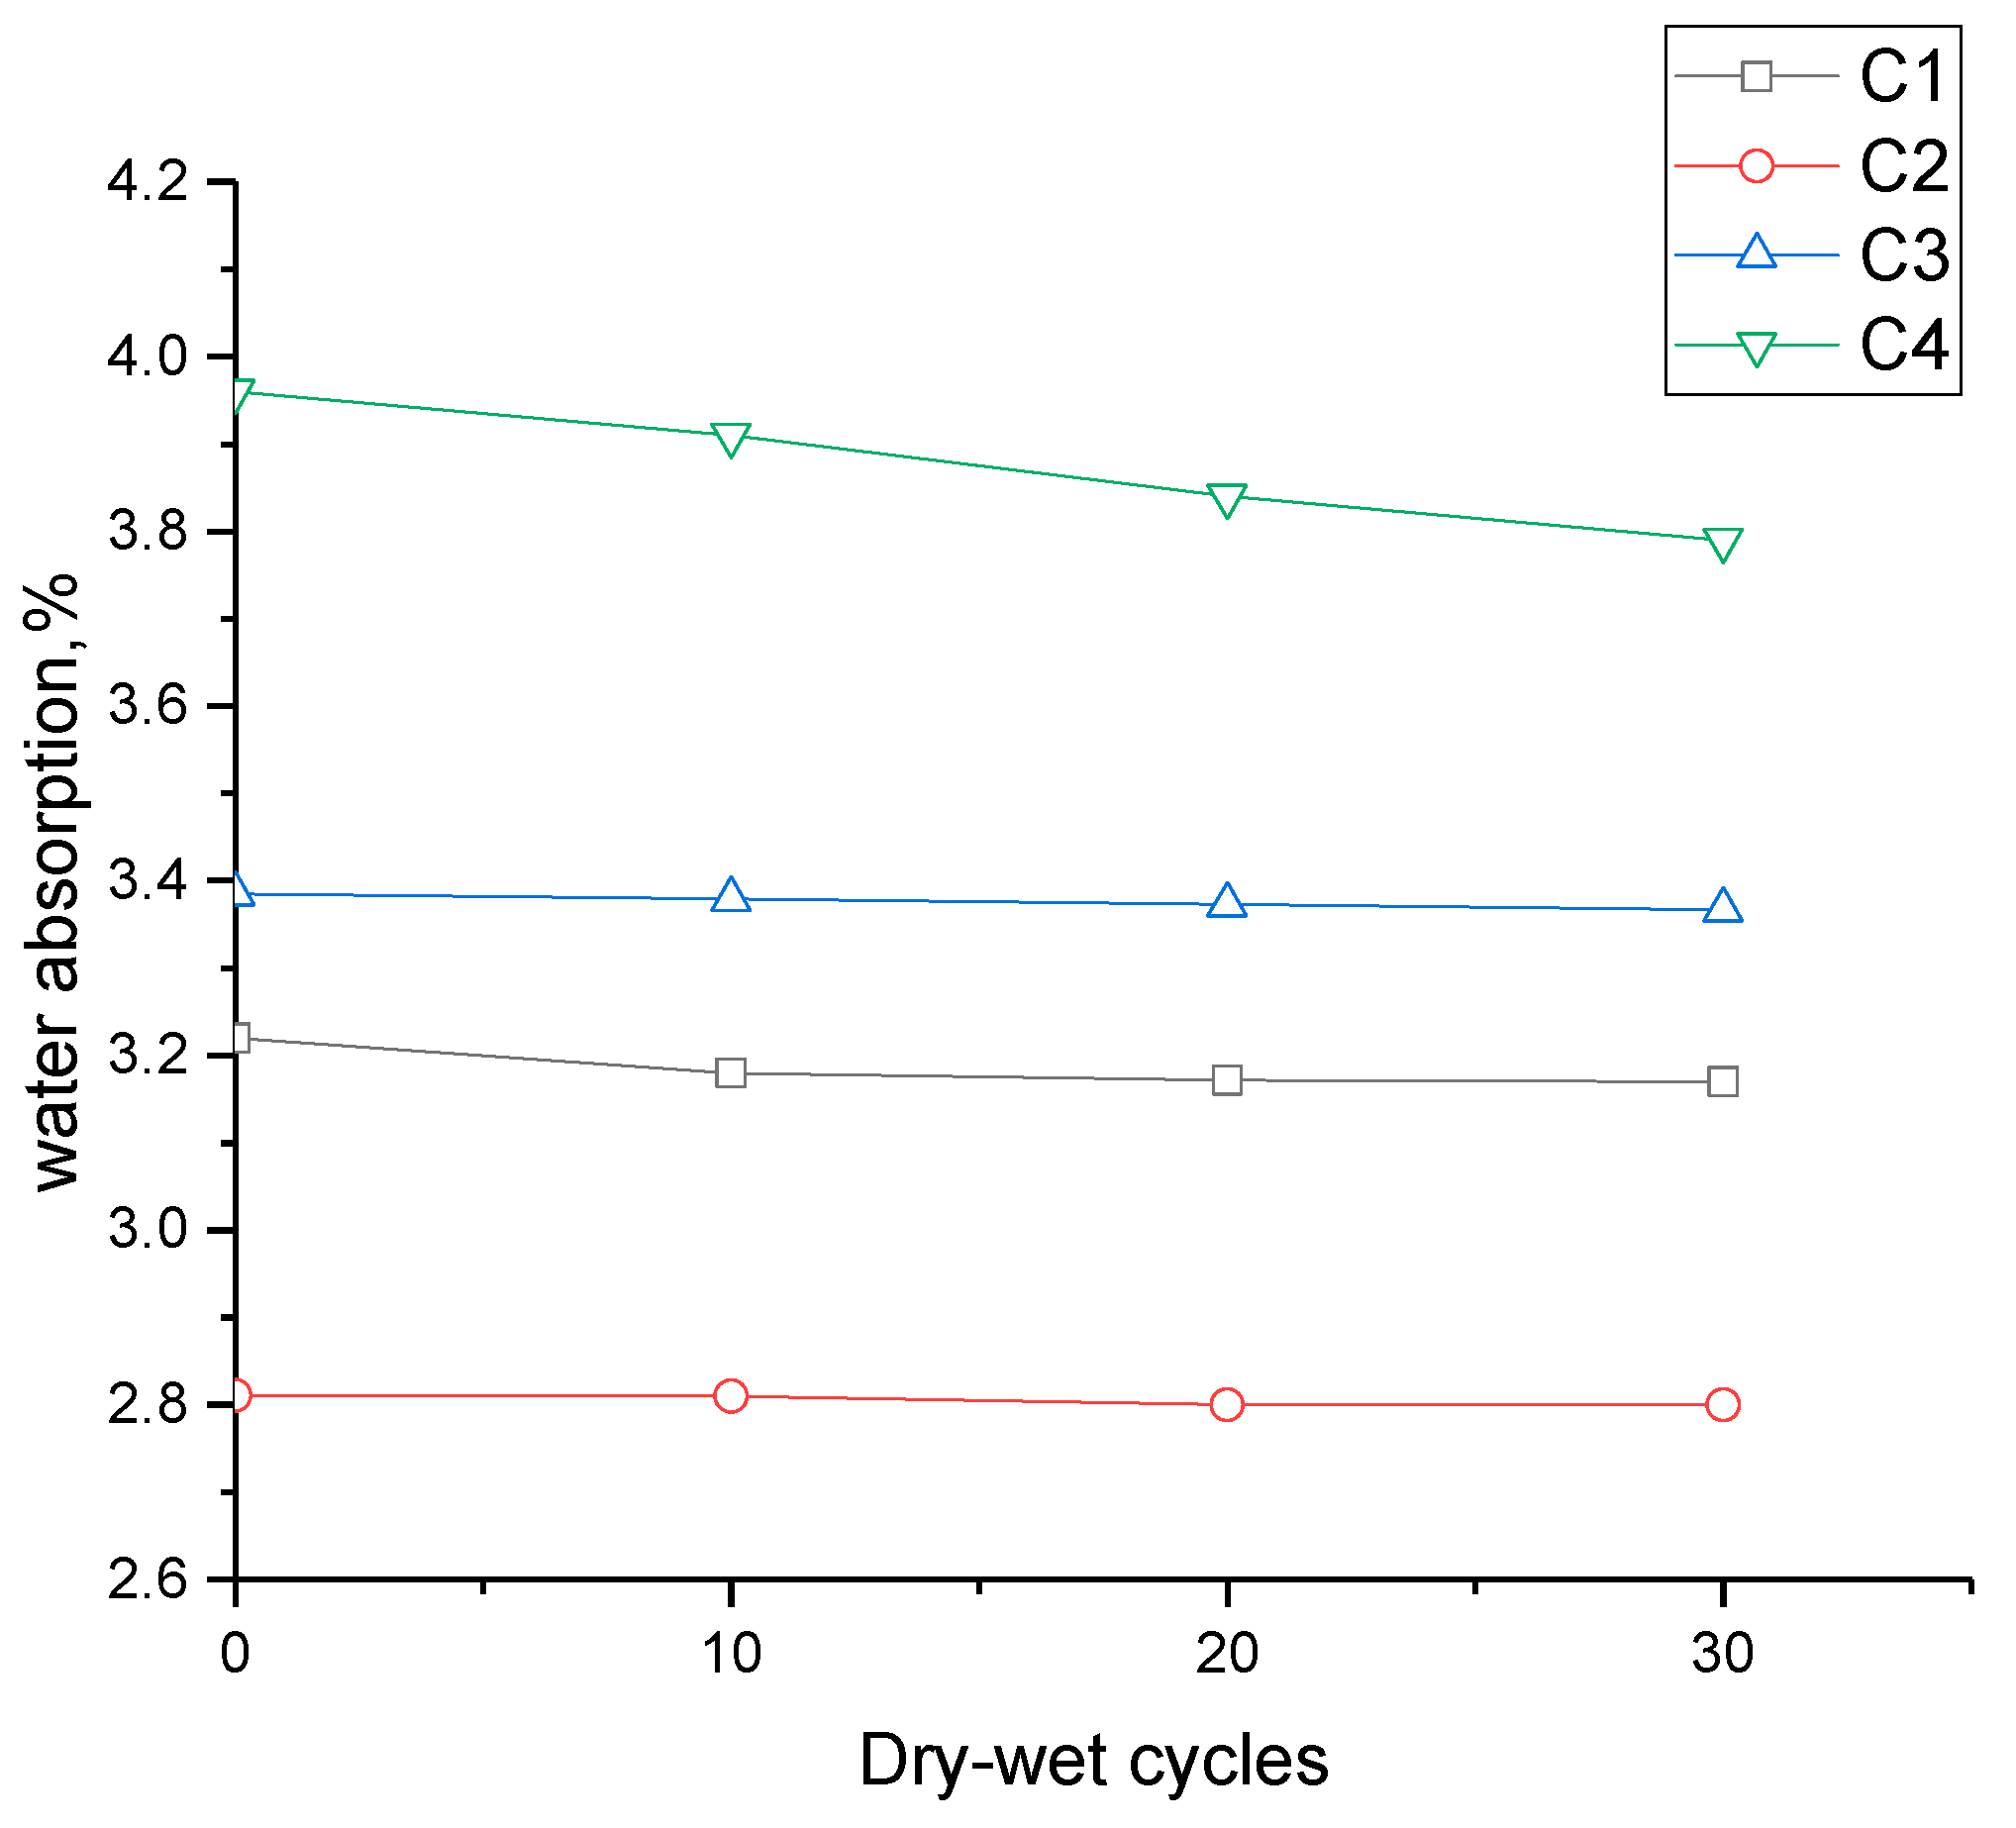
Figure 4 shows the water absorption of the specimens after dry–wet cycling. The water absorption of the specimens decreased gradually with increasing alternating time. After 30 dry–wet cycles, the water absorption of specimen C2 was 12% lower than that of C1, which did not contain PPFs. The water absorption of specimen C4 with 0.5% fiber content was the highest herein, and was 20% higher than that of specimen C1. Adding an appropriate amount of fiber effectively improved the compactness of the specimen, while a high PPF content reduced the compactness of specimens. The water absorption rate of specimen C4 with 0.5% fiber content was gradually reduced; the other specimens varied little. This can probably explained by the high fiber content’s delay of internal moisture and promotion of internal hydration of specimens.

3.3. Scaling

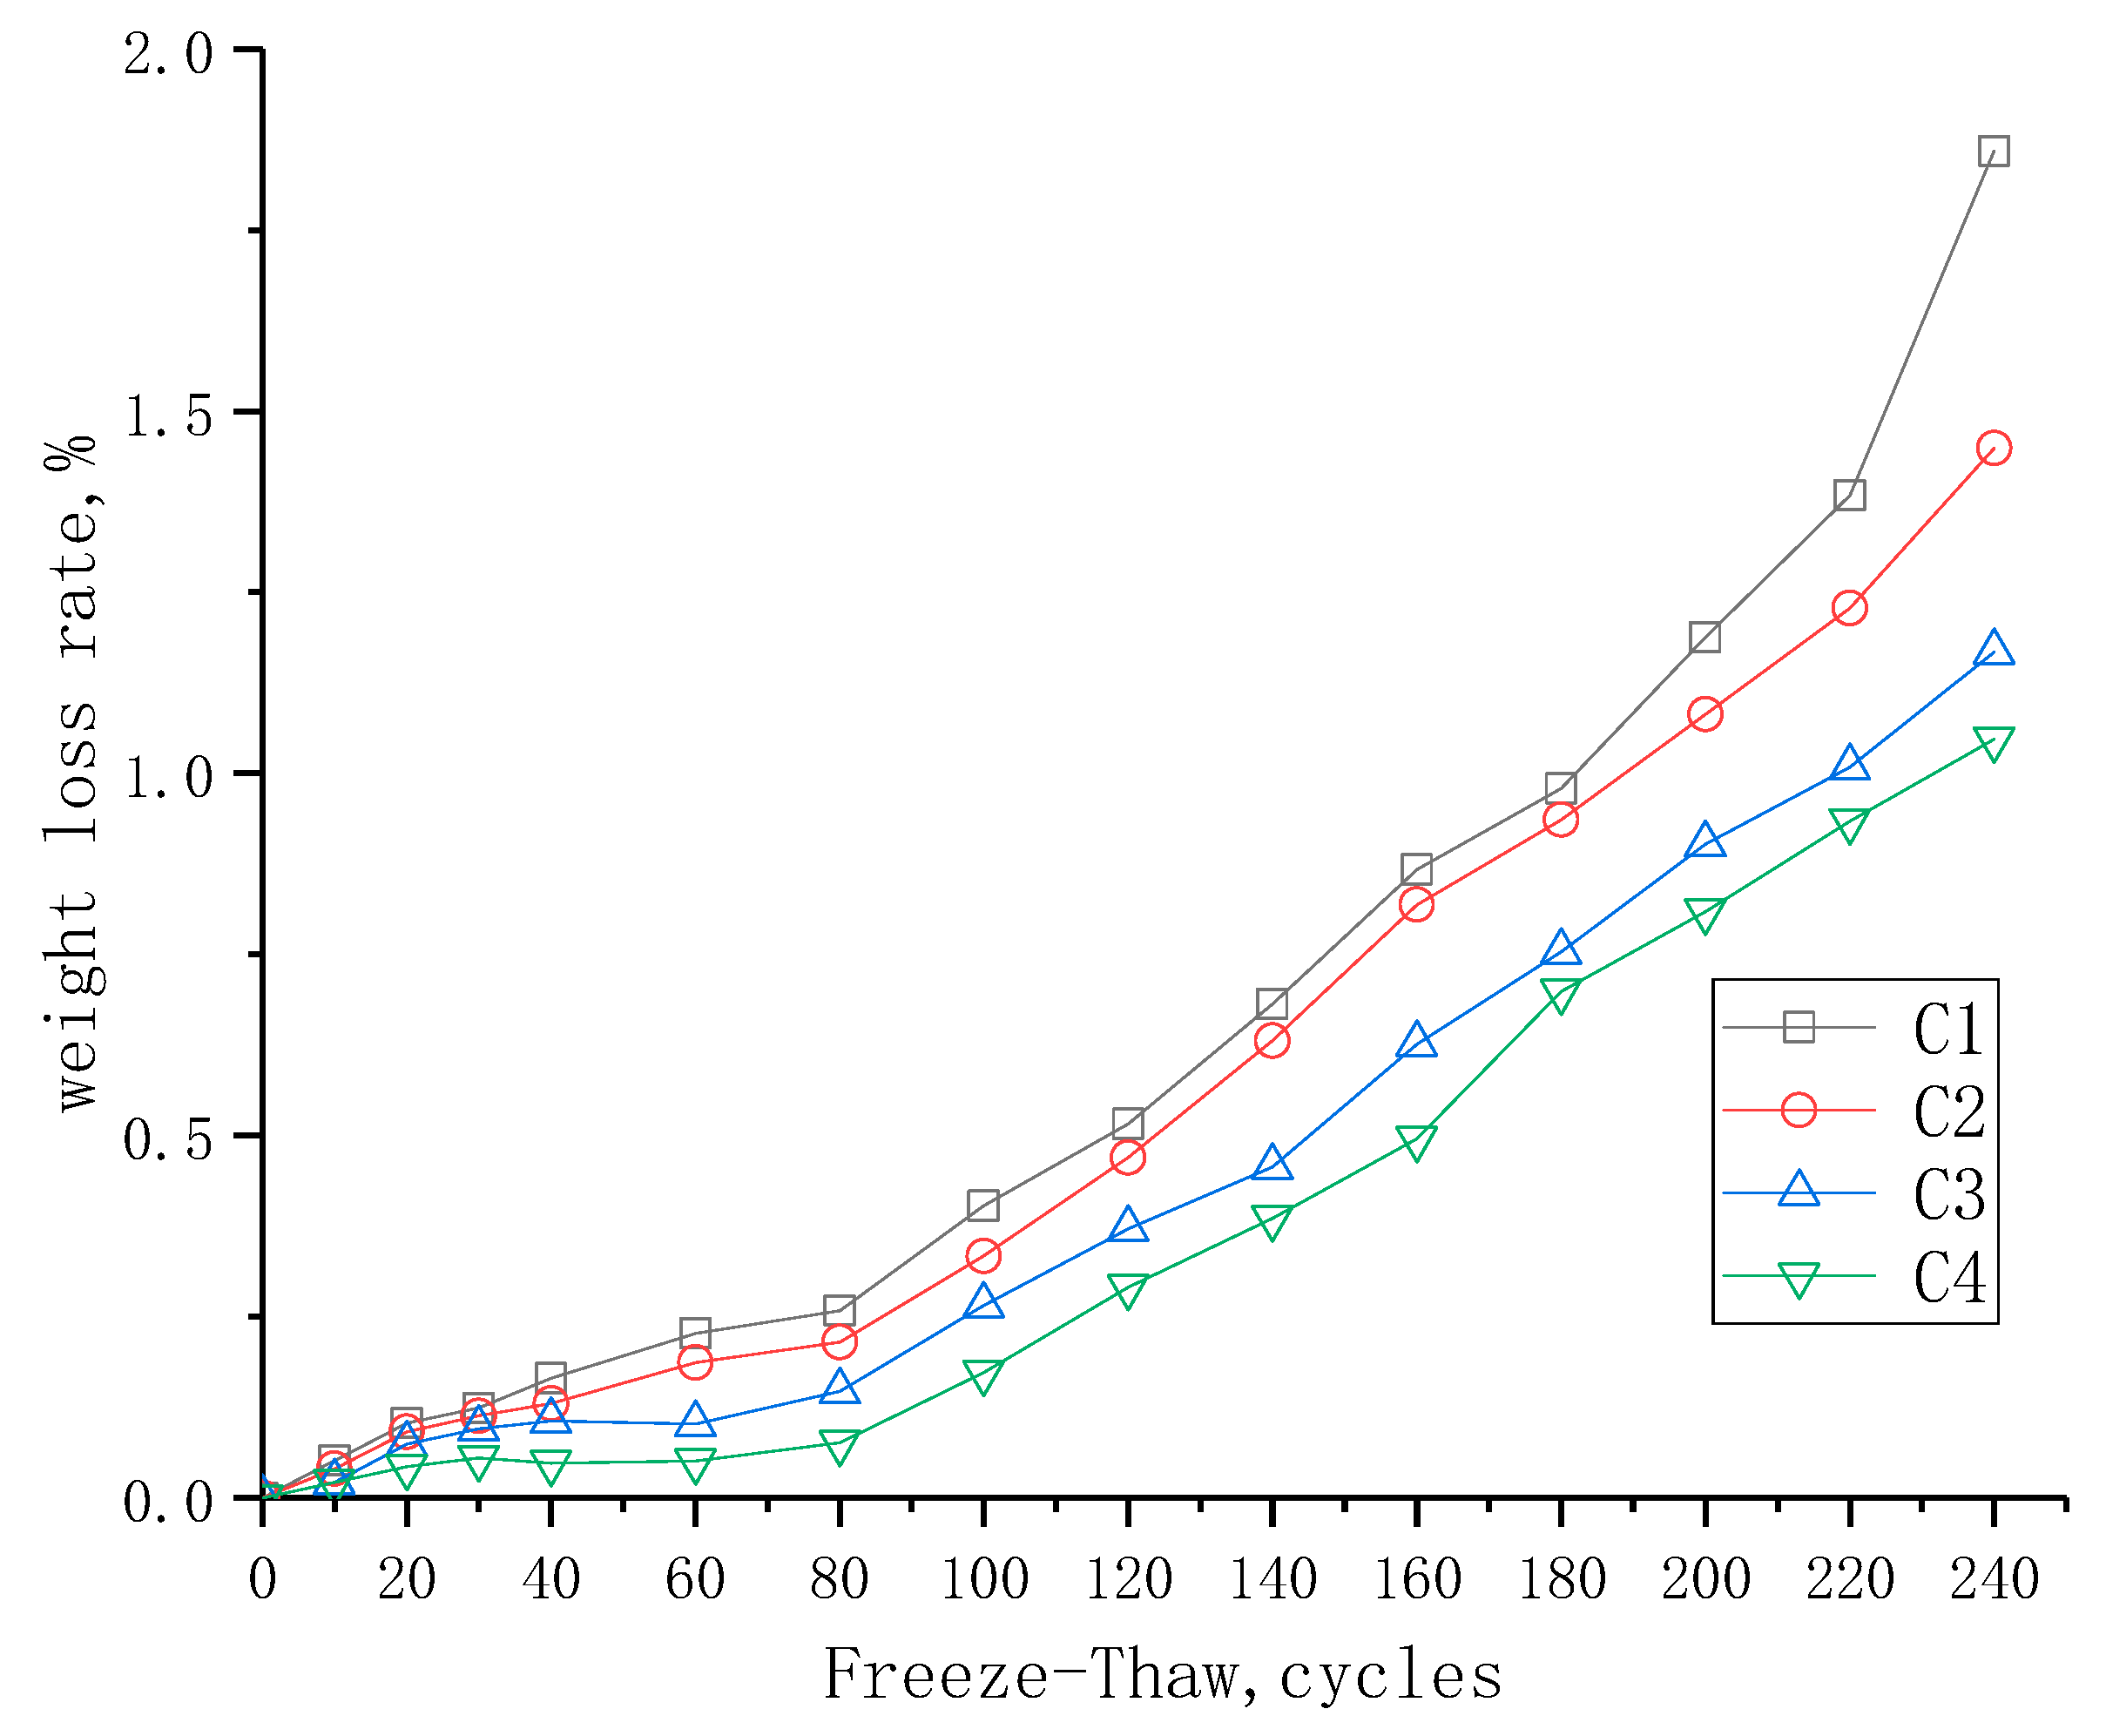
Figure 5 shows the weight-loss ratio of the concrete specimens caused by concrete surface scaling which occurred when the specimens were subjected to freeze–thaw cycles in a 3.5% NaCl solution. The weight-loss rate of specimens degraded as the number of freeze–thaw cycles increased. The weight-loss ratio of specimens changed monotonously with increasing fiber content. Scaling occurred due to a number of factors: (1) Exposure of the highly saturated concrete to freeze–thaw cycles [13,14,15,16,17,18], (2) scaling of the concrete surfaces [19,20,21,22,23], (3) crystallization of salt in the concrete pores that resulted in production of internal stresses [24,25,26], and (4) expansion forces that resulted from the corrosion of the reinforcements when a chloride-based deicing salt was used [27,28]. The specimens with PPFs showed the best resistance to freeze–thaw cycling. After 240 freeze–thaw cycles, the decrease in the weight-loss ratio of specimen C1 comprised of OPC was 98.12%. Specimen C4 with 0.5% fiber content showed the lowest-scaling rate herein. This can be explained by the porous surface of the specimen being saturated after presaturation, which caused the initial weight loss to increase quickly. The increase in the fiber content alleviated the pressure from ice crystals in the specimen. Finally, additional cracks formed, and additional moisture migrated into the concrete as a result of those cracks. The salt also increased the water saturation, and the weight loss rapidly increased as a result.

3.4. Relative Dynamic Modulus of Elasticity

The relative dynamic modulus of elasticity of the samples subjected to freeze–thaw cycling in a NaCl solution is shown in Figure 6. The relative dynamic modulus of elasticity degraded as the number of freeze–thaw cycles increased. After 240 cycles, specimen C1 severely deteriorated, and its relative dynamic modulus of elasticity decreased to 93.85% of its initial value. Specimen C4 slightly deteriorated, and its relative dynamic modulus of elasticity decreased to 97.9% of its initial value. All curves had similar trends, although the magnitude of the relative dynamic modulus of elasticity was different for each specimen. The slope of the initial phase was relatively steep; then, the curves exhibited a steady and gradual slope; finally, the slope of the curves became steep. The test results indicate that adding PPFs significantly improved the resistance of the concrete to freeze–thaw cycling. The incorporation of the fibers inhibited the extension of microcracks and reduced the specimen damage.

3.5. Chloride Profile in the PPF Concrete

Figure 7 shows the chloride ion distribution of each specimen after dry–wet cycling. The curves for the chloride ion content as a function of the penetration depth first increased, then decreased, and finally stabilized; there was a peak value at a certain depth from the surface of the specimen. After 30 dry–wet cycles, specimens C1 and C2 reached their peak at a penetration depth of 2.5 mm, and the peak depth for specimens C3 and C4 was 3.5 mm. Among the samples herein, the chloride ion content in specimen C2 was the lowest and it was the highest in specimen C4. The total chloride content of specimen C2 at its peak point was 90% that of specimen C1, and the total chloride content of specimen C4 was 1.23 times that of specimen C1.
During dry–wet cycling, the chloride ions migrate in the specimen by capillary adsorption, convection, and diffusion. This can be explained by the “ink-bottle-beam tube” microstructure in concrete [29]. The moisture in the specimens evaporated and reached an equilibrium value, and the chloride ions migrated with the moisture. During the wetting process, the moisture entered the concrete through the pores of various sizes. During the drying process, the moisture in the surface layer was easily dissipated, and the internal moisture evaporated slowly due to the blockage from the small pores. Due to the hysteresis of the moisture transport, a high chloride concentration formed at a certain depth from the surface of the concrete. The addition of a large number of fibers provided additional channels for the transport of chloride ions.
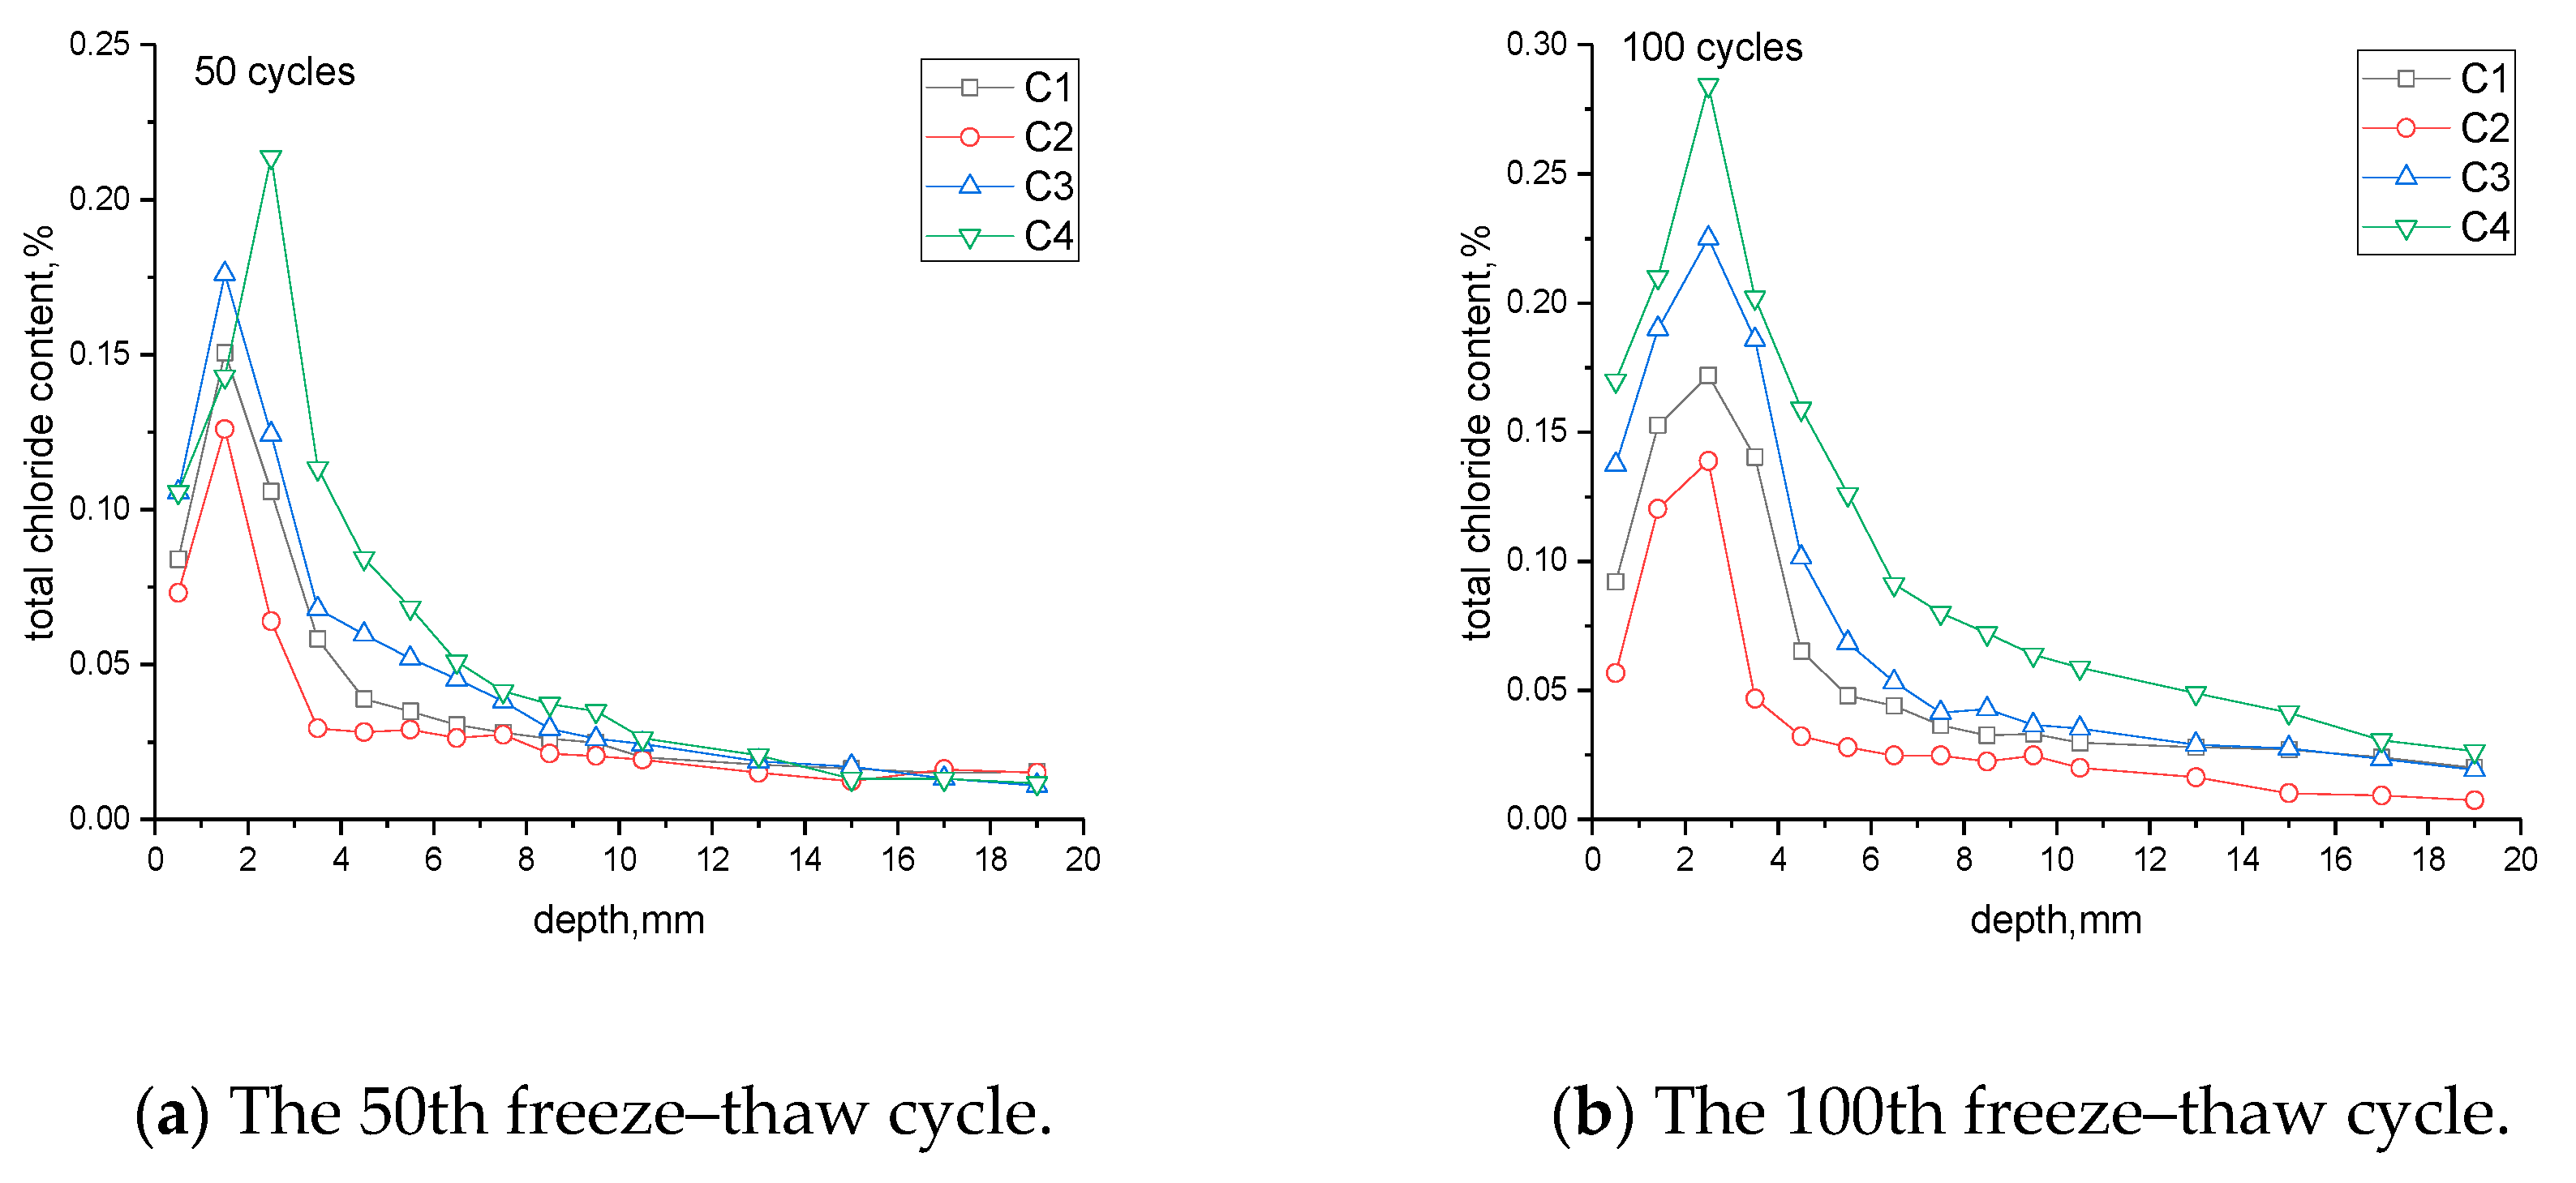
Figure 8 shows the chloride profiles for each specimen after the 50th and 100th freeze–thaw cycles. The chloride ion content increased as the number of freeze–thaw cycles increased. A high chloride concentration formed at a depth of 1–4 mm from the surfaces of the specimens. The chloride ion content did not change monotonously with fiber content, which is different from the effect of fiber content on the salt freezing resistance; the densest specimen, C2, had the lowest chloride ion content herein. This can be explained by the migration of chloride ions with moisture during freeze–thaw cycling (shown in Figure 9). During the freezing phase, moisture was removed from the surrounding mesopores by the ice crystals in the cement paste. As a consequence, a high chloride concentration was induced during moisture transport. In the thawing phase, the ice crystals melted to form moisture, and chloride migrated to the surrounding pores with the moisture.

3.6. Microstructure Observations

Figure 10 shows the micromorphology of each specimen after curing. The change in the internal structure of the specimen was caused by the addition of the PPFs. There were minor cracks at the interface of the coarse aggregate and the cement matrix in specimen C1. The internal structure of specimen C2 was relatively dense, and the cement matrix was tightly combined with the fibers. With increasing fiber content, the internal compactness of the specimen decreased, and the porosity could be clearly observed in specimen C4.
Figure 11 shows the micromorphology of each specimen after 30 dry–wet cycles. The microstructure inside the specimens after the 100th freeze–thaw cycle is shown in Figure 12. The deposition law of chloride crystals in all specimens was similar. Due to the internal compactness, there were few sodium chloride crystals in specimen C2 with 0.1% fibers. With an increase in the fiber content, the number of sodium chloride crystals increased in the specimens, which can be seen on both the cement and fibers. The results are similar to those for the micromorphologies of each specimen after curing.

3.7. Chloride Diffusion Coefficient

The ion diffusion coefficient is an important index for reflecting the resistance of concrete to chlorine salt, and is also an important parameter for expressing the ability of chlorine ion migration in concrete. The chloride profiles of specimens under dry–wet cycles or freeze–thaw cycles show two layers of different migration responses in the surface; the internal chloride ions of specimens diffuse under concentration. According to the RILEM TC 178-TMC: “Testing and modeling chloride penetration in concrete” suggests neglecting the external layer where the chloride concentration increases and using Cmax to fit the error function equation into the decreasing concentration profile towards the interior [30].
C x , t = C 0 + ( C max C 0 ) ( 1 e r f x 2 D c l t ) ,
where Cx,t is the chloride content at a depth x and exposure time t, C0 is the initial chloride concentration within the concrete, Cmax is the maximum chloride concentration within the concrete, and erf(x) denotes the error function.
According to the measured result for the free chloride ion concentration and Equation (2), data were produced, MATLAB was used for curve fitting, and the chlorine ion diffusion coefficient Dcl was obtained. The result is presented in Figure 13.
Figure 13 shows the effect of fiber content on the Dcl for all specimens in a chloride environment. Dcl increased with increasing fiber content, except in specimen C2. Based on Fick’s second law, the Dcl of specimen C4 is 1.74 times that of specimen C1 after the 100th freeze–thaw cycle, and the Dcl of specimen C1 is 82% that of specimen C4 after the 30th dry–wet cycle within the experimental data in the test. The Dcl values after the 100th freeze–thaw cycle were 0.76, 0.74, 0.75, and 0.76 for the original specimens with 0%, 0.1%, 0.3%, and 0.5% fiber contents, respectively. The Dcl after the 30th dry–wet cycle were 0.29, 0.27, 0.23, and 0.2 for the original specimens with 0%, 0.1%, 0.3%, and 0.5% fiber contents, respectively. Because of the existence of convection and desalination, the diffusion coefficients of chloride ions increased with the number of freeze–thaw cycles and the increase in the fiber content. Due to the subsequent hydration of cementitious materials in concrete, the pores in the materials were constantly filled with new hydration products, and the Dcl of specimens decreased gradually with an increase in the number of dry–wet cycles.

4. Conclusions

To investigate the durability-related properties of PPFC with fiber volume content, tests were carried out in this paper to examine the flexural strength, water absorption, scaling, relative dynamic modulus of elasticity, chloride profile, microstructure, and chloride diffusion coefficient under dry–wet and freeze–thaw cycling in chloride environments. Based on this study, the following conclusions can be drawn:
(1)
As PPFs are added, no brittle failure occurs when the specimen reaches the ultimate strength. The flexural strength of specimen C3 with 0.3% fiber content is the highest obtained herein. The PPFs reduce the primary cracks in the plastic phase, and the flexural strength of the specimen is improved.
(2)
After 30 dry–wet cycles, the water absorption of C2 with 0.1% fiber content is the lowest herein. A sufficient number of fibers can effectively improve the compactness of the specimen and reduce the internal porosity, while a high content of fiber reduces the compactness of the specimens.
(3)
After 240 freeze–thaw cycles, specimen C4 with 0.5% fiber content shows the best salt freezing resistance herein. The increase in the fiber content alleviates the ice crystal pressure in the specimens and inhibits the extension of the microcracks.
(4)
The free chloride content of specimen C2 is the lowest herein for both the dry–wet and freeze–thaw cycling in chloride environments. During dry–wet cycling, the result can be explained by the “ink-bottle-beam tube” microstructure in concrete. During freeze–thaw cycling, the result can be explained by the transport mechanism in the deicing salt environment. The compact microstructure of specimen C2 inhibits the chloride ions from migrating with the moisture. The SEM images of specimens confirm this result.
(5)
The Dcl increases with increasing fiber content in a chloride environment except in specimen C2, and the Dcl during freeze–thaw cycling is much higher than that during dry–wet cycling. Chloride ions migrate with moisture during both freeze–thaw and dry–wet cycling, and the movement of the moisture is much more violent during freeze–thaw cycling than during dry–wet cycling.
(6)
For practical applications, PPFC structures are exposed to both dry–wet cycles and freeze–thaw cycles with NaCl solutions. For a realistic prediction of service life, it is necessary to take the combination of dry–wet cycles and freeze–thaw cycles under chloride environments into consideration.

Author Contributions

C.W. conceived and designed the experiments under the supervision of D.N.; C.W. performed the experiments; C.W. analyzed the data; C.W. wrote and edited the paper; and Z.G. edited the paper. All authors have read and agreed to the published version of the manuscript.

Funding

The financial help of the fundamental research funds for the Fujian province (Project No., 2016J0514) is gratefully acknowledged. The funders had no role in the design of the study; in the collection, analysis, or interpretation of the data; in the writing of the manuscript; or in the decision to publish the results.

Acknowledgments

The authors gratefully acknowledge the financial support provided by the Fujian province.

Conflicts of Interest

The authors declare no conflict of interest.

References

  1. Hannawi, K.; Bian, H.; Prince-Agbodjan, W.; Raghavan, B. Effect of different types of fibers on the microstructure and the mechanical behavior of ultra-high performance fiber-reinforced concretes. Compos. Part B Eng. 2016, 86, 214–220. [Google Scholar] [CrossRef] [Green Version]
  2. Yu, K.-Q.; Yu, J.-T.; Dai, J.-G.; Lu, Z.-D.; Shah, S.P. Development of ultra-high performance engineered cementitious composites using polyethylene (PE) fibers. Constr. Build. Mater. 2018, 158, 217–227. [Google Scholar] [CrossRef]
  3. Medina, N.F.; Barluenga, G.; Hernández-Olivares, F. Enhancement of durability of concrete composites containing natural pozzolans blended cement through the use of polypropylene fibers. Compos. Part B Eng. 2014, 61, 214–221. [Google Scholar] [CrossRef]
  4. Khan, R.A.; Sharma, R. Strength and durability characteristics of rice husk ash concrete reinforced with polypropylene fibers. Jordan J. Civ. Eng. 2018, 12, 653–668. [Google Scholar]
  5. Karahan, O.; Atiş, C.D. The durability properties of polypropylene fiber reinforced fly ash concrete. Mater. Des. 2011, 32, 1044–1049. [Google Scholar] [CrossRef]
  6. Islam, G.M.S.; Gupta, S.D. Evaluating plastic shrinkage and permeability of polypropylene fiber reinforced concrete. Int. J. Sustain. Built Environ. 2016, 5, 345–354. [Google Scholar] [CrossRef] [Green Version]
  7. Zhang, P.; Li, Q.-F. Effect of polypropylene fiber on durability of concrete composite containing fly ash and silica fume. Compos. B Eng. 2013, 45, 1587–1594. [Google Scholar] [CrossRef]
  8. Tuutti, K. Corrosion of Steel in Concrete; Swedish Cement and Concrete Research Institute: Stockholm, Sweden, 1982. [Google Scholar]
  9. Fang, J.; Ishida, T.; Yamazaki, T. Quantitative evaluation of risk factors affecting the deterioration of RC deck slab components in East Japan and Tokyo regions using survival analysis. Appl. Sci. 2018, 8, 1470. [Google Scholar] [CrossRef] [Green Version]
  10. China Architectural Scientific. Standard for Technical Requirements and Test Method of Sand and Crushed Stone (or Gravel) for Ordinary Concrete; JGJ 52-2006; Ministry of Housing and Urban-rural Development of China: Beijing, China, 2006.
  11. China Architectural Scientific. Standard for Test Methods of Long-Term Performance and Durability of Ordinary Concrete; GB/T 50082; Ministry of Housing and Urban-rural Development of China: Beijing, China, 2009.
  12. Ministry of Communications of China (MCC). JTJ 270-98: Testing Code of Concrete for Port and Waterway Engineering; Profession Standard of the People’s Republic of China: Beijing, China, 1998. [Google Scholar]
  13. Li, W.; Pour-Ghaz, M.; Castro, J.; Weiss, J. Water absorption and critical degree of saturation relating to freeze-thaw damage in concrete pavement joints. J. Mater. Civ. Eng. 2012, 24, 299–307. [Google Scholar] [CrossRef]
  14. Qian, Y.; Farnam, Y.; Weiss, J. Using acoustic emission to quantify freeze–thaw damage of mortar saturated with NaCl solutions. In Proceedings of the 4th International Conference on the Durability of Concrete Structures; Purdue University Libraries Scholarly Publishing Services: West Lafayette, IN, USA, 2014; pp. 32–37. [Google Scholar] [CrossRef] [Green Version]
  15. Farnam, Y.; Bentz, D.; Sakulich, A.; Flynn, D.; Weiss, J. Measuring freeze and thaw damage in mortars containing deicing salt using a low-temperature longitudinal guarded comparative calorimeter and acoustic emission. Adv. Civ. Eng. Mater. 2014, 3, 20130095. [Google Scholar] [CrossRef]
  16. Powers, T.C.; Willis, T.F. The air requirement of frost-resistant concrete. Highw. Res. Board 1950, 29, 184–211. [Google Scholar]
  17. Powers, T.C. A working hypothesis for further studies of frost resistance of concrete. J. Proc. Am. Concr. Inst. 1945, 41, 245–272. [Google Scholar] [CrossRef]
  18. Mehta, P.K.; Monteiro, P.J. Concrete: Microstructure, Properties, and Materials; McGraw-Hill: New York, NY, USA, 2005. [Google Scholar]
  19. Jacobsen, S.; Sœther, D.H.; Sellevold, E.J. Frost testing of high strength concrete: Frost/salt scaling at different cooling rates. Mater. Struct. 1997, 30, 33–42. [Google Scholar] [CrossRef]
  20. Valenza, J.J.; Scherer, G.W. Mechanisms of salt scaling. Mater. Struct. 2005, 38, 479–488. [Google Scholar] [CrossRef]
  21. Marchand, J.; Sellevold, E.J.; Pigeon, M. The deicer salt scaling deterioration of concrete—An overview. In Proceedings of the Third International Conference on Durable Concrete, Nice, France, 22–28 May 1994; Malhotra, V.M., Ed.; pp. 1–46. [Google Scholar]
  22. Ghafoori, N.; Mathis, R.P. Scaling resistance of concrete paving block surface exposed to deicing chemicals. ACI Mater. J. Mater. J. 1997, 94, 32–38. [Google Scholar] [CrossRef]
  23. Esmaeeli, H.S.; Farnam, Y.; Haddock, J.E.; Zavattieri, P.D.; Weiss, W.J. Numerical analysis of the freeze-thaw performance of cementitious composites that contain phase change material (PCM). Mater. Des. 2018, 145, 74–87. [Google Scholar] [CrossRef]
  24. Scherer, G.W. Crystallization in pores. Cem. Concr. Res. 1999, 29, 1347–1358. [Google Scholar] [CrossRef]
  25. Liu, Z.; Hansen, W. Pore damage in cementitious binders caused by deicer salt frost exposure. Constr. Build. Mater. 2015, 98, 204–216. [Google Scholar] [CrossRef]
  26. Winkler, E.M.; Singer, P.C. Crystallization pressure of salts in stone and concrete. Geol. Soc. Am. Bull. 1972, 83, 3509–3514. [Google Scholar] [CrossRef]
  27. Wang, Z.; Zeng, Q.; Wang, L.; Yao, Y.; Li, K. Corrosion of rebar in concrete under cyclic freeze–thaw and Chloride salt action. Constr. Build. Mater. 2014, 53, 40–47. [Google Scholar] [CrossRef]
  28. Muethel, R.W. Investigation of Calcium Hydroxide Depletion as a Cause of Concrete Pavement Deterioration; Michigan Transportation Commission Research Report R-1353; Michigan Transportation Commission: Lansing, MI, USA, 1997. [Google Scholar]
  29. Jin, W.L.; Yi, Z.; Lu, Z.Y. Mechanism and mathematic modeling of chloride permeation in concrete under unsaturated state. J. Chin. Ceram. Soc. 2008, 36, 1362–1369. [Google Scholar] [CrossRef]
  30. Andrade, C.; Climent, M.A.; Vera, G. Procedure for calculating the chloride diffusion coefficient and surface concentration from a profile having a maximum beyond tne concrete surface. Mater. Struct. 2015, 48, 863–869. [Google Scholar] [CrossRef]
Figure 1. Dry–wet test.
Sustainability 12 00549 g001
Figure 2. Freeze–thaw test.
Sustainability 12 00549 g002
Figure 3. Failure modes of the specimens.
Sustainability 12 00549 g003
Figure 4. Water absorption after dry–wet cycling.
Sustainability 12 00549 g004
Figure 5. Weight-loss rate changes after freeze–thaw cycles.
Sustainability 12 00549 g005
Figure 6. Relative dynamic modulus of elasticity changes after freeze–thaw cycles.
Sustainability 12 00549 g006
Figure 7. Chloride profiles for specimens after dry–wet cycling.
Sustainability 12 00549 g007
Figure 8. Chloride profiles for specimens after freeze–thaw cycles.
Sustainability 12 00549 g008
Figure 9. Transport mechanism in a deicing salt environment.
Sustainability 12 00549 g009
Figure 10. Scanning electron microscopy (SEM) images of the specimens after curing.
Sustainability 12 00549 g010
Figure 11. SEM images of the specimens after the 30th dry–wet cycle.
Sustainability 12 00549 g011
Figure 12. SEM images of the specimens after the 100th freeze–thaw cycle.
Sustainability 12 00549 g012
Figure 13. Effect of fiber content on Dcl for all specimens in a chloride environment.
Sustainability 12 00549 g013
Table 1. Chemical compositions of the cement and fly ash/%.
MaterialCaOSiO2Al2O3Fe2O3MgOSO3
Cement63.0221.25.024.212.22.4
Fly ash4.8849.0231.566.970.830.84
Table 2. Physical and mechanical properties of the polypropylene fibers (PPFs).
LengthDiameterDensityElastic ModulusTensile StrengthElongation
(mm)(μm)(g/cm3)(MPa)(MPa)(%)
19200.9138002708
Table 3. Component amounts in the samples.
TypeCementStoneSandFly AshFiber VolumeWater
(kg/m3)(kg/m3)(kg/m3)(kg/m3)(%)(kg/m3)
C13751048720850180
C23751048720850.1180
C33751048720850.3180
C43751048720850.5180
Table 4. Test results of the flexural strength.
SpecimenBatchFiber Volume (%)Flexural Strength (MPa)
FT0FT50FT100
C1106.065.534.93
205.915.354.76
305.865.034.63
mean05.945.34.77
C210.16.546.195.81
20.16.386.085.68
30.16.175.915.53
mean0.16.366.065.67
C310.36.295.865.27
20.36.215.725.14
30.36.085.615.08
mean0.36.195.735.16
C410.55.735.515.19
20.55.615.415.03
30.55.475.264.91
mean0.55.605.395.04