Article

Ecosystem Service Response to Human Disturbance in the Yangtze River Economic Belt: A Case of Western Hunan, China

1
College of Life and Environmental Sciences, Minzu University of China, Beijing 100081, China
2
College of Urban and Environmental Sciences, Peking University, Beijing 100871, China
3
School of Urban Planning and Design, Peking University, Shenzhen 518055, China
*
Author to whom correspondence should be addressed.
These authors contributed equally to this article.
Sustainability 2020, 12(2), 465; https://doi.org/10.3390/su12020465
Submission received: 3 December 2019 / Revised: 24 December 2019 / Accepted: 5 January 2020 / Published: 8 January 2020

Abstract

:
Ecosystem conservation is one of the core elements of sustainable development. Studying the relationship between human disturbance and the ecosystem service value (ESV) change is an urgent need for the future. The Yangtze River Economic Belt is one of the key economic strategies implemented by the Chinese government and is also a demonstration zone for ecological conservation. Western Hunan is an important ecological barrier in the Yangtze basin where different ethnic groups live together and various cultures coexist. In this study, using land-use data and spatial analysis modeling, the changes in the ecosystem service value at five topographic gradients were evaluated. Human disturbance and its spatial correlation with the ecosystem service value from 1990 to 2015 were also investigated. The results demonstrated the following: (1) the proportional area of forestland and grassland increased as the topographic gradient index increased and other types of land-use gradually decreased; (2) The ecosystem service value at middle gradients increased over the study period; but ESV of the lowest topographic gradient showed a significant decline and a substantial decrease, as well as a terrain index under 0.7970; (3) The spatial analysis of human disturbance showed that more than 90% of intense human disturbance was distributed in the area of the lowest topographic gradient where topographic features were low-altitude and low-slope, and little human disturbance was scattered at other gradients; (4) There was a significant spatial aggregation distribution between the ecosystem service value and human disturbance in western Hunan, the high disturbance and low ESV aggregation was mainly distributed in Loudi City, the area east of Shaoyang City and Zhangjiajie City all belonged to the lowest topographic gradient, and the low–high and high–high aggregations were mainly distributed in Huaihua City and Xiangxi Tujia and Miao Autonomous Prefecture. Population density and gross domestic product were the main driving factors, while topography was the main ecological factor. This study could provide additional spatial information and theoretical guidance for ecosystem service management for sustainable development in western Hunan, China.

1. Introduction

Maintaining the harmony and peace of regional ecosystems is a basic condition for human survival and sustainable development in itself. Ecosystems provide valuable services for humans, and it is also influenced by humans. Human activities can heavily affect land use/cover change (LUCC) in regions, which in turn affects ecosystem services. Ecosystem services refer to the bundle of goods and services produced by direct or indirect ecosystem functions. The change in ecosystem services has a close connection with the well-being of humanity. Therefore, it has significant application potential for regional ecosystem service value evaluation and the analysis of the response to human disturbance. Ecosystem services (ES) are defined as the benefits that people obtain from ecosystems, which can be through provisioning, regulating, supporting, and cultural services [1]. To enable mapping and a comparison of ecosystem services, the concept of ecosystem service value (ESV) was defined. In monetary terms, ESV refers to the amount of supply of ecosystem services that leads to changes in human welfare [2]. Human disturbance refers to the direct and indirect alterations to the Earth’s system by humans. Indicators of hemeroby associated with whole ecosystems could be an integrative measure to quantify the impact of human activities on ecosystems [3,4]. The dependence of humans on ecosystems is widely acknowledged [5]. Ignoring the impacts of human disturbance on ecosystems could severely threaten the global environment and humans. Hence, as a core part of ecosystem service management in the sustainable development of the environment, there is an urgent need to facilitate the understanding of the dependence of ecosystem service change on human disturbance [6,7].
Human disturbance is a measure of human impact on the ecosystem, with the disturbance level varying based on the intensity of human activity in the natural development of ecosystems [8,9]. At present, most research on human disturbance is focused on the population scale or community scale, and a lot of this research is about animals [10,11,12,13]. For the specific ecosystem, most of the research focuses on vegetation areas [14,15]. When choosing human disturbance indicators, some scholars chose the distance of the things associated with human activities as indicators, such as road distance and farm distance [16,17]. Some scholars qualitatively described human settlements as indicators of human disturbance [18]. Human beings live on the ground and different types of land to basically support our daily life. Land use/cover types are relevant to the intensity of human-induced disturbance in the environment but they have not been adequately studied. Therefore, it is meaningful to estimate the value of human disturbance based on land use/land cover data.
Existing research efforts characterizing the impacts of human activities on the eco-environment have mainly focused on the following aspects: land surface [19,20], landscape structure [21,22,23,24,25,26], biodiversity [27,28,29,30], and ES [1,31,32]. Despite research efforts related to ES having increasingly shifted to the detection of the relationships between humans and ES in the context of sustainable development, there is scant research in spatial heterogeneity [31,32,33]. To capture the spatial relationship with ESV and human activities more accurately, a spatial correlation analysis model is an extremely effective approach for analyzing spatial characteristics integrated with human factors.
The area of the Yangtze River Economic Belt is 2.05 million km2, covering 21.4% of China, and includes 11 provinces. In 2018, the residents here made up 42.9% of China’s population and its gross domestic product (GDP) accounted for 44.1%. The Yangtze River was issued “Guidance of promoting the development of the Yangtze River Economic Zone which relies on the golden waterway” and promoting the development of the Yangtze River Belt was listed as the new strategy of opening up and developing the area [34]. This study was conducted for western Hunan, in the upper reaches of the Yangtze River, which is the main forest region of China and an important ecological barrier zone of the Yangtze basin. However, compared to the rich research on the Yangtze River Delta (YRD), which is in the lower reaches of the Yangtze River [35,36], there is only scant research on the upper reaches. The topography is complicated and the factors of topography are vital to the change of land-use patterns. Therefore, our research sought to make a preliminary exploration toward understanding the dependence of ES heterogeneity on human disturbance in the upper reaches of the Yangtze River through a case study of the western Hunan, China. On the basis of topographic gradients, this study evaluated the ecosystem service value and human disturbance in each of the 21,150 grid samples through Python. Moreover, the study analyzed the relationship between ecosystem service value and human disturbance from 1990 to 2015. This study is crucial in order to make appropriate ecological economic development policies for the local Miao group and for the sustainable development of the ecological environment in western Hunan. It also has some reference value for the ecological development of the typical mountainous hilly region of East Asia.

2. Materials and Methods
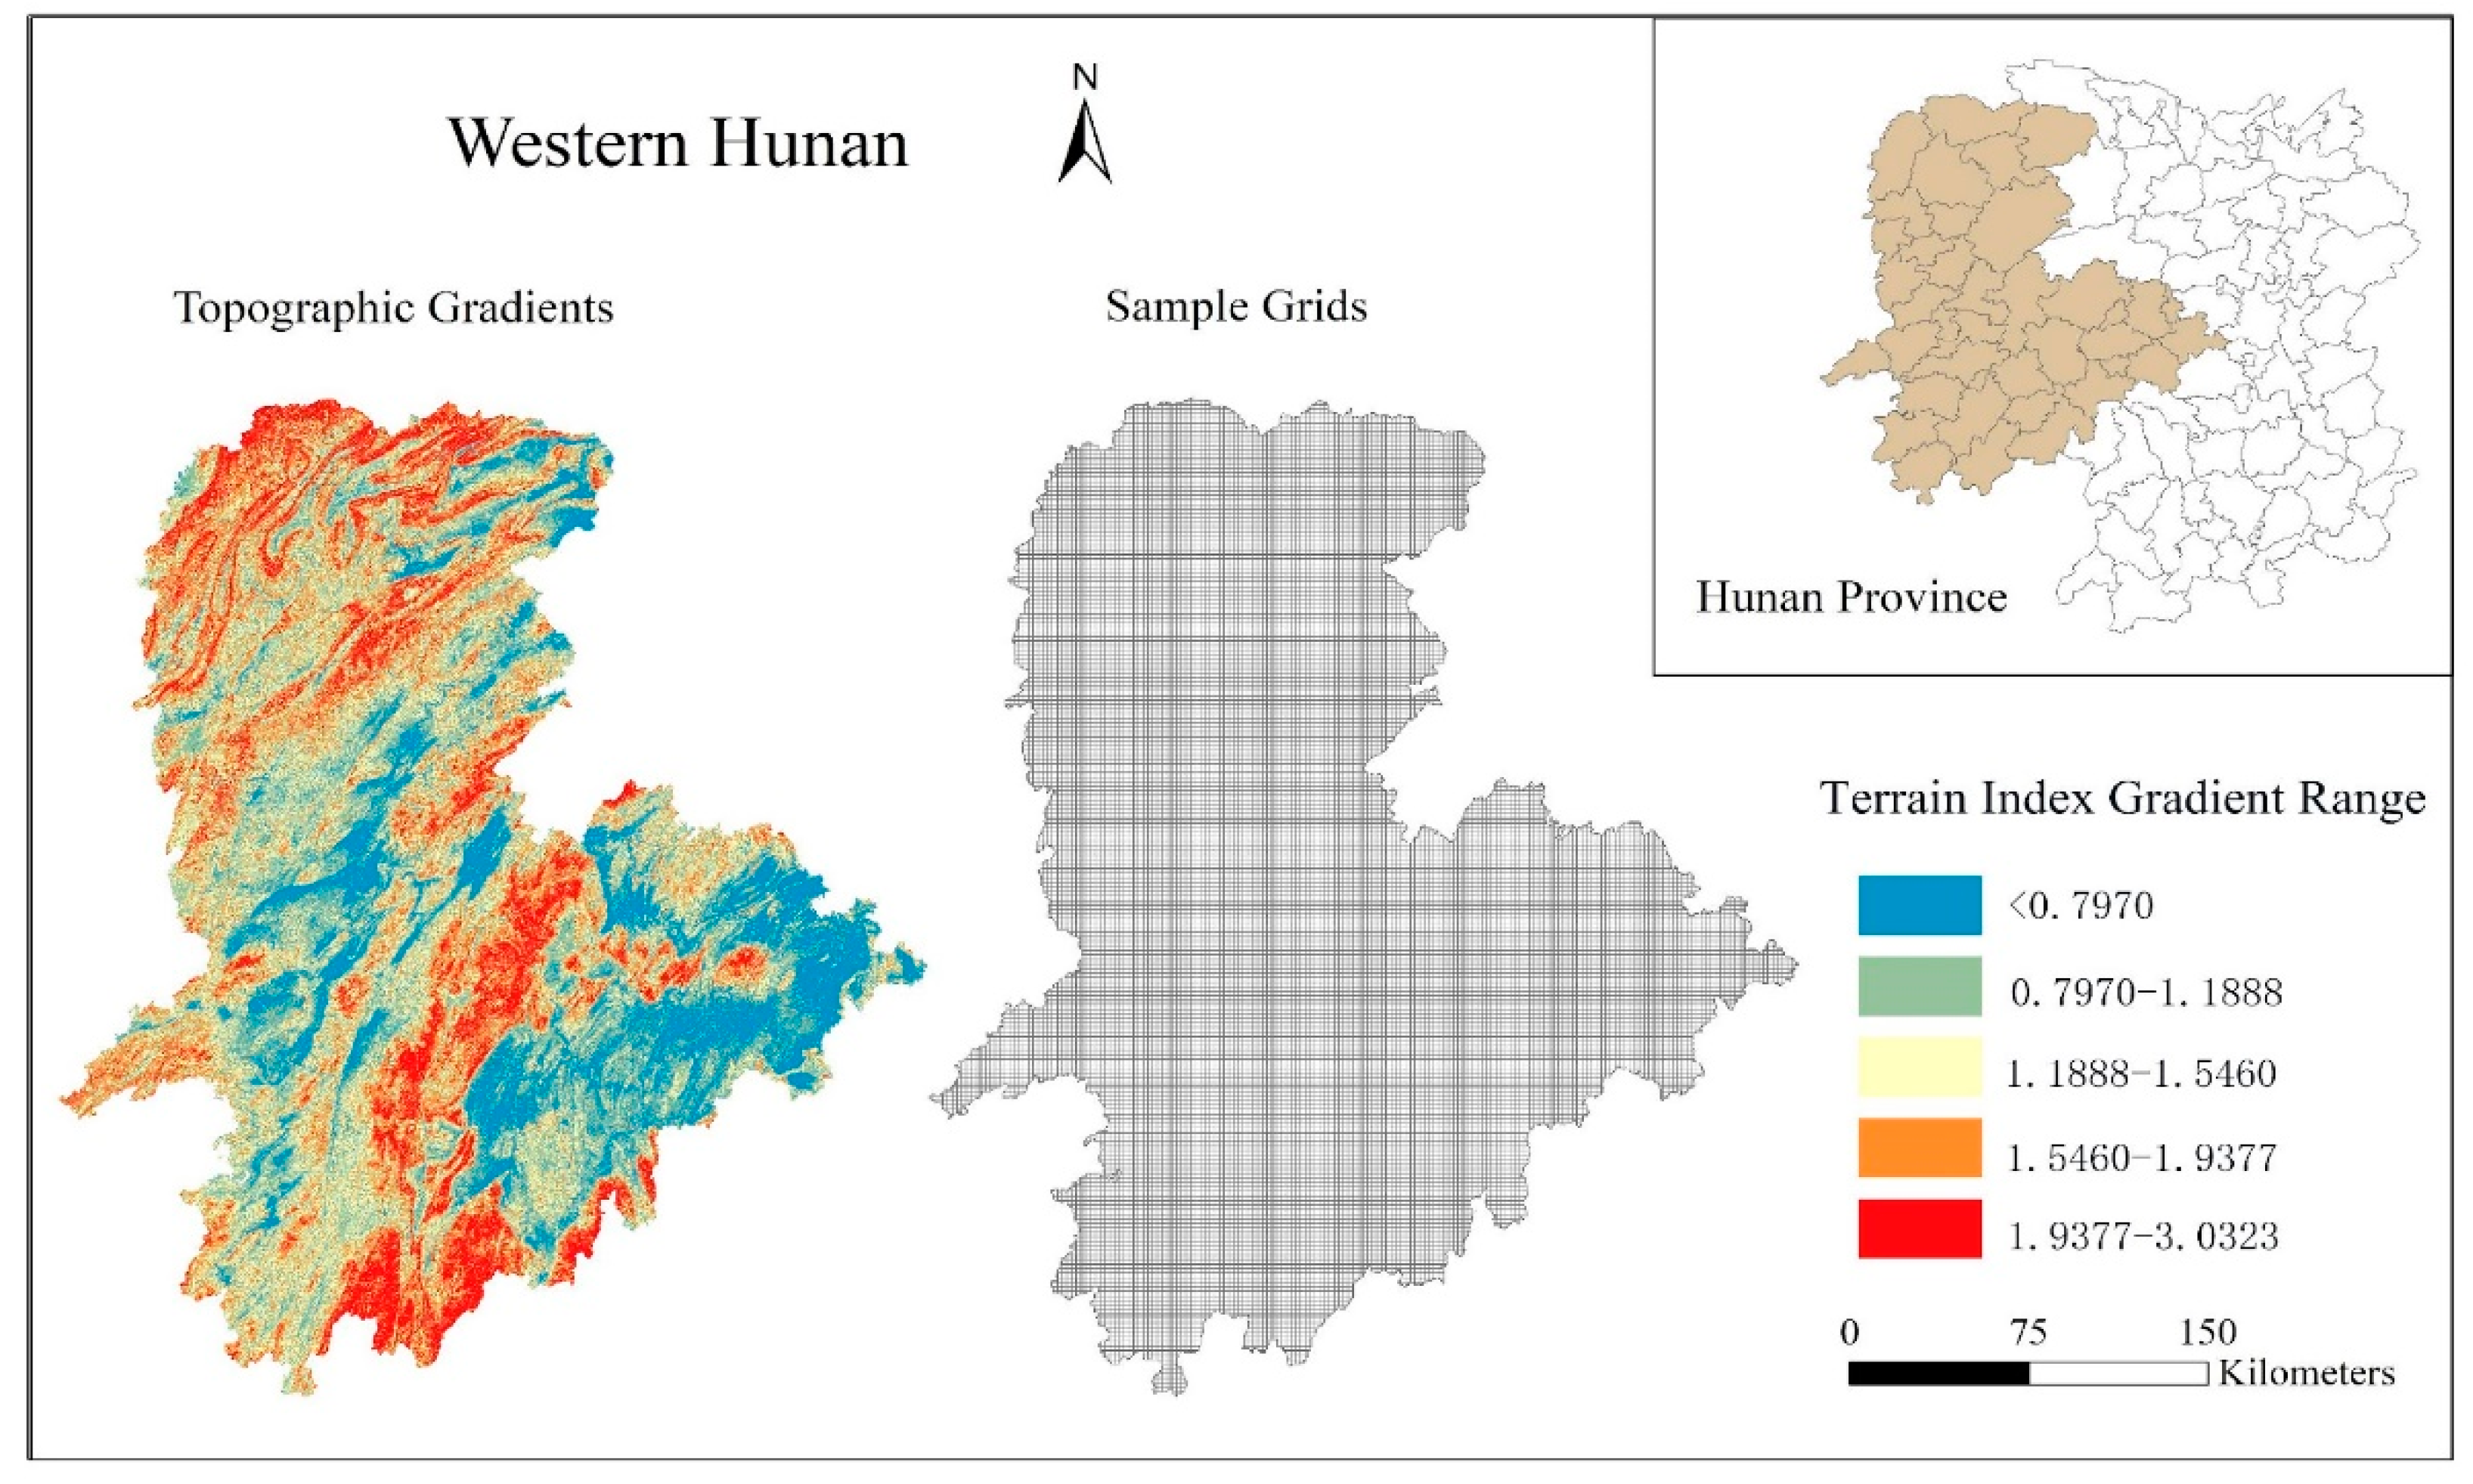
2.1. Study Area

The study area, which is located in the west of the Hunan Province, includes Shaoyang, Zhangjiajie, Huaihua, Loudi City, and Xiangxi Tujia-Miao Autonomous Prefecture with a total area of 81,690 km2 (Figure 1). It lies in the center of the borders between four provinces, between 108°47′ to 112°57′ longitude, and 25°58′ to 29°48′ latitude. Western Hunan, with an elevation of 50 m to 1903 m, includes the Xuefeng and Wuling Mountains and is surrounded by the Yungui Plateau. The mountains are covered with forests and grassy landscapes in the middle and north, which provides the main ecosystem services of western Hunan. It has a subtropical monsoon humid climate as well as typical continental characteristics. The annual average temperature of western Hunan is around 17–18 ℃, and the annual precipitation is 1100 to 1600 mm. By the end of 2015, there were 20.19 million residents in this region. The GDP in western Hunan amounted to 489.7 billion, 16.09% of the Hunan Province, which is the main area of 20 concentrated impoverished counties in the west of the province.

2.2. Data Collection

Land use/land cover (LULC) data of 1990, 1995, 2000, 2005, 2010, and 2015 were used for this study. The data are accessible from the Data Center for Resources and Environmental Sciences, the Chinese Academy of Sciences (RESDC). The data of the population density (POP) were also obtained from RESDC. The data of the gross domestic product (GDP) were obtained from the National Earth System Science Data Sharing Infrastructure, National Science and Technology Infrastructure of China. The spatial resolution is 1 km.

2.3. Method

2.3.1. Topographic Factors Grading

The terrain niche index is a topographic index for the comprehensive description of elevation and slope. It can fully display a certain point’s topographic condition and it is usually used to analyze the differences between land-use structure and ecosystem service value in various topographic conditions. A site with a lower elevation and slope has a lower terrain niche index. A site with high elevation but low slope or with low elevation but high slope has a medium terrain niche index [37]. This study firstly calculated the terrain niche index with the formula in each grid and then, based on the calculation and Jenks natural breaks methods, divided the study region into 5 topographic gradients. Topographic gradient 1 to 5 corresponded to the terrain niche index as follows, under 0.7970, 0.7970–1.1888, 1.1888–1.5460, 1.5460–1.9377, 1.9377–3.0323.
Terrain niche index formula is as follows:
T = ln [ ( E E 0 + 1 ) × ( S S 0 + 1 ) ]
where T is the terrain niche index; E is the elevation of a certain point and the unit is meter; S is the slope of a certain point and the unit is degree; E0 is the average elevation in the study region and S0 is the average slope in the study region.

2.3.2. Ecosystem Service Value Evaluation

Based on Costanza’s results [38], Xie (2003) [39] estimated the value of each type of ecosystem service by extracting the equivalent weighting factors of ecosystem services in China. For those occurring at the local level, the value coefficient of ecosystem services per unit area of each land-use category was calculated based on the net productivity (NPP) in Eastern Sichuan according to Ye [40]. We used the ratio of the average NPP of Hunan province to the average NPP of China to adjust the value coefficients of ecosystem services for this study area (parameter C in the followed formula). We used the weighting factors of Xie (2003), which was suitable for China, as every land-use type corresponded to different weighting factors. The ESV of a grid sample is the sum total of the product of weighting factors and connected land type area. The formula is as follows:
ESV s , k , t = a k , t × V C s , k , t
E S V t = C × k s E S V s , k , t
where VCs,k,t is the per-hectare value coefficient of each ecosystem service s provided by each land-use k at time t; ak,t is the area of each land-use k at time t; ESVt represents the total ecosystem service value at time t; C is the value coefficient based on NPP.

2.3.3. Human Disturbance Evaluation

It is hard to use the distance of a specific object to characterize the impact of human disturbance on an ecosystem. According to the studies of integrated models of human disturbance and land-use in recent years, we set the human disturbance index table of different landscape types based on Chen et al.’s study [41] and then constructed a model of human disturbance index. This study collected spatial samples with 2 × 2 km grids. To get the human disturbance value in each period, we used Python to calculate human disturbance in 21,150 grid samples for 6 different time periods. The human disturbance value in one grid sample is summed by the product of the land type area and its corresponding index. The human disturbance index equation, as used in previous studies [32,41], is formulated as follows:
D = i = 1 m H I i × S i S
where D is the hemeroby index; m is the number of land types; HIi is the coefficient of land type i; Si is the area of land type i; s is the total area of the study area.
The result was then grouped into five levels using natural breaks in ArcGIS 10.4.

2.3.4. Spatial Correlation Analysis

This study used bivariate Moran’s I and bivariate local Moran’s I in GeoDA Software to analyze the spatial correlation of the ecosystem service value and human disturbance. Then we made a LISA map to find whether the ecosystem service value and human disturbance displayed a spatial aggregation and to recognize the characteristics between different spatial elements. The LISA map divided the study region into 5 categories: no significant aggregation, high-high aggregation, low-low aggregation, low-high aggregation, high-low aggregation.

3. Results

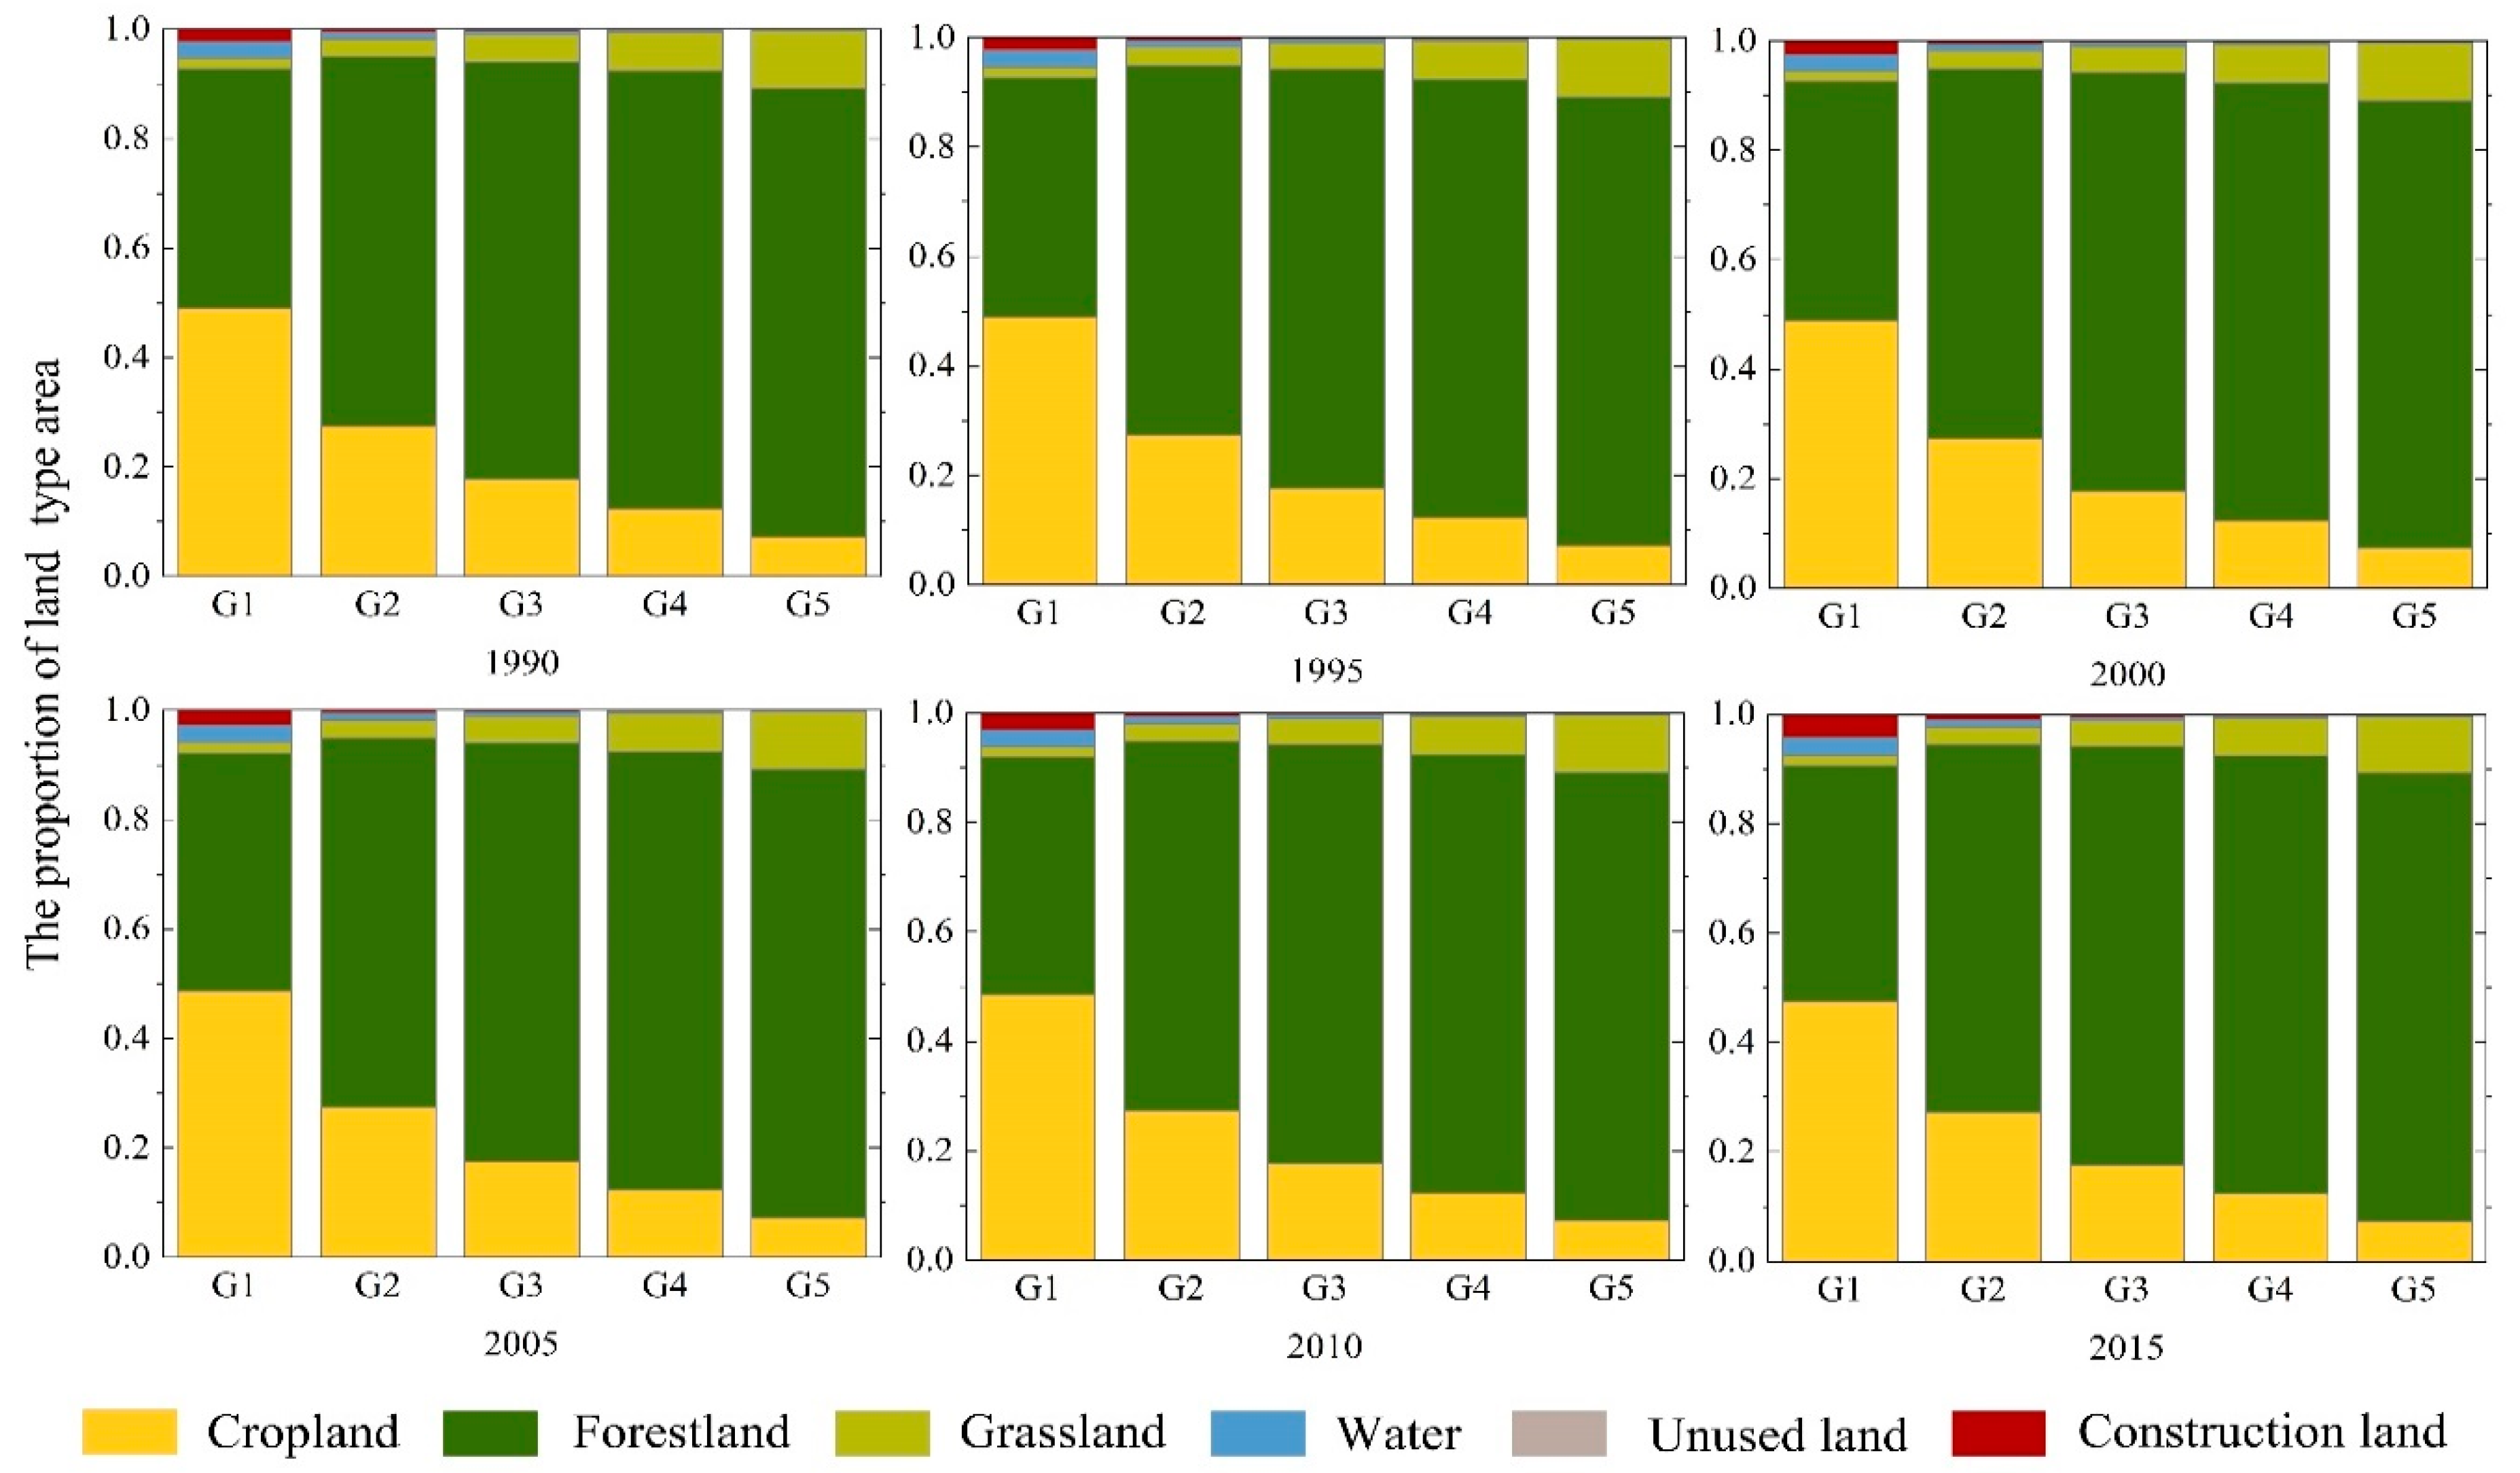
3.1. Land-Use Changes at Different Topographic Gradients

The area proportion of different land-use types are presented in Figure 2. In this study, the proportion varied with different topographic gradients and the land-use types in western Hunan was dominated by forestland. For example, forestland had an average of 43% at topographic gradient 1 and an average of 82% at topographic gradient 5. During the study period, the land-use types were found to change as follows. First, the area of cropland, water, construction land, and unused land continuously decreased when topographic gradients increased. For example, cropland had the largest gradient difference in 1990, from 49.1% at topographic gradient 1 to 7.3% at topographic gradient 5. Second, the area of forestland and grassland continuously increased when topographic gradients increased. For instance, forestland had the largest gradient difference in 2015, from 43.1% at topographic gradient 1 to 81.9% at topographic gradient 5.

3.2. Temporal and Spatial Changes of the Ecosystem Service Value at Topographic Gradients

The ecosystem service value, changing with time and topographic gradients, are shown in Table 1. From 1990 to 2015, the ecosystem service value of western Hunan had an overall increasing trend, except for the ESV at topographic gradient 1. For example, the average ESV in each hectometer at topographic gradient 2 increased from 105,075.0 yuan to 105,384.0 yuan, which was the highest growth among all gradients with a general change of 309.0 yuan per hectometer over the past 25 years. Furthermore, the lowest growth was given at topographic gradient 5 with an increase of 223.0 yuan per hectometer increase. From 1990 to 2000, the ESV at topographic gradient 1 to 4 rose slowly, while it continuously fluctuated at topographic gradient 5. From 2010 to 2015, the ESV at all gradients slipped with the largest decrease of 432.3 yuan per hectometer at topographic gradient 1 and the smallest decrease of 116 yuan per hectometer at topographic gradient 3.

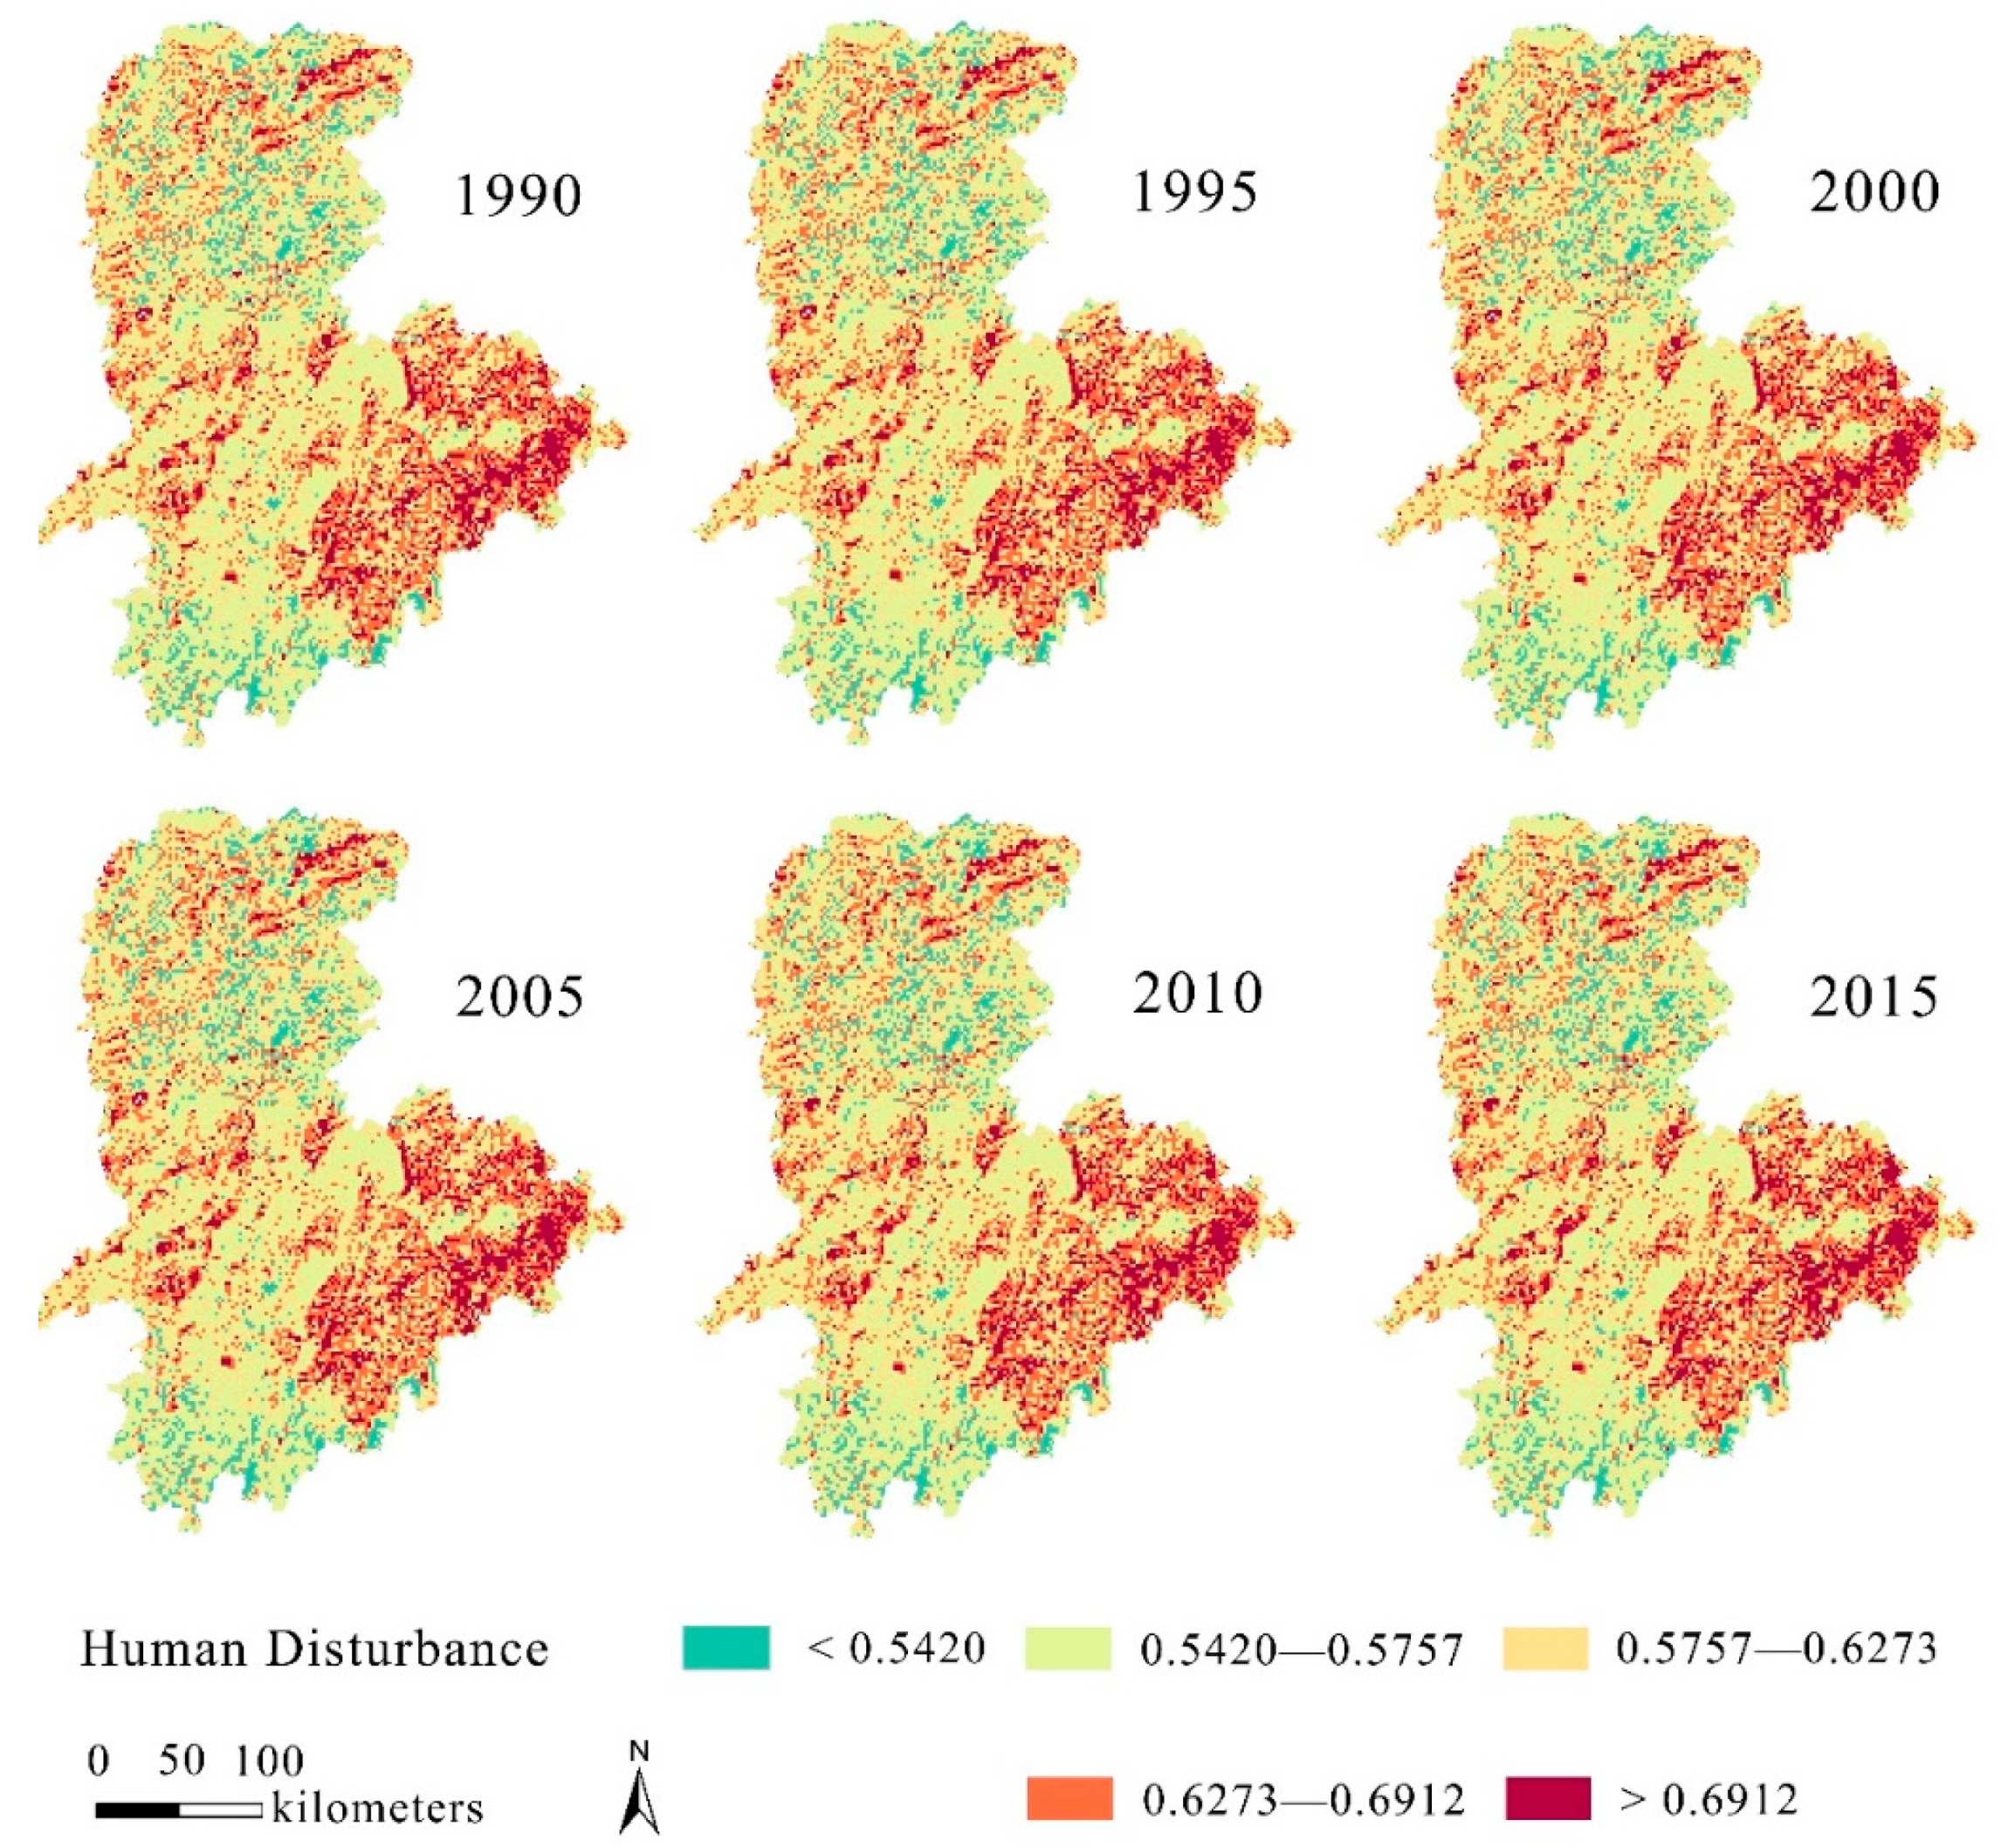
3.3. The Spatial Distribution of Human Disturbance

The intensity of human activities affects changes in land-use structure, which leads to changes in the ecosystem service value. The calculation results of human disturbance in western Hunan showed that the human disturbance index in 1990 and 2015 is 0.596522 and 0.597902, respectively, indicating a very significant upward trend. The spatial distribution characteristics of human disturbance in the study period were obtained by calculating the human disturbance index of 21,150 spatial grids in western Hunan (Figure 3). The results showed that the degree of human disturbance is relatively low in most areas of western Hunan, while the areas of large disturbance are mainly concentrated in construction land and cropland. From 1990 to 2015, the areas with a high disturbance degree tended to gradually expand, and the expansion trend was more significant after 2005. In Figure 3, there was an obvious regional agglomeration of high human disturbance distribution, especially in Loudi City, eastern Shaoyang City, and some other places. These agglomeration areas had the common characteristics of low altitude and gentle slope, which meant they were distributed at topographic gradient 1. The spatial analysis between areas with high human disturbance and different topographic gradients showed that topographic gradient 1 was dominated by high human disturbance grids, which took up 91% of the area in six periods. Meanwhile, the terrain niche index of topographic gradient 1 was lower than 0.7970, indicating its low elevation and low slope characteristics. It is a densely inhabited area by human beings. It is the area most suitable for human activities, development, and utilization. The topographic gradient has a great influence on human disturbance, and human disturbance decreases with the rise of the topographic gradient.

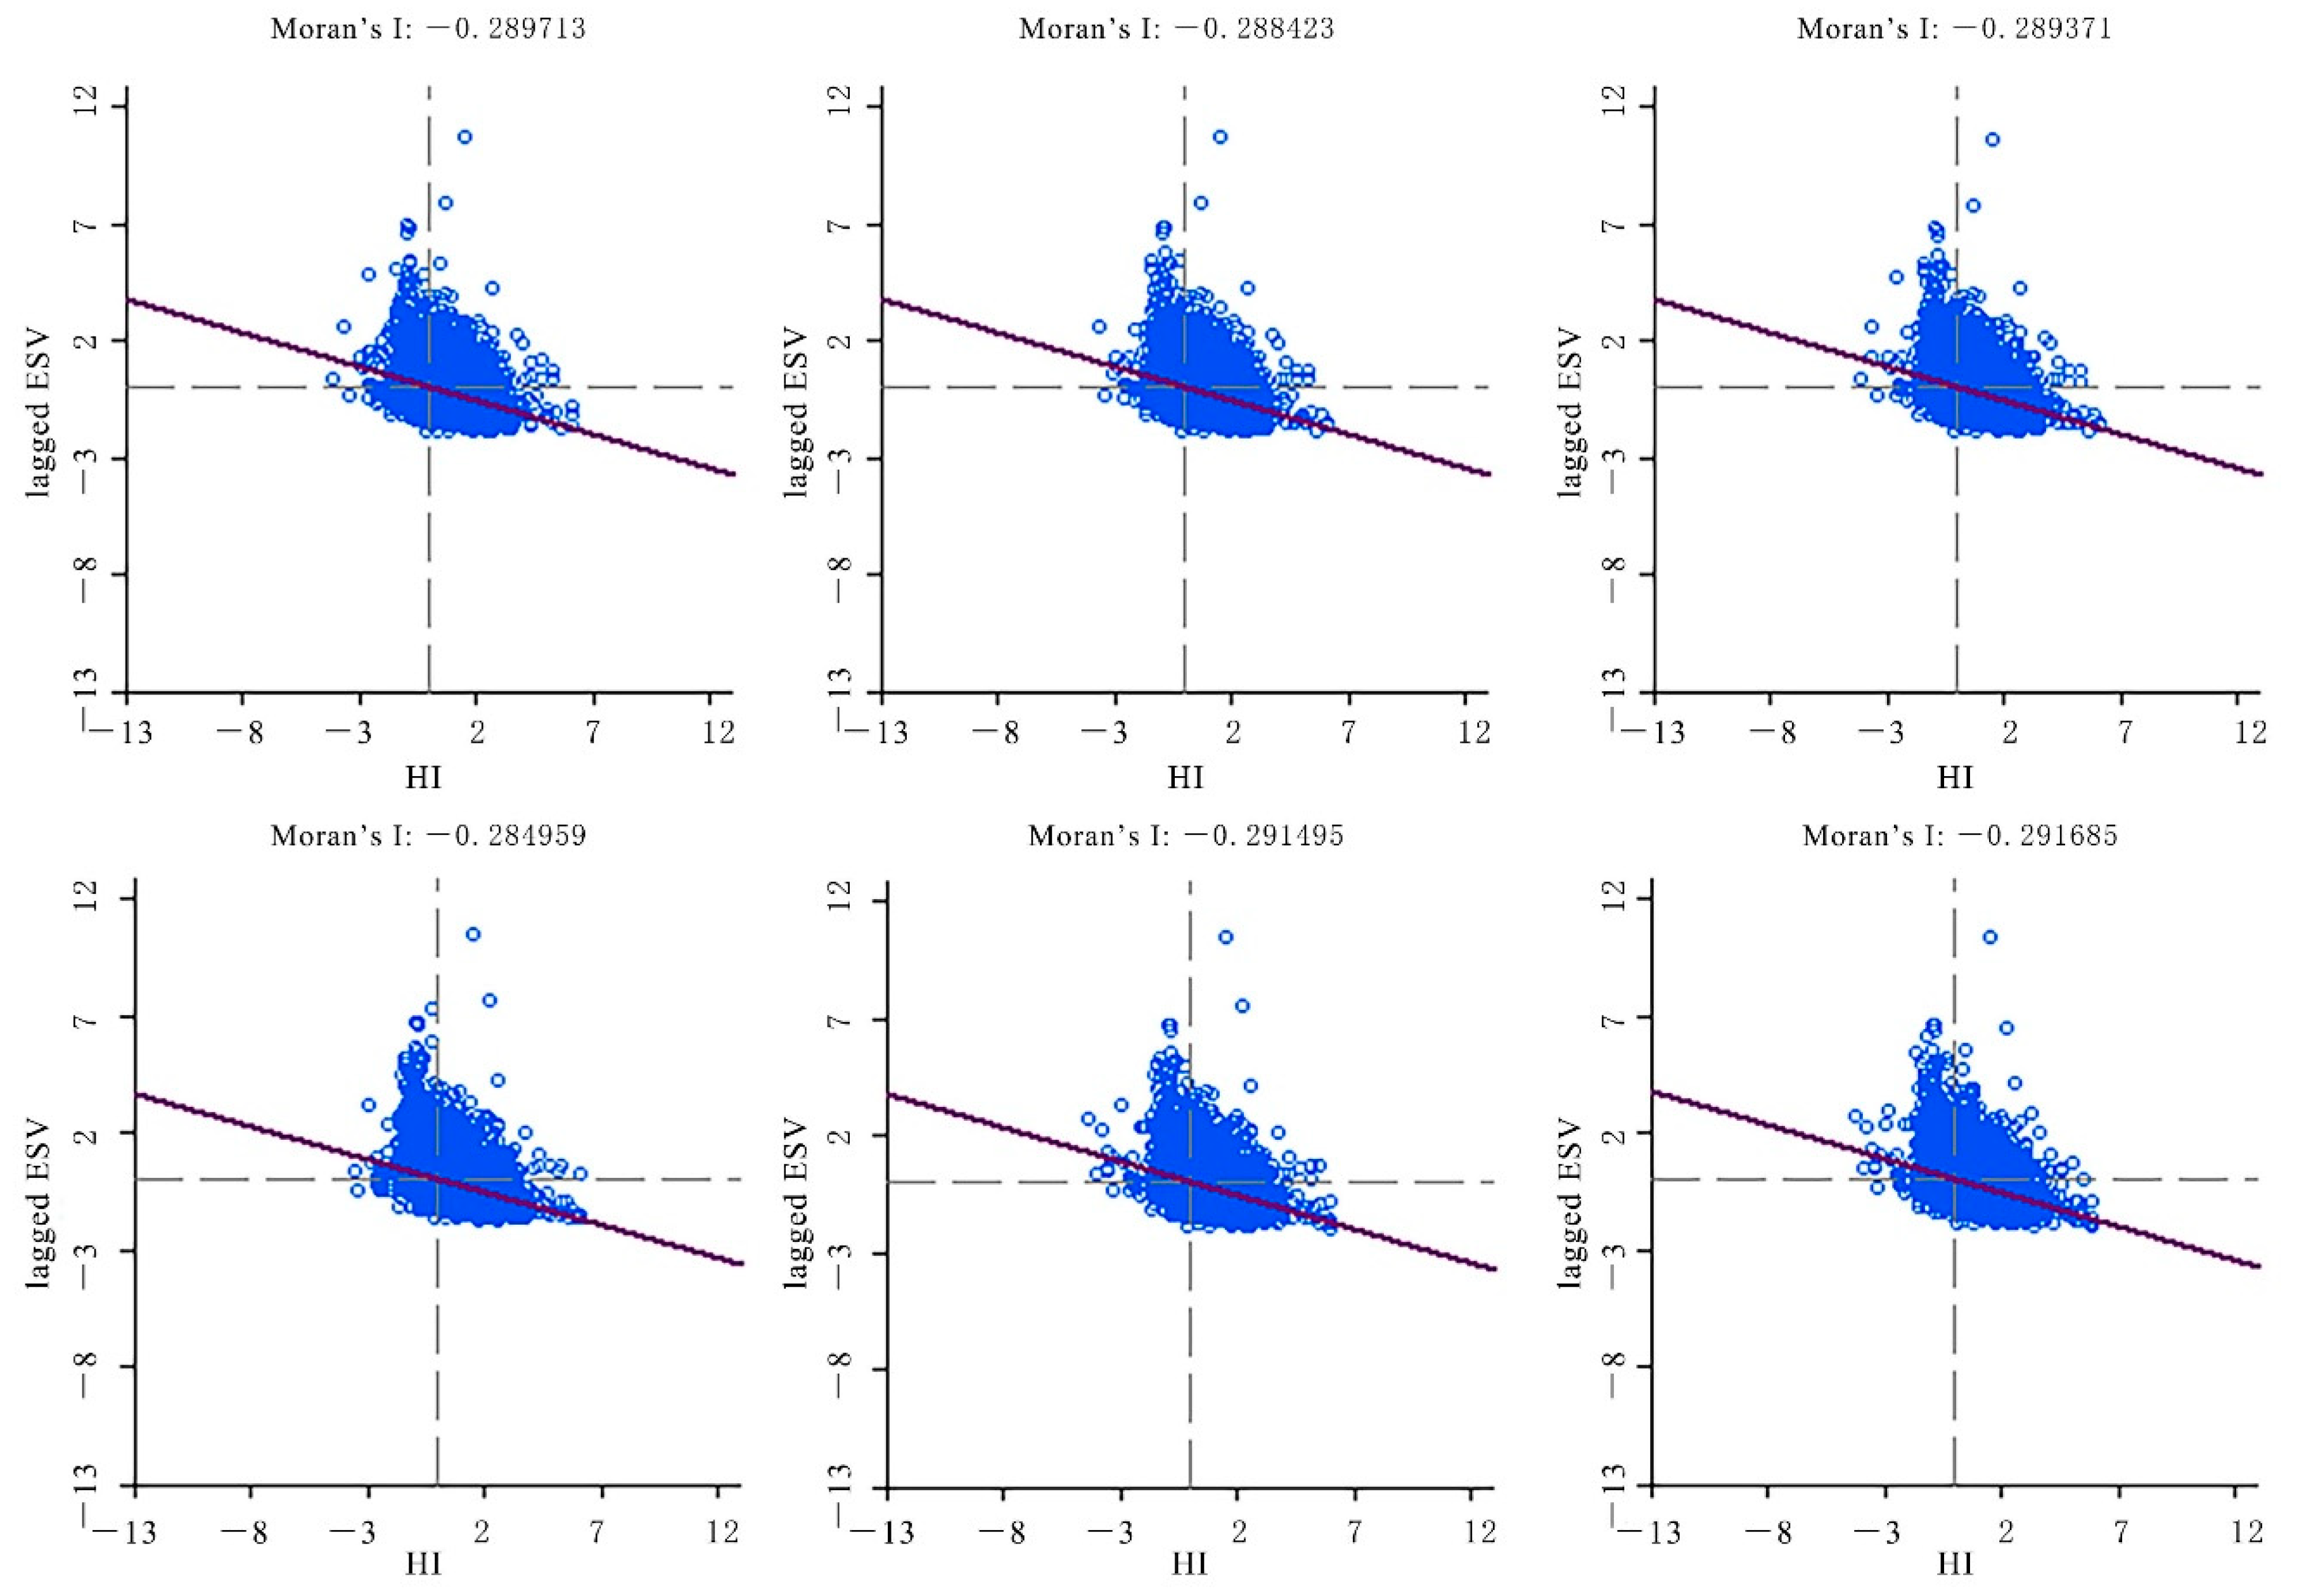
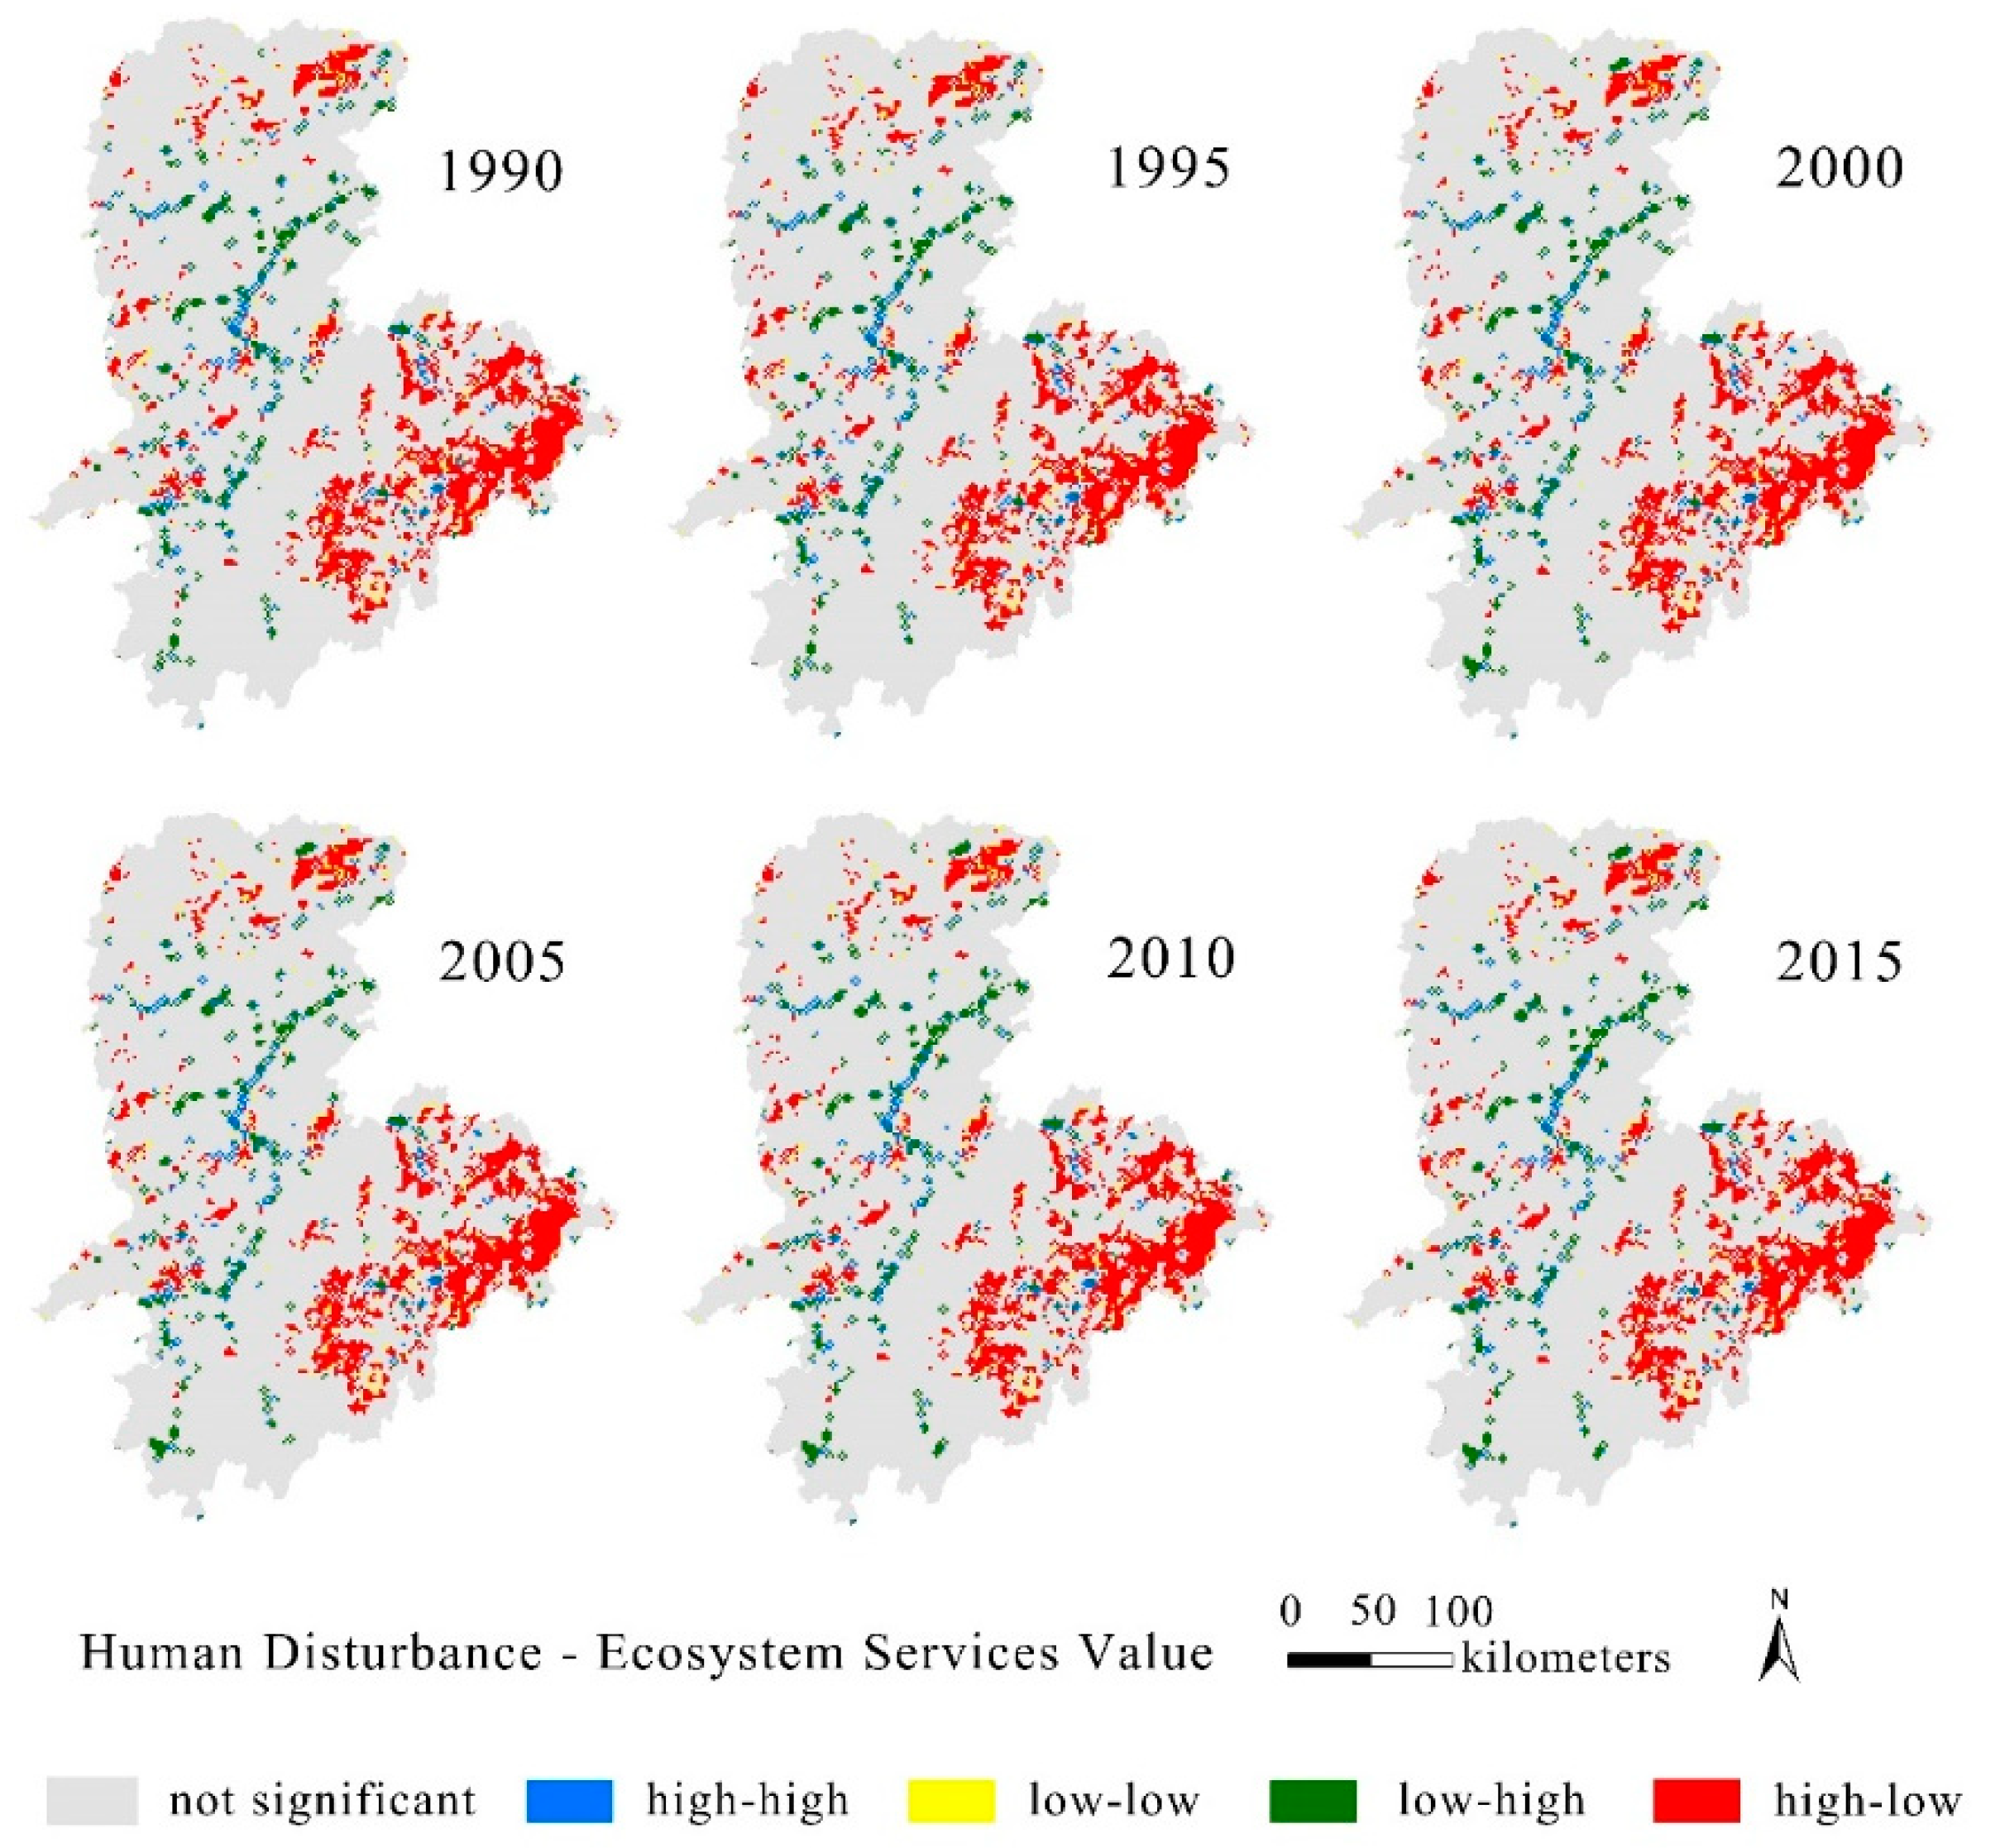
3.4. Spatial Relationship between ESV and Human Disturbance

The global spatial correlation and spatial data test results of ESV and human disturbance are shown in Table 2 and Figure 4. The Moran’s I index in 1990 and 2015 was −0.2897 and −0.2917, respectively. If the absolute value of Z value is greater than 2.58 when under 99% confidence, the original assumption should be accepted. That is to say, the data has more than 99% probability for spatial correlation. The higher the absolute value of the Z value is, the better the effect of spatial clustering is. In Table 2, we can see a strong negative correlation between human disturbance and ecosystem service value in western Hunan from 1990 to 2015. Moreover, Moran’s I index and the Z value’s absolute value increased over the past 25 years, indicating that the spatial correlation effect of ESV and human disturbance tended to increase.
The results of the spatial differentiation analysis of the local spatial clustering effects of ESV and human disturbance can be seen in Figure 5. The number of grids with spatial clustering effects in western Hunan accounted for more than 17% of the total when under 95% confidence; this amount steadily increased over the past 25 years. In the study periods, it continued to increase from 1990 to 2005, and then decreased slightly. The grids with a high–low aggregation effect accounted for a large proportion in the total number of grids with a clustering effect, and the high–low aggregation was more obvious at topographic gradient 1. Generally speaking, most of the grids that had an agglomeration effect were distributed at topographic gradient 1. In 1990 and 2015, the ratio of the high–low agglomeration grid numbers at topographic gradient 1 to the number in the whole study region was 0.9581 and 0.9583, respectively. It can be seen that the agglomeration effect of high human disturbance and a low ecosystem service value at the topographic gradient 1 slightly increased, and the overall trend was upward, especially from 1990 to 2005. The ESV decreased as human disturbance increased, and it followed with a significant agglomeration. The main areas with a high–low clustering effect were Loudi City, eastern Shaoyang City and eastern Zhangjiajie City. There were four prefecture-level cities with a concentrated distribution at topographic gradient 1, of which three cities had an obvious high–low clustering effect. Only the high–low spatial agglomeration of Huaihua City is relatively weak. Loudi City and eastern Shaoyang City were also the main agglomeration areas with high human disturbance. The agglomeration areas with high human disturbance presented a significantly low ecosystem service value. It can be seen that the ecosystem service value would decrease with an increase in human disturbance. The area of other clustering effects was small, as the low–high clustering effect and the high–high clustering effect mainly occurred in Huaihua City and Xiangxi Prefecture.

4. Discussion

In this research, the value coefficient model was selected to calculate the ecosystem service value. This method is suitable for large-scale regional ecosystem service value evaluation. In recent years, many relevant studies on watersheds and regions have adopted this method, and the value coefficient model distinguished by landscape classification has been selected for human disturbance. This model is convenient for large-scale grid calculation and processing of the measurement of human disturbance and breaks the restriction of administrative divisions caused by the measurement of reference economic factors.

4.1. The Influence of Land-Use Patterns on ESV in Different Terrain Gradients

Due to the specific characteristics, such as the difference mobility and exploit cost, different topographic gradients could have a substantial effect on the land-use pattern and affect ecosystem services, such as changes in the ecosystem service value. According to this study, this effect could be seen by the inverse relation shown between cropland, water, construction land, and topographic gradient. As the former three increased, the latter decreased. Conversely, forestland and grassland both increased as the topographic gradient increased. Moreover, as the topographic gradient increased, the ecosystem service value increased as well. These increases of ESV were regarded for the results of the forestland area increase, which was discussed in many previous studies [37,42]. Western Hunan is located in the Wuling Mountain where the topography is complex. The changes in ESV were affected by both nature and human activities. From the aspect of nature, human activities could be limited by topography and it could result in the limited choices of cropland and construction land, which were more distributed in low topographic gradients [37]. Furthermore, the increase in the proportion of cropland and construction land in every gradient and the decrease in the proportion of forestland and grassland in every gradient will lead to the reduction of ESV. In regard to human activities, the awareness of ecological environmental protection gradually improved in China during the study period for a number of conservation policies were promulgated. As several pilots of returning cropland to forestland and wetland existed in western Hunan, the area of cropland reduced while the area of wetland increased. This change was conducive to an ecosystem service value increase. However, urban construction was still occurring at high speed, which was shown by the changes in construction land. Additionally, compared with the Yangtze River Delta, western Hunan had a more positive result, for its total ESV tended to increase while it was the opposite in YRD [35].

4.2. Effects of Human Disturbance on ESV in Different Terrain Gradients

The results showed that a significant negative relationship existed between topographic gradients and human disturbance; as human disturbance decreased, topographic gradients increased, which verified that a higher degree of human disturbance was correlated with a lower ecosystem service value, as suggested by Brentrup [8]. We can classify the land-use types into two categories according to the degree of human disturbance. The first one includes construction land, cropland, and unused land. This category is mainly for artificial system land. The second category is mainly for natural system land, including forestland, grassland, and water. The costs for artificial system land would increase with increasing topographic gradients. Therefore, human activities decreased with increasing topographic gradients. All these factors could result in a reduction of human disturbance, and similar results were mentioned in Wu’s study [31]. Moreover, according to the field survey data, Loudi City and Shaoyang City are both located in low gradients, and these two cities are the main agricultural production areas in China where the level of human disturbance was relatively high and the ecosystem service value was relatively low. There are national scenic spots and forest parks in Huaihua City and Zhangjiajie City. These areas belong to prohibited development zones. Furthermore, there are many mountainous areas in the region. The natural geographical characteristics of high altitude and steep slope limit the development of urban construction. Combining the result of the ecosystem service value varied with topographic gradients. Although the ESV increased generally from gradient 2 to gradient 5, the number of high disturbance and low ESV clustering grids still tended to increase. This may imply that the speed of restoration in nature was slower than the speed of human disturbance. This result may demonstrate that urban expansion and human construction is irreversible to some degree. However, the low disturbance and high ESV clustering results also indicated a good local economic development model. Therefore, in the context of the Yangtze River Economic Belt planning, we should adopt a development model according to local conditions, and give priority to the rational and ecological planning of these areas, so as to keep the balance between human and natural ecosystem developments. Moreover, the ecological compensation mechanism is one of the most important references for its planning and development [43].
In this research, the spatial response model of ecosystem services and human disturbance was studied from an innovative perspective, which provides a data basis for regional ecological planning, ecological compensation, and other policies. At the same time, this method can also be applied to research on other relevant areas.

5. Conclusions

Topography and human activities can have a substantial effect on ecosystem services and topography can also limit human activities, which impacts human disturbance. However, the calculations of the changes in the ecosystem service value and human disturbance based on topographic gradients are still rather little. With the help of Python, the ecosystem service value and human disturbance of 21,150 grids in the study area from 1990–2015 were calculated, ensuring the accuracy and reliability of data processing. As topographic gradients increased, the area proportion of forestland in western Hunan increased while the proportion of other land-use types decreased. Among them, the cropland proportion decreased most. Accordingly, with the rise of the topographic gradient, the ecosystem service value per unit area increased, but the ecosystem service value of topographic gradient 1 showed a significant decline. Moreover, based on the grid method, the spatial distribution of human disturbance and its relationship with the topographic gradient are analyzed, which was convenient in order to understand the spatial clustering characteristics. As mentioned above, there was a strong negative correlation between the ecosystem service value and human disturbance value in western Hunan. The spatial characteristics of the grading of human disturbance showed that human disturbance in the whole area has increased in the study period. The local analysis showed that more than 90% of the grids with a high human disturbance degree were distributed at topographic gradient 1. Spatial clustering analysis of the ecosystem service value and human disturbance can more accurately identify the areas where a spatial clustering effect has occurred, and provide a more accurate regional development guidance for local decision-making and Yangtze River Economic Belt strategy. However, this study only describes the overall circumstances, and it lacks some specific objects, such as scarcity effects of ecosystem services. The social factors in this study could also be improved in future work.

Author Contributions

Conceptualization, L.G.; Formal analysis, Y.C. and N.X.; Funding acquisition, L.G.; Methodology, Y.C. and N.X.; Supervision, L.G.; Visualization, Q.Y. and Y.C.; Writing—original draft, Y.C. and N.X. All authors have read and agreed to the published version of the manuscript.

Funding

The work presented in this paper was supported by the key research project of the Chinese Ministry of Science (2017YFC0505601) and innovation team project of the Chinese Nationalities Affairs Commission (10301-0190040129).

Acknowledgments

We acknowledge the constructive comments of anonymous reviewers.

Conflicts of Interest

The authors declare no conflict of interest.

References

  1. Millennium Ecosystem Assessment (MA). Ecosystems and Human Well-being: Synthesis; Island Press: Washington, DC, USA, 2015. [Google Scholar]
  2. Daily, G.C.; Polasky, S.; Goldstein, J.; Kareiva, P.M.; Mooney, H.A.; Pejchar, L.; Ricketts, T.H.; Salzman, J.; Shallenberger, R. Ecosystem services in decision making: Time to deliver. Front. Ecol. Environ. 2009, 7, 21–28. [Google Scholar] [CrossRef] [Green Version]
  3. Walz, U.; Stein, C. Indicators of hemeroby for the monitoring of landscapes in Germany. J. Nat. Conserv. 2014, 22, 279–289. [Google Scholar] [CrossRef]
  4. Zhou, Y.; Ning, L.; Bai, X. Spatial and temporal changes of human disturbances and their effects on landscape patterns in the Jiangsu coastal zone, China. Ecol. Indic. 2018, 93, 111–122. [Google Scholar] [CrossRef]
  5. Vallecillo, S.; Polce, C.; Barbosaa, A.; Castilloc, C.P.; Vandecasteelec, I.; Ruschd, G.M.; Maesa, J. Spatial alternatives for Green Infrastructure planning across the EU: An ecosystem service perspective. Landsc. Urban. Plan. 2018, 174, 41–54. [Google Scholar] [CrossRef]
  6. Cimon-Morin, J.; Darveau, M.; Poulin, M. Fostering synergies between ecosystem services and biodiversity in conservation planning: A review. Biol. Conserv. 2013, 166, 144–154. [Google Scholar] [CrossRef]
  7. Huang, Y.; Yin, X.; Ye, G.; Lin, J.; Huang, R.; Wang, N.; Wang, L.; Sun, Y. Spatio-temporal Variation of Landscape Heterogeneity under Influence of Human Activities in Xiamen City of China in Recent Decade. Chin. Geogra. Sci. 2013, 23, 227–236. [Google Scholar] [CrossRef]
  8. Brentrup, F.; Küsters, J.; Lammel, J.; Kuhlmann, H. Life cycle impact assessment of land use based on the hemeroby concept. Int. J. Life Cycle Assess. 2002, 7, 339–348. [Google Scholar]
  9. Fehrenbach, H.; Grahl, B.; Giegrich, J.; Busch, M. Hemeroby as an impact category indicator for the integration of land use into life cycle (impact) assessment. Int. J. Life Cycle Assess. 2015, 20, 1511–1527. [Google Scholar] [CrossRef]
  10. Cannon, S.E.; Donner, S.D.; Fenner, D.; Beger, M. The relationship between macroalgae taxa and human disturbance on central Pacific coral reefs. Mar. Pollut. Bull. 2019, 145, 161–173. [Google Scholar] [CrossRef]
  11. Johnson, C.J.; Russell, D.E. Long-term distribution response of a migratory caribou herd to human disturbance. Biol. Conserv. 2014, 177, 52–63. [Google Scholar] [CrossRef]
  12. Plante, S.; Dussault, C.; Richard, J.H.; Côté, S.D. Huma disturbance effects and cumulative habitat loss in endangered migratory caribou. Biol. Conserv. 2018, 224, 129–143. [Google Scholar] [CrossRef]
  13. Setsaas, T.; Hunninck, L.; Jackson, C.R.; May, R.; Røskaft, E. The impacts of human disturbances on the behavior and population structure of impala (Aepyceros melampus) in the Serengeti ecosystem, Tanzania. Glob. Ecol. Conserv. 2018, 16, e00467. [Google Scholar] [CrossRef]
  14. Liu, H.; Gao, C.; Wang, G. Understand the resilience and regime shift of the wetland ecosystem after human disturbances. Sci. Total. Environ. 2018, 643, 1031–1040. [Google Scholar] [CrossRef] [PubMed]
  15. Delgado- Fernandez, I.; O’Keeffe, N.; Davidson-Arnott, R.G.D. Natural and human controls on dune vegetation cover and disturbance. Sci. Total. Environ. 2019, 672, 643–656. [Google Scholar] [CrossRef]
  16. Dainese, M.; Aikio, S.; Hulme, P.E.; Bertolli, A.; Prosser, F.; Marini, L. Human disturbance and upward expansion of plants in a warming climate. Nat. Clim. Chang. 2017, 7, 577–582. [Google Scholar] [CrossRef]
  17. Rito, K.F.; Arroyo-Rodríguez, V.; Queiroz, R.; Leal, I.; Tabarelli, M. Precipitation mediates the effect of human disturbance on the Brazilian Caatinga vegetation. J. Ecol. 2017, 105, 1–11. [Google Scholar] [CrossRef] [Green Version]
  18. Chhetri, P.K.; Shrestha, K.B.; Cairns, D.M. Topography and human disturbances are major controlling factors in treeline pattern at Barun and Manang area in the Nepal Himalaya. J. Mt. Sci-Engl. 2017, 14, 119–127. [Google Scholar] [CrossRef]
  19. Vitousek, P.M.; Mooney, H.A.; Lubchenco, J.; Melillo, J.M. Human domination of earth’s ecosystems. Science 1997, 277, 494–499. [Google Scholar] [CrossRef] [Green Version]
  20. Li, H.; Man, W.; Li, X.; Ren, C.; Wang, Z.; Li, L.; Jia, M.; Mao, D. Remote sensing investigation of anthropogenic land cover expansion in the low elevation coastal zone of Liaoning Province, China. Ocean Coast. Manag. 2017, 148, 245–259. [Google Scholar] [CrossRef]
  21. Caplat, P.; Lepart, J.; Marty, P. Landscape patterns and agriculture: Modeling the long–term effects of human practices on Pinus sylvestris spatial dynamics (Causse Mejean, France). Landsc. Ecol. 2006, 21, 657–670. [Google Scholar] [CrossRef]
  22. Tasser, E.; Sternbach, E.; Taaeinei, U. Biodiversity indicators for sustainability monitoring at municipality level: An example of implementation in an alpine region. Ecol. Indic. 2008, 8, 204–223. [Google Scholar] [CrossRef]
  23. Günlü, A.; Kadioğullari, A.I.; Keleş, S.; Başkent, E.Z. Spatiotemporal changes of landscape pattern in response to deforestation in Northeastern Turkey: A case study in Rize. Environ. Monit. Assess. 2009, 148, 127–137. [Google Scholar] [CrossRef] [PubMed]
  24. Sun, Y.; Zhao, D.; Wu, T.; Wei, B.; Gao, S.; Li, Y.; Cao, F. Temporal and spatial dynamic changes and landscape pattern response of Hemeroby in Dayang estuary of Liaoning Province, China. Acta Ecol. Sin. 2012, 32, 3645–3655. [Google Scholar]
  25. Diwediga, B.; Wala, K.; Folega, F.; Dourma, M.; Woegan, Y.A.; Akpagana, K.; Le, Q.B. Biophysical and anthropogenous determinants of landscape patterns and degradation of plant communities in Mo hilly basin (Togo). Ecol. Eng. 2015, 85, 132–143. [Google Scholar] [CrossRef]
  26. Li, H.; Peng, J.; Liu, Y.; Hu, Y. Urbanization impact on landscape patterns in Beijing City, China: A spatial heterogeneity perspective. Ecol. Indic. 2017, 82, 50–60. [Google Scholar] [CrossRef]
  27. Chapin, F.S.; Zavaleta, E.S.; Eviner, V.T.; Naylor, R.L.; Vitousek, P.M.; Reynolds, H.L.; Hooper, D.U.; Lavorel, S.; Sala, O.E.; Hobbie, S.E.; et al. Consequences of changing biodiversity. Nature 2000, 405, 234–242. [Google Scholar] [CrossRef]
  28. Dias, D.M.; Massara, R.L.; Campos, C.B.; Rodrigues, F.H.G. Human activities influence the occupancy probability of mammalian carnivores in the Brazilian Caatinga. Biotropica 2019, 51, 1–13. [Google Scholar] [CrossRef]
  29. Cardelús, C.L.; Woods, C.L.; Bitew Mekonnen, A.; Dexter, S.; Scull, P.; Tsegay, B.A. Human disturbance impacts the integrity of sacred church forests, Ethiopia. PLoS ONE 2019, 14, 1–14. [Google Scholar] [CrossRef] [Green Version]
  30. Cai, Y.; Zhang, Y.; Hua, Z.; Deng, J.; Qin, B.; Yin, H.; Wang, X.; Gong, Z.; Heinoc, J. Metacommunity ecology meets bioassessment: Assessing spatio-temporal variation in multiple facets of macroinvertebrate diversity in human-influenced large lakes. Ecol. Indic. 2018, 103, 713–721. [Google Scholar] [CrossRef]
  31. Wu, J.; Liu, C.; Li, Y. Ecosystem services value Change and its response to human disturbance in the three gorges reservoir area (Chongqing section). Res. Soil Water Conserv. 2018, 25, 334–341. [Google Scholar]
  32. Xu, N.; Sun, S.; Xue, D.; Guo, L. Ecosystem service value and its spatial response to human interference on the basis of terrain gradient in Gannan region, China. Acta Ecol. Sin. 2019, 39, 97–107. [Google Scholar]
  33. Wang, Z.; Zhang, L.; Li, X.; Wang, P.; Li, Y.J.; Lv, Y.; Yan, J. The spatial-temporal pattern of hotspots and coldspots of ecosystem services at the watershed scale. Acta Ecol. Sin. 2019, 39, 823–834. [Google Scholar]
  34. Zhu, M. Industry reconstruction and coordinated development of Yangtze River Economic Zone. In Proceedings of the 2016 International Conference on Logistics, Informatics and Service Sciences, Sydney, Australia, 24–27 July 2016. [Google Scholar]
  35. Wang, Z.; Fang, C.; Cheng, S.; Wang, J. Evolution of coordination degree of eco-economic system and early-warning in the Yangtze River Delta. J. Geogr. Sci. 2013, 23, 147–162. [Google Scholar] [CrossRef]
  36. Wang, Y.; Jiang, L. The dilemma of the implementation of the Yangtze River Delta regional planning. Adv. Mater. Res. 2012, 450–451, 1086–1093. [Google Scholar] [CrossRef]
  37. Wu, Y.; Zhao, C.; Han, B. Characteristics of Land Topographic Gradient Caused by Temporal and Spatial Evolution in Mountainous Watershed. Res. Soil Water Conserv. 2017, 24, 161–167. [Google Scholar]
  38. Costanza, R.; d’Arge, R.; Groot, R.; Farber, S.; Grasso, M.; Hannon, B.; Limberg, K.; Naeem, S.; O’Neill, R.V.; Paruelo, J.; et al. The value of the world’s ecosystem services and natural capital. Nature 1997, 87, 253–260. [Google Scholar] [CrossRef]
  39. Xie, G.; Lu, C.; Leng, Y. Ecological assets valuation of the food production in China. Chin. J. Eco-Agric. 2003, 13, 10–13. [Google Scholar]
  40. Ye, Y.; Bryane, B.A.; Zhang, J.; Connorf, J.D.; Cheng, L.; Qin, Z.; He, M. Changes in land-use and ecosystem services in the Guangzhou-Foshan Metropolitan Area, China from 1990 to 2010: Implications for sustainability under rapid urbanization. Ecol. Indic. 2018, 93, 930–941. [Google Scholar] [CrossRef]
  41. Chen, A.; Zhu, B.; Chen, L.; Wu, Y.; Sun, R. Dynamic changes of landscape pattern and eco-disturbance degree in Shuangtai estuary wet land of Liaoning Province, China. J. Appl. Ecol. 2010, 21, 1120–1128. [Google Scholar]
  42. Gashaw, T.; Tulu, T.; Argaw, M.; Abeyou, W.W.; Tolessa, T.; Kindu, M. Estimating the impacts of land use/land cover changes on Ecosystem Service Values: The case of the Andassa watershed in the Upper Blue Nile basin of Ethiopia. Ecosyst. Serv. 2018, 31, 219–228. [Google Scholar] [CrossRef]
  43. Guo, X.; Diao, C.; Li, J. Discussion on the ecological compensation in the Yangtze River Economic Belt. IOP Conf. Ser. Earth. Environ. Sci. 2019, 223, 012058. [Google Scholar]
Figure 1. The topographic gradients and sampling grids of western Hunan.
Sustainability 12 00465 g001
Figure 2. Proportion of land-use area at topographic gradients.
Sustainability 12 00465 g002
Figure 3. Spatial distribution of human disturbance in western Hunan.
Sustainability 12 00465 g003
Figure 4. Global Moran’s I index between ecosystem service value (ESV) and hemeroby index (HI) in western Hunan.
Sustainability 12 00465 g004
Figure 5. The local indicators of spatial association (LISA) cluster maps between ecosystem service value (ESV) and HI in western Hunan.
Sustainability 12 00465 g005
Table 1. The change of the ecosystem service value at topographic gradient (yuan/hm2).
Gradient199019952000200520102015Change
Gradient 194,488.794,687.094,698.588,591.894,890.794,458.4−30.3
Gradient 2105,075.0105,275.0105,369.097,727.1105,512.0105,384.0309.0
Gradient 3111,180.0111,282.0111,424.0103,729.0111,556.0111,440.0260.0
Gradient 4113,383.0113,411.0113,604.0106,800.0113,773.0113,650.0267.0
Gradient 5116,178.0116,165.0116,425.0111,888.0116,585.0116,401.0223.0
Table 2. Moran’s I index and the significance of spatial correlation.
Index199019952000200520102015
I value−0.2897−0.2884−0.2894−0.2850−0.2915−0.2917
p value0.00100.00100.00100.00100.00100.0010
Z value−72.6391−72.1620−72.0876−71.7869−73.4907−73.4970

