Letter

Exploring the Spatio-Temporal Dynamics of Winter Rape on the Middle Reaches of Yangtze River Valley Using Time-Series MODIS Data

1
Key Laboratory for Geographical Process Analysis & Simulation of Hubei province, School of Urban and Environmental Sciences, Central China Normal University, Wuhan 430079, China
2
Key Laboratory of Agricultural Remote Sensing, Institute of Agricultural Resources and Regional Planning, Ministry of Agriculture, Chinese Academy of Agricultural Sciences, Beijing 100081, China
3
State Key Laboratory of Information Engineering in Surveying, Mapping and Remote Sensing, Wuhan University, Wuhan 430070, China
*
Author to whom correspondence should be addressed.
Sustainability 2020, 12(2), 466; https://doi.org/10.3390/su12020466
Submission received: 10 November 2019 / Revised: 31 December 2019 / Accepted: 1 January 2020 / Published: 8 January 2020
(This article belongs to the Section Sustainable Agriculture)

Abstract

:
Rapeseed is an important oil product in China. China’s current soybean trade issues with major soybean producing countries have caused a large decline in soybean import since 2017. This may bring the increasing needs of rapeseed import, which would have an impact on domestic production. However, our knowledge on the effects of international rapeseed trade on domestic production remains unknown. It is thus important to understand the pattern of rapeseed in China under this scenario, as it may provide necessary information for all relevant stakeholders. With this goal, this study aims to investigate the spatial and temporal patterns of winter rape in China’s major winter rape production region, the Middle Reaches of the Yangtze River Valley (MYR), during 2003–2015 using time-series Moderate Resolution Imaging Spectroradiometer (MODIS) data. A decision tree according to the difference in enhanced vegetation index (EVI) profiles of land-cover types was built to extract winter rape. The results show that there is an essential decrease in both the number and density of winter rape patches under the opening global rapeseed market. There are significant hotspots of winter rape gain and loss, within which the loss dominated the trend. The significant cost advantage of rapeseed in the international market may largely reduce the domestic cultivation in China through telecoupling effects. Understanding the spatio-temporal dynamics of winter rape on the MYR has significant economic and policy implications and can provide great supports for the agricultural production, policy-making, and oil products trade in the international market.

1. Introduction

Rapeseed is a major source of vegetable oil all over the world [1], as well as an important oil crop in China. Winter rape is mainly concentrated in the Yangtze River Valley [2], taking up over 90% of the rapeseed share in China. Rapeseed and soybean are substitutes for each other when being used as vegetable oil. Rapeseed oil used to rank first in China’s cooking oil market, however, it has been replaced by soybean oil since 2003 [2]. After joining the World Trade Organization (WTO), China’s soybean market has been deeply integrated into the global market. Soybean import has a serious impact on domestic soybean production in China owing to low tariffs on import and decreasing comparative benefit of soybean planting [3,4,5]. China’s soybean imports accounted for 41% of the world total in 2005 and topped the world in 2017 [6,7]. Currently, over 80% of China’s soybean consumption is imported [8,9]. This large import of soybean from the international market has put great pressure on China’s domestic soybean cultivation, resulting in a substantial shrinkage in soybean planting areas [10,11].
Similarly, the latest statistics show that rapeseed imports have also largely increased and replaced most of the market share in China owing to its advantages of low price and high oil output. Chinese rapeseed imports approached 428 k tons in 2007 and have soared since then. The imports reached 1.56 million tons in 2013 and then dropped in 2014, but still ran high at about 800 k tons until 2017 (Figure 1). The exports, however, are far less than the imports during the observed years, except in 2006. As a member of the World Trade Organization, international trade has impacts on domestic prices in agricultural sector. When increased imports affect China’s domestic price, producers will feel the price shifts and adjust the cropping pattern [12].
These statistics raise an important question: whether the story of soybean happens to winter rape? Does the free international rapeseed trade stress China’s domestic rapeseed production? Where winter rape is still grown, increasing or decreasing? Agricultural production is dependent on economic drivers together with the challenges of urbanization and climate change, which is increasing the need for timely agricultural monitoring. Timely and accurate monitoring of the spatial and temporal dynamics of winter rape is of great importance not only for the rapeseed sector and national food security, but also for all other relevant stakeholders [13].
Remote sensing has been proven to be a valuable technique to provide large-scale multi-temporal data, and has been widely used to map individual crops or cropping structure owing to its low cost and high efficiency. Remote sensing can also significantly contribute to agricultural systems monitoring such as anomaly hot spots of agricultural production over large areas [14]. The literature shows that there are many studies to map grain crops in China such as rice, wheat, and soybean [15,16,17,18,19]. Yet, these studies are mainly conducted in Northeast or North China, and fewer in Central and South China. Moreover, there have been fewer mapping activities on winter rape using remote sensing data. The existing winter rape mapping literatures are limited in local regions, which makes it difficult to understand the dynamic changes in winter rape cultivation [20,21]. It is necessary to develop a method for large-scale winter rape mapping, so as to understand its spatio-temporal changes over time and space.
The objective of this study is thus to investigate and understand the spatial and temporal dynamics of winter rape in China in the context of international rapeseed trade. To be specific, time-series Moderate Resolution Imaging Spectroradiometer (MODIS) data were used to explore the spatial and temporal patterns of winter rape production in China’s major winter rape production region, the Middle Reaches of the Yangtze River Valley (MYR). A decision tree was built to extract winter rape from time-series MODIS data. Two MODIS products, Terra and Aqua, were combined to minimize the impact of the cloud interference. We further extracted the hot spots of winter rape gain and loss, and measured the changes of spatial fragmentation using some landscape indices. Information on the spatial and temporal patterns of winter rape can help estimate total winter rape production on the MYR and predict the rapeseed demand from oil-exporting countries.

2. Materials and Methods

2.1. Study Area

The study area is in the Middle Reaches of the Yangtze River Valley, including Hubei Province, parts of Henan province, Hunan Province, Anhui Province, and Jiangxi Province (Figure 2). It contains several plains and the croplands account for 43.15% of the total. Only parts of those provinces (except Hubei Province) were included because winter rape is concentrated on these areas within MYR. With the rise of Central China and the promotion of national strategies such as the Yangtze River Economic Belt, the MYR has become an important economic growth pole of China. As the largest and most concentrated winter-rape-growing region, the MYR takes the lion’s share. Approximately 55% of the total annual winter rape production in the Yangtze River Valley was sourced from the MYR over the past decade [2]. The MYR has also been one of the major areas with a rapid decrease of croplands in the last 20 years [22].

2.2. Data

The MODIS MOD13Q1 and MYD13Q1 v006 data were used in this study, which were recorded by the EOS (Earth Observing System) /Terra and EOS/Aqua Satellite, respectively. We selected 2003 and 2015 as observation years, because we can get high-quality sampling data in these years, and they span more than one decade so as to observe the trend of winter rape distribution. The MOD13Q1 and MYD13Q1 products include 250 m resolution normalized difference vegetation index (NDVI) and enhanced vegetation index (EVI) data. Vegetation index measures the density of live green vegetations, and time-series vegetation index captures the phenological differences of varied land-cover types. The MODIS image sequence numbers of the tile covering the research area are h27v05, h27v06, h28v05, and h28v06 (h: horizontal, v: vertical). EVI layer was used in our study because it handles the saturation problems better compared with NDVI [23]. Landsat 8 OLI (Operational Land Imager) and GF-1 (GaoFen-1) remote sensing images were analyzed together to prepare winter rape samples.
All the data preprocessing (including geographical geometric correction, re-sampling, and filtering) was the same as in the work of [24]. TimeSat software was used to resconstruct the MODIS time-series [25]. The Savitzky–Golay (S–G) algorithm was used to smooth the time-series EVI to derive optimized time-series datasets.

2.3. Extraction of Rapeseed Distribution

The appropriate period to extract winter wheat areas using satellite images is the date between middle March and early April. However, this period is so short that it may be inundated by the low time resolution of the 16-day composites. Another problem is the EVI disorder caused by time disorder if MOD13Q1-EVI and MYD13Q1-EVI were simply merged [26]. Following the method of [26], we developed an eight-day time-series EVI data by merging the 16-day Terra and Aqua MODIS EVI time-series. Firstly, a threshold (blue band reflectivity ≥ 0.21) was set to eliminate the pixels with heavy clouds. Then, an EVI time-series with less cloud interference and time disorder was obtained by combining the composite day of year and pixel reliability data.
Our previous research revealed that winter crops have unique phenological characteristics differing from the background [27]. Therefore, principle components analysis (PCA) was performed on the EVI profile, covering the winter crops’ growing season. the Iterative Self-Organizing Data Analysis Techniques Algorithm was conducted to identify winter crops planting areas using the first three PCA components.
Winter rape and winter wheat are two major winter crops on the MYR and they have similar phenophases; the key issue of extracting winter rape is thus how to distinguish winter rape from winter wheat. In the window period from middle March to early April, winter rape and winter wheat are in different stages and show different colors on true-color satellite images [27]. By observing this difference in GF-1 images, we can collect winter rape samples on MODIS data. The EVI curves of these two winter crops have an opposite change trend after DOY (day of a year; day indicates Julian day, the number of days since the beginning of the year) 065 (Figure 3), which clearly shows the ability of EVI profiles in discriminating the winter crops. Finally, a decision tree rule (EVI DOY 065 + EVI DOY 089) > (EVI DOY 073 + EVI DOY 081) was established to extract winter rape from winter crops. If the rule is satisfied, the pixel is considered as winter rape. The main steps of extracting winter rape are summarized in Figure 4.
In this way, phenological information contained in time-series remote sensing data was fully utilized to accurately map winter rape at a large-scale.

2.4. Spatio-Temporal Patterns of Winter Rape Cultivation

The spatial and temporal patterns of winter rape were investigated in terms of changes in planting area and spatial aggregation. To map the changes in winter rape planting area on the MYR, firstly, a change detection was used to map the hotspots of the changes at pixel level between 2003 and 2015. Then, the winter rape area in 2003 versus the winter rape area in 2015, as well as winter rape gain and loss, were analyzed by plotting their accumulated pixels versus abundance level using a frequency histogram. The abundance here is a normalized metric of pattern measurement, which can be used to assess the trend of winter rape planting area. The original 250 m winter rape maps were aggregated to 2000 m image blocks to get a fractional map.
Spatial aggregation measures if the spatial pattern of winter rape is more dispersed or clustered. Global spatial autocorrelation was used to explore the spatial pattern of winter rape distribution. Moran’s Index indicates the spatial pattern of the data (clustering or dispersing) and the Z score and p-value can evaluate the significance of Moran’s index. We also measured the landscape pattern using landscape indicator. Several widely used indicators, NP (number of patches), PD (patch density), MPA (mean patch area), LPI (largest patch index), SI (splitting index), and AI (aggregation index) were selected as the indicators for reflecting landscape fragmentation. The calculations of these indicators are based on FRAGSTATS [28].

3. Results and Analysis

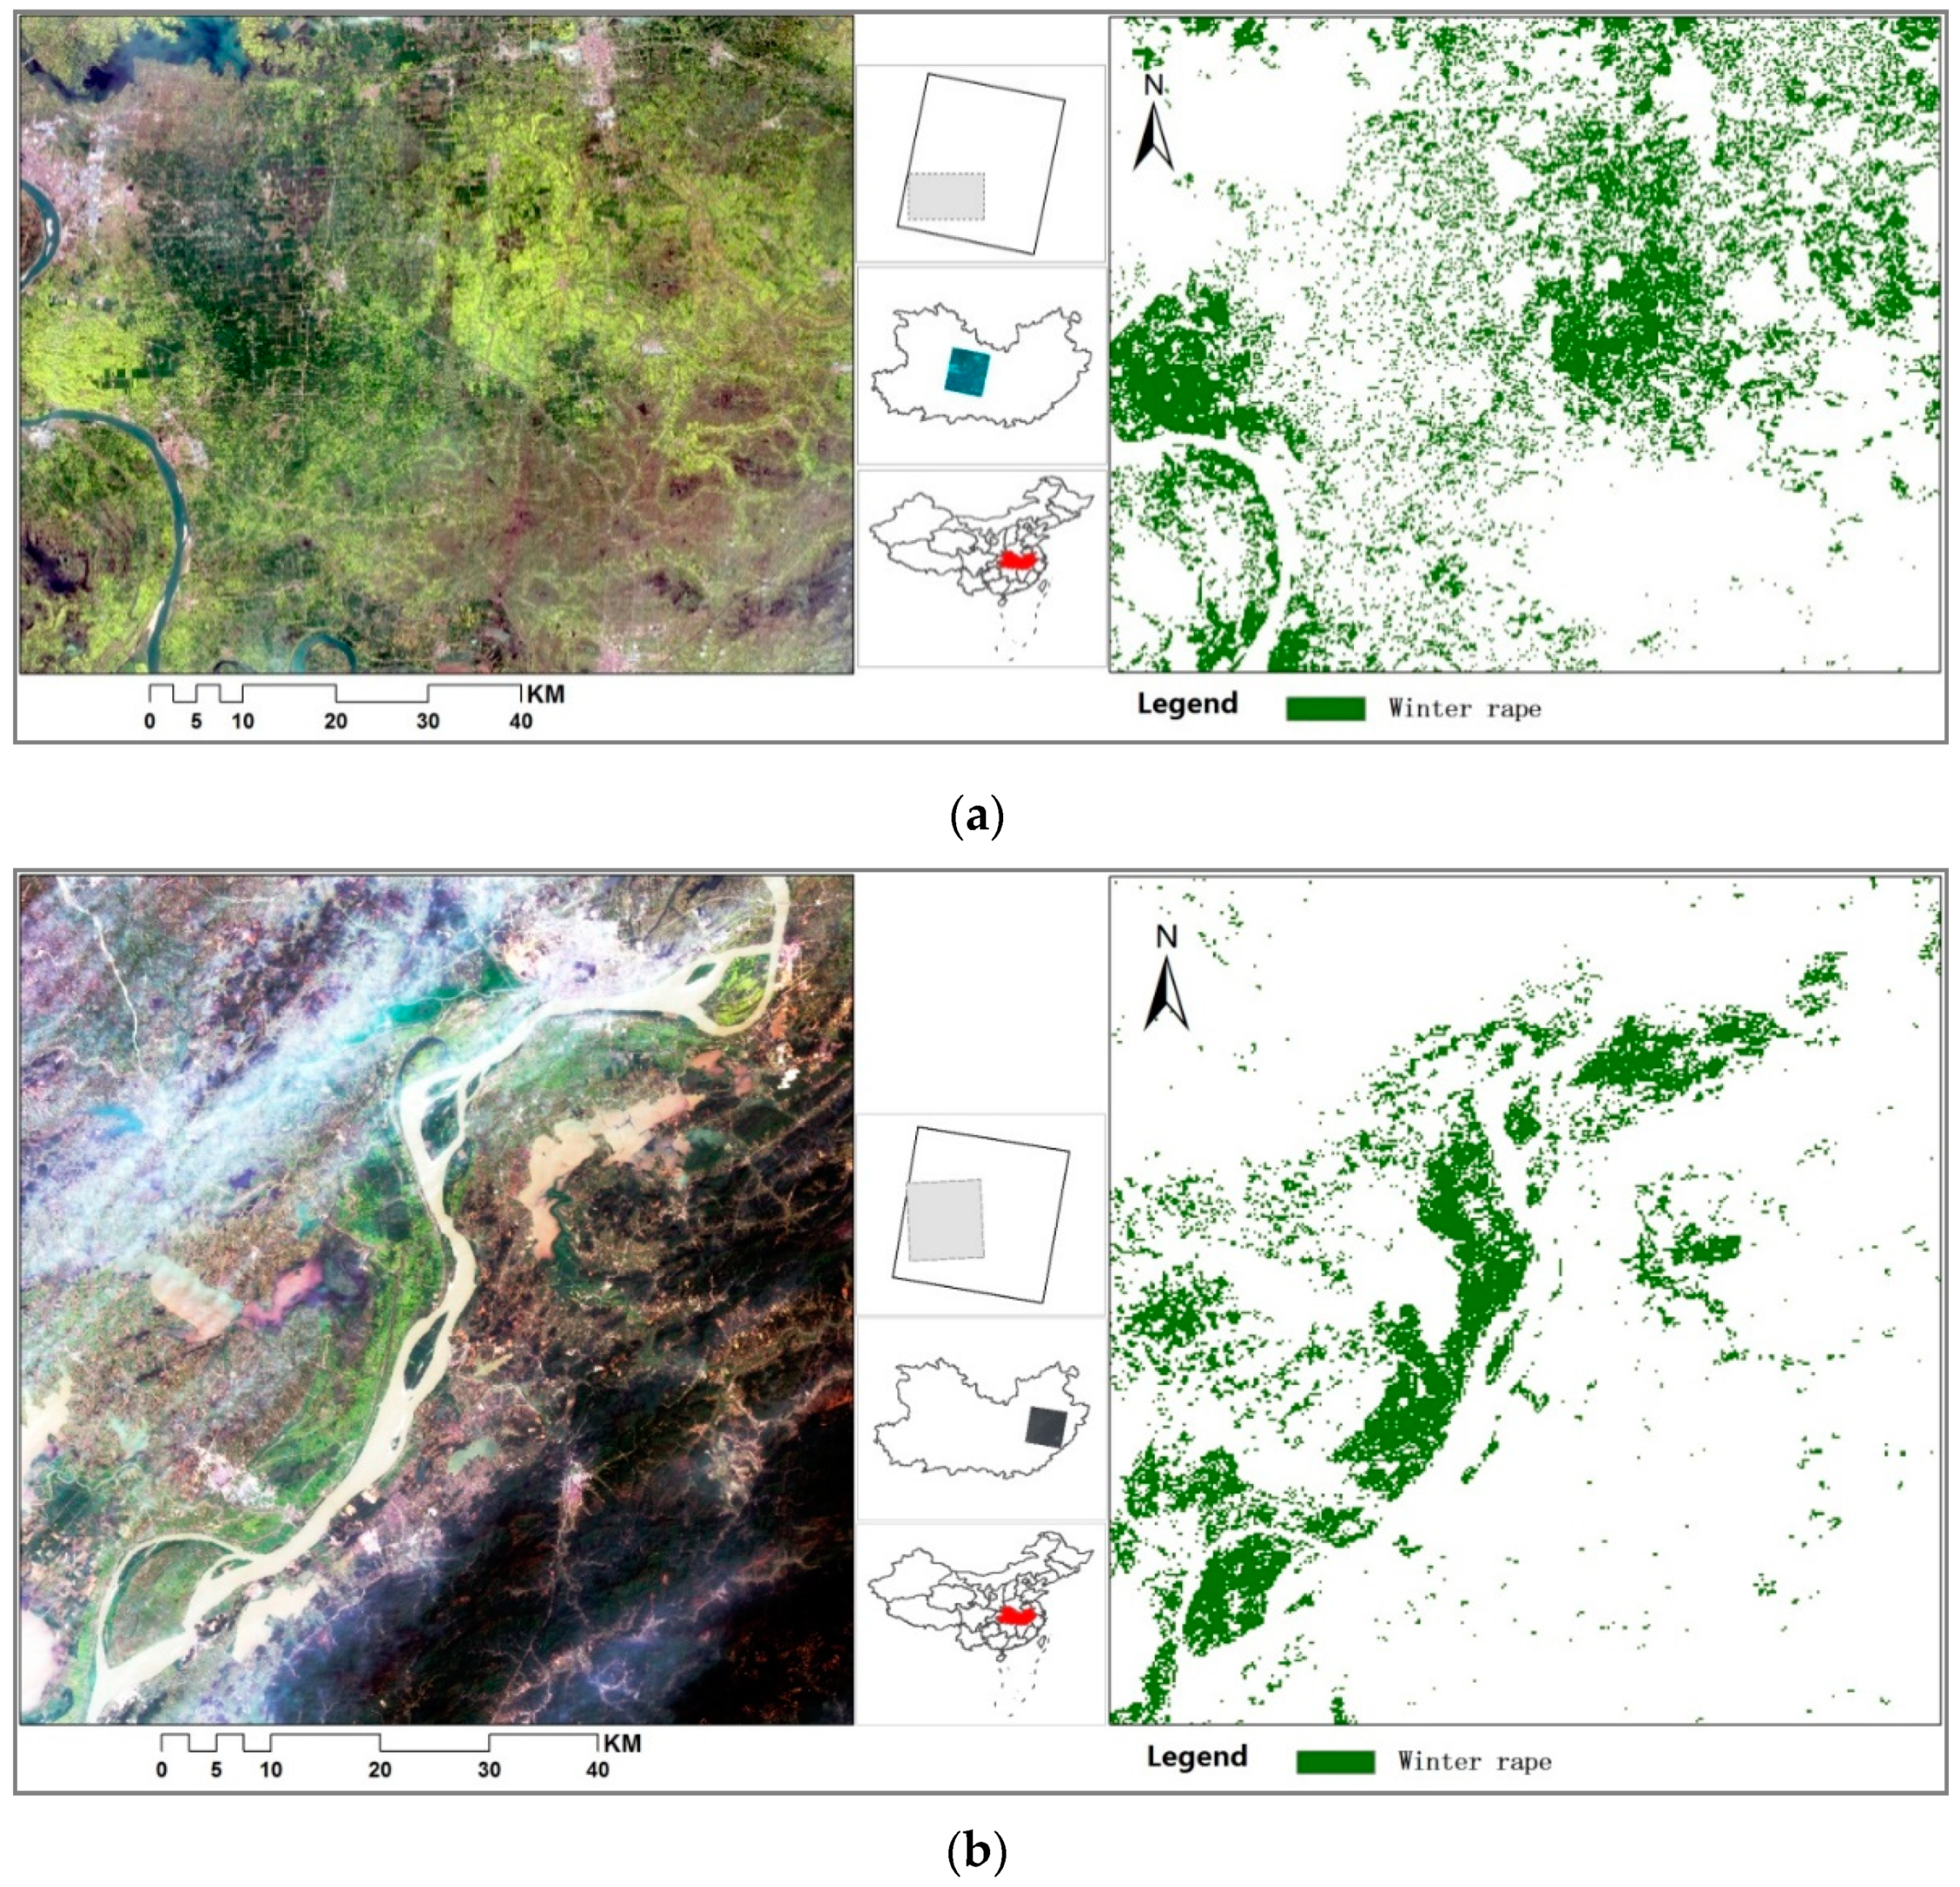
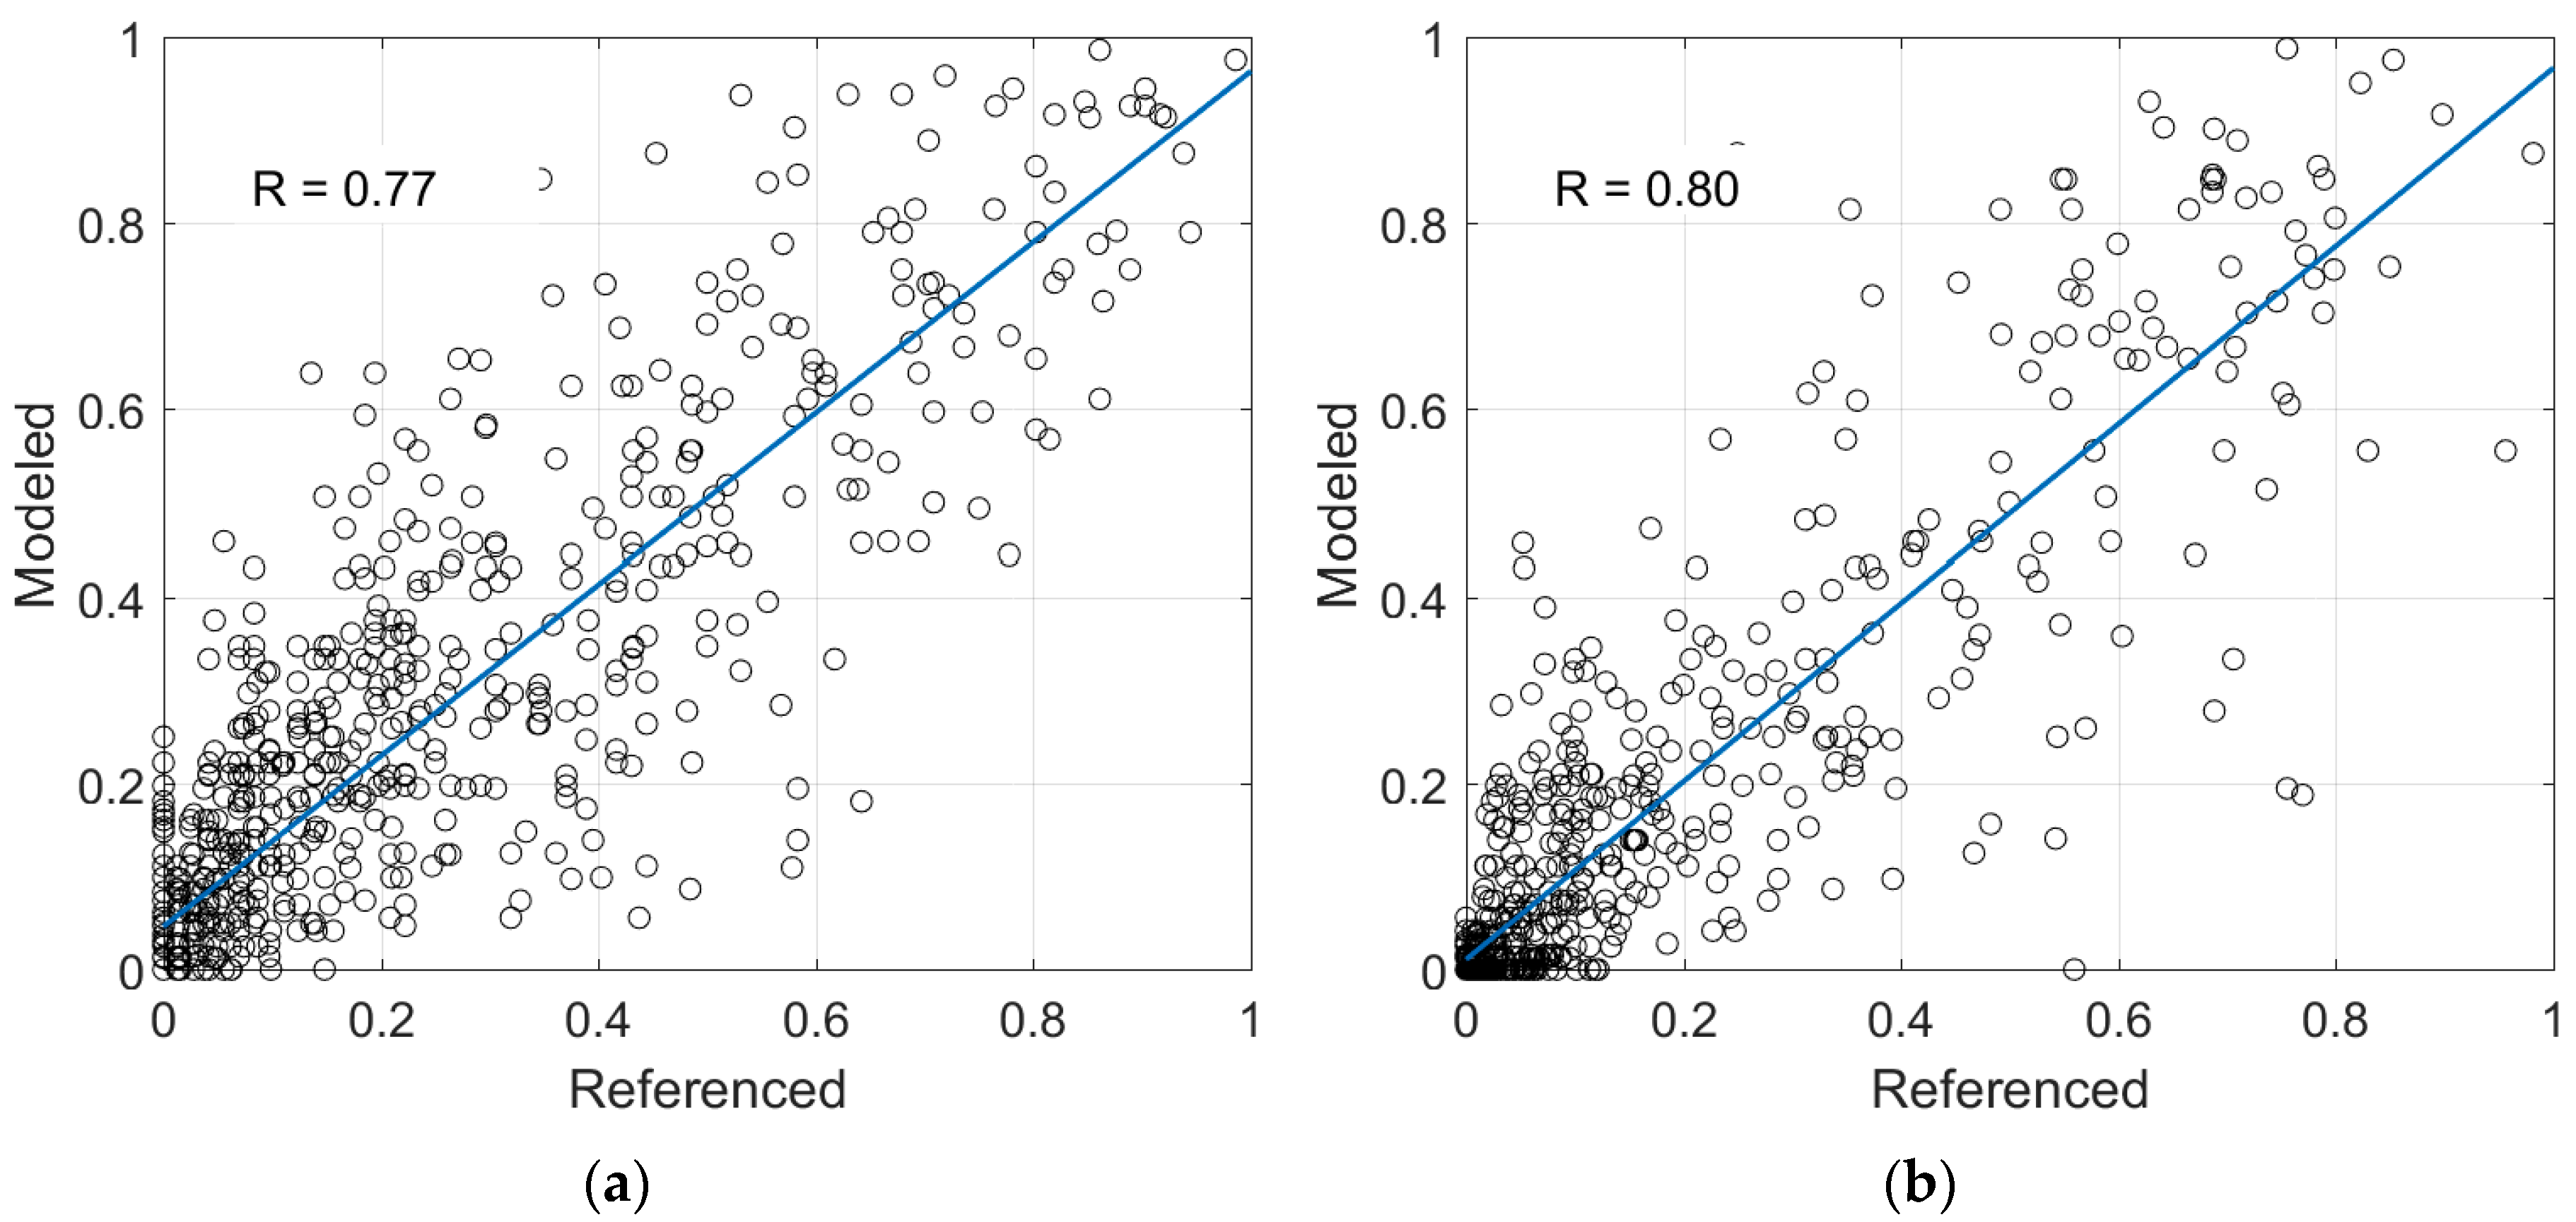
3.1. Validation of Classification Accuracy

The true color composites from GF-1/Landsat 8 images and the modeled results are shown in Figure 5 (two sample areas in Hubei Province and Anhui Province were selected, respectively, taking the year 2015 as an example). From a visual interpretation, the winter rape pixels in these two sources have good spatial agreement.
The modeled results were validated by referencing the samples from high resolution images for the year 2015 using correlation analysis. Both the modeled result and the sample data from GF-1/Landsat 8 images were aggregated to 2000 m fractural images by averaging the binary values within each block to facilitate analysis. The validation demonstrated that there is strong correlation, with correlation coefficients of 0.77 and 0.80, respectively (Figure 6). The deviation was acceptable, evidencing the feasibility of the model in winter rape mapping.
Fragmented fields in the study area that are typically smaller than the size of one MODIS pixel and highly heterogeneous cropping practices may result in sub-pixel heterogeneity and uncertainty of the winter rape maps. The cloud cover, noises, and biases in MODIS time-series and the quality of winter rape samples may also result in uncertainty of the result. However, the accuracy is sufficient when it is used to observe the overall trend at regional scale.

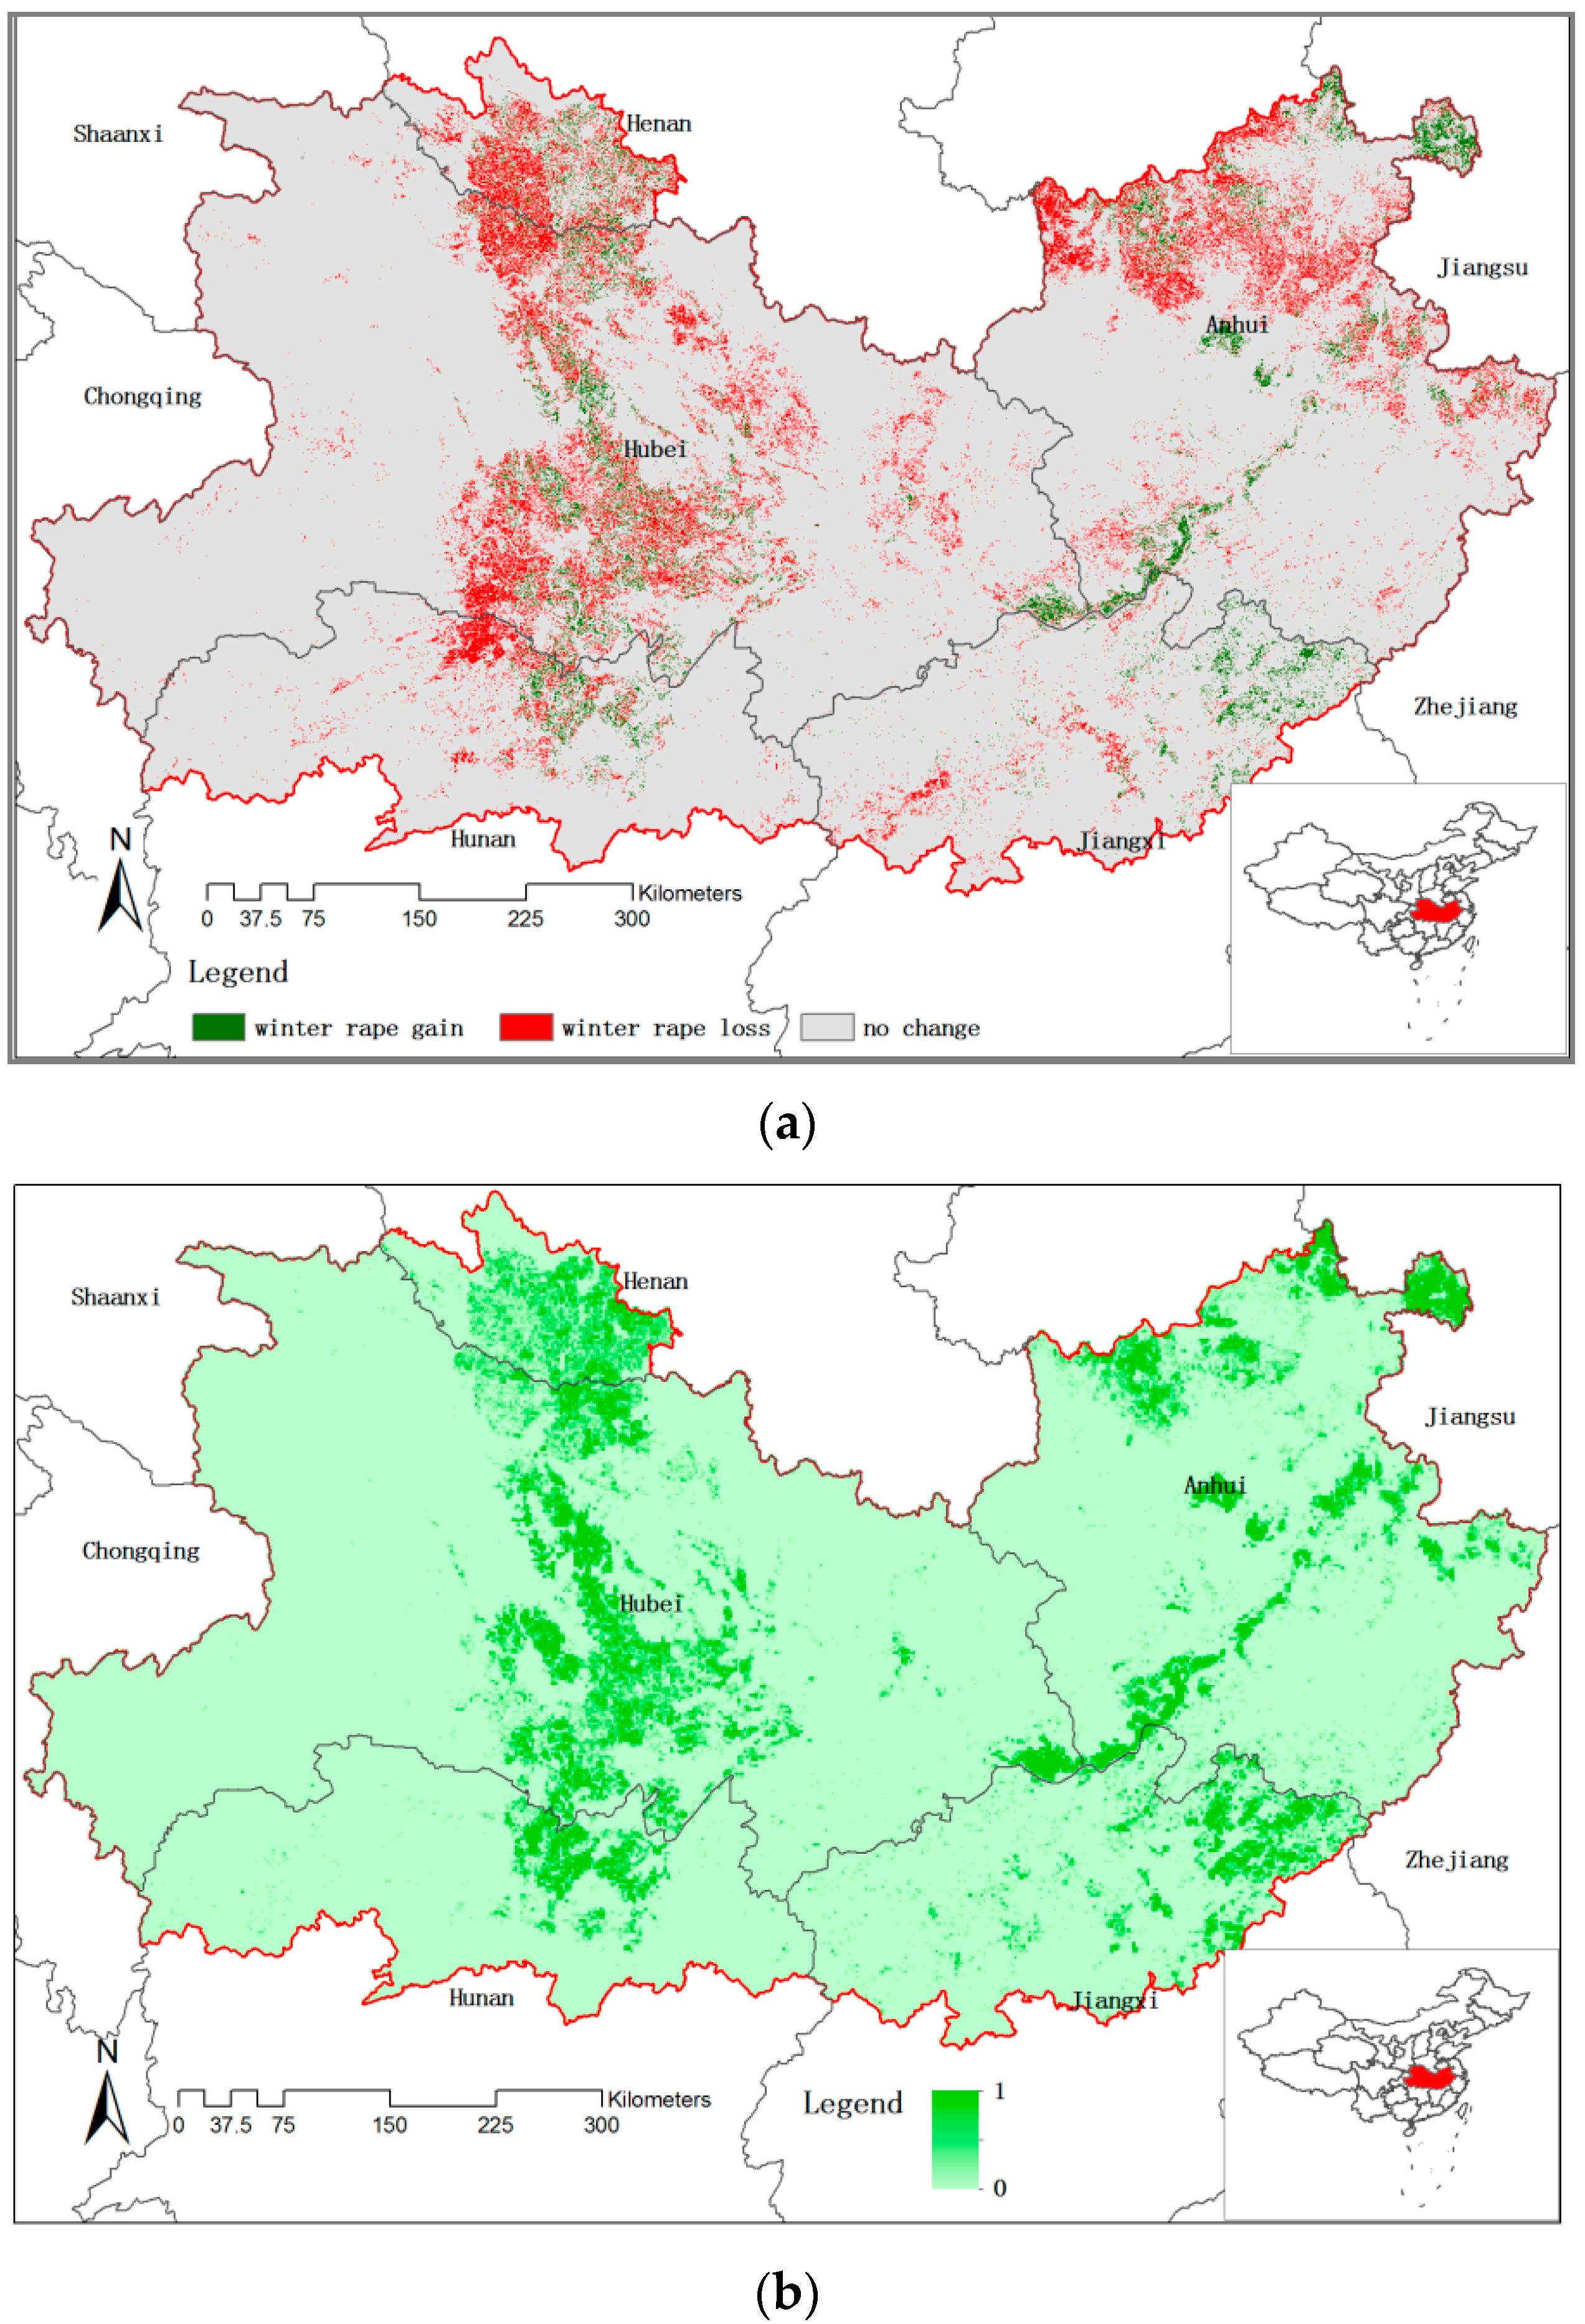
3.2. Temporal Changes in Rapeseed Cultivation

The total plating area on the MYR dropped significantly, from 3,486,405 k ha in 2003 to 1,862,287 k ha in 2015, at a rate of −46.6% (Table 1). Except for a slight increase in Jiangxi Province, there are drastic declines (about −50%) in all the provinces. This slight increase in Jiangxi Province can be partly explained as the boom of rapeseed-flower-tourism in recent years.
The changes of winter rape cultivation are intensive (Figure 7a). Although the total area has decreased (Table 1), there was also significant winter rape gain, which mainly located in the areas along the Yangtze River in Anhui Province (Figure 7b). Winter rape loss was more widely distributed, and there were widespread hotspots of winter rape loss in the research area (Figure 7c).
The profiles in Figure 8 showed the number of winter rape pixels in 2003 versus winter rape pixels in 2015, and winter rape gain versus winter rape loss in relation to their abundance. The abundance is the percentage of winter rape areas in a given grid (2 km), and the pixel number is the sum of winter rape pixels at the same abundance level.
The profiles for winter rape area in 2003 and 2015 were skewed to the left, which indicated the fragmented winter rape patches on the MYR. The bars in 2003 were higher than those of 2015 (Figure 8a), which indicated a net loss of winter rape planting area at all abundance levels. In Figure 8b, the bars for winter gain and loss have a similar pattern to those in Figure 8a. The profile of winter rape loss was higher than that of winter rape gain, which also indicated a net loss of winter rape.

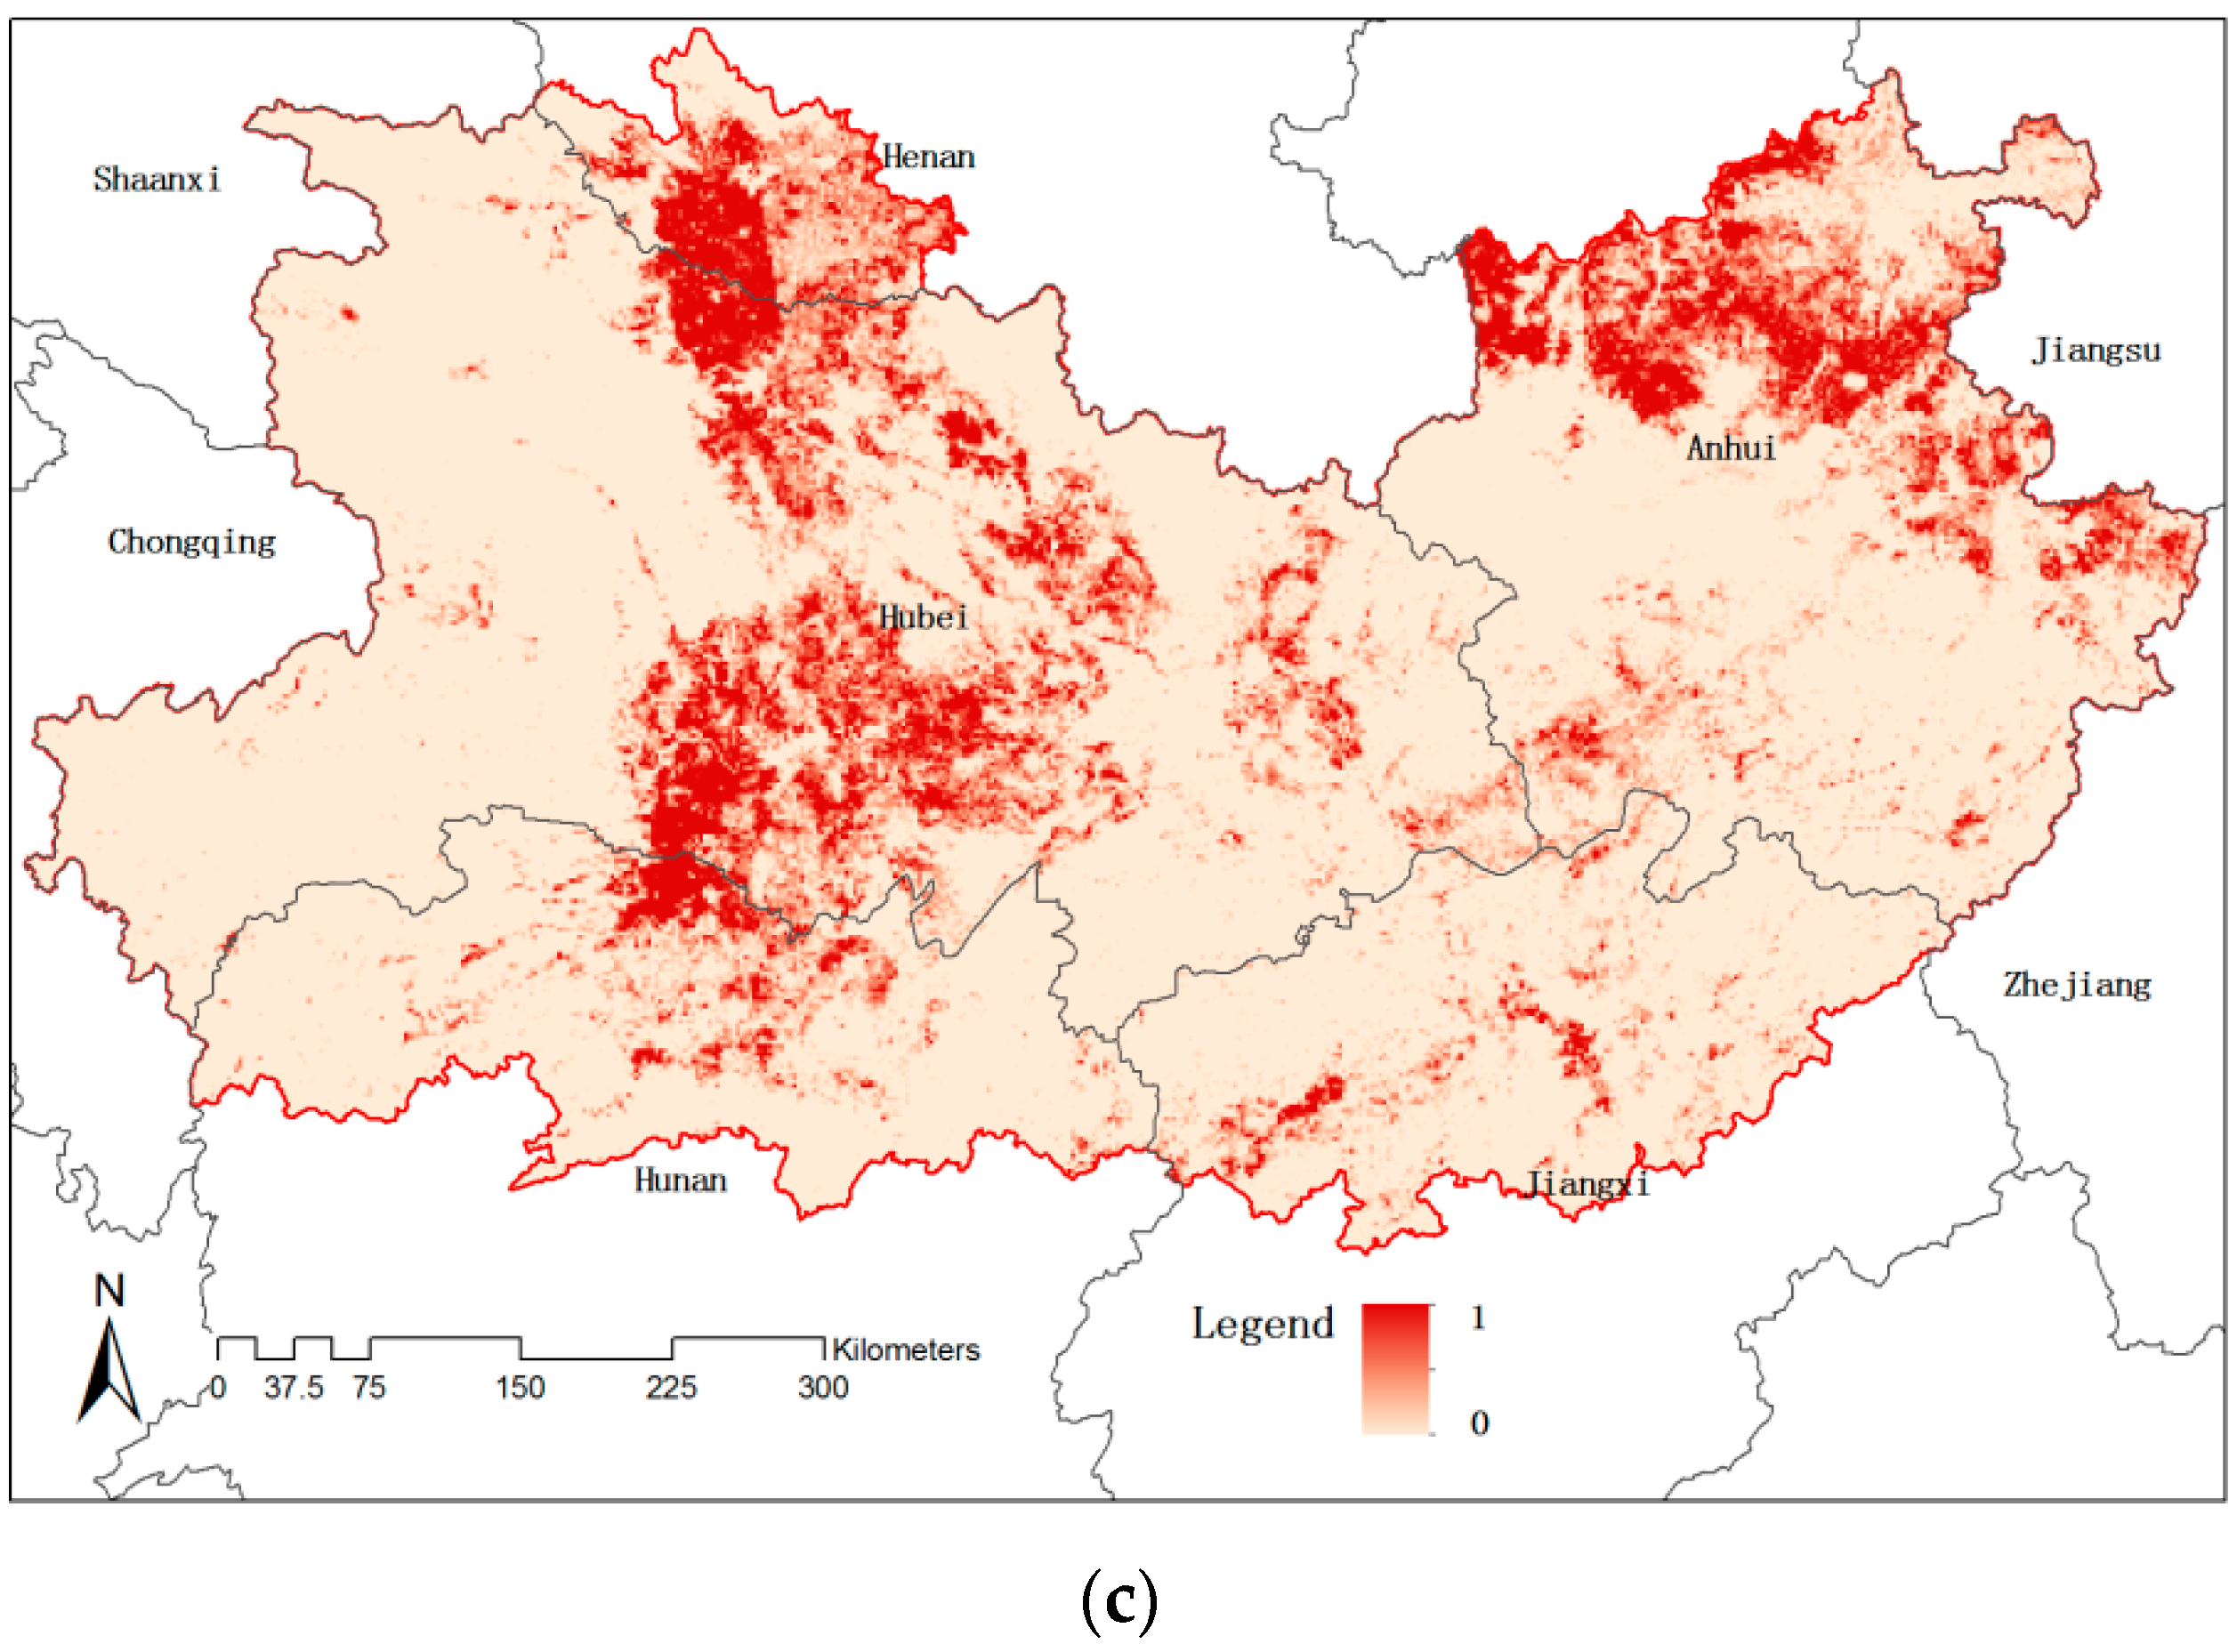
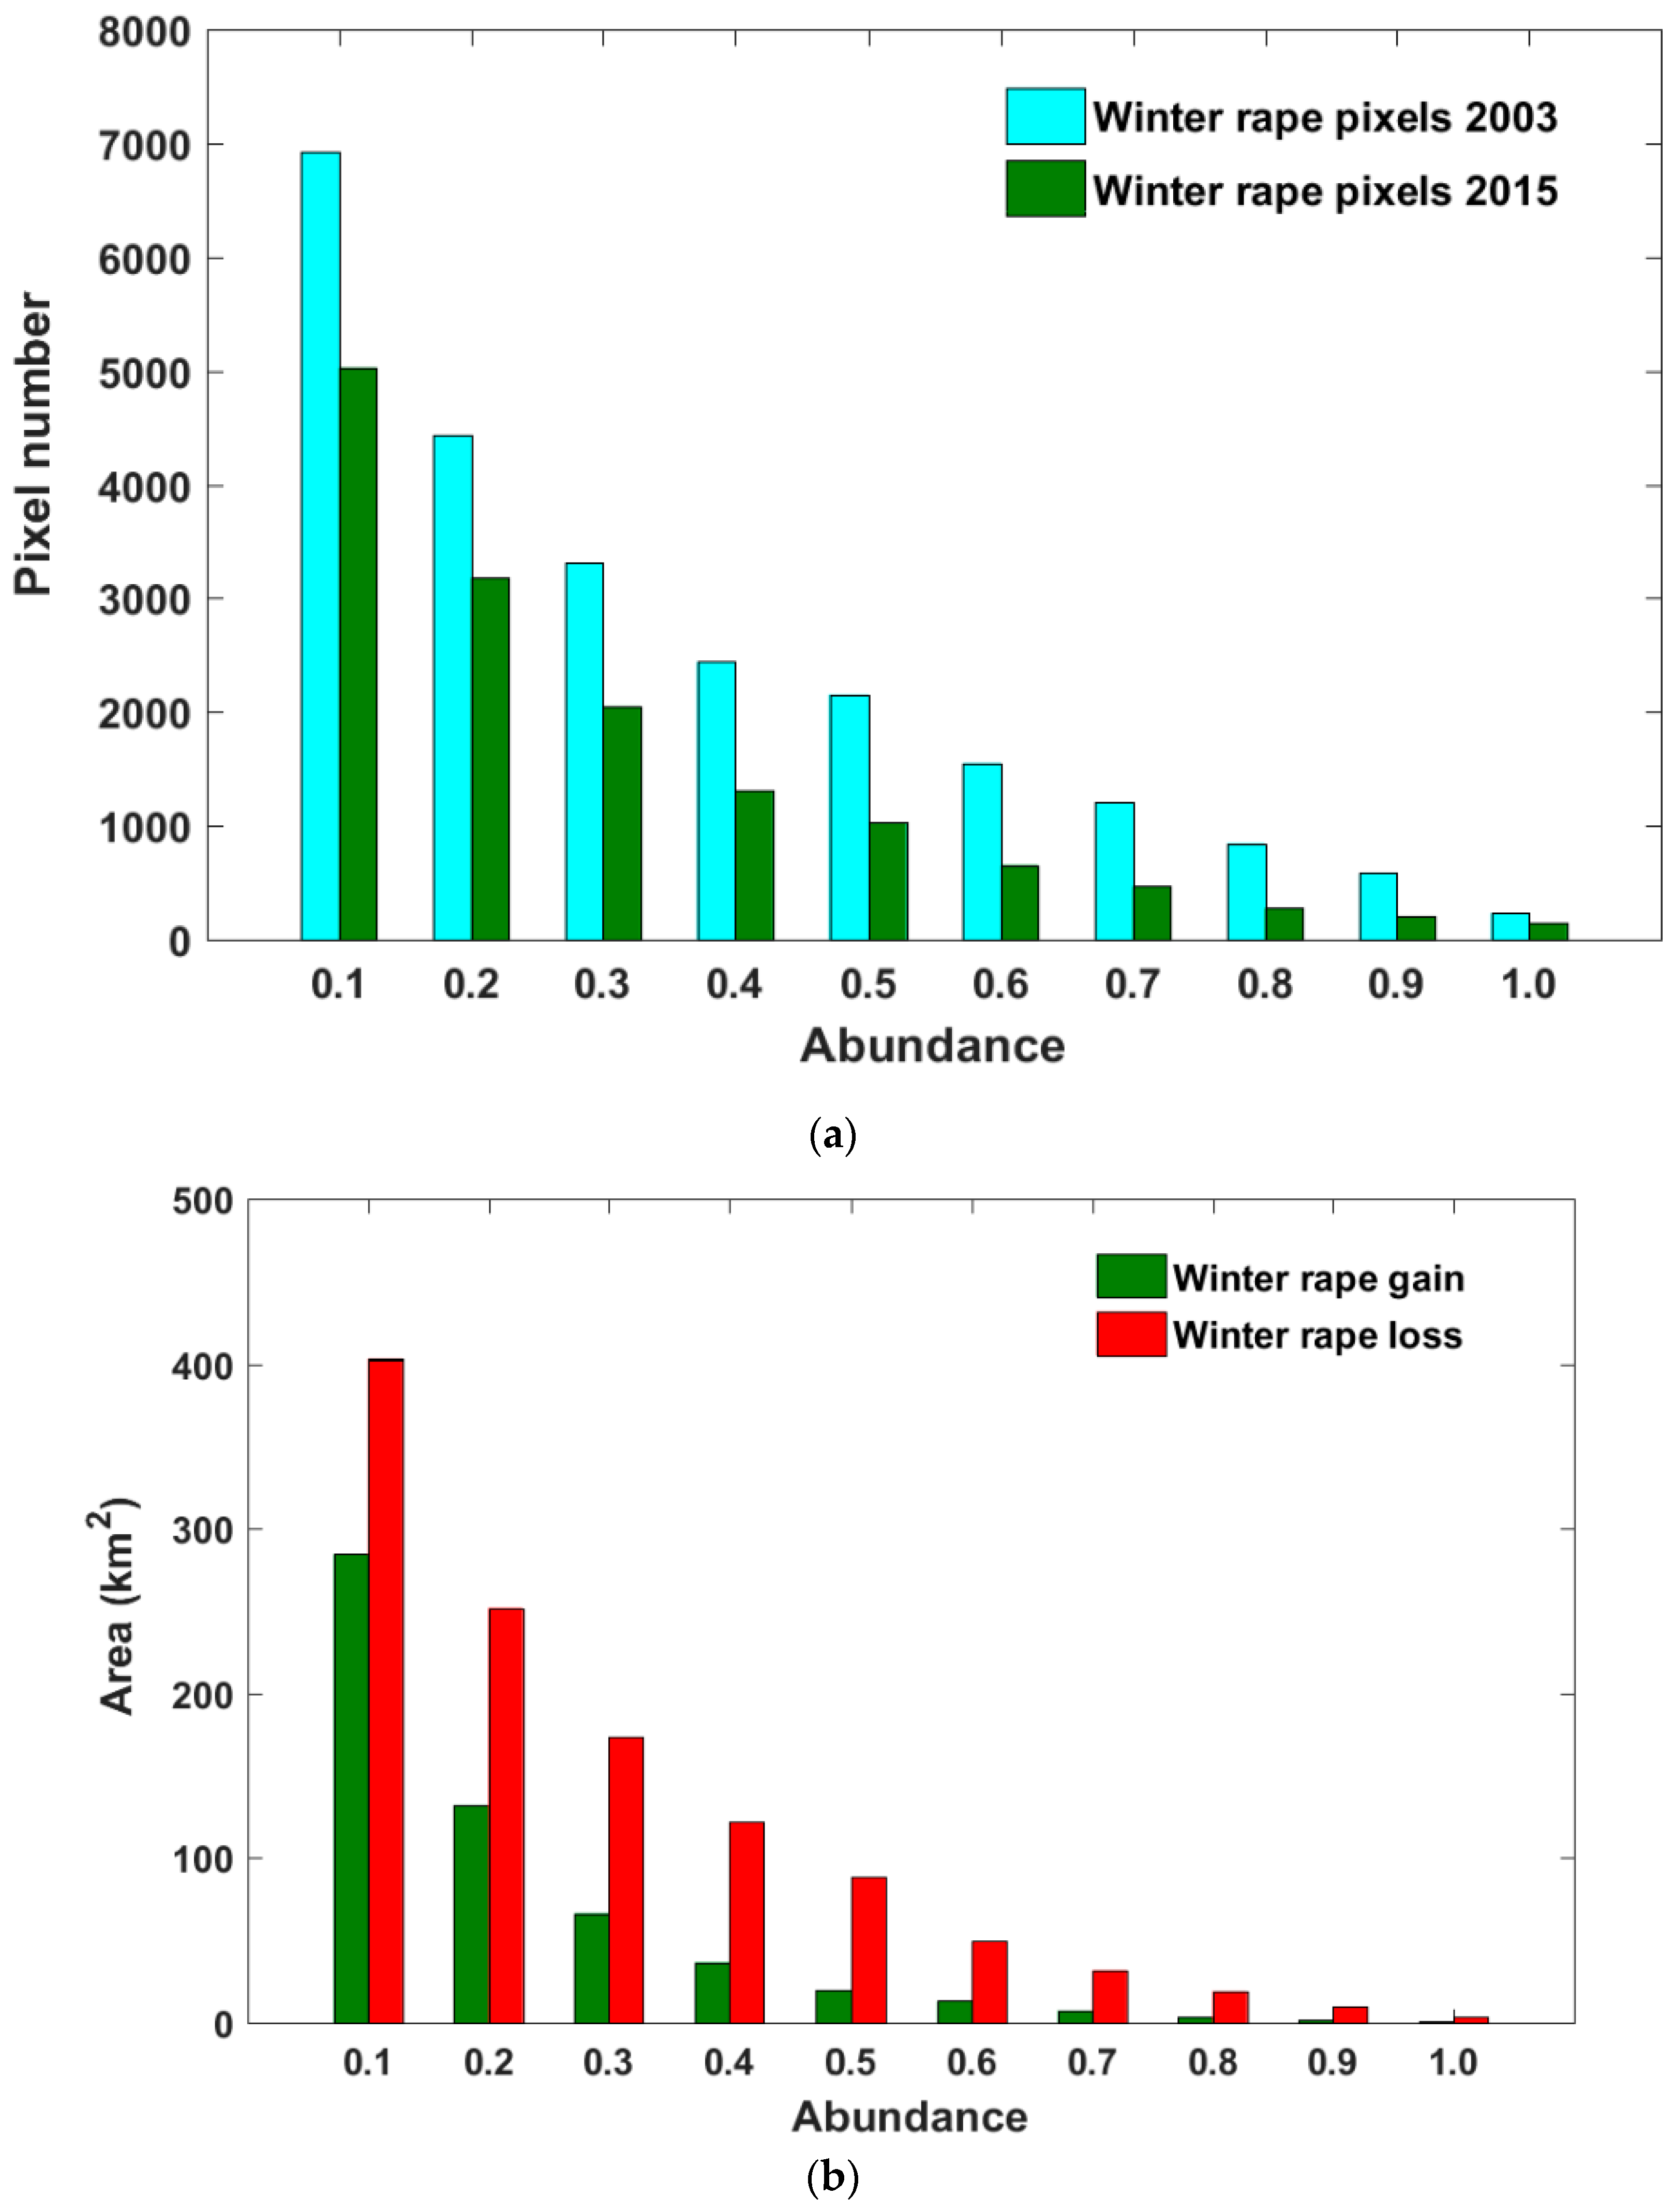
3.3. Spatial Fragmentation of Rapeseed Cultivation

Global autocorrelation analysis indicated that the winter rape distribution exhibits a clustered pattern at a 0.01 significance level. Moran’s I indicated (Table 2) that winter rape in 2015 had a little bit more dispersed pattern than that of 2003.
All the selected landscape indicators showed a clear trend that the winter rape landscape of 2015 was more fragmented than that of 2003. To be specific, the PD, MPA, SI, and AI changed significantly, and LPI had a dramatic decrease from 0.80 to 0.15 (Table 3).
Overall, the spatial aggregation of winter rape decreased, but the pattern of concentration in the main producing areas did not change greatly.

4. Discussion

This study showed that there was an obvious shrinkage of winter rape planting areas on the MYR, although some regions also gained area. There are many reasons that may drive these changes. Firstly, the rapeseed industry may suffer from international rapeseed trade. As shown in Figure 1, China is now the largest rapeseed importer in the world and there is a large increase in rapeseed import in recent years. A total of 95% of the imported rapeseeds were from Canada. It can be seen from Table 4 that the labor cost of winter rape is about 560 CNY/Mu and accounts for 62% of the total input and is the largest input in China [29]. However, materials input is the largest input for Canada’s rapeseed production and the labor cost is only about 33 CNY/Mu and account for 8% of the total input. The trade competitiveness (TC) index was used to evaluate the competitiveness of China’s rapeseed in the international market [3] by selecting five top rapeseed producing countries (Canada, China, India, France, and Australia) in the world for comparison. The TC index has a data range of 0~1. China’s TC index is close to −1, indicating a very uncompetitive level in the international rapeseed market (Figure 9). The imported rapeseed with a lower cost and higher oil output could bring great pressure on China domestic rapeseed production. The historical story of soybean in China happened to some extent to the rapeseed sector, too. Secondly, domestically, labor force shortage has pushed up agricultural labor input. The rapid urbanization and fast development of the market economy have caused intensive migration of laborers from rural areas to urban areas, which has resulted in serious shortages in the agricultural labor force. It is very common for farmers to enter cities and find new work to obtain a higher income. With the shortage of the labor force, labor cost is increasing and the comparative benefit of winter rape planting is low or even loses money [30]. Therefore, a large amount of croplands remained fallow during the first growing season, leading to a significant decline in winter rape cultivation.
The MYR has great potential for winter rape producing as the natural environment in this area is more suitable for winter rape. However, the external and internal factors have recently driven the decline in winter rape cultivation. The depression of rapeseed production in China creates a striking contrast with the thriving of rapeseed production in the world [30]. This has raised worries about the potential collapse of this cropping system and the concerns on how to maintain the advantages of this area for winter rape production in China. To ensure oil production, the government may need to encourage farmers’ willingness to plant winter rape by increasing their income. Some policies need to be enacted to promote scale management of agriculture, raise the level of mechanization, and reduce labor cost. Only by doing so, can the competitiveness of domestic rapeseed be improved, and the farmers are willing to maximize the potential of winter rape production.

5. Conclusions

The spatial and temporal patterns of winter rape on the MYR can provide valuable information for rapeseed production and sustainable development of the oil market. This study explored the spatial and temporal patterns of winter rape on the MYR of mainland China. It is found that there is a substantial shrinkage and a net loss of winter rape planting. The results also show decreased spatial aggregation of winter rape extent. The international rapeseed trade and domestic labor cost have pressed rapeseed cultivation in China.
As China’s demand for cooking oil will continue to rise, self-sufficiency in oil product and a steady supply of rapeseed oil is strongly needed. Without effective intervention, the winter rape production on the MYR may continue to decline. Because the Yangtze River Valley is the largest rapeseed production belt in the world, among which the MYR is the largest producer in China [31], this decline may serve as a caution to the Chinese rapeseed industry. Promoting growth in the planting area and the yield of winter rape in this region is an important way of ensuring China’s oil supply capacity and the sustainable development of rapeseed industry.

Author Contributions

Conceptualization, J.T. and W.W.; methodology, J.T.; validation, J.T. and W.L.; formal analysis, J.T.; investigation, W.L.; resources, J.T.; data curation, M.X.; writing—original draft preparation, J.T.; writing—review and editing, J.T. and W.W.; supervision, J.T.; project administration, J.T.; funding acquisition, W.W. All authors have read and agreed to the published version of the manuscript.

Funding

This work was founded by the National Natural Science Foundation of China (41971371), National Natural Science Foundation of China (41871356), and Fundamental Research Funds for the Central Universities (CCNU19TS004 and CCNU19TD002).

Acknowledgments

The authors would like to thank the anonymous reviewers for their comments and suggestions on this paper.

Conflicts of Interest

The authors declare no conflict of interest.

References

  1. USDA. Oilseeds: World Markets and Trade. Available online: https://www.fas.usda.gov/data/oilseeds-world-markets-and-trade (accessed on 21 July 2018).
  2. NBS. National Bureau of Statistics of China. China Stat. Yearb. 2016. Available online: http://www.stats.gov.cn/ (accessed on 21 July 2018).
  3. Zhang, L.; Liu, T. Study on international competitiveness of soybean industry of China. Agric. Econ. 2015, 3, 116–118. [Google Scholar]
  4. Wang, J.; Zhu, X. Situation and policy of soybean industry development in China. Issues Agric. Econ. 2000, 9, 39–44. [Google Scholar]
  5. Ni, H.; Wang, Z.; Liu, W. Development of soybean industry in China under global market. Issues Agric. Econ. 2012, 33, 7–12. [Google Scholar]
  6. USDA. China: Oilseeds and Products Annual. Available online: https://www.fas.usda.gov/data/china-oilseeds-and-products-annual-2 (accessed on 21 July 2018).
  7. Khairina, A.K.; Nazlin, I.; Balu, N. Competitiveness of the Rapeseed Industry in China. Oil Palm Ind. Econ. J. 2017, 17, 8–24. [Google Scholar]
  8. Zhang, Z.; Liu, Z. China’s soybean demand and supply: Current situation and projection for the next 10 years. Soybean Sci. Technol. 2009, 4, 16–21. [Google Scholar]
  9. Sun, J.; Wu, W.; Tang, H.; Liu, J. Spatiotemporal patterns of non-genetically modified crops in the era of expansion of genetically modified food. Sci. Rep. 2015, 5, 14180. [Google Scholar] [CrossRef] [Green Version]
  10. Hairong, Y.; Yiyuan, C.; Bun, K.H. China’s soybean crisis: The logic of modernization and its discontents. J. Peasant Stud. 2016, 43, 373–395. [Google Scholar] [CrossRef]
  11. Sun, J.; Mooney, H.; Wu, W.; Tang, H.; Tong, Y.; Xu, Z.; Huang, B.; Cheng, Y.; Yang, X.; Wei, D. Importing food damages domestic environment: Evidence from global soybean trade. Proc. Natl. Acad. Sci. USA 2018, 115, 5415–5419. [Google Scholar] [CrossRef] [Green Version]
  12. Jikun, H.; Scott, R.; Min, C. The World Bank Economic Review; World Bank: Washington, DC, USA, 2004; pp. 59–84. [Google Scholar]
  13. She, B.; Huang, J.; Shi, J.; Wei, C. Extracting oilseed rape growing regions based on variation characteristics of red edge position. Trans. Chin. Soc. Agric. Eng. 2013, 29, 145–152. [Google Scholar]
  14. Rembold, F.; Meroni, M.; Urbano, F.; Csak, G.; Kerdiles, H.; Perez-Hoyos, A.; Lemoine, G.; Leo, O.; Negre, T. ASAP: A new global early warning system to detect anomaly hot spots of agricultural production for food security analysis. Agric. Syst. 2019, 168, 247–257. [Google Scholar] [CrossRef]
  15. Xiao, X.; Boles, S.; Liu, J.; Zhuang, D. Mapping paddy rice agriculture in southern China using multi-temporal MODIS images. Remote Sens. Environ. 2005, 95, 480–492. [Google Scholar] [CrossRef]
  16. Pan, Y.; Li, L.; Zhang, J.; Liang, S.; Zhu, X.; Sulla-Menashe, D. Winter wheat area estimation from MODIS-EVI time series data using the Crop Proportion Phenology Index. Remote Sens. Environ. 2012, 119, 232–242. [Google Scholar] [CrossRef]
  17. Hu, Q.; Ma, Y.; Xu, B.; Song, Q. Estimating sub-Pixel soybean fraction from time-Series MODIS data using an optimized geographically weighted regression model. Remote Sens. Environ. 2018, 10, 491. [Google Scholar] [CrossRef] [Green Version]
  18. Dong, J.; Xiao, X.; Menarguez, A.M.; Zhang, G. Mapping paddy rice planting area in northeastern Asia with Landsat 8 images, phenology-based algorithm and Google Earth Engine. Remote Sens. Environ. 2016, 185, 142–154. [Google Scholar] [CrossRef] [Green Version]
  19. Huang, J.; Tian, L.; Liang, S.; Ma, H. Improving winter wheat yield estimation by assimilation of the leaf area index from Landsat TM and MODIS data into the WOFOST model. Agric. Meteorol. 2015, 204, 106–121. [Google Scholar] [CrossRef] [Green Version]
  20. Liang, Y.; Wan, J. Application of HJ-1A/B-CCD images in extracting the distribution of winter wheat and rape in Hubei Province. Chin. J. Agrometeorol. 2012, 33, 573–578. [Google Scholar]
  21. Wang, K.; Zhang, J. Extraction of rape seed cropping distribution information in Hubei Province based on MODIS images. Remote Sens. Land Resour. 2015, 27, 65–70. [Google Scholar]
  22. Liu, J.; Kuang, W.; Zhang, Z.; Xu, X. Spatiotemporal characteristics, patterns, and causes of land-use changes in China since the late 1980s. J. Geogr. Sci. 2014, 24, 195–210. [Google Scholar] [CrossRef]
  23. Huete, A.; Didan, K.; Miura, T.; Rodriguez, E.P.; Gao, X.; Ferreira, L.G. Overview of the radiometric and biophysical performance of the MODIS vegetation indices. Remote Sens. Environ. 2002, 83, 195–213. [Google Scholar] [CrossRef]
  24. Tao, J.; Wu, W.; Xu, M. Using the Bayesian Network to map large-scale cropping intensity by fusing multi-source data. Remote Sens. 2019, 11, 168. [Google Scholar] [CrossRef] [Green Version]
  25. Jönsson, P.; Eklundh, L. TIMESAT—A program for analyzing time-series of satellite sensor data. Comput. Geosci. 2004, 30, 833–845. [Google Scholar] [CrossRef] [Green Version]
  26. Wang, Z.; Ke, L.; Deng, F. Doubling MODIS-NDVI temporal resolution: From 16-day to 8-day. Remote Sens. Technol. Appl. 2011, 26, 437–443. [Google Scholar]
  27. Tao, J.; Wu, W.; Zhou, Y.; Wang, Y. Mapping winter wheat using phenological feature of peak before winter on the North China Plain based on time-series MODIS data. J. Integr. Agric. 2017, 16, 348–359. [Google Scholar] [CrossRef]
  28. Mcgarigal, K.; Marks, B.J. Spatial Pattern Analysis Program for Quantifying Landscape Structure; Gen. Tech. Rep. PNW-GTR-351; US Department of Agriculture, Forest Service Pacific Northwest Research Station: Corvallis, OR, USA, 1995; pp. 1–122.
  29. Wang, H. Technological Strategy to Improve the International Market Competition of Rapeseed Industry in China. Rev. China Agric. Sci. Technol. 2004, 1, 005–010. [Google Scholar]
  30. Liu, C.; Zhao, Y. Policy on improving the competitiveness of rapeseed industry. Issues Agric. Econ. 2007, 4, 26–29. [Google Scholar]
  31. Cai, R. The strategy of China’s rapeseed trade development under the background of world rapeseed trade. Chin. Rural Econ. 1999, 5, 39–43. [Google Scholar]
Figure 1. Rapeseed import/export quantity in China from 2000 to 2017. Data source: the Statistics Division of the Food and Agriculture Organization of the United Nations at http://faostat.fao.org/.
Sustainability 12 00466 g001
Figure 2. The study area and the main land-cover types in 2010 from MCD12Q1 UMD datasets, which were from the standard MODIS land cover type data product in the IGBP Land Cover Type Classification. UMD, University of Maryland. MODIS, Moderate Resolution Imaging Spectroradiometer. IGBP, International Geosphere-Biosphere Program.
Sustainability 12 00466 g002
Figure 3. Enhanced vegetation index (EVI) curves for dominant winter crops within their lifecycle. DOY, Julian day of a year.
Sustainability 12 00466 g003
Figure 4. Flowchart of extracting winter rape. PCA, principle components analysis. ISODATA, Iterative Self-Organizing Data Analysis Techniques Algorithm.
Sustainability 12 00466 g004
Figure 5. Comparison of the winter rape distributions from different sources (true-color composites vs. the decision tree modeled results), (a) sample area in Hubei Province, (b) sample area in Anhui Province.
Sustainability 12 00466 g005
Figure 6. Validation of modeled results, (a) sample area in Hubei Province, (b) sample area in Anhui Province.
Sustainability 12 00466 g006
Figure 7. Hotspots of winter rape dynamics from 2003 to 2015 on the Middle Reaches of the Yangtze River Valley (MYR), China. (a) Changes of winter rape, (b) hotspots of winter rape gain, (c) hotspots of winter rape loss. Names of provincial-level regions are also shown. Color bars in (b) and (c) indicate the change rate of winter rape from 0% (light color) to 100% (dark color). The original 250 m change maps were aggregated to 2000 m image blocks.
Sustainability 12 00466 g007aSustainability 12 00466 g007b
Figure 8. Winter rape dynamics in relation to their abundance on the MYR, China. (a), Winter rape area 2003 (cyan bars) vs winter rape area 2015 (dark green bars). (b), winter rape gain (green bars) vs winter rape loss (red bars).
Sustainability 12 00466 g008
Figure 9. Trade competitiveness (TC) index of rapeseed for five top rapeseed producing countries (Canada, China, India, France, and Australia) in 2017. The data used to calculate TC index were sourced from http://faostat.fao.org/.
Sustainability 12 00466 g009
Table 1. The summarized winter rape areas in the study area (k ha).
Provinces20032015Changing AmountChanging Rate (%)
Henan354,864.40181,419.30−173,445.10−48.9
Hubei1,615,787.00 839,704.60 −776,082.40−48.0
Hunan299,374.20 141,926.40 −157,447.80−52.6
Anhui1,064,767.00 526,301.20 −538,465.80−50.6
Jiangxi151,612.50 172,936.00 21,323.5014.1
Total3,486,405.101,862,287.50−1,624,117.60−46.6
Table 2. Global autocorrelation analysis of winter rape distribution.
IndicatorsMoran’s IZ-scorep-value
20030.5310.00
20150.417.80
Table 3. Landscape indexes of winter rape distribution. NP, number of patches; PD, patch density; MPA, mean patch area; SI, splitting index; AI, aggregation index; LPI, largest patch index.
IndicatorsNPPDMPALPISIAI
200364,0970.16540.80569764
201543,7280.11430.15104,55852
Table 4. Comparison of the winter rape input between Canada and China (CNY/Mu).
InputLandMaterialsLaborTotal
SubtotalSeedPesticideMechanism
China120.8223.719.115.259.5559.3903.7
Canada58.8349.757.259.223.832.8441.4

