The Unequal Impact of Natural Landscape Views on Housing Prices: Applying Visual Perception Model and Quantile Regression to Apartments in Seoul


Abstract
1. Introduction
2. Data and Methods
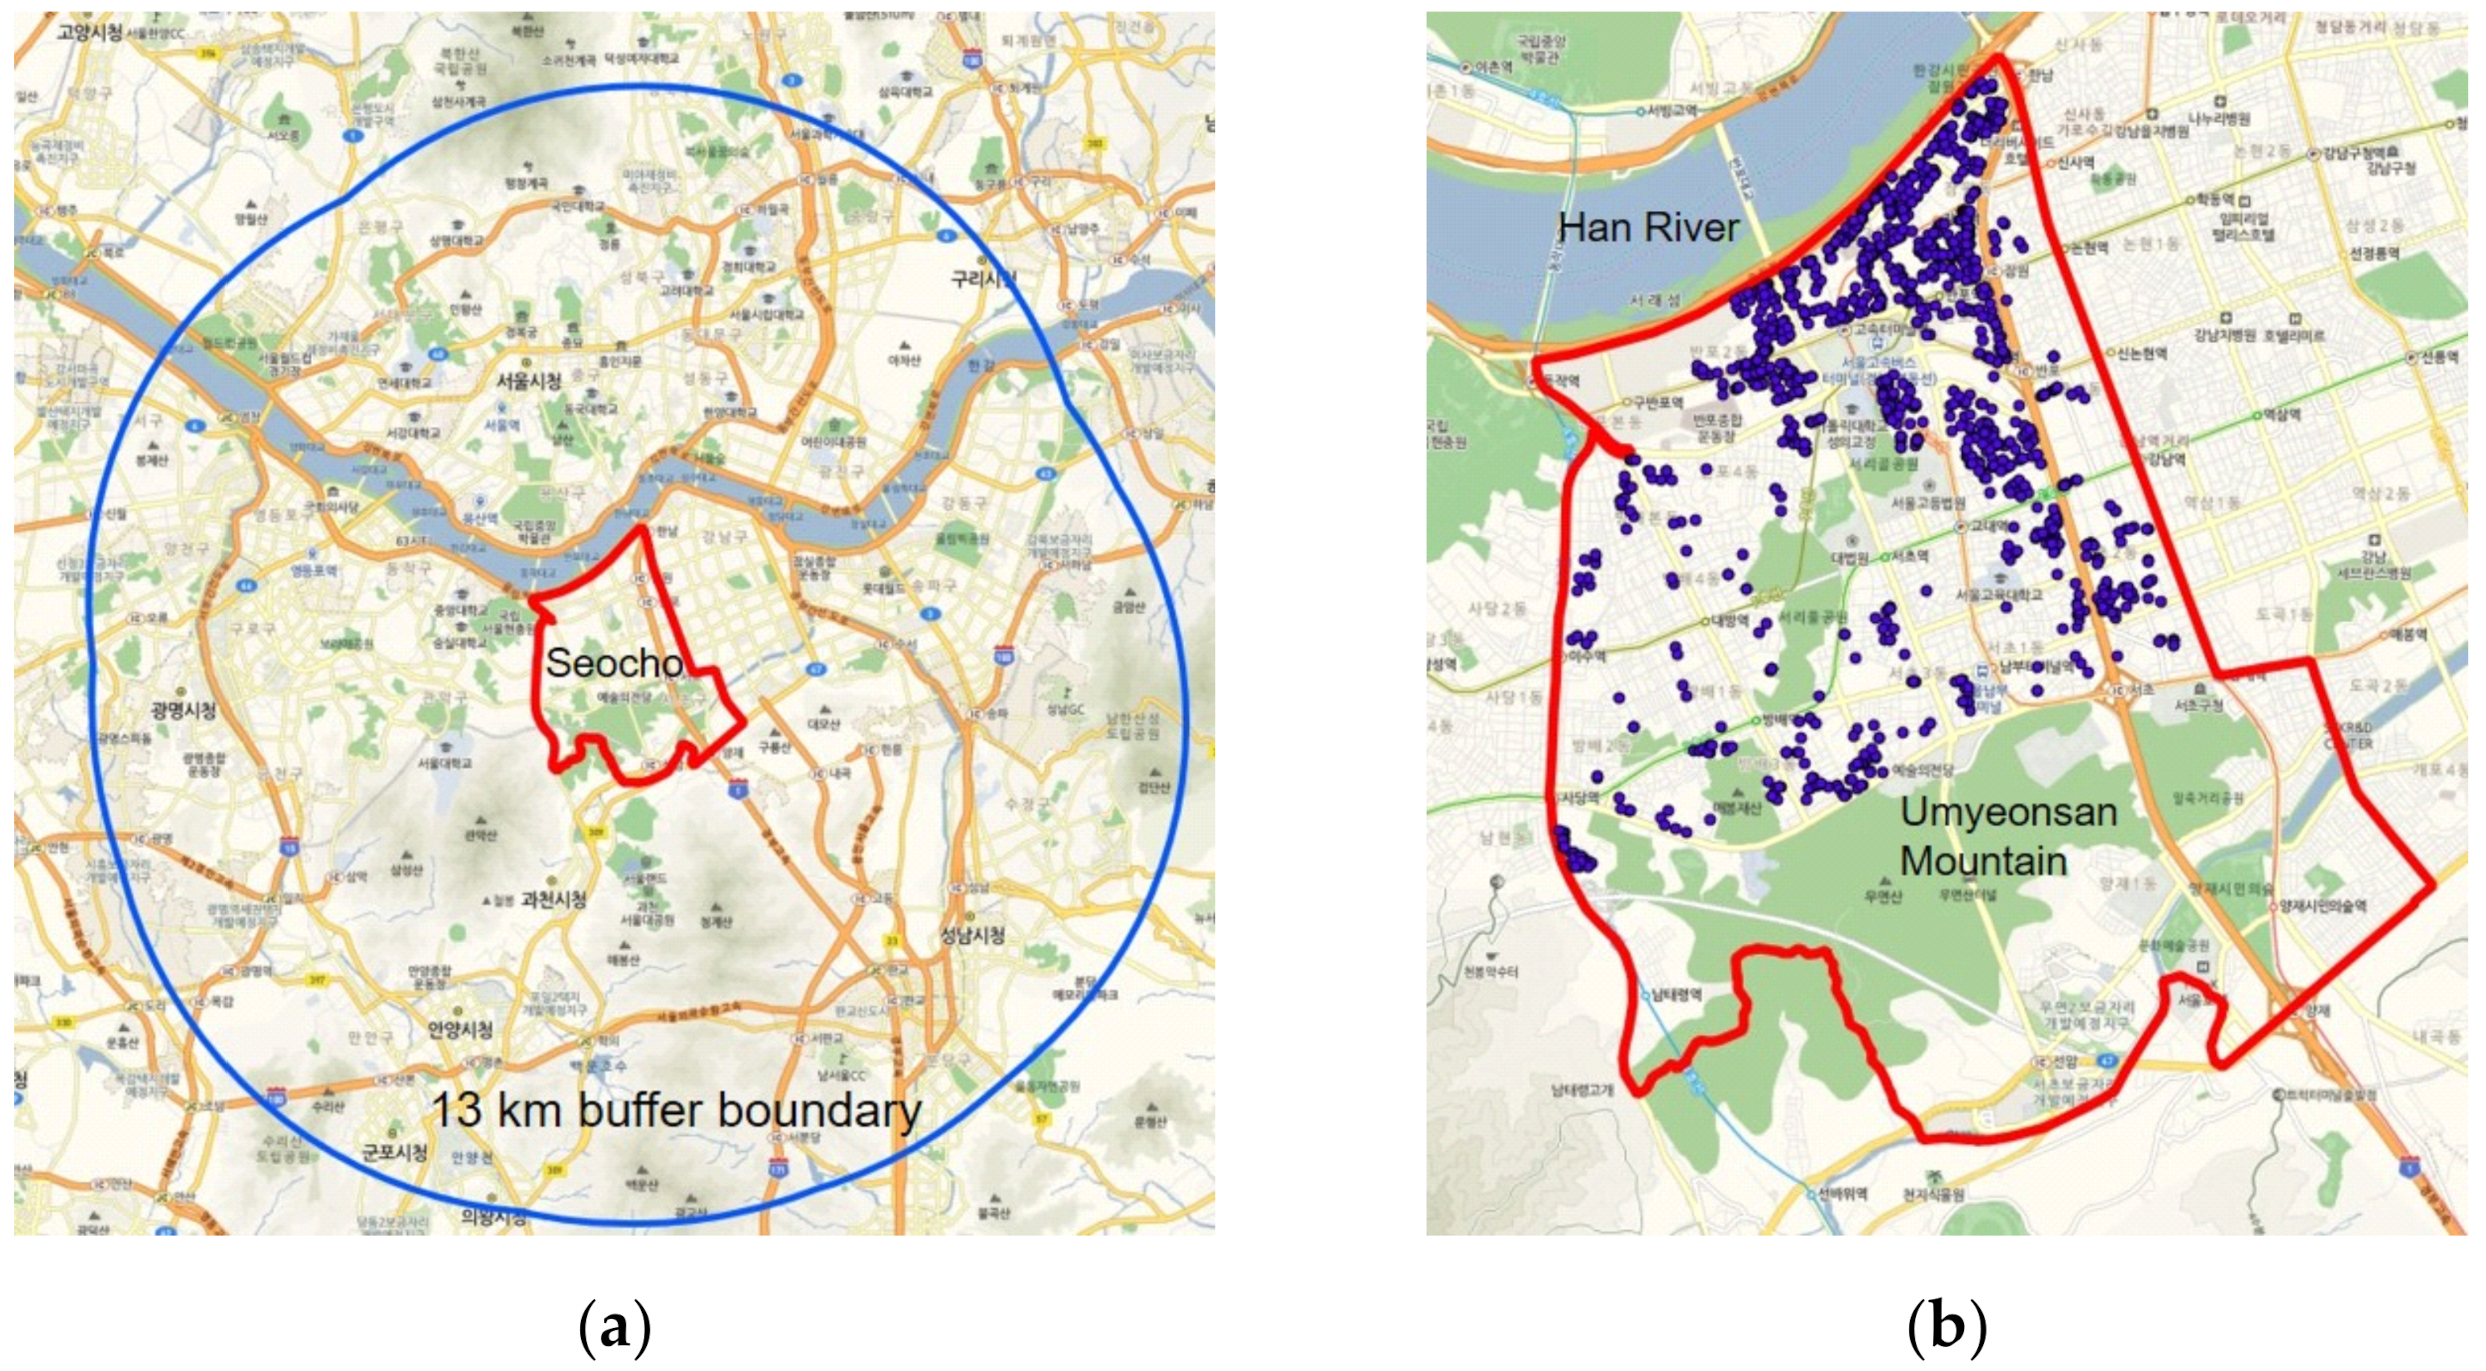
2.1. Data
2.2. Methods
2.2.1. Visual Perception Model
- (1)
- Viewshed analysis using a DSM. In an urban space where artificial features such as buildings interfere with the view, a DSM that includes the height information of buildings should be used, rather than a simple DEM. The viewshed analysis uses a distance and a viewing angle that can sufficiently include target objects required for landscape evaluation from a viewpoint. Viewshed analysis uses the raster analysis function of GIS;
- (2)
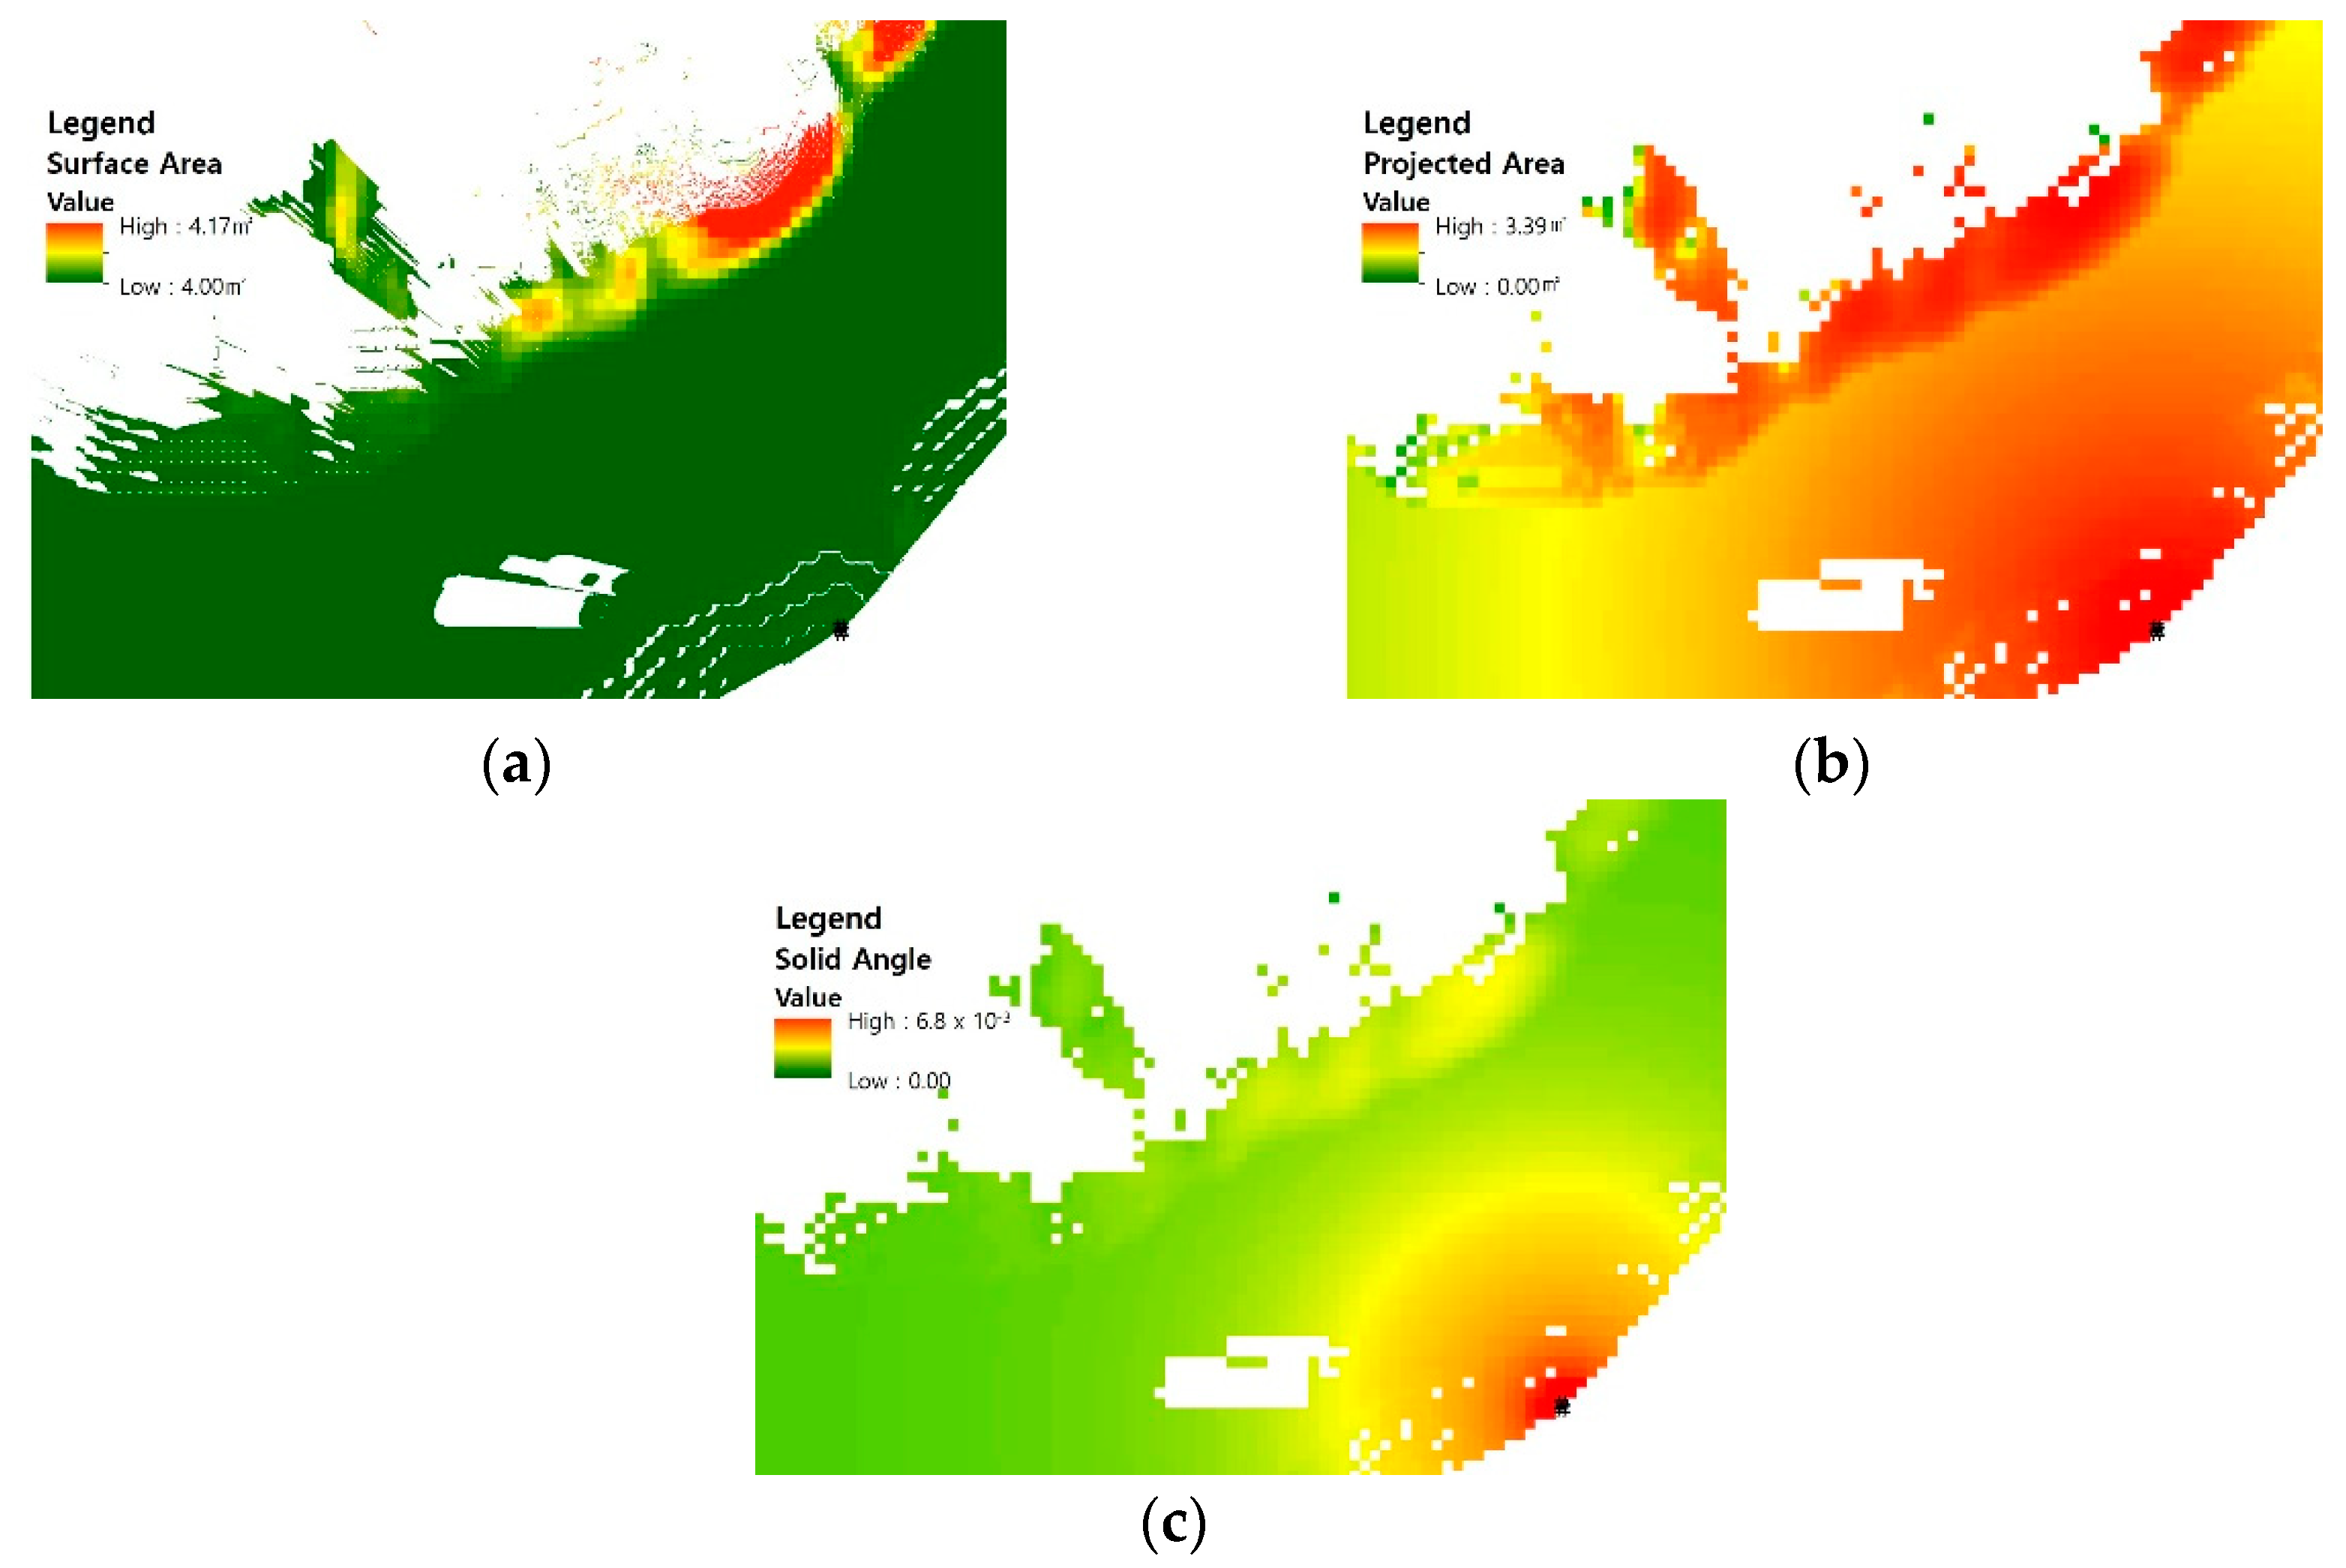
- Using Equation (2), calculate the actual surface area from the angle of inclination, and generate raster data with the value of surface area only for the ground pixels on which a line of sight is created in the DSM. The angle of inclination is calculated using the slope function of GIS, and the calculation of the surface area uses the raster calculator functionwhere A′ is the actual surface area, A″ is the planimetric area of pixel, and θ is the inclination angle of the ground surface;
- (3)
- Using the dot product as in Equation (3), calculate the area where the actual surface area is projected in the direction of the viewing point, and create raster data. The normal vector of the ground surface is calculated using the elements of the aspect and slope of the DSM, the aspect is calculated using the raster analysis function of GIS, and the calculation of the projected area uses the raster calculator functionwhere A is the projected area, is the direction vector of the line-of-sight with the target object as the origin and the viewpoint as the end point, and is the normal vector of the ground surface;
- (4)
- The solid angle at which a pixel on the visible ground surface is perceived by a person is calculated by dividing the projected area by the square of the range of sightline using Equation (1). The distance from the observation point to the ground pixel to be analyzed is calculated as the Euclidean distance from the coordinates of the two points, and the raster calculator function is used to calculate the solid angle and generate raster data;
- (5)
- The visibility angle is calculated by summing the solid angle of the raster data created in (4) for each natural landscape item of the land cover to be analyzed. Among the raster analysis functions of GIS, the zonal statistics function is used to sum solid angles.
2.2.2. Hedonic Price Model
2.2.3. Quantile Regression Model
2.3. Independent Variables
2.3.1. Natural Landscape Views
2.3.2. Other Independent Variables
3. Results
3.1. OLS Regression Analysis Results
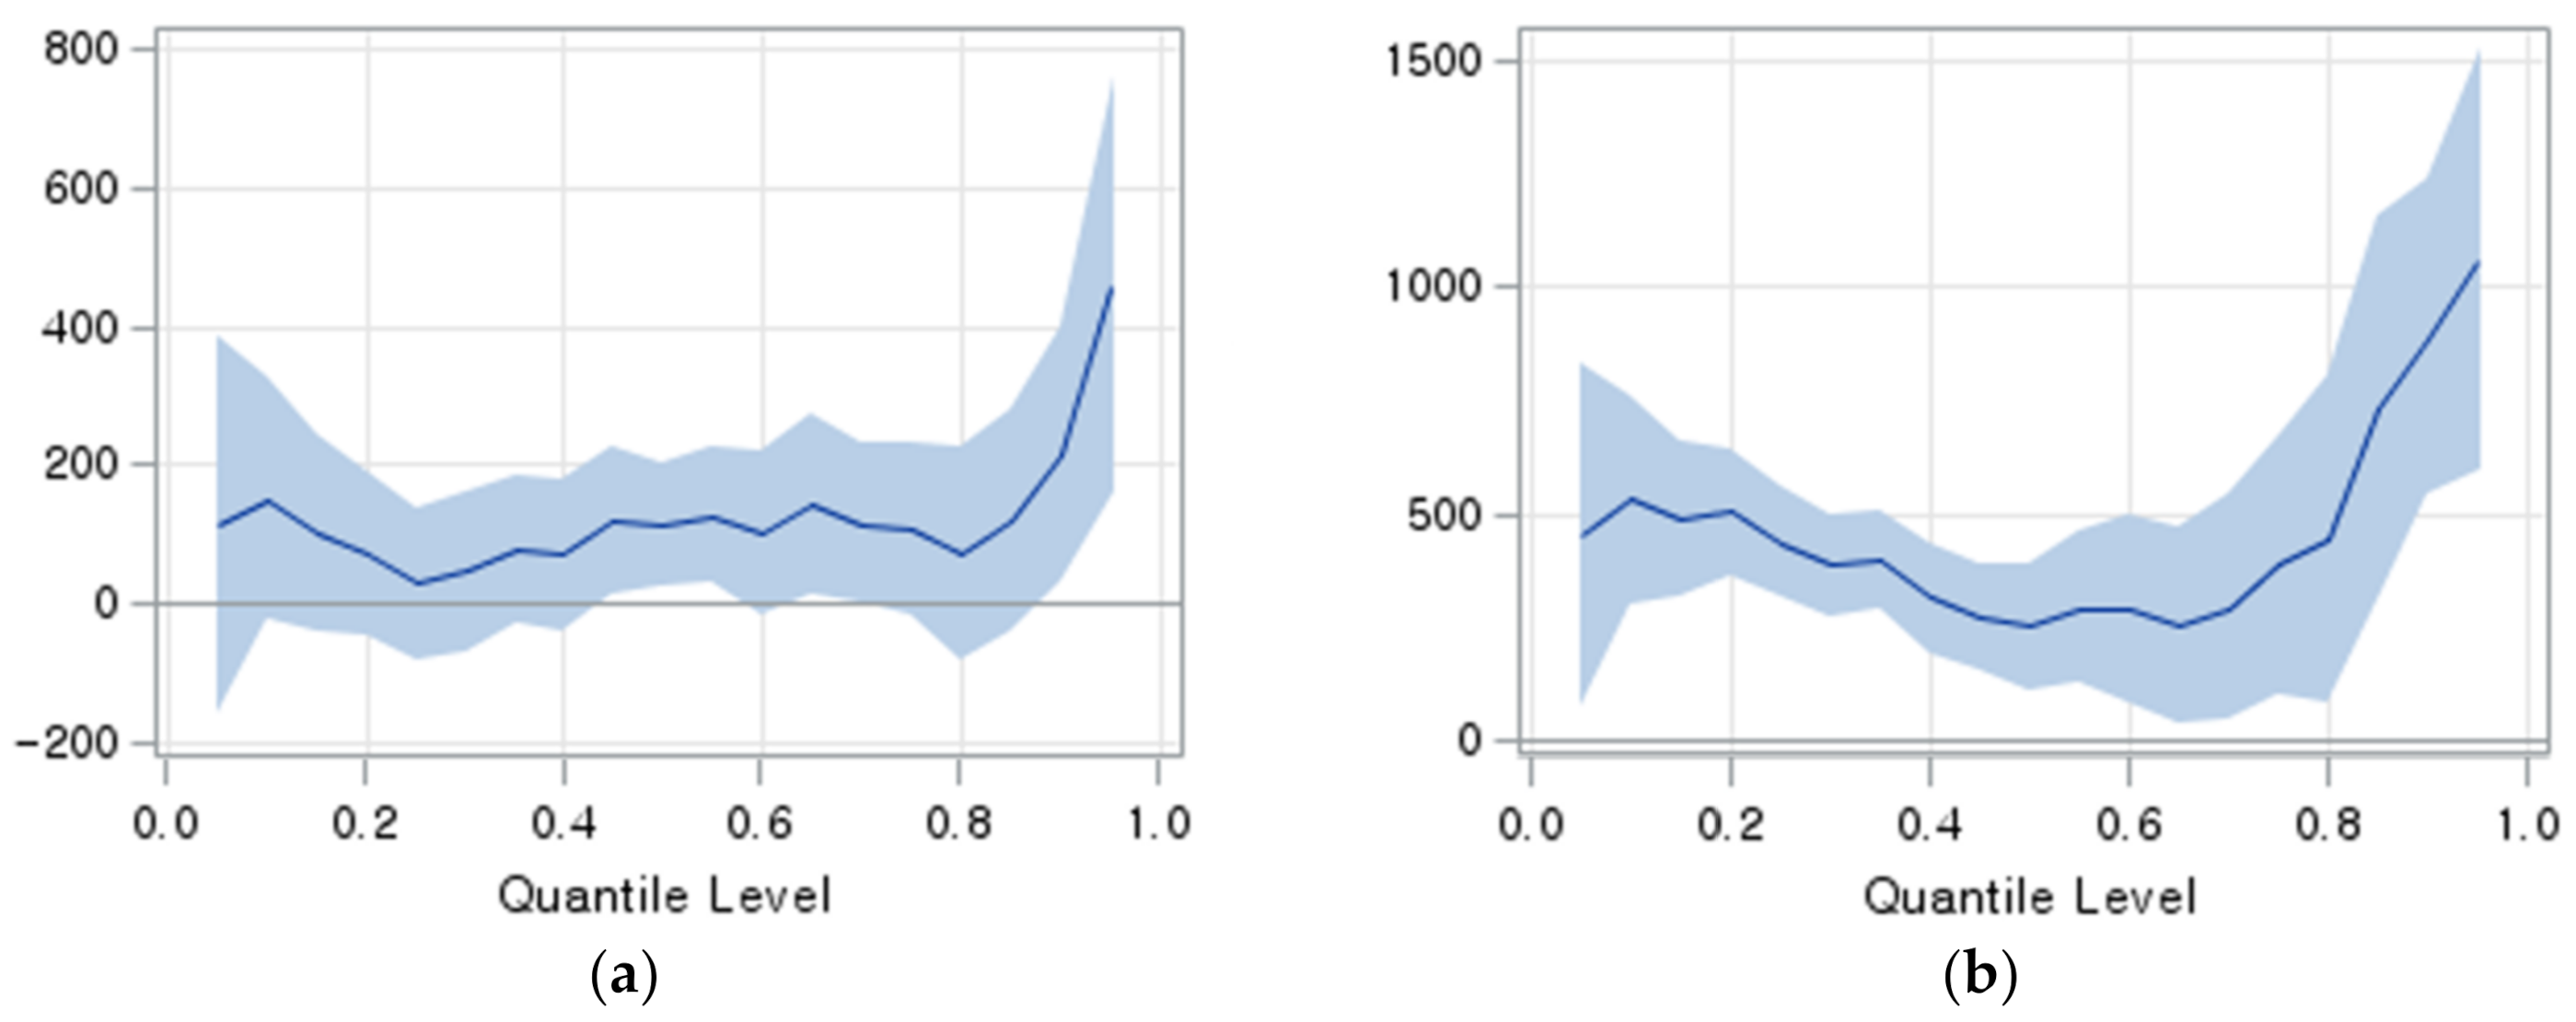
3.2. Quantile Regression Analysis Results
4. Discussion
4.1. Natural Landscape Views and Wealth Inequality
4.2. Visual Perception Analysis
- (1)
- Analyze the slope and aspect of the DSM, the azimuth between the viewpoint and the DSM pixel;
- (2)
- Calculate the surface area using the slope of the DSM pixel where the visibility line is created;
- (3)
- Calculate the projected area by applying directional cosine using slope, aspect, and azimuth angle to the surface area;
- (4)
- Calculate the solid angle corresponding to the visual perception by dividing the projected area by the square of the distance between the viewpoint and the target pixel;
- (5)
- Quantify the visual perception of the natural landscape by summing the solid angle for each land cover item included in the viewshed.
5. Conclusions
Author Contributions
Funding
Conflicts of Interest
References
- National Geographic. Available online: https://www.nationalgeographic.org/encyclopedia/landscape/ (accessed on 30 August 2020).
- Kaplan, R. Impact of urban nature: A theoretical analysis. Urban Ecol. 1984, 8, 189–197. [Google Scholar] [CrossRef]
- Kaplan, R. The nature of the view from home. Environ. Behav. 2001, 33, 507–542. [Google Scholar] [CrossRef]
- Jim, C.Y.; Chen, W.Y. Value of scenic views: Hedonic assessment of private housing in Hong Kong. Landsc. Urban Plan. 2009, 91, 226–234. [Google Scholar] [CrossRef]
- Bourassa, S.C.; Hoesli, M.; Sun, J. What’s in a view? Environ. Plan. A 2004, 36, 1427–1450. [Google Scholar] [CrossRef]
- Rosen, S. Hedonic prices and implicit markets: Product differentiation in pure competition. J. Political Econ. 1974, 82, 34–55. [Google Scholar] [CrossRef]
- Zietz, J.; Zietz, E.N.; Sirmans, G.S. Determinants of house prices: A quantile regression approach. J. Real Estate Financ. Econ. 2008, 37, 317–333. [Google Scholar] [CrossRef]
- Boyle, M.; Kiel, K. A survey of house price hedonic studies of the impact of environmental externalities. J. Real Estate Lit. 2001, 9, 117–144. [Google Scholar]
- Hui, E.C.M.; Zhong, J.W.; Yu, K.H. The impact of landscape views and storey levels on property prices. Landsc. Urban Plan. 2012, 105, 86–93. [Google Scholar] [CrossRef]
- Jim, C.Y.; Chen, W.Y. Impacts of urban environmental elements on residential housing prices in Guangzhou (China). Landsc. Urban Plan. 2006, 78, 422–434. [Google Scholar] [CrossRef]
- Nicholls, S.; Crompton, J.L. The impact of greenways on property values: Evidence from Austin, Texas. J. Leis. Res. 2005, 37, 321–341. [Google Scholar] [CrossRef]
- Schultz, S.; Schmitz, N. Viewshed analyses to measure the impact of lake views on urban residential properties. Apprais. J. 2008, 76, 224–232. [Google Scholar]
- Bourassa, S.C.; Hoesli, M.; Peng, V.S. Do housing submarkets really matter? J. Hous. Econ. 2003, 12, 12–28. [Google Scholar] [CrossRef]
- Garrod, G.D.; Willis, K.G. Valuing goods’ characteristics: An application of the hedonic price method to environmental attributes. J. Environ. Manag. 1992, 34, 59–76. [Google Scholar] [CrossRef]
- Jim, C.Y.; Chen, W.Y. External effects of neighbourhood parks and landscape elements on high-rise residential value. Land Use Policy 2010, 27, 662–670. [Google Scholar] [CrossRef]
- Morancho, A.B. A hedonic valuation of urban green areas. Landsc. Urban Plan. 2003, 66, 35–41. [Google Scholar] [CrossRef]
- Walls, M.; Kousky, C.; Chu, Z. Is what you see what you get? The value of natural landscape views. Land Econ. 2015, 91, 1–19. [Google Scholar] [CrossRef]
- Liu, L.; Jakus, P.M. Hedonic valuation in an urban high-rise housing market. Can. J. Agric. Econ./Rev. Can. d’ Agroecon. 2015, 63, 259–273. [Google Scholar] [CrossRef]
- Liu, S.; Hite, D. Measuring the Effect of Green Space on Property Value: An Application of the Hedonic Spatial Quantile Regression. In Proceedings of the 2013 Annual Meeting, Orlando, FL, USA, 2–5 February 2013. [Google Scholar]
- Wen, H.; Bu, X.; Qin, Z. Spatial effect of lake landscape on housing price: A case study of the West Lake in Hangzhou, China. Habitat Int. 2014, 44, 31–40. [Google Scholar] [CrossRef]
- Wen, H.; Xiao, Y.; Zhang, L. Spatial effect of river landscape on housing price: An empirical study on the Grand Canal in Hangzhou, China. Habitat Int. 2017, 63, 34–44. [Google Scholar] [CrossRef]
- Wen, H.; Zhang, Y.; Zhang, L. Assessing amenity effects of urban landscapes on housing price in Hangzhou, China. Urban For. Urban Green. 2015, 14, 1017–1026. [Google Scholar] [CrossRef]
- Xiao, Y.; Hui, E.C.M.; Wen, H. Effects of floor level and landscape proximity on housing price: A hedonic analysis in Hangzhou, China. Habitat Int. 2019, 87, 11–26. [Google Scholar] [CrossRef]
- Xiao, Y. Hedonic Housing Price Theory Review. In Urban Morphology and Housing Market; Springer: Singapore, 2017; pp. 11–40. [Google Scholar]
- Ebru, Ç.; Eban, A. Determinants of house prices in Istanbul: A quantile regression approach. Qual. Quant. 2009, 45, 305–317. [Google Scholar] [CrossRef]
- Mak, S.; Choy, L.; Ho, W. Quantile regression estimates of Hong Kong real estate prices. Urban Stud. 2010, 47, 2461–2472. [Google Scholar] [CrossRef]
- Wen, H.; Gui, Z.; Tian, C.; Xiao, Y.; Fang, L. Subway opening, traffic accessibility, and housing prices: A quantile hedonic analysis in Hangzhou, China. Sustainability 2018, 10, 2254. [Google Scholar] [CrossRef]
- Zhang, L.; Yi, Y. Quantile house price indices in Beijing. Reg. Sci. Urban Econ. 2017, 63, 85–96. [Google Scholar] [CrossRef]
- Zahirovic-Herbert, V.; Chatterjee, S. Historic preservation and residential property values: Evidence from quantile regression. Urban Stud. 2012, 49, 369–382. [Google Scholar] [CrossRef]
- Wen, H.; Xiao, Y.; Hui, E.C.M. Quantile effect of educational facilities on housing price: Do homebuyers of higher-priced housing pay more for educational resources? Cities 2019, 90, 100–112. [Google Scholar] [CrossRef]
- Koenker, R.; Bassett, J.G. Regression quantiles. Econom. J. Econom. Soc. 1978, 46, 33–50. [Google Scholar] [CrossRef]
- Kim, H.; Park, S.W.; Lee, S.; Xue, X. Determinants of house prices in Seoul: A quantile regression approach. Pac. Rim Prop. Res. J. 2015, 21, 91–113. [Google Scholar] [CrossRef]
- Jeong, J.H.; Cheon, B.Y. Korea’s wealth inequality structure from an international perspective: Comparing with wealth inequaliies in Korea, USA and Spain. Geogr. J. Korea 2017, 51, 149–164. [Google Scholar]
- Kim, D.; Lee, S. The effect of characteristics of apartment complex on the count rate of house transaction. J. Korea Real Estate Anal. Assoc. 2018, 24, 53–68. [Google Scholar] [CrossRef]
- Benson, E.D.; Hansen, J.L.; Schwartz, J.A.L.; Smersh, G.T. Pricing residential amenities: The value of a view. J. Real Estate Finance Econ. 1998, 16, 55–73. [Google Scholar] [CrossRef]
- Hui, E.C.M.; Liang, C. Spatial spillover effect of urban landscape views on property price. Appl. Geogr. 2016, 72, 26–35. [Google Scholar] [CrossRef]
- Luttik, J. The value of trees, water and open space as reflected by house prices in the Netherlands. Landsc. Urban Plan. 2000, 48, 161–167. [Google Scholar] [CrossRef]
- Cavailhès, J.; Brossard, T.; Foltête, J.-C.; Hilal, M.; Joly, D.; Tourneux, F.-P.; Tritz, C.; Wavresky, P. GIS-based hedonic pricing of landscape. Environ. Resour. Econ. 2009, 44, 571–590. [Google Scholar] [CrossRef]
- Baranzini, A.; Schaerer, C. A sight for sore eyes: Assessing the value of view and land use in the housing market. J. Hous. Econ. 2011, 20, 191–199. [Google Scholar] [CrossRef]
- Poudyal, N.C.; Hodges, D.G.; Fenderson, J. Realizing the economic value of a forested landscape in a viewshed. South. J. Appl. For. 2010, 34, 72–78. [Google Scholar] [CrossRef]
- Yamagata, Y.; Murakami, D.; Yoshida, T.; Seya, H.; Kuroda, S. Value of urban views in a bay city: Hedonic analysis with the spatial multilevel additive regression (SMAR) model. Landsc. Urban Plan. 2016, 151, 89–102. [Google Scholar] [CrossRef]
- Yang, P.P.; Putra, S.Y.; Li, W. Viewsphere: A GIS-based 3D visibility analysis for urban design evaluation. Environ. Plan. B Plan. Des. 2007, 34, 971–992. [Google Scholar] [CrossRef]
- Bartie, P.; Reitsma, F.; Kingham, S.; Mills, S. Advancing visibility modelling algorithms for urban environments. Comput. Environ. Urban Syst. 2010, 34, 518–531. [Google Scholar] [CrossRef]
- Kwon, J.H. A Study on weighted visibility analysis of topographic landscape considering user’s visual perception. J. Reg. Assoc. Archit. Inst. Korea 2011, 13, 85–92. [Google Scholar]
- Domingo-Santos, J.M.; de Villarán, R.F.; Rapp-Arrarás, Í.; de Provens, E.C.P. The visual exposure in forest and rural landscapes: An algorithm and a GIS tool. Landsc. Urban Plan. 2011, 101, 52–58. [Google Scholar] [CrossRef]
- Nutsford, D.; Reitsma, F.; Pearson, A.L.; Kingham, S. Personalising the viewshed: Visibility analysis from the human perspective. Appl. Geogr. 2015, 62, 1–7. [Google Scholar] [CrossRef]
- Fisher-Gewirtzman, D. Integrating ‘weighted views’ to quantitative 3D visibility analysis as a predictive tool for perception of space. Environ. Plan. B Urban Anal. City Sci. 2018, 45, 345–366. [Google Scholar] [CrossRef]
- The Seoul Institute. Regional Gap by Sector in Seoul (2) Dwelling and Housing. Seoul Infographics 2018, 271, 1–4. Available online: https://www.si.re.kr/node/60540 (accessed on 24 August 2020).
- National Spatial Data Infrastructure Portal. Available online: http://www.nsdi.go.kr/lxportal/?menuno=2679 (accessed on 30 August 2020).
- Groß, M. The analysis of visibility—Environmental interactions between computer graphics, physics, and physiology. Comput. Graph. 1991, 15, 407–415. [Google Scholar] [CrossRef]
- Coulson, N.E.; McMillen, D.P. The dynamics of intraurban quantile house price indexes. Urban Stud. 2007, 44, 1517–1537. [Google Scholar] [CrossRef]
- Koenker, R.; Hallock, K. Quantile regression: An introduction. J. Econ. Perspect. 2001, 15, 43–56. [Google Scholar] [CrossRef]
- VWORLD. 3D Desktop API Reference. Available online: http://www.vworld.kr/dev/v4dv_dhapiguide_s001.do (accessed on 28 August 2020).
- National Institute of Environmental Research. Annual Report of Air Quality in Korea 2012; National Institute of Environmental Research: Incheon, Korea, 2013. [Google Scholar]
- Lee, J.S.; Kim, J.; Son, Y.H. A study on the influence of environmental factors on the apartment price: Focused on view quality and park accessibility in Songdo newtown. Korea Real Estate Rev. 2013, 24, 99–121. [Google Scholar]
- Lee, S.-K.; Shin, W.-J. The effect of reconstruction probability on apartment price. J. Korea Plan. Assoc. 2001, 36, 101–110. [Google Scholar]
- Lee, B.S.; Chung, E.-C.; Kim, Y.H. Dwelling age, redevelopment, and housing prices: The case of apartment complexes in Seoul. J. Real Estate Finance Econ. 2005, 30, 55–80. [Google Scholar] [CrossRef]
- KOSIS. Exchange Rate. Available online: http://kosis.kr/statHtml/statHtml.do?orgId=101&tblId=DT_2KAA811&conn_path=I2 (accessed on 30 August 2020).
- Gujarati, D.N. Basic Econometrics, 4th ed.; The Mc-Graw Hill: New York, NY, USA, 2004; pp. 226–229. [Google Scholar]


| Variable | Definition | Mean | S.D. | Min. | Max. |
|---|---|---|---|---|---|
| PRICE | Sale prices of apartments as dependent variable (million KRW) 1 | 849.386 | 384.716 | 188.000 | 2850.000 |
| Views | |||||
| GREENVIEW | Solid angle of the visible pixels for green views (steradians) | 0.063 | 0.057 | 0.000 | 0.320 |
| RIVERVIEW | Solid angle of the visible pixels for Han River views (steradians) | 0.011 | 0.031 | 0.000 | 0.166 |
| Structure | |||||
| AREA | Net area of the apartment (square meters) | 98.850 | 37.697 | 23.700 | 254.450 |
| FLOOR | Floor level on which the apartment is situated (story) | 7.131 | 4.905 | 1.000 | 29.000 |
| SOUTH | 1 if the apartment is south-facing, otherwise 0 (dummy) | 0.780 | 0.414 | 0.000 | 1.000 |
| AGE | Subtracting the year of apartment completion from 2013 (years) | 21.913 | 10.999 | 4.000 | 37.000 |
| AGESQ | AGE squared (years squared) | 601.044 | 458.871 | 16.000 | 1369.000 |
| TUNIT | Number of total apartments in the complex | 844.579 | 875.893 | 9.000 | 3410.000 |
| Location | |||||
| DGANGNAM | Distance from the complex to Gangnam-gu boundary (100 m) | 14.261 | 10.310 | 0.687 | 46.521 |
| DSUBWAY | Distance from the complex to subway station (100 m) | 4.433 | 1.920 | 0.242 | 9.428 |
| DPRIMARY | Distance from the complex to primary school (100 m) | 3.566 | 1.697 | 0.623 | 8.724 |
| DMIDDLE | Distance from the complex to middle school (100 m) | 4.076 | 1.982 | 0.259 | 9.553 |
| Transaction | |||||
| SPRING | 1 if reported from April to June, otherwise 0 (dummy) | 0.325 | 0.469 | 0.000 | 1.000 |
| SUMMER | 1 if reported from July to September, otherwise 0 (dummy) | 0.171 | 0.377 | 0.000 | 1.000 |
| FALL | 1 if reported from October to December, otherwise 0 (dummy) | 0.220 | 0.414 | 0.000 | 1.000 |
| Variable | Linear: Dependent Variable = PRICE | Semi-Log: Dependent Variable = Ln(PRICE) | ||||||
|---|---|---|---|---|---|---|---|---|
| Unstandardized Coefficient | S.E. | Standardized Coefficient | VIF | Unstandardized Coefficient | S.E. | Standardized Coefficient | VIF | |
| CONSTANT | 341.474 *** | 37.054 | 6.069 *** | 0.041 | ||||
| GREENVIEW | 378.359 *** | 80.715 | 0.056 | 1.259 | 0.226 ** | 0.088 | 0.033 | 1.259 |
| RIVERVIEW | 324.706 ** | 139.561 | 0.026 | 1.149 | 0.444 *** | 0.153 | 0.035 | 1.149 |
| AREA | 7.253 *** | 0.115 | 0.711 | 1.124 | 0.008 *** | 0.0001 | 0.729 | 1.124 |
| FLOOR | 4.888 *** | 0.939 | 0.062 | 1.278 | 0.006 *** | 0.001 | 0.080 | 1.278 |
| SOUTH | 41.963 *** | 10.395 | 0.045 | 1.117 | 0.055 *** | 0.011 | 0.057 | 1.117 |
| AGE | −15.854 *** | 2.471 | −0.453 | 44.446 | −0.013 *** | 0.003 | −0.375 | 44.446 |
| AGESQ | 0.321 *** | 0.058 | 0.383 | 42.942 | 0.0003 *** | 0.0001 | 0.368 | 42.942 |
| TUNIT | 0.118 *** | 0.006 | 0.269 | 1.800 | 0.0001 *** | 0.00001 | 0.251 | 1.800 |
| DGANGNAM | −0.792 * | 0.475 | −0.021 | 1.441 | −0.002 *** | 0.0005 | −0.042 | 1.441 |
| DSUBWAY | −34.427 *** | 2.496 | −0.172 | 1.383 | −0.031 *** | 0.0027 | −0.150 | 1.383 |
| DPRIMARY | −18.515 *** | 2.997 | −0.082 | 1.557 | −0.023 *** | 0.0033 | −0.101 | 1.557 |
| DMIDDLE | −5.890 ** | 2.594 | −0.030 | 1.591 | −0.004 | 0.0028 | −0.020 | 1.591 |
| SPRING | 19.855 * | 10.522 | 0.024 | 1.464 | 0.015 | 0.0115 | 0.017 | 1.464 |
| SUMMER | 3.130 | 12.644 | 0.003 | 1.368 | −0.002 | 0.0138 | −0.002 | 1.368 |
| FALL | −11.577 | 11.711 | −0.012 | 1.417 | −0.014 | 0.0128 | −0.015 | 1.417 |
| R2 | 0.8604 | 0.8403 | ||||||
| Adj. R2 | 0.8587 | 0.8384 | ||||||
| N | 1260 | 1260 | ||||||
| OLS | Q0.05 | Q0.1 | Q0.15 | Q0.2 | Q0.25 | Q0.3 | Q0.35 | Q0.4 | Q0.45 | |
|---|---|---|---|---|---|---|---|---|---|---|
| CONSTANT | 341.47 *** | 45.94 | 76.27 * | 138.54 *** | 200.58 *** | 271.76 *** | 267.76 *** | 289.66 *** | 287.13 *** | 298.36 *** |
| (37.054) | (46.660) | (41.432) | (37.951) | (38.555) | (30.915) | (29.056) | (25.422) | (28.775) | (29.322) | |
| GREENVIEW | 378.36 *** | 112.74 | 151.25 * | 101.63 | 71.50 | 29.64 | 46.23 | 77.47 | 71.56 | 118.79 ** |
| (80.715) | (137.804) | (88.912) | (72.978) | (60.065) | (56.297) | (57.585) | (53.347) | (55.674) | (54.228) | |
| RIVERVIEW | 324.71 ** | 456.31 ** | 530.04 *** | 486.33 *** | 504.64 *** | 438.63 *** | 386.95 *** | 401.38 *** | 312.90 *** | 271.82 *** |
| (139.561) | (193.396) | (117.513) | (87.212) | (72.244) | (61.054) | (58.254) | (54.915) | (60.666) | (59.397) | |
| AREA | 7.25 *** | 5.26 *** | 5.54 *** | 5.90 *** | 6.25 *** | 6.46 *** | 6.78 *** | 6.97 *** | 7.17 *** | 7.28 *** |
| (0.115) | (0.183) | (0.141) | (0.141) | (0.142) | (0.140) | (0.164) | (0.144) | (0.139) | (0.134) | |
| FLOOR | 4.89 *** | 2.66 ** | 5.31 *** | 4.70 *** | 5.10 *** | 4.33 *** | 4.27 *** | 4.20 *** | 4.69 *** | 4.66 *** |
| (0.939) | (1.163) | (1.027) | (0.925) | (0.731) | (0.688) | (0.678) | (0.644) | (0.642) | (0.536) | |
| SOUTH | 41.96 *** | 78.87 *** | 46.53 *** | 32.72 *** | 27.38 *** | 21.29 *** | 24.29 *** | 20.49 *** | 24.15 *** | 24.23 *** |
| (10.395) | (22.576) | (13.873) | (9.746) | (8.197) | (7.138) | (6.766) | (5.918) | (5.631) | (5.729) | |
| AGE | −15.85 *** | 7.09 *** | 6.09 *** | 4.72 ** | −0.54 | −6.91 *** | −8.81 *** | −10.28 *** | −11.40 *** | −12.63 *** |
| (2.471) | (2.450) | (2.267) | (2.343) | (2.358) | (1.972) | (1.837) | (1.542) | (1.597) | (1.490) | |
| AGESQ | 0.32 *** | −0.14 ** | −0.11 ** | −0.10 * | 0.01 | 0.13 *** | 0.17 *** | 0.20 *** | 0.22 *** | 0.24 *** |
| (0.058) | (0.061) | (0.052) | (0.053) | (0.050) | (0.043) | (0.041) | (0.035) | (0.036) | (0.033) | |
| TUNIT | 0.12 *** | 0.11 *** | 0.11 *** | 0.11 *** | 0.11 *** | 0.12 *** | 0.12 *** | 0.12 *** | 0.11 *** | 0.11 *** |
| (0.006) | (0.006) | (0.006) | (0.006) | (0.007) | (0.006) | (0.005) | (0.005) | (0.005) | (0.005) | |
| DGANGNAM | −0.79 * | −1.42 ** | −1.41 *** | −1.94 *** | −2.22 *** | −2.26 *** | −2.08 *** | −2.03 *** | −2.15 *** | −1.88 *** |
| (0.475) | (0.681) | (0.534) | (0.428) | (0.364) | (0.428) | (0.380) | (0.330) | (0.373) | (0.408) | |
| DSUBWAY | −34.43 *** | −20.00 *** | −21.63 *** | −24.12 *** | −26.19 *** | −25.03 *** | −24.67 *** | −24.95 *** | −24.44 *** | −22.86 *** |
| (2.496) | (4.376) | (3.032) | (2.457) | (2.114) | (1.697) | (1.729) | (1.642) | (1.955) | (2.080) | |
| DPRIMARY | −18.51 *** | −7.94 * | −12.02 *** | −15.45 *** | −15.83 *** | −14.23 *** | −12.28 *** | −12.33 *** | −12.16 *** | −12.53 *** |
| (2.997) | (4.413) | (3.474) | (2.648) | (2.274) | (2.107) | (2.444) | (2.375) | (2.435) | (2.567) | |
| DMIDDLE | −5.89 ** | −9.10 *** | −6.35 *** | −4.62 * | −5.11 ** | −5.72 *** | −7.25 *** | −8.96 *** | −8.18 *** | −9.32 *** |
| (2.594) | (2.623) | (2.380) | (2.374) | (2.251) | (2.182) | (2.039) | (1.719) | (1.898) | (2.093) | |
| SPRING | 19.85 * | 17.74 * | 19.12 * | 12.43 | 9.62 | 6.59 | 8.02 | 5.88 | 9.10 | 10.67 * |
| (10.522) | (10.168) | (9.943) | (10.005) | (8.333) | (7.572) | (7.074) | (7.185) | (6.973) | (6.444) | |
| SUMMER | 3.13 | −8.46 | 21.13* | 18.14 * | 5.85 | −0.35 | 3.08 | 2.43 | 1.63 | 2.56 |
| (12.644) | (22.069) | (12.721) | (9.809) | (9.251) | (9.181) | (8.769) | (8.062) | (7.209) | (6.914) | |
| FALL | −11.58 | 13.85 | 17.67 | 12.30 | 4.44 | 0.94 | −1.79 | −2.61 | −1.43 | −1.58 |
| (11.711) | (21.190) | (12.129) | (8.706) | (7.454) | (6.956) | (7.307) | (7.003) | (6.926) | (6.659) | |
| Q0.5 | Q0.55 | Q0.6 | Q0.65 | Q0.7 | Q0.75 | Q0.8 | Q0.85 | Q0.9 | Q0.95 | |
| CONSTANT | 325.83 *** | 342.60 *** | 356.89 *** | 383.15 *** | 405.68 *** | 424.72 *** | 455.81 *** | 440.41 *** | 382.23 *** | 395.90 *** |
| (30.054) | (28.363) | (27.220) | (28.868) | (25.624) | (31.272) | (37.001) | (37.001) | (40.229) | (70.511) | |
| GREENVIEW | 114.74 ** | 127.95 *** | 100.94 * | 145.51 ** | 116.64 ** | 107.73 * | 72.77 | 120.02 | 213.48 ** | 458.71 *** |
| (45.034) | (48.643) | (60.593) | (65.955) | (57.354) | (62.947) | (78.983) | (78.983) | (92.476) | (151.891) | |
| RIVERVIEW | 249.66 *** | 290.57 *** | 286.47 *** | 254.96 ** | 293.53 ** | 385.23 *** | 445.58 ** | 730.81 *** | 890.29 *** | 1062.23 *** |
| (69.545) | (85.274) | (105.407) | (111.051) | (127.246) | (146.622) | (184.104) | (184.104) | (179.130) | (237.457) | |
| AREA | 7.45 *** | 7.59 *** | 7.75 *** | 7.89 *** | 8.15 *** | 8.27 *** | 8.44 *** | 8.59 *** | 8.93 *** | 9.75 *** |
| (0.145) | (0.153) | (0.152) | (0.143) | (0.129) | (0.115) | (0.125) | (0.125) | (0.157) | (0.232) | |
| FLOOR | 4.72 *** | 4.84 *** | 5.11 *** | 4.60 *** | 4.40 *** | 3.84 *** | 3.26 *** | 3.86 *** | 3.39 *** | 2.63 * |
| (0.592) | (0.638) | (0.696) | (0.761) | (0.710) | (0.781) | (0.866) | (0.866) | (1.080) | (1.523) | |
| SOUTH | 21.13 *** | 18.86 *** | 14.69 *** | 10.75 * | 7.09 | 6.64 | 7.20 | 4.35 | −1.20 | −6.68 |
| (5.611) | (5.976) | (5.906) | (6.310) | (6.035) | (6.563) | (7.609) | (7.609) | (9.998) | (14.391) | |
| AGE | −14.49 *** | −15.27 *** | −16.20 *** | −17.51 *** | −18.70 *** | −19.76 *** | −21.79 *** | −21.04 *** | −18.15 *** | −22.08 *** |
| (1.599) | (1.531) | (1.578) | (1.545) | (1.428) | (1.676) | (2.161) | (2.161) | (3.021) | (5.282) | |
| AGESQ | 0.27 *** | 0.28 *** | 0.30 *** | 0.32 *** | 0.34 *** | 0.35 *** | 0.37 *** | 0.35 *** | 0.28 *** | 0.34 *** |
| (0.035) | (0.034) | (0.035) | (0.034) | (0.032) | (0.036) | (0.048) | (0.048) | (0.067) | (0.116) | |
| TUNIT | 0.11 *** | 0.10 *** | 0.10 *** | 0.10 *** | 0.10 *** | 0.10 *** | 0.10 *** | 0.09 *** | 0.10 *** | 0.08 *** |
| (0.005) | (0.005) | (0.005) | (0.005) | (0.005) | (0.005) | (0.006) | (0.006) | (0.009) | (0.018) | |
| DGANGNAM | −1.58 *** | −1.26 *** | −1.46 *** | −1.14 *** | −1.11 *** | −0.89 * | −0.56 | 0.82 | 3.13 *** | 4.73 *** |
| (0.454) | (0.437) | (0.428) | (0.430) | (0.413) | (0.495) | (0.734) | (0.734) | (0.888) | (1.073) | |
| DSUBWAY | −23.44 *** | −24.51 *** | −25.21 *** | −25.85 *** | −29.44 *** | −30.43 *** | −32.22 *** | −32.71 *** | −31.61 *** | −30.40 *** |
| (2.087) | (2.009) | (2.205) | (2.442) | (2.237) | (2.533) | (2.569) | (2.569) | (2.768) | (4.211) | |
| DPRIMARY | −12.91 *** | −13.62 *** | −14.47 *** | −16.29 *** | −19.52 *** | −20.28 *** | −21.00 *** | −20.83 *** | −17.16 *** | −12.80 ** |
| (2.500) | (2.199) | (2.109) | (2.198) | (2.056) | (2.349) | (2.316) | (2.316) | (3.518) | (5.255) | |
| DMIDDLE | −9.08 *** | −8.51 *** | −8.11 *** | −7.70 *** | −4.78 ** | −3.69 * | −1.35 | −1.87 | −6.34 * | −12.38 ** |
| (2.308) | (2.249) | (2.223) | (2.238) | (2.060) | (2.234) | (2.602) | (2.602) | (3.712) | (5.232) | |
| SPRING | 9.16 | 6.14 | 8.97 | 5.54 | 11.47 * | 13.62 ** | 15.60 * | 20.90 ** | 21.89 * | 32.60 |
| (6.543) | (6.760) | (6.576) | (6.512) | (6.425) | (6.518) | (8.117) | (8.117) | (11.929) | (20.018) | |
| SUMMER | −4.47 | −6.16 | −3.03 | −5.40 | −1.99 | 4.87 | 5.57 | 3.18 | 2.17 | 8.05 |
| (7.296) | (7.567) | (7.633) | (8.018) | (7.618) | (7.891) | (8.860) | (8.860) | (9.946) | (13.576) | |
| FALL | −5.36 | −10.72 | −9.28 | −10.46 | −2.96 | −1.19 | 7.54 | 2.43 | −1.86 | 8.19 |
| (6.342) | (6.718) | (6.877) | (7.444) | (6.869) | (7.199) | (7.269) | (7.269) | (9.413) | (12.286) |
© 2020 by the authors. Licensee MDPI, Basel, Switzerland. This article is an open access article distributed under the terms and conditions of the Creative Commons Attribution (CC BY) license (http://creativecommons.org/licenses/by/4.0/).
Share and Cite
Lee, H.; Lee, B.; Lee, S. The Unequal Impact of Natural Landscape Views on Housing Prices: Applying Visual Perception Model and Quantile Regression to Apartments in Seoul. Sustainability 2020, 12, 8275. https://doi.org/10.3390/su12198275
Lee H, Lee B, Lee S. The Unequal Impact of Natural Landscape Views on Housing Prices: Applying Visual Perception Model and Quantile Regression to Apartments in Seoul. Sustainability. 2020; 12(19):8275. https://doi.org/10.3390/su12198275
Chicago/Turabian StyleLee, Hyejin, Byoungkil Lee, and Sangkyeong Lee. 2020. "The Unequal Impact of Natural Landscape Views on Housing Prices: Applying Visual Perception Model and Quantile Regression to Apartments in Seoul" Sustainability 12, no. 19: 8275. https://doi.org/10.3390/su12198275
APA StyleLee, H., Lee, B., & Lee, S. (2020). The Unequal Impact of Natural Landscape Views on Housing Prices: Applying Visual Perception Model and Quantile Regression to Apartments in Seoul. Sustainability, 12(19), 8275. https://doi.org/10.3390/su12198275