Sustainable Transport: An Efficient Transportation Network—Case Study


Abstract
1. Introduction
2. Literature Review
- Reduced travel needs
- Transport policy shift
- Distance reduction
- Technological innovation that would increase efficiency [14].
3. Materials and Methods
4. Results and Discussion
4.1. Examples of Model Transport Networks
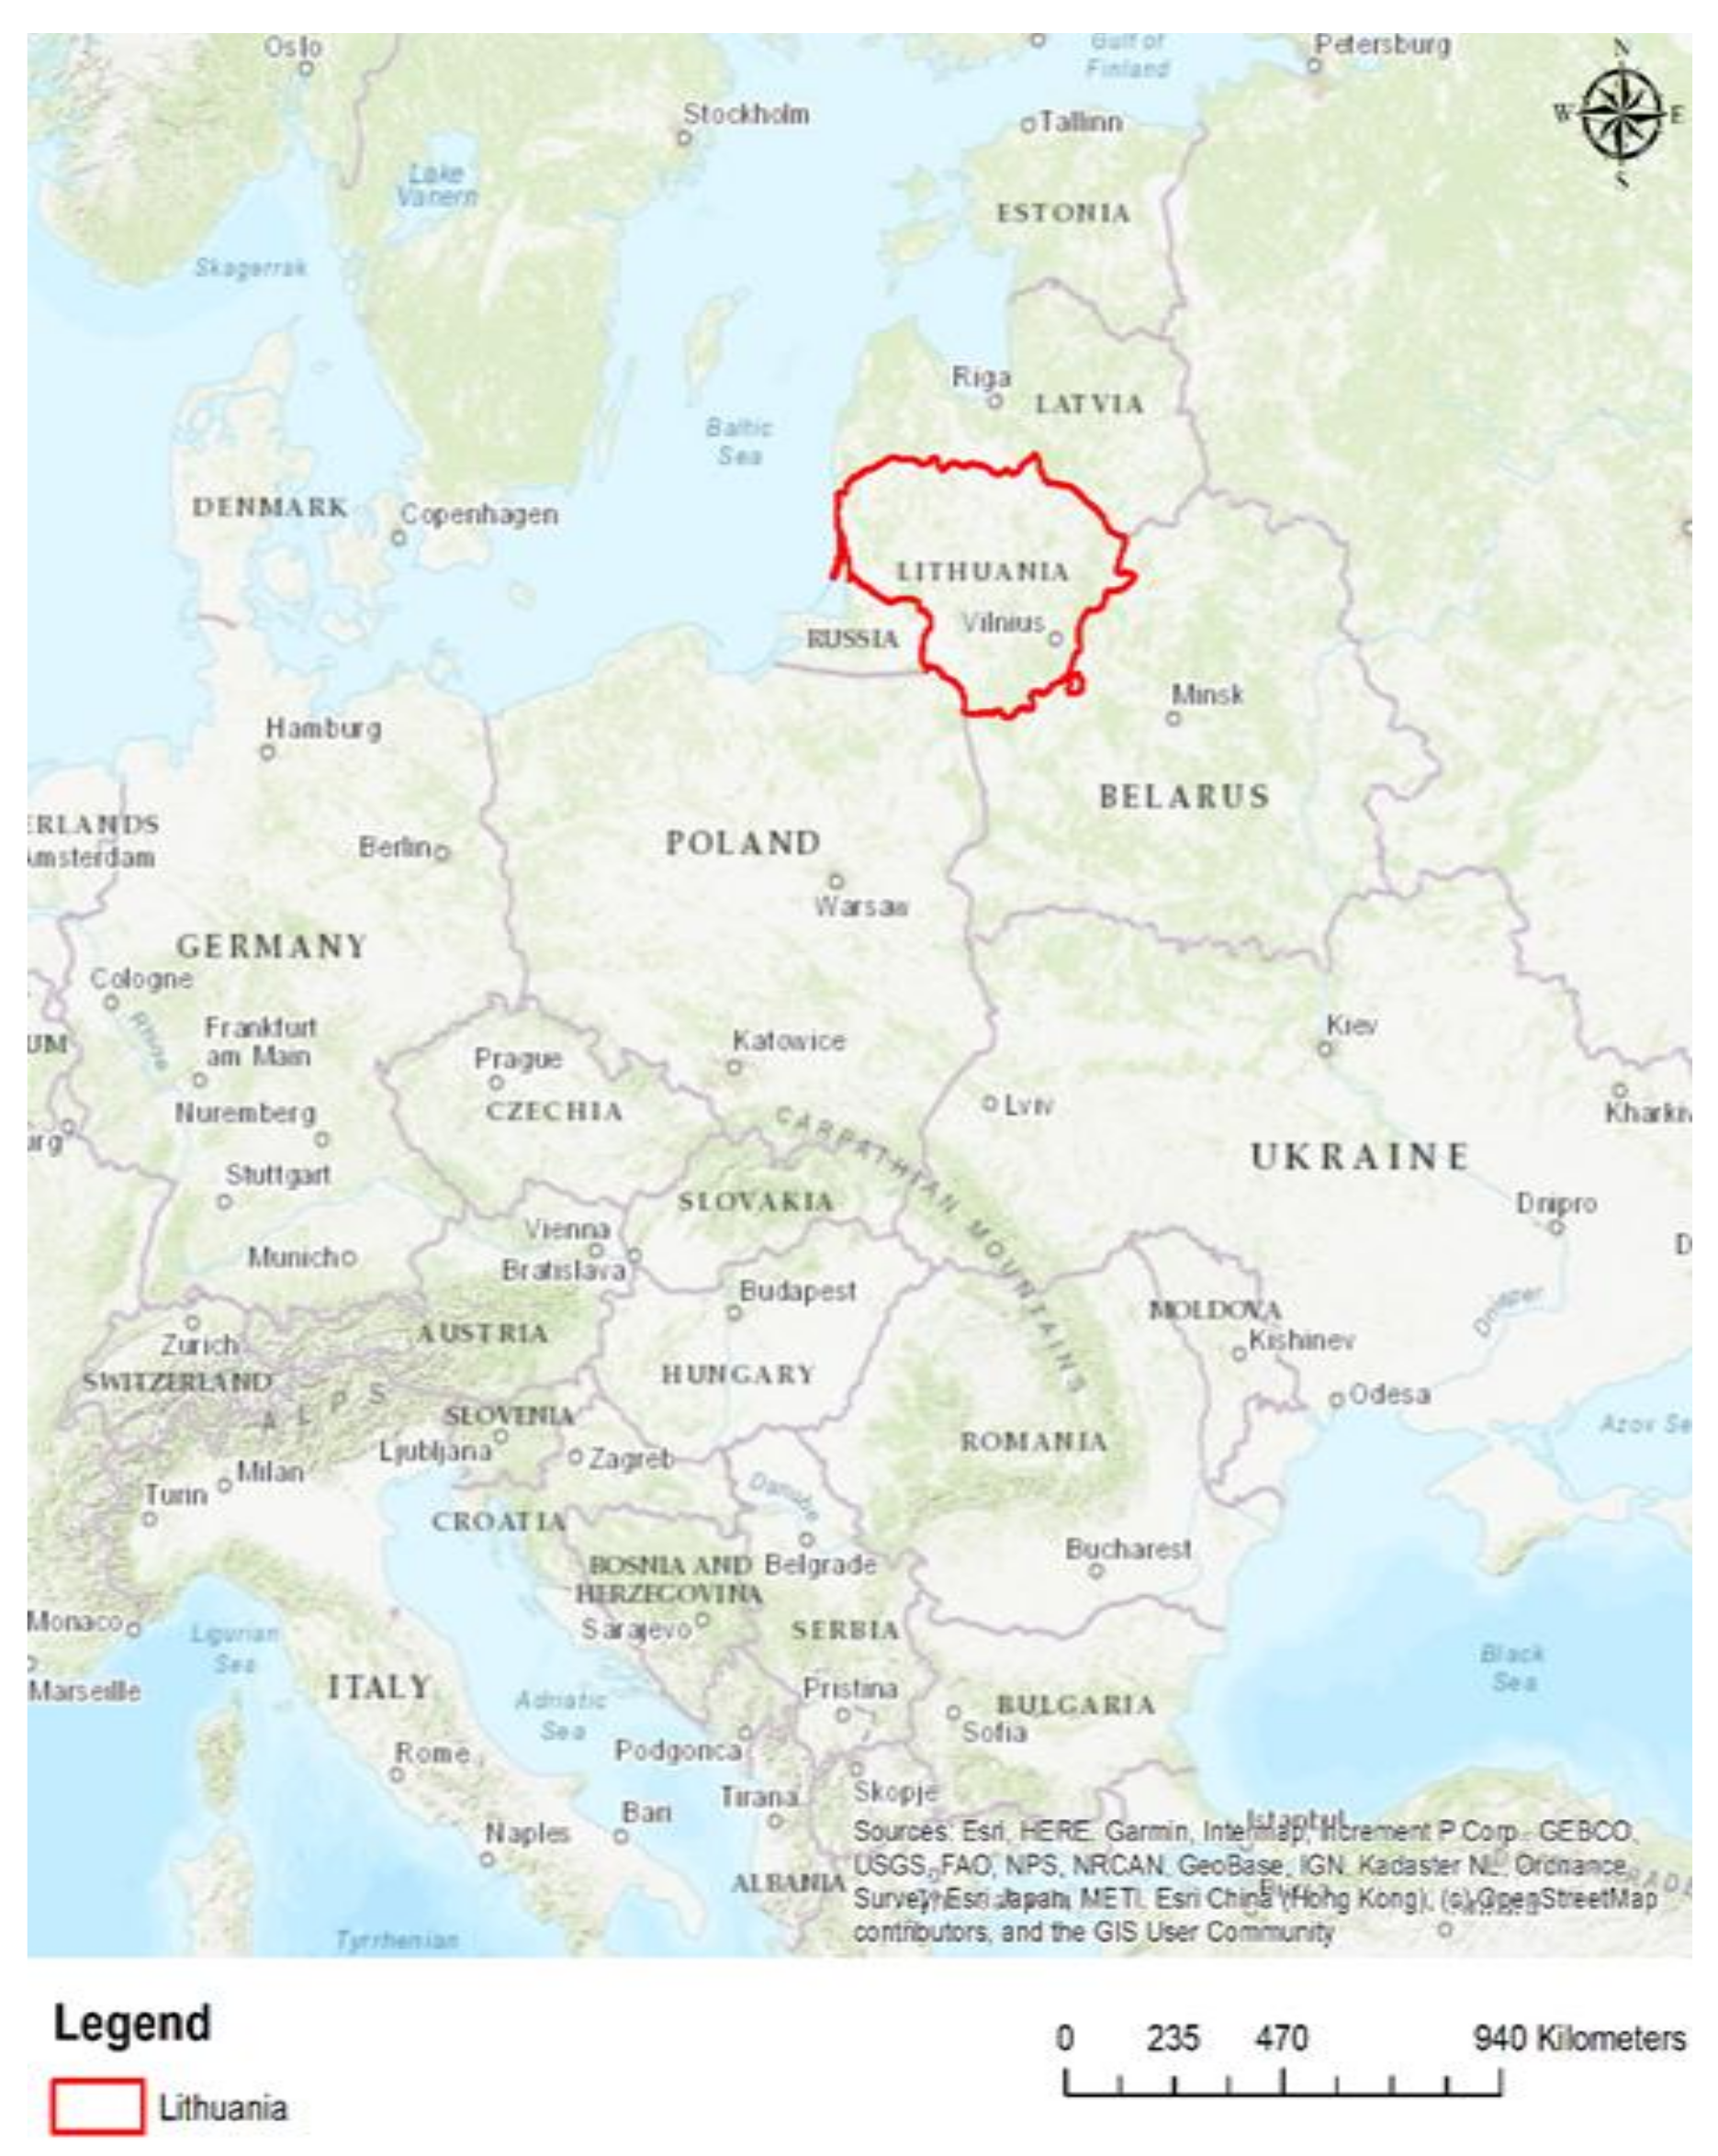
4.2. Transport in Vilnius
4.3. Sustainable Transport Solutions for Vilnius
5. Conclusions
Author Contributions
Funding
Conflicts of Interest
References
- UNESCAP. Gender and Transport; Report Congestion Combatting No. 76, No.82; Economic and Social Commission for Asia and the Pacific Transport and Communications Bulletin for Asia and the Pacific: Bangkok, Thailand, 2013. [Google Scholar]
- Greene, D.L.; Wegener, M. Sustainable transport. J. Transp. Geogr. 1997, 5, 177–190. [Google Scholar] [CrossRef]
- De Gruyter, C.; Currie, G.; Rose, G. Sustainability measures of urban public transport in cities: A world review and focus on the Asia/Middle East Region. Sustainability 2017, 9, 43. [Google Scholar] [CrossRef]
- Richardson, B.C. Sustainable transport: Analysis frameworks. J. Transp. Geogr. 2005, 13, 29–39. [Google Scholar] [CrossRef]
- Ogryzek, M.; Wisniewski, R.; Kauko, T. On Spatial Management Practices: Revisiting the «optimal» Use of Urban Land. Real Estate Manag. Valuat. 2018. [Google Scholar] [CrossRef]
- Miller, P.; de Barros, A.G.; Kattan, L.; Wirasinghe, S.C. Public transportation and sustainability: A review. KSCE J. Civ. Eng. 2016, 20, 1076–1083. [Google Scholar] [CrossRef]
- Wolny, A.; Ogryzek, M.; Źróbek, R. Towards Sustainable Development and Preventing Exclusions—Determining Road Accessibility at the Sub-Regional and Local Level in Rural Areas of Poland. Sustainability 2019, 11, 4880. [Google Scholar] [CrossRef]
- Griskeviciute-Geciene, A.; Griškevičiene, D. The Influence of Transport Infrastructure Development on Sustainable Living Environment in Lithuania. Procedia Eng. 2016, 134, 215–223. [Google Scholar] [CrossRef]
- Linneker, B.J.; Spence, N.A. An Accessibility Analysis of the Impact of the M25 London Orbital Motorway on Britain. Reg. Stud. 1992, 26, 31–47. [Google Scholar] [CrossRef]
- Taylor, M.A.P.; Sekhar, S.V.C.; D’Este, G.M. Application of accessibility based methods for vulnerability analysis of strategic road networks. Netw. Spat. Econ. 2006, 6, 267–291. [Google Scholar] [CrossRef]
- López, E.; Gutiérrez, J.; Gómez, G. Measuring regional cohesion effects of large-scale transport infrastructure investments: An accessibility approach. Eur. Plan. Stud. 2008, 16, 277–301. [Google Scholar] [CrossRef]
- Marks-Bielska, R.; Kurowska, K. Institutional Efficiency of Communes in Poland in Respect of Space Management. In Proceedings of the International Multidisciplinary Scientific GeoConference Surveying Geology and Mining Ecology Management, SGEM, Albena, Bulgaria, 29 June–5 July 2017. [Google Scholar]
- Oliveira, E. Land Ownership and Land Use Development: The Integration of Past, Present, and Future in Spatial Planning and Land Management Policies. Landsc. J. 2017. [Google Scholar] [CrossRef]
- Banister, D. The sustainable mobility paradigm. Transp. Policy 2008, 15, 73–80. [Google Scholar] [CrossRef]
- Tolley, R. Sustainable Transport, 1st ed.; Elsevier: Amsterdam, The Netherlands, 2003; ISBN 9781855736146. [Google Scholar]
- Steg, L.; Gifford, R. Sustainable transportation and quality of life. J. Transp. Geogr. 2005. [Google Scholar] [CrossRef]
- Valiantis, M. Sustainable urban transport. In Sustainability behind Sustainability; Nova Science: Hauppauge, NY, USA, 2014; ISBN 9781633215955. [Google Scholar]
- Roth, A.; Kåberger, T. Making transport systems sustainable. J. Clean. Prod. 2002. [Google Scholar] [CrossRef]
- Kowalczyk, C.; Kil, J.; Kurowska, K. Dynamics of development of the largest cities—Evidence from Poland. Cities 2019, 89, 26–34. [Google Scholar] [CrossRef]
- Pucher, J.; Buehler, R. Cycling towards a more sustainable transport future. Transp. Rev. 2017, 37, 689–694. [Google Scholar] [CrossRef]
- Ogryzek, M.; Klimach, A.; Niekurzak, D.; Pietkiewicz, M. Using cartographic documents to provide geoinformation on the rights to real estate—Taking Poland as an example. ISPRS Int. J. Geo-Inf. 2019, 8, 530. [Google Scholar] [CrossRef]
- Kowalczyk, C. Dynamics of Changes in the Urban Space. In Proceedings of the 9th International Conference on Environmental Engineering, ICEE 2014, Vilnius, Lithuania, 22–24 May 2014. [Google Scholar]
- Litman, T. Sustainable Transportation Indicators: A Recommended Research Program for Developing Sustainable Transportation Indicators and Data. In Proceedings of the Transportation Research Board, Washington, DC, USA, 11–15 January 2009. [Google Scholar]
- Livingstone, K.; Rogers, R. Housing for a Compact City; Greater London Authority: London, UK, 2003.
- Goldman, T.; Gorham, R. Sustainable urban transport: Four innovative directions. Technol. Soc. 2006, 28, 261–273. [Google Scholar] [CrossRef]
- O’Brien, O.; Cheshire, J.; Batty, M. Mining bicycle sharing data for generating insights into sustainable transport systems. J. Transp. Geogr. 2014. [Google Scholar] [CrossRef]
- Badland, H.; Hickey, S.; Bull, F.; Giles-Corti, B. Public transport access and availability in the RESIDE study: Is it taking us where we want to go? J. Transp. Health 2014, 1, 45–49. [Google Scholar] [CrossRef]
- Schneider, R.J. Theory of routine mode choice decisions: An operational framework to increase sustainable transportation. Transp. Policy 2013. [Google Scholar] [CrossRef]
- Zhang, L.; Zhang, J.; Duan, Z.Y.; Bryde, D. Sustainable bike-sharing systems: Characteristics and commonalities across cases in urban China. J. Clean. Prod. 2015. [Google Scholar] [CrossRef]
- Ogryzek, M. NoSustainable transport as a tool for the implementation of stable communication development. In Some Aspects of the Warmia-Mazury Road Safety System; Chmieliński, B., Żukowska, J., Eds.; Publisher UWM: Olsztyn, Poland, 2017. [Google Scholar]
- Chapman, L. Transport and climate change: A review. J. Transp. Geogr. 2007. [Google Scholar] [CrossRef]
- Leung, D.Y.C.; Caramanna, G.; Maroto-Valer, M.M. An overview of current status of carbon dioxide capture and storage technologies. Renew. Sustain. Energy Rev. 2014, 39, 426–443. [Google Scholar] [CrossRef]
- Fallahpour, A.; Udoncy Olugu, E.; Nurmaya Musa, S.; Yew Wong, K.; Noori, S. A decision support model for sustainable supplier selection in sustainable supply chain management. Comput. Ind. Eng. 2017. [Google Scholar] [CrossRef]
- Luthra, S.; Govindan, K.; Kannan, D.; Mangla, S.K.; Garg, C.P. An integrated framework for sustainable supplier selection and evaluation in supply chains. J. Clean. Prod. 2017. [Google Scholar] [CrossRef]
- Kenworthy, J.R. The eco-city: Ten key transport and planning dimensions for sustainable city development. Environ. Urban 2006. [Google Scholar] [CrossRef]
- Gössling, S. Urban transport transitions: Copenhagen, city of cyclists. J. Transp. Geogr. 2013. [Google Scholar] [CrossRef]
- Köhler, J. Globalization and Sustainable Development: Case Study on International Transport and Sustainable Development. J. Environ. Dev. 2014, 23, 66–100. [Google Scholar] [CrossRef]
- Pojani, D.; Stead, D. Sustainable urban transport in the developing world: Beyond megacities. Sustainability 2015, 7, 7784. [Google Scholar] [CrossRef]
- Hickman, R.; Hall, P.; Banister, D. Planning more for sustainable mobility. J. Transp. Geogr. 2013. [Google Scholar] [CrossRef]
- Bamwesigye, D.; Hlavackova, P. Analysis of sustainable transport for smart cities. Sustainability 2019, 11, 2140. [Google Scholar] [CrossRef]
- Malasek, J. ScienceDirect A set of tools for making urban transport more sustainable. Transp. Res. Procedia 2016, 14, 876–885. [Google Scholar] [CrossRef]
- Loidl, M.; Wallentin, G.; Cyganski, R.; Graser, A.; Scholz, J.; Haslauer, E. GIS and transport modeling-strengthening the spatial perspective. ISPRS Int. J. Geo-Infor. 2016, 5, 84. [Google Scholar] [CrossRef]
- Ogryzek, M.; Ciski, M. Cartographic Methods of Presentation the Average Transaction Prices of the Undeveloped Land. Civ. Environ. Eng. Rep. 2018. [Google Scholar] [CrossRef]
- Gardner, M. Fractal Music, Hypercards, and More…: Mathematical Recreations from Scientific American; W.H. Freeman & Co.: New York, NY, USA, 1992. [Google Scholar]
- Derrible, S.; Kennedy, C. Applications of graph theory and network science to transit network design. Transp. Rev. 2011. [Google Scholar] [CrossRef]
- Mattsson, L.G.; Jenelius, E. Vulnerability and resilience of transport systems—A discussion of recent research. Transp. Res. Part A Policy Pract. 2015. [Google Scholar] [CrossRef]
- Rodrigue, J.-P.; Comtois, C.; Slack, B. Graph theory: Measures and indices. In The Geography of Transport Systems, 4th ed.; Routledge: London, UK, 2013. [Google Scholar]
- Kininmonth, S.J.; De’ath, G.; Possingham, H.P. Graph theoretic topology of the Great but small Barrier Reef world. Theor. Ecol. 2010. [Google Scholar] [CrossRef]
- Tovar, B.; Hernández, R.; Rodríguez-Déniz, H. Container port competitiveness and connectivity: The Canary Islands main ports case. Transp. Policy 2015. [Google Scholar] [CrossRef]
- Tsekeris, T.; Souliotou, A.Z. Graph-theoretic evaluation support tool for fixed-route transport development in metropolitan areas. Transp. Policy 2014. [Google Scholar] [CrossRef]
- Patarasuk, R. Road network connectivity and land-cover dynamics in Lop Buri province, Thailand. J. Transp. Geogr. 2013. [Google Scholar] [CrossRef]
- Etherington, T.R. Mapping organism spread potential by integrating dispersal and transportation processes using graph theory and catchment areas. Int. J. Geogr. Inf. Sci. 2012. [Google Scholar] [CrossRef]
- Sadavare, A.B.; Kulkarni, R.V. A Review of Application of Graph Theory for Network. Int. J. Comput. Sci. Inf. Technol. 2012. [Google Scholar]
- Torslov, N. Traffic in Copenhagen 2009; Copenhagen Traffic Department: Copenhagen, Denmark, 2010. [Google Scholar]
- The City of Copenhagen. Copenhagen’s Green Accounts; The City of Copenhagen: Copenhagen, Denmark, 2010.
- The City of Copenhagen. City of Cyclists—Copenhagen Bicycle Life; City of Copenhagen: Copenhagen, Denmark, 2009.
- Transport for London. Travel in London Report; Transport for London: London, UK, 2013.
- Britton, E.; Gant, R.; Matthews, B. World Transport Policy & Practice World Transport Policy & Practice. World Transp. Policy Pract. 2002, 2, 6–27. [Google Scholar]
- Hamilton-Baillie, B. Urban design: Why don’t we do it in the road? Modifying traffic behavior through legible urban design. J. Urban Technol. 2004, 11, 43–62. [Google Scholar] [CrossRef]
- Jäppinen, S.; Toivonen, T.; Salonen, M. Modelling the potential effect of shared bicycles on public transport travel times in Greater Helsinki: An open data approach. Appl. Geogr. 2013. [Google Scholar] [CrossRef]
- Bachand-Marleau, J.; Lee, B.; El-Geneidy, A. Better understanding of factors influencing likelihood of using shared bicycle systems and frequency of use. Transp. Res. Rec. 2012. [Google Scholar] [CrossRef]
- Kennedy, C.; Miller, E.; Shalaby, A.; MacLean, H.; Coleman, J. The four pillars of sustainable urban transportation. Transp. Rev. 2005. [Google Scholar] [CrossRef]
- Taniguchi, E. Concepts of City Logistics for Sustainable and Liveable Cities. Procedia Soc. Behav. Sci. 2014. [Google Scholar] [CrossRef]
- Gössling, S. Urban transport justice. J. Transp. Geogr. 2016. [Google Scholar] [CrossRef]
- Cullinae, K.; Cosgrove, T. Smarter Travel in Six European Cities; University of Limerick: Limerick, Ireland, 2010. [Google Scholar]
- Tanczos, K.; Torok, A. Linear optimization model of urban areas’ operating efficiency. Transport 2007, 22, 225–228. [Google Scholar] [CrossRef][Green Version]
- Turskis, Z.; Zavadskas, E.K.; Zagorskas, J. Sustainable City Compactness Evaluation on the Basis of Gis and Bayes Rule. Int. J. Strateg. Prop. Manag. 2006, 10, 185–207. [Google Scholar] [CrossRef]
- Jakimavičius, M.; Burinskiene, M. Susisiekimo sistemos analizė ir rangavimas vilniaus miesto transporto rajonuose naudojant gis. Technol. Econ. Dev. Econ. 2009, 15, 39–48. [Google Scholar] [CrossRef]
- Bogart, W.T.; Ferry, W.C.; Bogart, W.T.; Ferry, W.C. Employment Centres in Greater Cleveland: Evidence of Evolution in a Formerly Monocentric City. Urban Stud. 1999, 36, 2099–2110. [Google Scholar] [CrossRef]
- Jakimavičius, M.; Burinskiene, M. Assessment of Vilnius city development scenarios based on transport system modelling and multicriteria analysis. J. Civ. Eng. Manag. 2009, 15, 361–368. [Google Scholar] [CrossRef]
- Abukauskas, N.; Sivilevičius, H.; Puodžiukas, V.; Lingyte, I. Road safety improvement on at-grade intersections. Balt. J. Road Bridg. Eng. 2013, 8, 212–219. [Google Scholar] [CrossRef]
- Klibavičius, A.; Paliulis, G.M. Increasing the capacity of intersections by short traffic lanes. Transport 2012, 27, 67–72. [Google Scholar] [CrossRef]
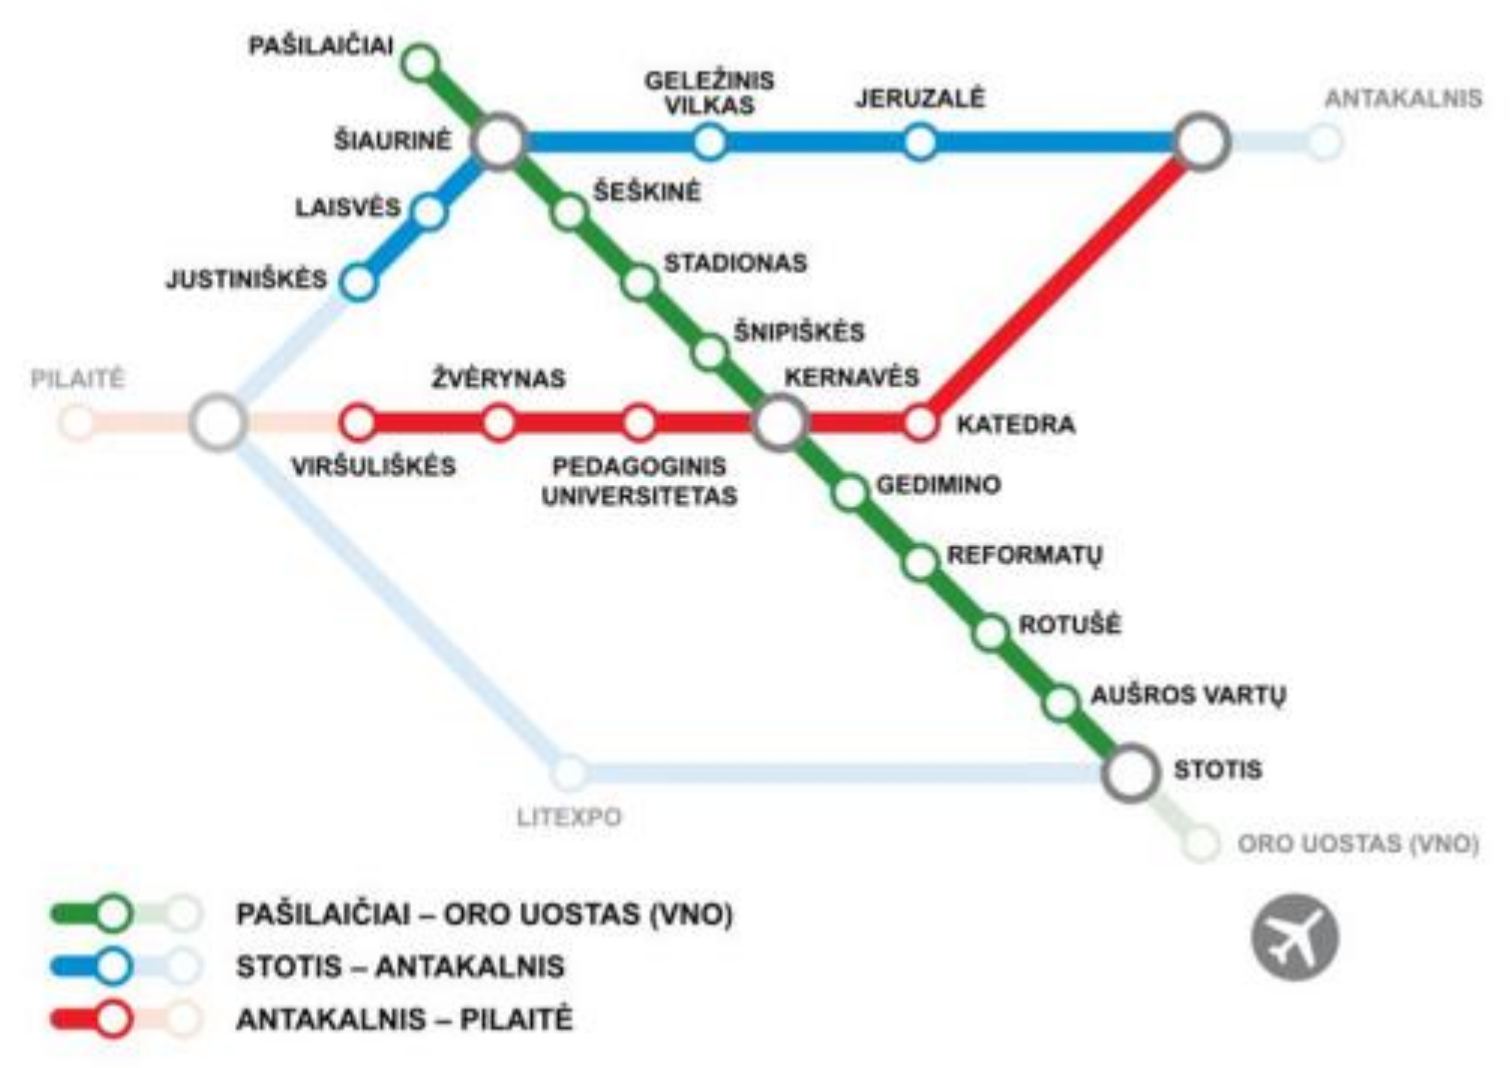
- Vilnius Metro. Available online: www.vilniausmetro.lt (accessed on 4 October 2020).
- Wolny, A.; Ogryzek, M.; Źróbek, R. Challenges, Opportunities and Barriers to Sustainable Transport Development in Functional Urban Areas. In Proceedings of the 10th International Conference on Environmental Engineering, ICEE 2017, Vilnius, Lithuania, 27–28 April 2017. [Google Scholar]


| The Coventional Approach (Transport Planning and Engineering) | An Alternative Approach (Sustainable Mobility) |
|---|---|
| Physical dimensions | Social dimensions |
| Mobility | Accessibility |
| Traffic focus, particularly on the car | People focus, either in (or on) a vehicle or on foot |
| Large in scale | Local in scale |
| Street as a road | Street as a space |
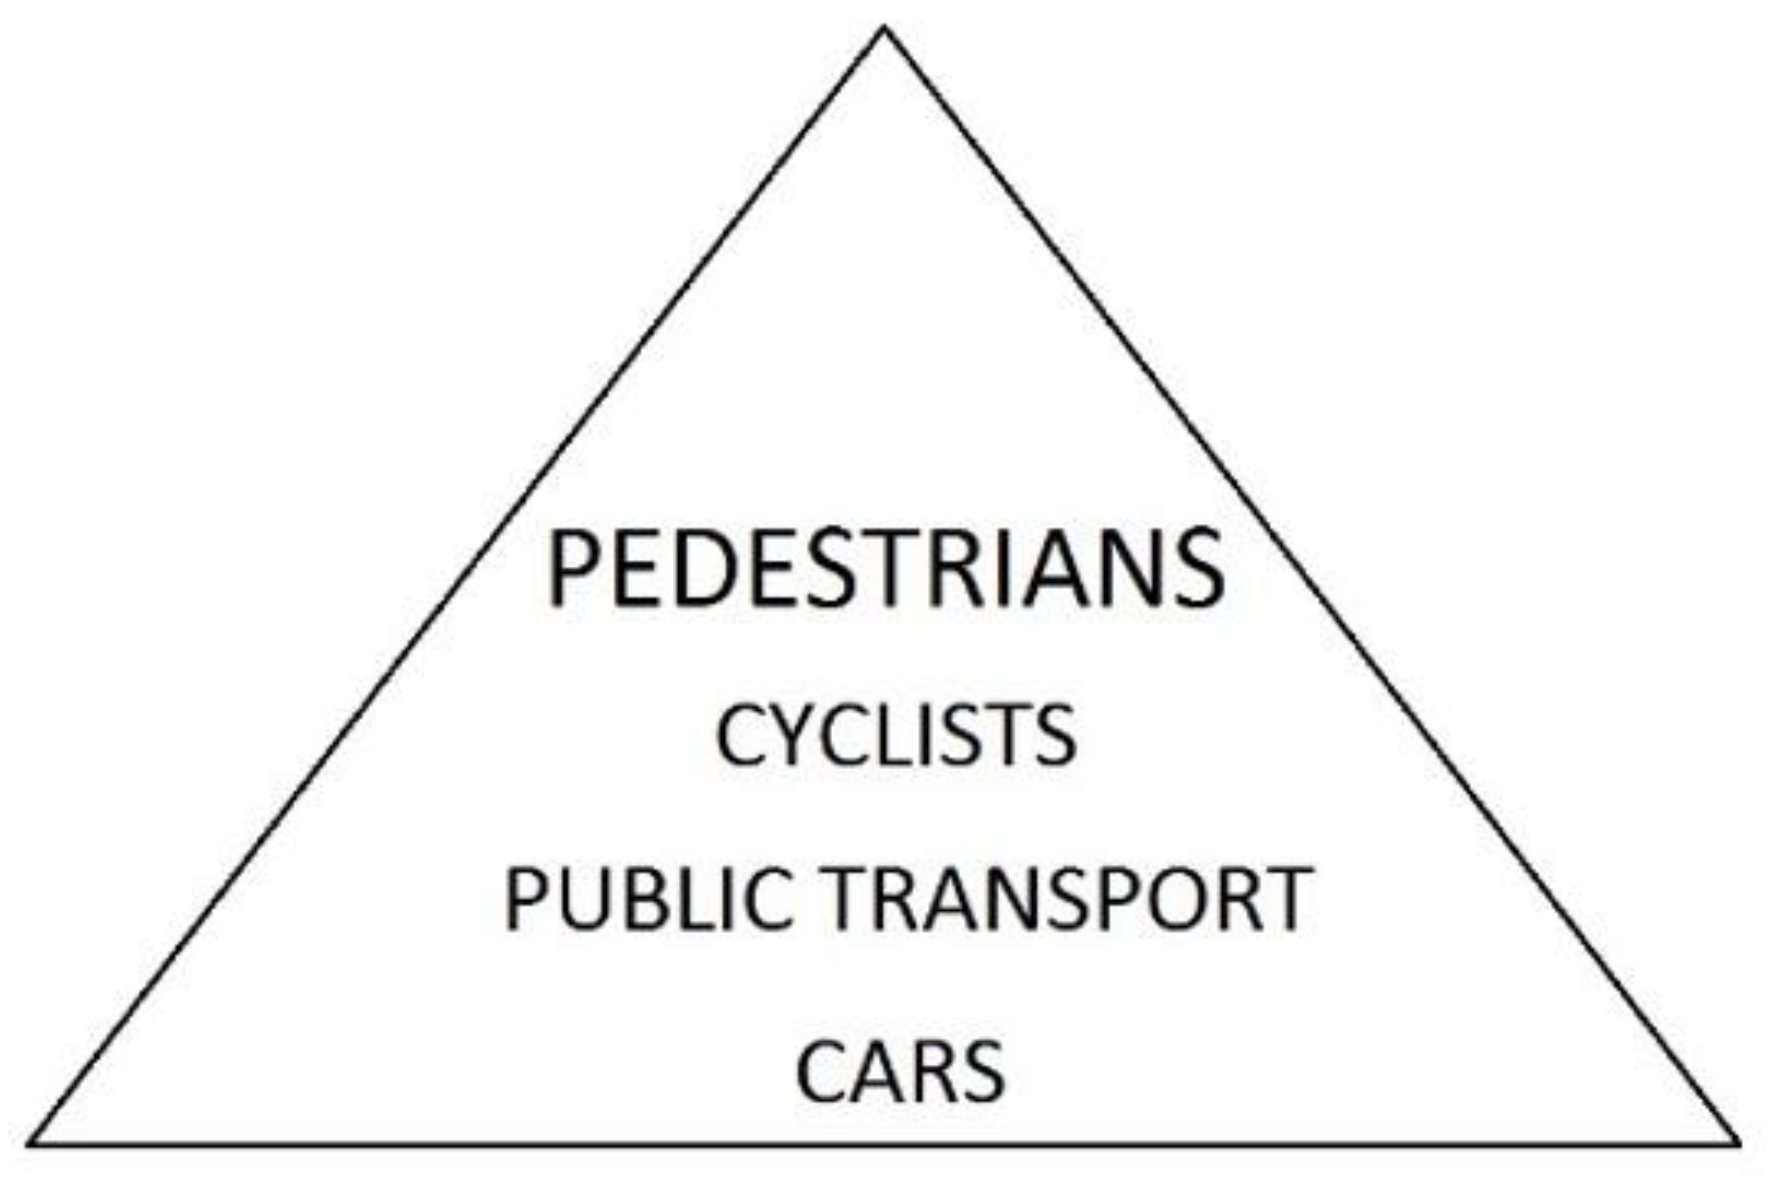
| Motorized transport | All modes of transport often in a hierarchy with pedestrians and cyclists at the top and car users at the bottom |
| Forecasting traffic | Visioning on cities |
| Modeling approaches | Scenario development and modeling |
| Economic evaluation | Multicriteria analysis to take account of environmental and social concerns |
| Travel as a derived demand | Travel as a values activity as well as a derived demand |
| Demand based | Management based |
| Speeding up traffic | Slowing movement down |
| Travel time minimization | Reasonable travel times and travel time reliability |
| Segregation of people and traffic | Integration of people and traffic |
| Indicator | 1999 | 2005 |
|---|---|---|
| Street network density (km/km2) | 1.9 | 2.4 |
| Public transport density (km/km2) | 0.55 | 0.62 |
| Bicycle paths networks density (km/km2) | 0.10 | 0.16 |
| Average traffic flow in peak hours (aut./h) | 1275 | 1521 |
| Percentage of trucks in average flow | 3.4 | 2.4 |
| Average speed in peek traffic flow (km/h) | 37.5 | 29.3 |
| Modal split | ||
| -pedestrian trips % | 31.3 | 34.8 |
| -trips by bicycles % | 0.3 | 0.3 |
| -trips by public transport % | 45.4 | 34.2 |
| -trips by car % | 23.0 | 30.7 |
| Maximum number of public transport passengers in peak hours | 5300 | 3600 |
| Transit of trucks in peak hours % | 21.3 | 13.2 |
| Number of traffic accidents for 1000 inhabitants | 1.07 | 1.77 |
© 2020 by the authors. Licensee MDPI, Basel, Switzerland. This article is an open access article distributed under the terms and conditions of the Creative Commons Attribution (CC BY) license (http://creativecommons.org/licenses/by/4.0/).
Share and Cite
Ogryzek, M.; Adamska-Kmieć, D.; Klimach, A. Sustainable Transport: An Efficient Transportation Network—Case Study. Sustainability 2020, 12, 8274. https://doi.org/10.3390/su12198274
Ogryzek M, Adamska-Kmieć D, Klimach A. Sustainable Transport: An Efficient Transportation Network—Case Study. Sustainability. 2020; 12(19):8274. https://doi.org/10.3390/su12198274
Chicago/Turabian StyleOgryzek, Marek, Daria Adamska-Kmieć, and Anna Klimach. 2020. "Sustainable Transport: An Efficient Transportation Network—Case Study" Sustainability 12, no. 19: 8274. https://doi.org/10.3390/su12198274
APA StyleOgryzek, M., Adamska-Kmieć, D., & Klimach, A. (2020). Sustainable Transport: An Efficient Transportation Network—Case Study. Sustainability, 12(19), 8274. https://doi.org/10.3390/su12198274