Shifting to Shared Wheels: Factors Affecting Dockless Bike-Sharing Choice for Short and Long Trips

 ,
,  ,
,  and
and
Abstract
1. Introduction
Literature Review
- How likely are users with an existing mode choice behavior to shift to a BSS? Does this differentiate among the users with different mode choice?
- Does and to what extent trip duration affect the probability of choosing a BSS? Should urban transport planning policy be reformulated/adapted to the new challenges?
- Which individual factors affect the willingness to choose the BSS in favor of currently preferred (and competitive) modes of transport and in what way?
2. Materials and Methods
2.1. Case Study Area
2.2. Methodology
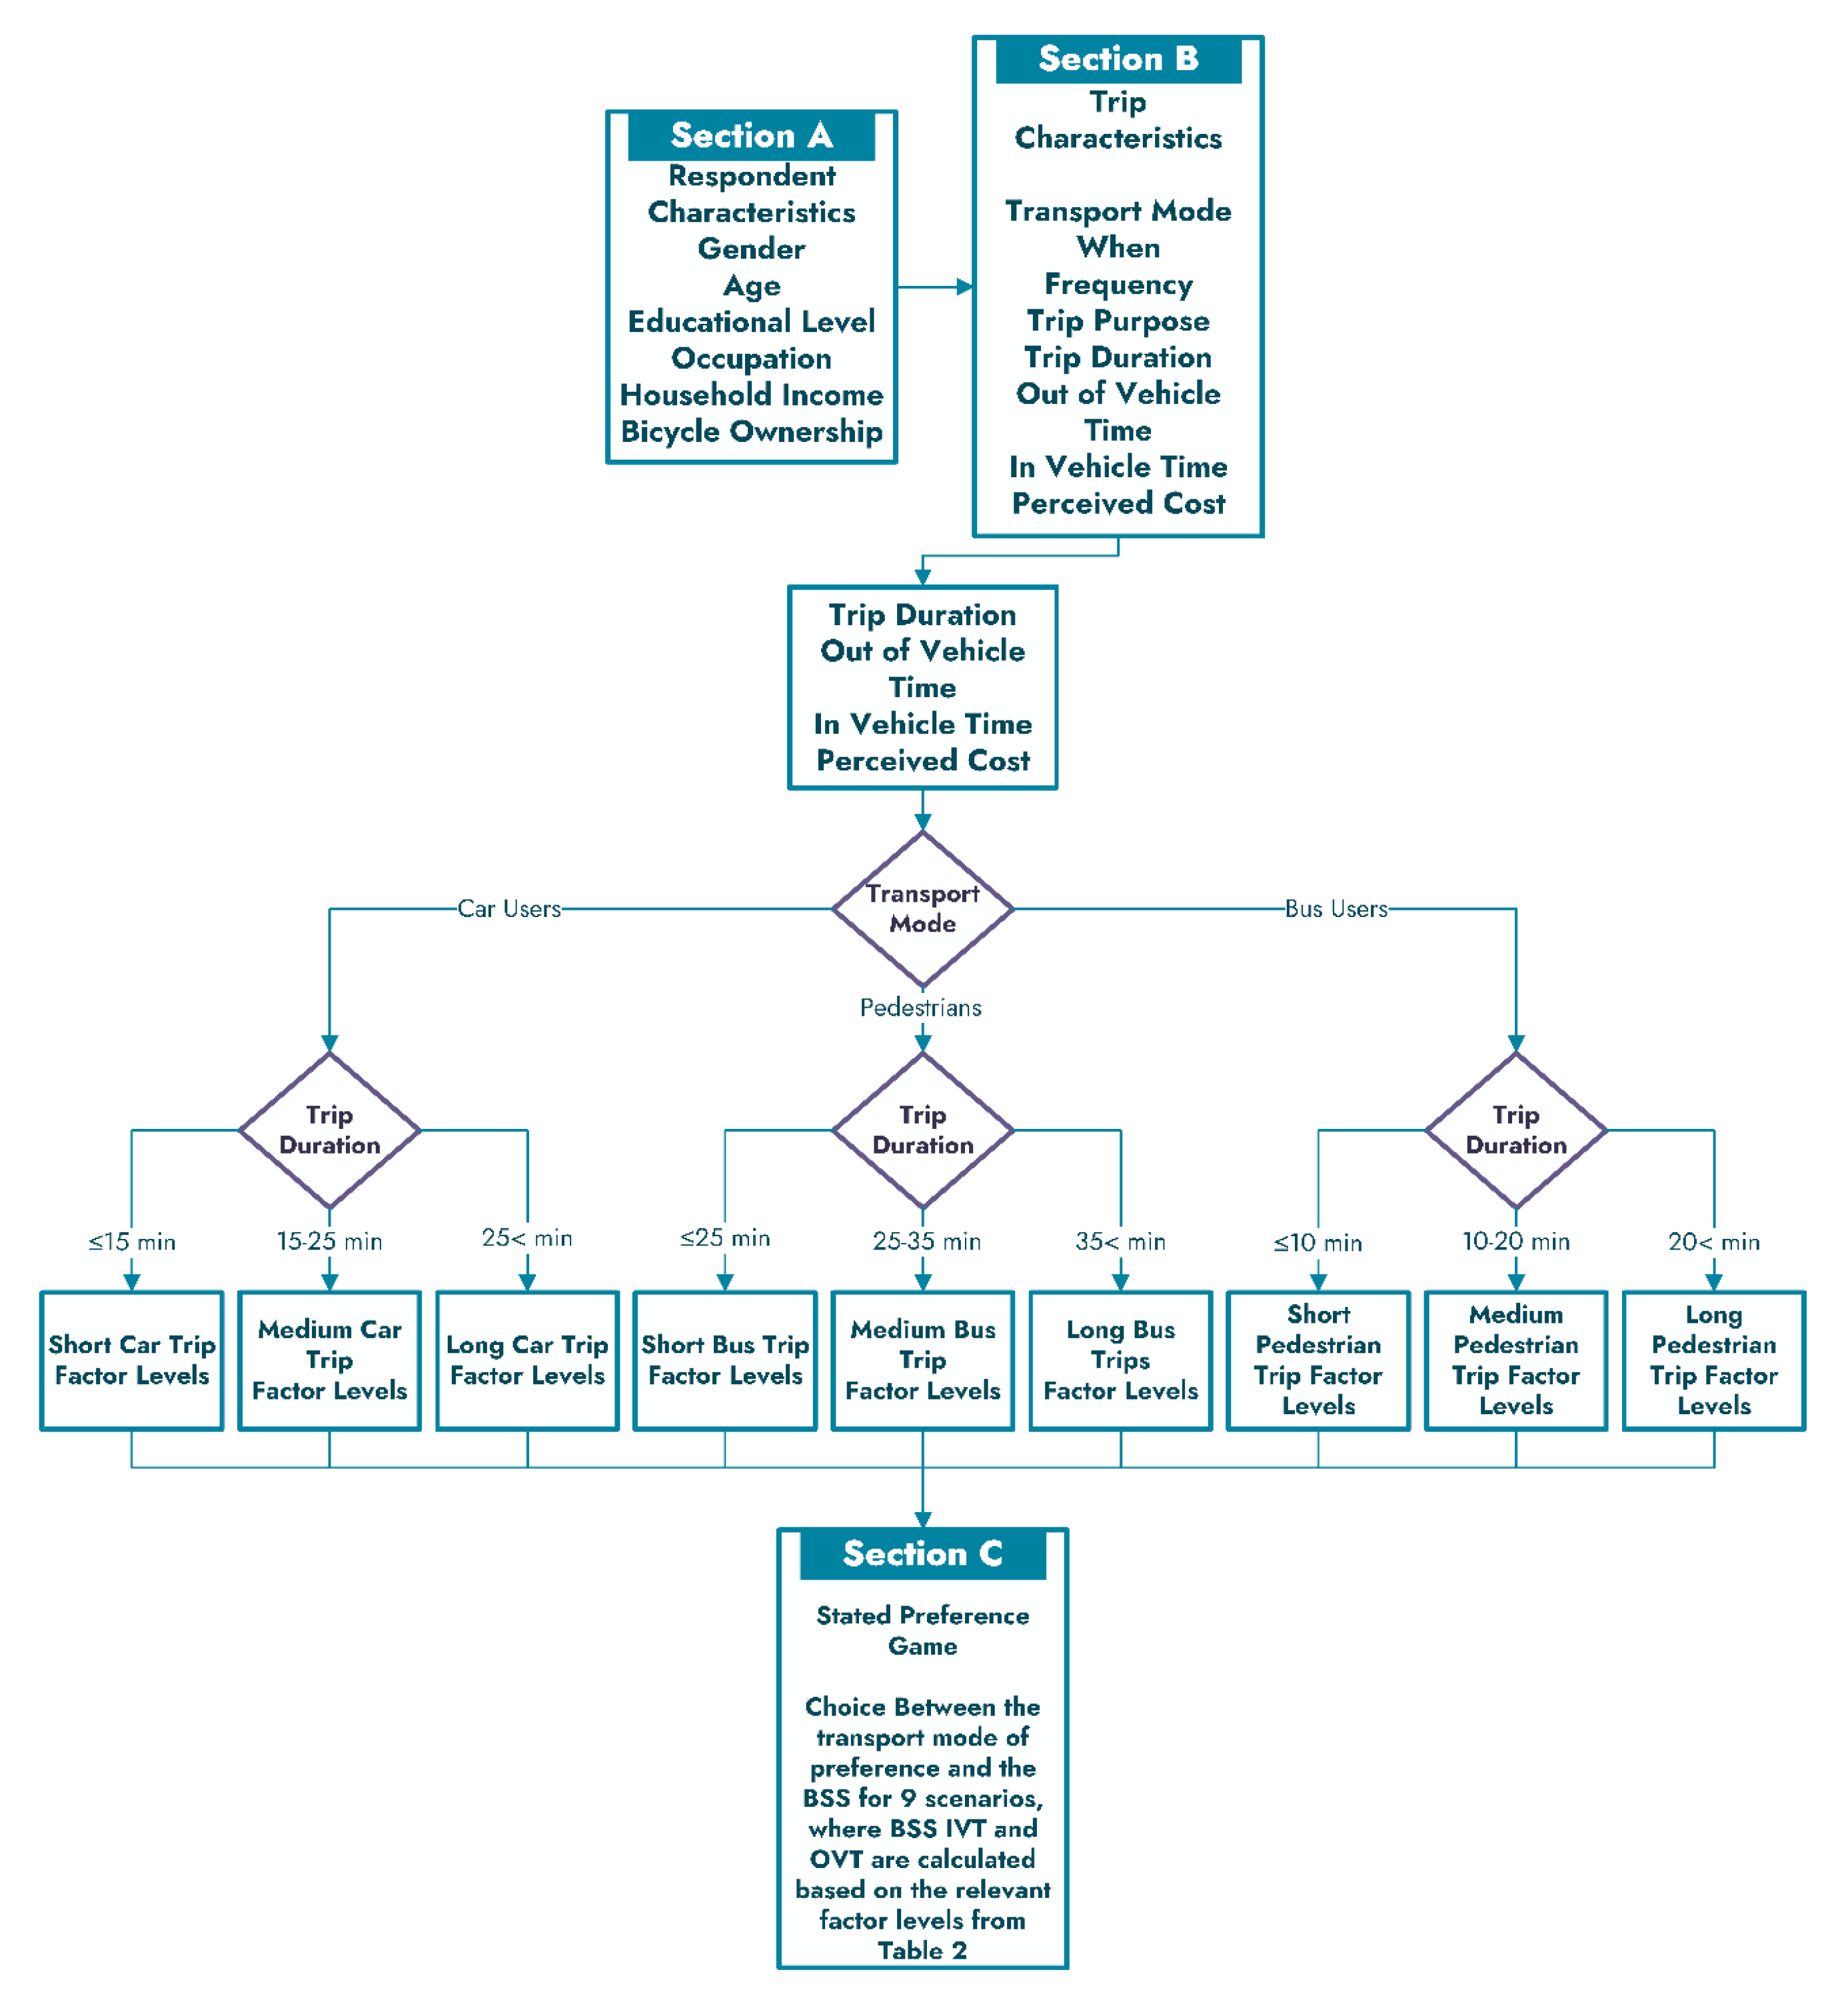
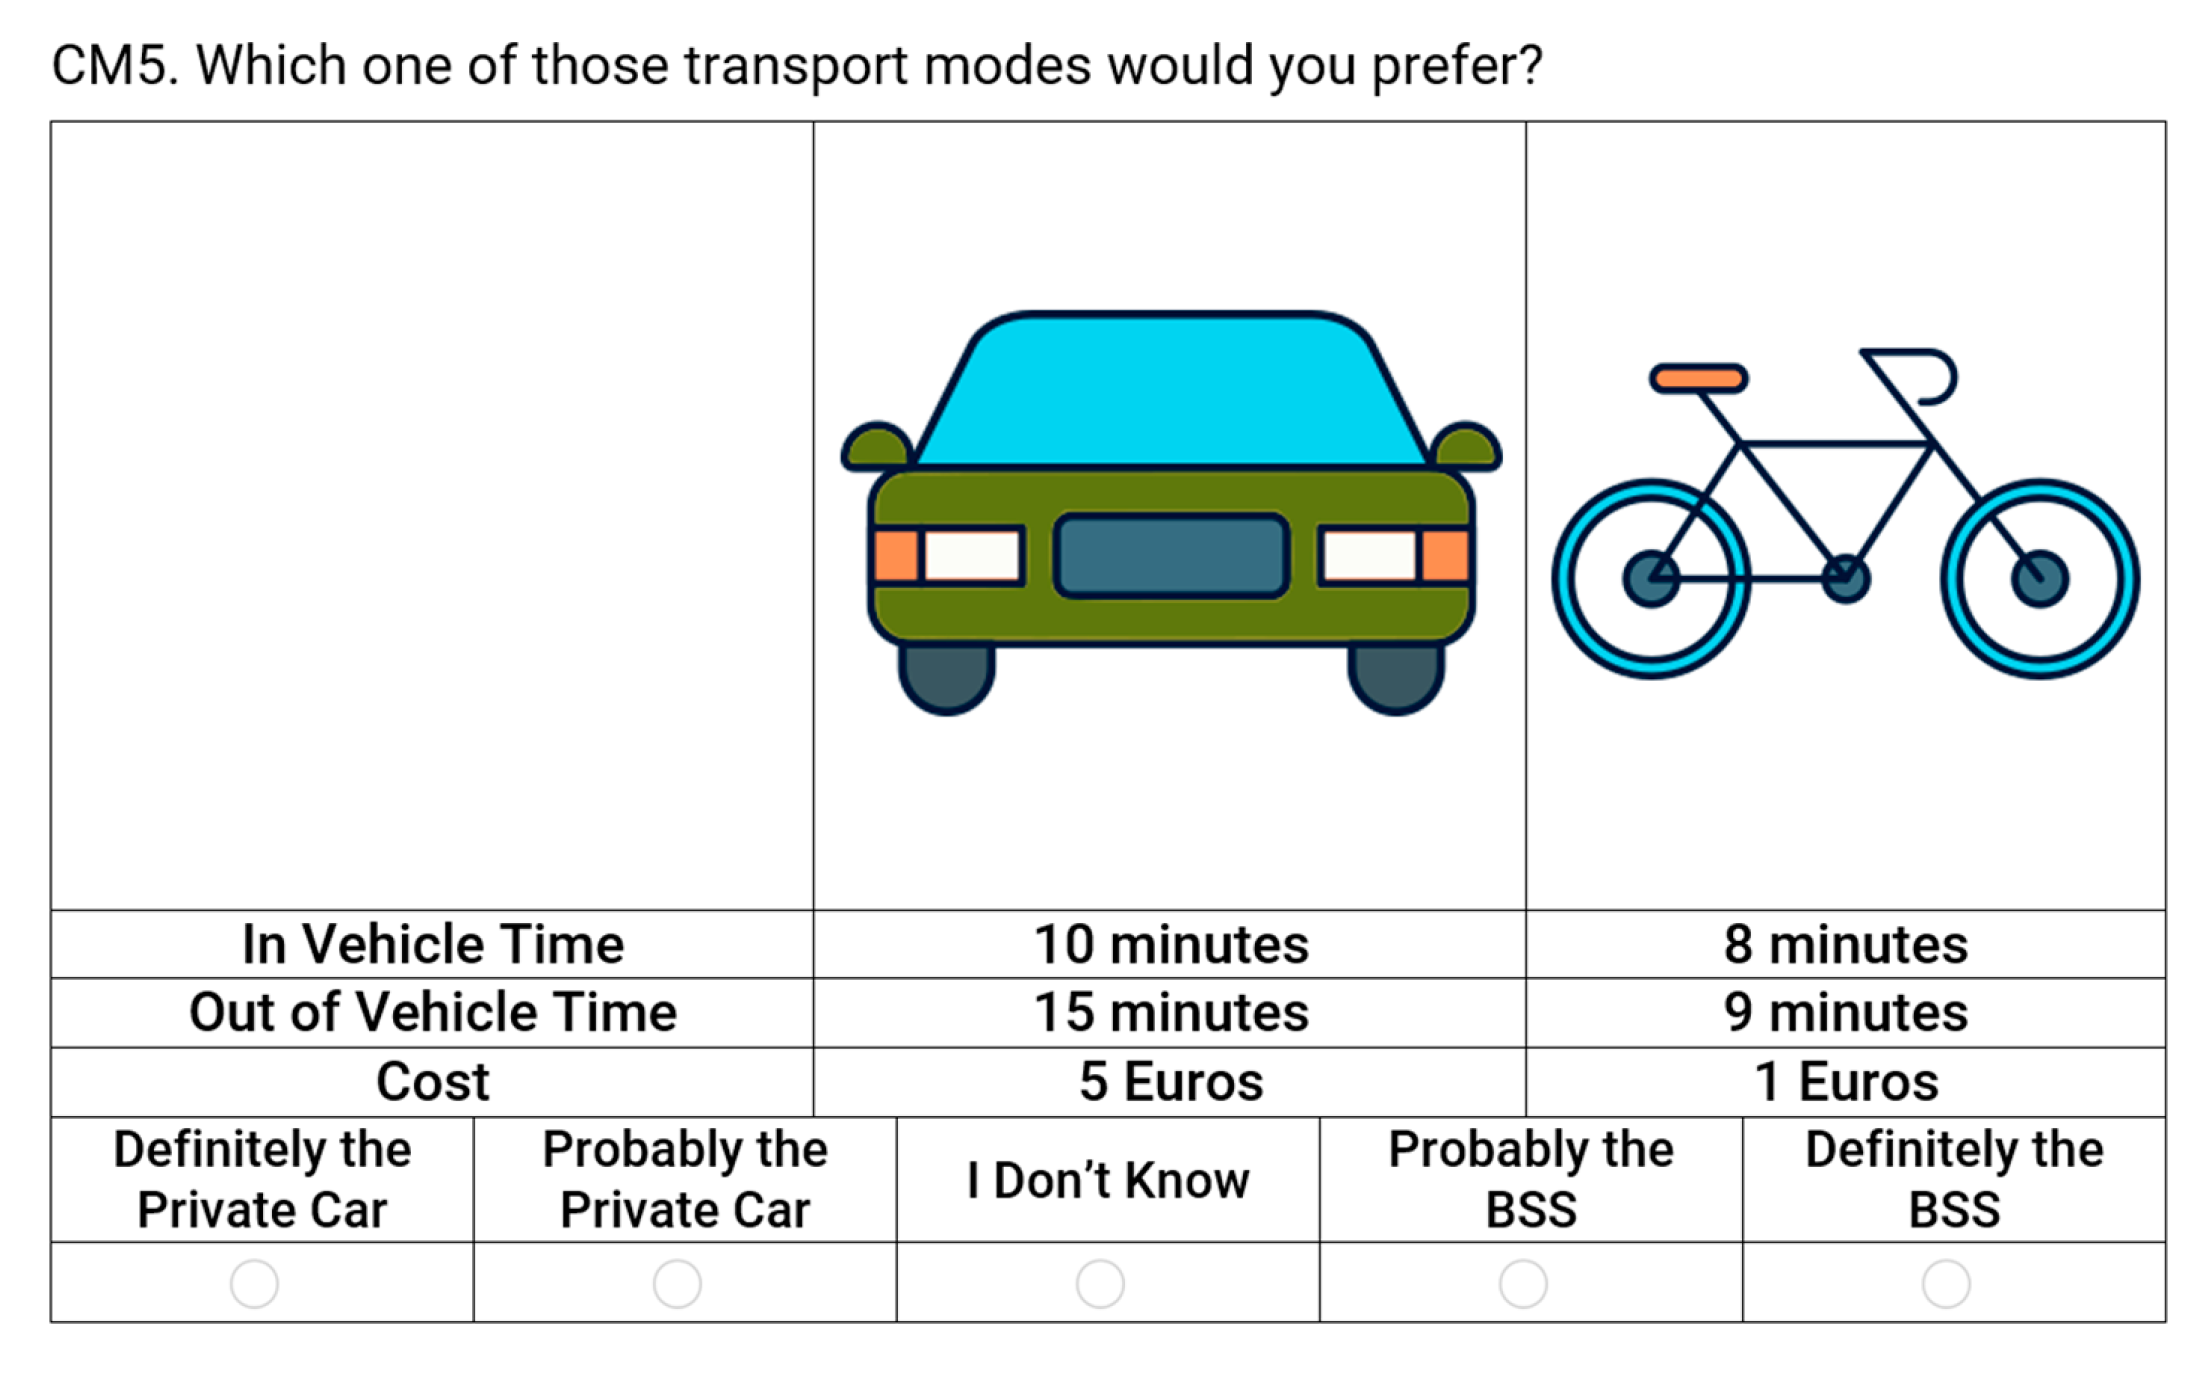
2.2.1. Data Collection
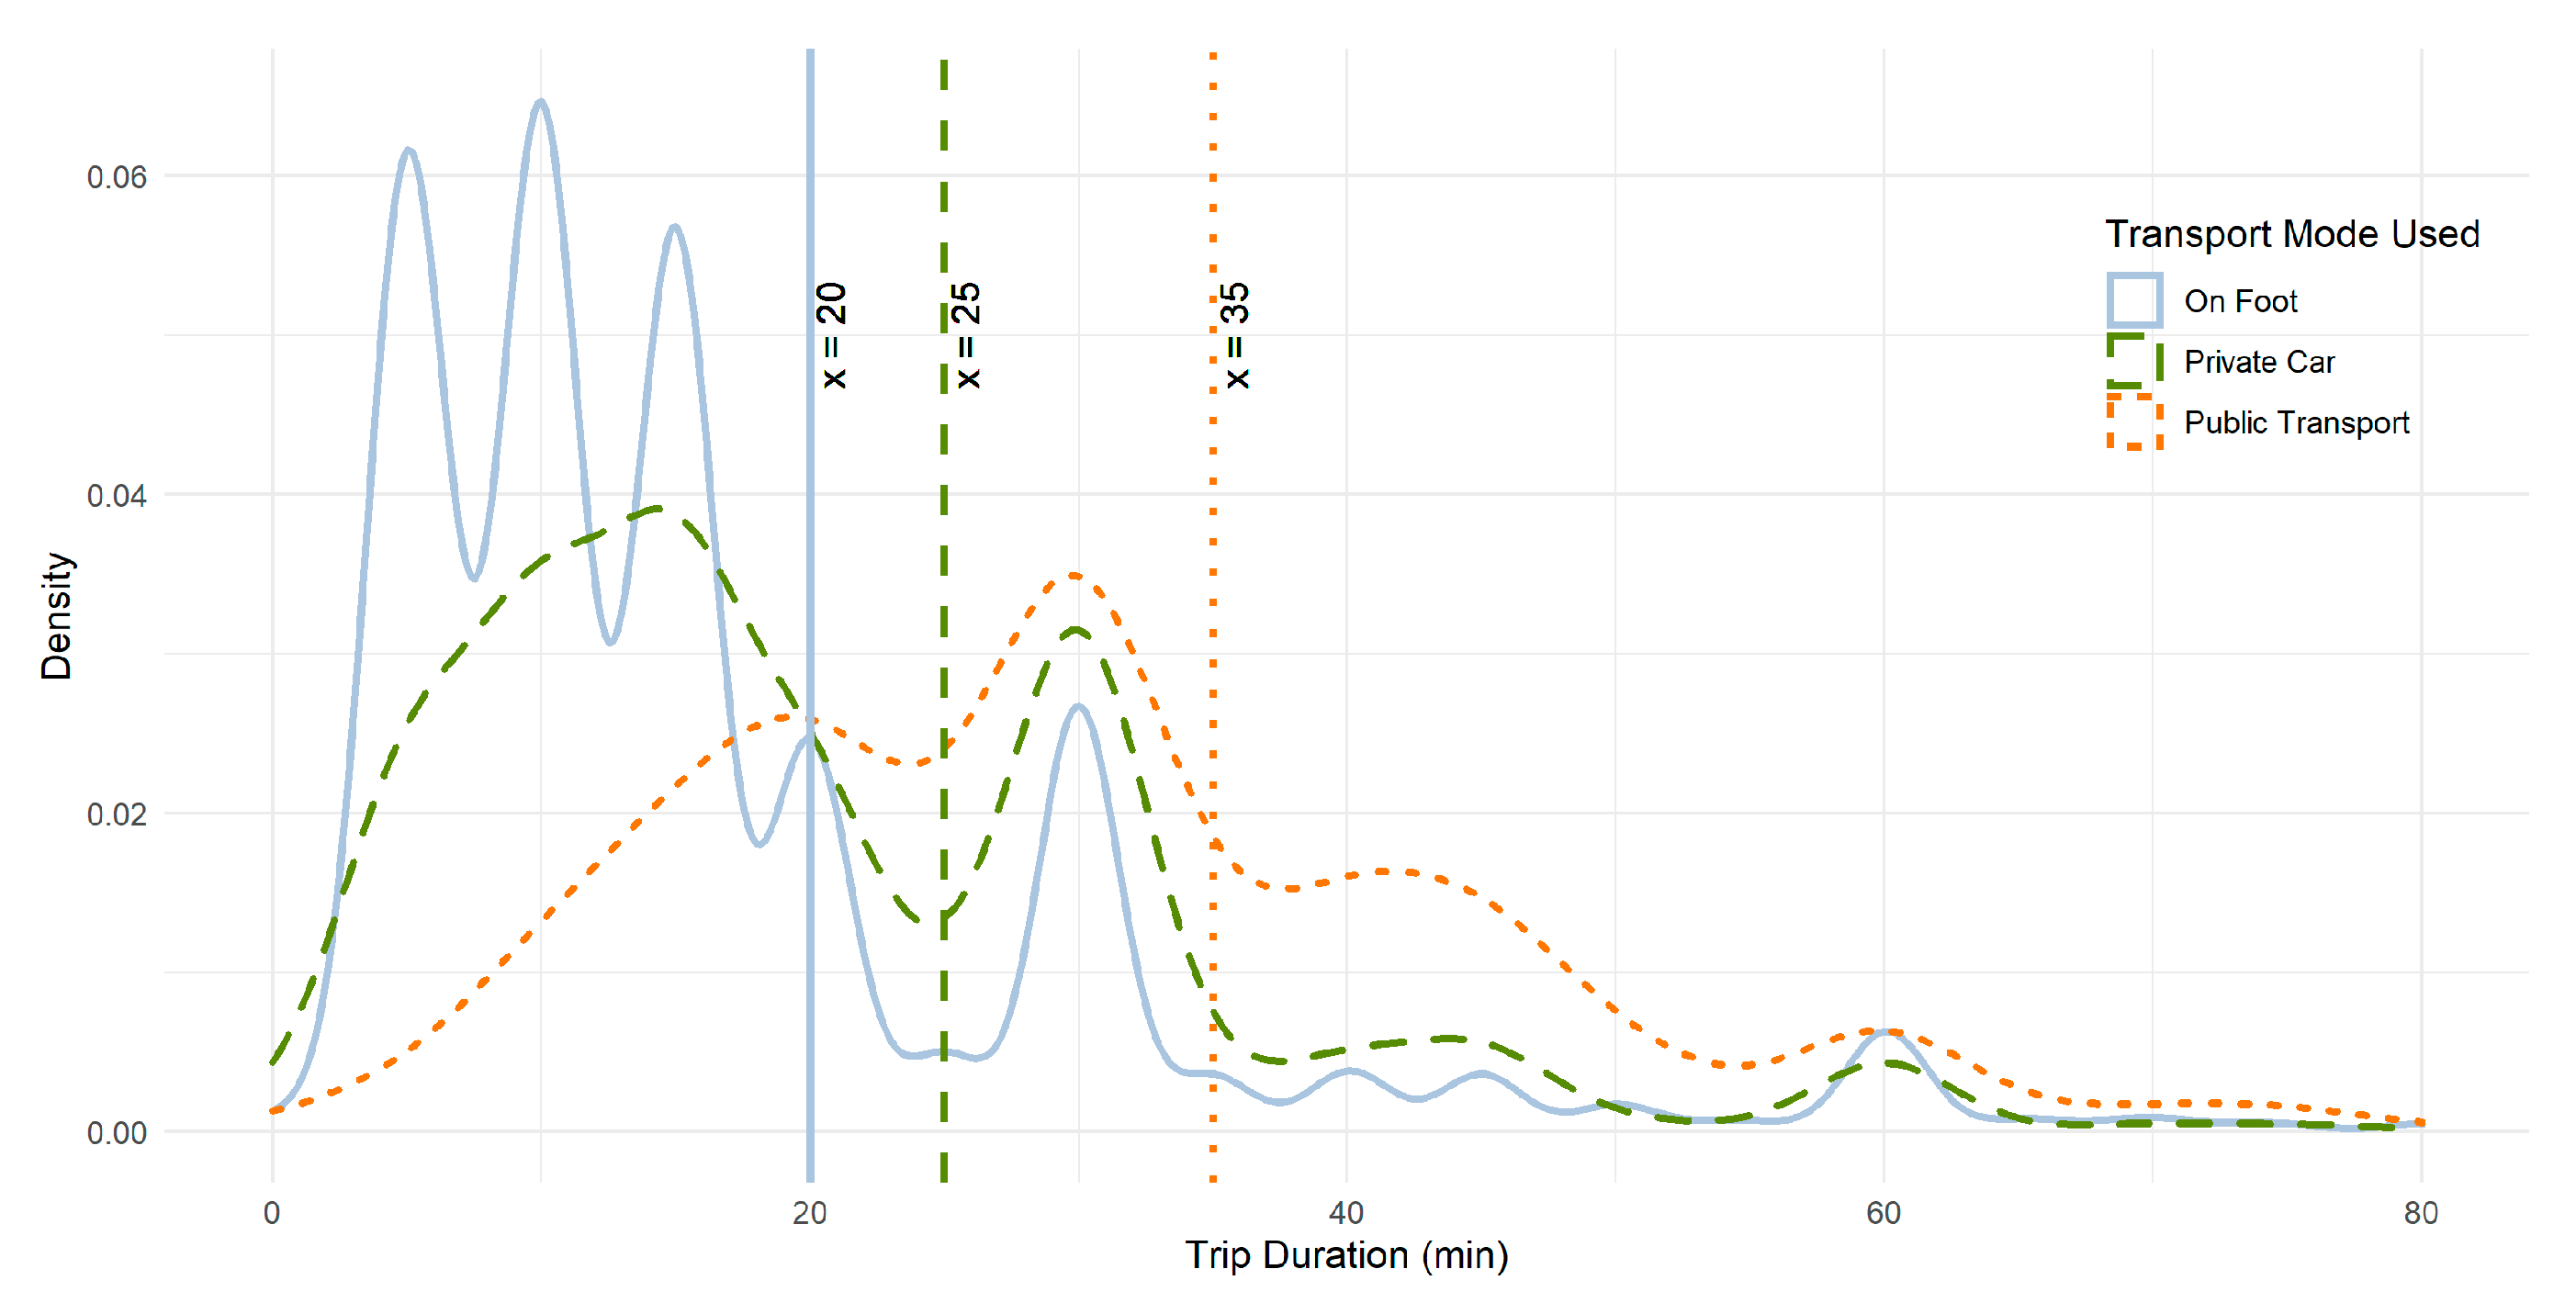
2.2.2. Data Manipulation Based on Trip Duration
2.2.3. Sample Sizes and Analysis Tools
3. Results
3.1. Car Users Datasets
3.2. Bus Users Datasets
3.3. Pedestrian Datasets
3.4. Models’ Goodness of Fit Tests
4. Discussion and Conclusions
4.1. Main Findings
4.2. Limitations of the Study and Future Research Directions
Author Contributions
Funding
Acknowledgments
Conflicts of Interest
References
- Cohen, A.; Shaheen, S. Planning for Shared Mobility; American Planing Association: Chicago, IL, USA, 2018. [Google Scholar]
- Shared - Use Mobility Center Shared-Use Mobility Reference Guide. Available online: https://sharedusemobilitycenter.org/wp-content/uploads/2015/09/SharedUseMobility_ReferenceGuide_09.25.2015.pdf (accessed on 19 July 2019).
- Turoń, K.; Kubik, A. Economic aspects of driving various types of vehicles in intelligent urban transport systems, including car-sharing services and autonomous vehicles. Appl. Sci. 2020, 10, 5580. [Google Scholar] [CrossRef]
- Midgley, P. Bicycle-Sharing Schemes: Enhancing Sustainable Mobility in Urban Areas; Commission on Sustainable Development: New York, NY, USA, 2011. [Google Scholar]
- Parkes, S.D.; Marsden, G.; Shaheen, S.A.; Cohen, A.P. Understanding the diffusion of public bikesharing systems: Evidence from Europe and North America. J. Transp. Geogr. 2013, 31, 94–103. [Google Scholar] [CrossRef]
- ECF. Factsheet—The Rise of Bicycle Sharing Schemes; EFC: Brussels, Belguim, 2012. [Google Scholar]
- New York City Department for City Planning. Bike-Share. Opportunities in New York City; New York City Department for City Planning: New York, NY, USA, 2009.
- Mátrai, T.; Tóth, J. Comparative Assessment of Public Bike Sharing Systems. Transp. Res. Procedia 2016, 14, 2344–2351. [Google Scholar] [CrossRef]
- Shaheen, S.A.; Guzman, S.; Zhang, H. Bikesharing in Europe, the Americas, and Asia. Transp. Res. Rec. J. Transp. Res. Board 2010, 2143, 159–167. [Google Scholar] [CrossRef]
- Fishman, E.; Washington, S.; Haworth, N.; Watson, A. Factors influencing bike share membership: An analysis of Melbourne and Brisbane. Transp. Res. Part A Policy Pract. 2015, 71, 17–30. [Google Scholar] [CrossRef]
- Ricci, M. Bike sharing: A review of evidence on impacts and processes of implementation and operation. Res. Transp. Bus. Manag. 2015, 15, 28–38. [Google Scholar] [CrossRef]
- Yang, T.; Li, Y.; Zhou, S. System dynamics modeling of dockless bike-sharing program operations: A case study of mobike in Beijing, China. Sustainability 2019, 11, 1601. [Google Scholar] [CrossRef]
- Ban, S.; Hyun, K.H. Designing a User Participation-Based Bike Rebalancing Service. Sustainability 2019, 11, 2396. [Google Scholar] [CrossRef]
- Nikitas, A. How to save bike-sharing: An evidence-based survival toolkit for policy-makers and mobility providers. Sustainability 2019, 11, 3206. [Google Scholar] [CrossRef]
- Shi, J.G.; Si, H.; Wu, G.; Su, Y.; Lan, J. Critical factors to achieve dockless bike-sharing sustainability in China: A stakeholder-oriented network perspective. Sustainability 2018, 10, 2090. [Google Scholar] [CrossRef]
- DeMaio, P. Bike-sharing: History, impacts, models of provision, and future. J. Public Transp. 2009, 12, 41–56. [Google Scholar] [CrossRef]
- Winslow, J.; Mont, O. Bicycle sharing: Sustainable value creation and institutionalisation strategies in Barcelona. Sustainability 2019, 11, 728. [Google Scholar] [CrossRef]
- European Commission Urban Mobility Package. Available online: https://ec.europa.eu/transport/themes/clean-transport-urban-transport/urban-mobility/urban-mobility-package_en (accessed on 20 July 2019).
- Guo, Y.; Zhou, J.; Wu, Y.; Li, Z. Identifying the factors affecting bike-sharing usage and degree of satisfaction in Ningbo, China. PLoS ONE 2017, 12, 1–19. [Google Scholar] [CrossRef] [PubMed]
- Shaheen, S.A.; Zhang, H.; Martin, E.; Guzman, S. China’s Hangzhou Public Bicycle: Understanding Early Adoption and Behavioral Response to Bikesharing. Transp. Res. Rec. J. Transp. Res. Board 2011, 2247, 33–41. [Google Scholar] [CrossRef]
- Fuller, D.; Gauvin, L.; Kestens, Y.; Daniel, M.; Fournier, M.; Morency, P.; Drouin, L. Use of a new public bicycle share program in Montreal, Canada. Am. J. Prev. Med. 2011, 41, 80–83. [Google Scholar] [CrossRef]
- Ogilvie, F.; Goodman, A. Inequalities in usage of a public bicycle sharing scheme: Socio-demographic predictors of uptake and usage of the London (UK) cycle hire scheme. Prev. Med. 2012, 55, 40–45. [Google Scholar] [CrossRef]
- LDA Consulting. Capital Bikeshare 2011 Member Survey Report; LDA Consulting: Washington, DC, USA, 2012. [Google Scholar]
- Buck, D.; Buehler, R.; Happ, P.; Rawls, B.; Chung, P.; Borecki, N. Are Bikeshare Users Different from Regular Cyclists? Transp. Res. Rec. J. Transp. Res. Board 2013, 2387, 112–119. [Google Scholar] [CrossRef]
- Yang, T.; Haixiao, P.; Qing, S. Bike-sharing systems in Beijing, Shanghai and Hangzhou and their impact on travel behaviour. In Proceedings of the Transportation Research Board 90th Annual Meeting, Washington, DC, USA, 23–27 January 2011. [Google Scholar]
- Jensen, P.; Rouquier, J.B.; Ovtracht, N.; Robardet, C. Characterizing the speed and paths of shared bicycle use in Lyon. Transp. Res. Part D Transp. Environ. 2010, 15, 522–524. [Google Scholar] [CrossRef]
- Martin, E.W.; Shaheen, S.A. Evaluating public transit modal shift dynamics in response to bikesharing: A tale of two U.S. cities. J. Transp. Geogr. 2014, 41, 315–324. [Google Scholar] [CrossRef]
- Fishman, E.; Washington, S.; Haworth, N. Bike Share: A Synthesis of the Literature. Transp. Rev. 2013, 33, 148–165. [Google Scholar] [CrossRef]
- Fishman, E.; Washington, S.; Haworth, N. Barriers and facilitators to public bicycle scheme use: A qualitative approach. Transp. Res. Part F Traffic Psychol. Behav. 2012, 15, 686–698. [Google Scholar] [CrossRef]
- Buck, D.; Buehler, R. Bike lanes and other determinants of capital bikeshare trips. In Proceedings of the 91st Transportation Research Board Annual Meeting, Washington, DC, USA, 22–26 January 2012. [Google Scholar]
- Cervero, R.; Duncan, M. Walking, Bicycling, and Urban Landscapes: Evidence from the San Francisco Bay Area. Am. J. Public Health 2003, 93, 1478–1483. [Google Scholar] [CrossRef] [PubMed]
- Zhao, J.; Deng, W.; Song, Y. Ridership and effectiveness of bikesharing: The effects of urban features and system characteristics on daily use and turnover rate of public bikes in China. Transp. Policy 2014, 35, 253–264. [Google Scholar] [CrossRef]
- Rixey, R.A. Station-Level Forecasting of Bikesharing Ridership. Transp. Res. Rec. J. Transp. Res. Board 2013, 2387, 46–55. [Google Scholar] [CrossRef]
- Bachand-Marleau, J.; Lee, B.H.Y.; El-Geneidy, A.M. Better Understanding of Factors Influencing Likelihood of Using Shared Bicycle Systems and Frequency of Use. Transp. Res. Rec. J. Transp. Res. Board 2012, 2314, 66–71. [Google Scholar] [CrossRef]
- Wang, X.; Lindsey, G.; Schoner, J.E.; Harrison, A. Modeling Bike Share Station Activity: Effects of Nearby Businesses and Jobs on Trips to and from Stations. J. Urban Plan. Dev. 2015, 142, 04015001. [Google Scholar] [CrossRef]
- Faghih-Imani, A.; Eluru, N.; El-Geneidy, A.M.; Rabbat, M.; Haq, U. How land-use and urban form impact bicycle flows: Evidence from the bicycle-sharing system (BIXI) in Montreal. J. Transp. Geogr. 2014, 41, 306–314. [Google Scholar] [CrossRef]
- Campbell, A.A.; Cherry, C.R.; Ryerson, M.S.; Yang, X. Factors influencing the choice of shared bicycles and shared electric bikes in Beijing. Transp. Res. Part C Emerg. Technol. 2016, 67, 399–414. [Google Scholar] [CrossRef]
- Shengchuan, J.; Yuchuan, D. Combining Revealed and Stated Preference Methods to Evaluate the Use of Bicycle-Sharing Systems. In Proceedings of the Fourth International Conference on Transportation Engineering, Chengdu, China, 19–20 October 2013. [Google Scholar]
- Thessaloniki, C. Resilient Thessaloniki: A Strategy for 2030; Thessaloniki: Thessaloniki City, Greece, 2017. [Google Scholar]
- Pozoukidou, G. Land use transport interaction models: Application perspectives for the city of Thessaloniki. Spatium 2014, 1, 7–14. [Google Scholar] [CrossRef]
- Thessaloniki Public Transportation. Socio-Economic Study in the Thessaloniki Metro extension to Kalamaria; Thessaloniki: Thessaloniki city, Greece, 2011. [Google Scholar]
- Thessbike. Website of Thessaloniki’s Bike Sharing System. Available online: http://www.thessbike.gr/en/ (accessed on 20 July 2019).
- Katkadikas, R. No TitleManagement and Analysis of Massive Data (Big Data) of the Public Bicycle Users in the City of Thessaloniki by Using the Programming Language R; Aristotle University of Thessaloniki: Thessaloniki, Greece, 2016. [Google Scholar]
- Bikeazy. Website of Bikeazy System. Available online: https://bikeazy.gr/ (accessed on 20 July 2019).
- Limesurvey. Available online: https://www.limesurvey.org/ (accessed on 20 July 2019).
- Politis, I.; Papadopoulos, E.; Fyrogenis, I.; Nikolaidou, A.; Verani, E.; Delivopoulos, G. CHANGE Project Transport Model—Report 2.2; Aristotle University of Thessaloniki, Transport Engineering Laboratory: Thessaloniki, Greece, 2019. [Google Scholar]
- Garson, G.D. Logistic Regression: Binary and Multinomial; Statistical Associates: Asheboro, NC, USA, 2014. [Google Scholar]
- R Core Team. R: A Language and Environment for Statistical Computing; R Core Team: Vienna, Austria, 2018. [Google Scholar]
- Wickham, H.; Francois, R.; Henry, L.; Muller, K. dplyr: A Grammar of Data Manipulation, R Package Version 0.8.3. Available online: https://cran.r-project.org/package=dplyr (accessed on 20 July 2019).
- Wickham, H. The Split-Apply-Combine Strategy for Data Analysis. J. Stat. Softw. 2011, 40, 1–29. [Google Scholar] [CrossRef]
- Wickham, H. Stringr: Simple, Consistent Wrappers for Common String Operations, R Package Version 1.3.0. 2018. Available online: https://CRAN.R-project.org/package=stringr (accessed on 20 July 2019).
- Jackman, S. Pscl: Classes and Methods for R Developed in the Political Science Computational Laboratory, R Package Version 1.4.9. Available online: http://pscl.stanford.edu/ (accessed on 20 July 2019).
- Jay, M. Generalhoslem: Goodness of Fit Tests for Logistic Regression Models, R Package Version 1.3.3. Available online: https://cran.r-project.org/ (accessed on 20 July 2019).
- Sing, T.; Sander, O.; Beerenwinkel, N.; Lengauer, T. ROCR: Visualizing classifier performance in R. Bioinformatics 2005, 21, 3940–3941. [Google Scholar] [CrossRef] [PubMed]
- Stevenson, M.; Nunes, T.; Heuer, C.; Marshall, J.; Sanchez, J.; Thorn-, R.; Reiczigel, J.; Robison-cox, J.; Sebastiani, P.; Solymos, P.; et al. Epir: Tools for the Analysis of Epidemiological Data, R Package Version 0.9–79. Available online: https://cran.r-project.org/package=epiR (accessed on 20 July 2019).
- Lele, S.R.; Keim, J.L.; Solymos, P. ResourceSelection: Resource Selection (Probability) Functions for Use-Availability Data. Available online: https://www.google.com/url?sa=t&rct=j&q=&esrc=s&source=web&cd=&cad=rja&uact=8&ved=2ahUKEwiz6--n9pTsAhVScCsKHXbSDK8QFjAAegQIARAC&url=https%3A%2F%2Fcran.r-project.org%2Fweb%2Fpackages%2FResourceSelection%2FResourceSelection.pdf&usg=AOvVaw16eU8ZwC_4aQ6tDtDzfF-g (accessed on 20 July 2019).
- Bertolini, G.; D’Amico, R.; Nardi, D.; Tinazzi, A.; Apolone, G. One model, several results: The paradox of the Hosmer-Lemeshow goodness-of-fit test for the logistic regression model. J. Epidemiol. Biostat. 2000, 5, 251–253. [Google Scholar] [PubMed]
- Meschik, M. Reshaping City Traffic Towards Sustainability Why Transport Policy should Favor the Bicycle Instead of Car Traffic. Procedia Soc. Behav. Sci. 2012, 48, 495–504. [Google Scholar] [CrossRef]
- Cole, R.; Turrell, G.; Koohsari, M.J.; Owen, N.; Sugiyama, T. Prevalence and correlates of walkable short car trips: A cross-sectional multilevel analysis. J. Transp. Health 2017, 4, 73–80. [Google Scholar] [CrossRef]
- Liu, Q.; Otter, T.; Allenby, G.M. Investigating endogeneity bias in marketing. Mark. Sci. 2007, 26, 642–650. [Google Scholar] [CrossRef]


| Authors | Year | Study Area | Sociodemographic | Spatial/Infrastructure | System Characteristics | Behavioral | Mobility and Trip Characteristics | Weather/Environmental | Method of Analysis |
|---|---|---|---|---|---|---|---|---|---|
| Cervero & Duncan | 2003 | Bay Area, USA | X | Χ | Χ | Χ | • Discrete choice model that used data from the Bay Area Travel Survey and spatial data | ||
| Jensen et al. | 2010 | Lyon, France | Χ | • Analysis of BSS users’ average speed and trip characteristics using BSS ridership data | |||||
| Shaheen et al. | 2011 | Hangzhou, China | X | Χ | • Questionnaires that compared BSS members to non-members | ||||
| Fuller et al. | 2011 | Montreal, Canada | X | X | Χ | Χ | • Multi-Variate Logistic Regression using random-digit dialing telephone surveys | ||
| Yang et al. | 2011 | Beijing, Shanghai & Hangzhou, China | Χ | X | • Comparison between different cities using system-usage data collected via user surveys | ||||
| Ogilvie & Goodman | 2012 | London, UK | X | X | • Linear and logistic regression using system-registration data | ||||
| LDA consulting | 2012 | Washington DC, USA | X | X | • Comparison between BSS members and general population | ||||
| Fishman et al. | 2012 | Brisbane, Australia | X | Χ | Χ | X | • Thematic groups of focus groups data with members and non-members | ||
| Buck & Buehler | 2012 | Washington DC, USA | X | • GIS-based, bivariate correlation and a multiple regression analysis using system-use data provided by the operator | |||||
| Bachand-Marleau et al. | 2012 | Montreal, Canada | X | Χ | • Binary logistic model and linear regression model using data from an online survey | ||||
| Buck et al. | 2013 | Washington DC, USA | X | Χ | • Differences between BSS members, general population and traditional cyclists using pre-existing household travel surveys and CaBi system-use data | ||||
| Fishman et al. | 2013 | X | X | Χ | • Literature Review | ||||
| Rixey | 2013 | Washington DC, Minneapolis–St. Paul and Denver, USA | X | X | Χ | X | • Regression analysis that includes demographic and infrastructure characteristics and compares data from three BSS | ||
| Shengchuan & Yuchuan | 2013 | Shanghai, China | X | X | Χ | Χ | • Structural equation models using combined revealed and stated preference data | ||
| Zhao et al. | 2014 | China | X | Χ | • Regression and comparison of data from 69 BSS | ||||
| Faghih-Imani et al. | 2014 | Montreal, Canada | X | Χ | Χ | • Linear mixed models using minute-by-minute availability data from BSS stations | |||
| Wang et al. | 2015 | Minneapolis–St. Paul, USA | X | Χ | • Log-linear and negative binomial regression using data from the BSS operator and the 2010 U.S. Census, regional planning agencies and local government | ||||
| Campbell et al. | 2016 | Beijing, China | X | X | Χ | • Multinomial choice model using stated preference data | |||
| Guo et al. | 2017 | Ningbo, China | X | X | Χ | Χ | • Bivariate ordered probit model using survey among BSS members data |
| Car | Bus | Walk | ||||||||
|---|---|---|---|---|---|---|---|---|---|---|
| ≤15 min | 15–25 min | 25< min | ≤25 min | 25–35 min | 35< min | ≤10 min | 10–20 min | 20< min | ||
| IVT (% of revealed In Vehicle Time) | Level 1 | 70 | 100 | 110 | 90 | 80 | 70 | 80 | 80 | 70 |
| Level 2 | 50 | 80 | 90 | 80 | 70 | 50 | 70 | 70 | 60 | |
| Level 3 | 30 | 60 | 70 | 70 | 60 | 40 | 60 | 60 | 50 | |
| OVT (% of revealed Out of Vehicle Time) | Level 1 | 100 | 100 | 100 | 80 | 80 | 80 | N/A | N/A | N/A |
| Level 2 | 80 | 80 | 80 | 60 | 60 | 60 | N/A | N/A | N/A | |
| Level 3 | 60 | 60 | 60 | 40 | 40 | 40 | N/A | N/A | N/A | |
| Cost (€) | Level 1 | 1.5 | 2 | 2.5 | 1.5 | 2 | 2.5 | 1.5 | 1.5 | 1.5 |
| Level 2 | 1 | 1,5 | 2 | 1 | 1,5 | 2 | 1 | 1 | 1 | |
| Level 3 | 0.5 | 1 | 1.5 | 0.5 | 1 | 1.5 | 0.5 | 0.5 | 0.5 | |
| Variable | Factor Levels | Sample Count | Sample Percentage | Population Percentage |
|---|---|---|---|---|
| Gender | Male | 245 | 49% | 47.8% |
| Female | 255 | 51% | 52.2% | |
| Age Group | 18–24 | 139 | 28% | 10.9% |
| 25–34 | 154 | 31% | 17.8% | |
| 35–44 | 88 | 18% | 18.8% | |
| 45–54 | 66 | 13% | 17.1% | |
| 55–64 | 36 | 7% | 13.8% | |
| >64 | 17 | 3% | 21.7% |
| Car Trips (25 min Threshold) | Bus Trips (35 min Threshold) | Pedestrian Trips (20 min Threshold) | |
|---|---|---|---|
| Short to Long Duration Ratio | 1.84 | 1.94 | 2.59 |
| Sub-Sample | Respondents | Observations/Choices |
|---|---|---|
| Car User Short Duration | 113 | 923 |
| Car User Long Duration | 101 | 853 |
| Bus User Short Duration | 71 | 586 |
| Bus User Long Duration | 70 | 574 |
| Pedestrians Short Duration | 91 | 774 |
| Pedestrians Long Duration | 54 | 457 |
| Short Trips (≤25 min) | Long Trips (>25 min) | ||||||||||
|---|---|---|---|---|---|---|---|---|---|---|---|
| Estimate | Std. Error | z Value | Pr(>|z|) | OR | Estimate | Std. Error | z Value | Pr(>|z|) | OR | ||
| (Intercept) | −0.903 | 0.604 | −1.497 | 0.134 | 0.405 | 6.536 | 1.082 | 6.043 | <0.001 | 689.300 | |
| IVT.BSS (min) | −0.258 | 0.031 | −8.402 | <0.001 | 0.772 | −0.080 | 0.018 | −4.447 | <0.001 | 0.923 | |
| OVT.BSS (min) | −0.099 | 0.130 | −0.759 | 0.448 | 0.906 | 0.065 | 0.027 | 2.457 | 0.014 | 1.068 | |
| Cost.BSS (€) | −1.463 | 0.196 | −7.457 | <0.001 | 0.232 | −0.854 | 0.259 | −3.303 | 0.001 | 0.426 | |
| IVT.Car (min) | 0.173 | 0.028 | 6.289 | <0.001 | 1.189 | 0.045 | 0.016 | 2.787 | 0.005 | 1.046 | |
| OVT.Car (min) | 0.118 | 0.105 | 1.127 | 0.260 | 1.126 | −0.041 | 0.021 | −1.989 | 0.047 | 0.960 | |
| Cost.Car (€) | 0.221 | 0.064 | 3.444 | 0.001 | 1.247 | 0.065 | 0.020 | 3.246 | 0.001 | 1.067 | |
| Frequency | 2–3 Times a Day | 0.413 | 0.308 | 1.341 | 0.180 | 1.512 | −1.134 | 0.385 | −2.946 | 0.003 | 0.322 |
| 3–5 Times a Week | −0.470 | 0.223 | −2.105 | 0.035 | 0.625 | −0.132 | 0.280 | −0.473 | 0.636 | 0.876 | |
| 3–5 Times a Month | 0.702 | 0.290 | 2.424 | 0.015 | 2.018 | −0.556 | 0.354 | −1.569 | 0.117 | 0.574 | |
| Purpose | Other Reasons | −0.074 | 0.481 | −0.153 | 0.878 | 0.929 | −2.539 | 0.831 | −3.055 | 0.002 | 0.079 |
| Education | −0.197 | 0.328 | −0.599 | 0.549 | 0.821 | −18.665 | 905.897 | −0.021 | 0.984 | 0.000 | |
| Entertainment | −0.861 | 0.288 | −2.986 | 0.003 | 0.423 | −2.304 | 0.482 | −4.777 | <0.001 | 0.100 | |
| Sex | −0.436 | 0.187 | −2.330 | 0.020 | 0.646 | −0.467 | 0.233 | −2.009 | 0.045 | 0.627 | |
| Age Group | 25–34 | 0.139 | 0.258 | 0.537 | 0.591 | 1.149 | −3.183 | 0.507 | −6.278 | <0.001 | 0.041 |
| 35–44 | −0.056 | 0.284 | −0.197 | 0.843 | 0.945 | −2.942 | 0.521 | −5.643 | <0.001 | 0.053 | |
| 45–54 | 0.359 | 0.293 | 1.227 | 0.220 | 1.432 | −2.444 | 0.517 | −4.724 | <0.001 | 0.087 | |
| 55–64 | −0.458 | 0.455 | −1.006 | 0.315 | 0.633 | −5.510 | 1.142 | −4.823 | <0.001 | 0.004 | |
| >64 | −15.027 | 458.368 | −0.033 | 0.974 | 0.000 | −18.076 | 601.093 | −0.030 | 0.976 | 0.000 | |
| Higher Education | 1.043 | 0.468 | 2.226 | 0.026 | 2.837 | −1.964 | 0.648 | −3.030 | 0.002 | 0.140 | |
| Stable Schedule | 0.520 | 0.214 | 2.435 | 0.015 | 1.682 | −0.818 | 0.245 | −3.332 | 0.001 | 0.441 | |
| Goodness of Fit Metrics | Null deviance: 1209.31 on 922 degrees of freedom; Residual deviance: 927.22 on 902 degrees of freedom; AIC: 969,22; Number of Fisher Scoring iterations: 14; McFadden R2: 0.230; Hosmer and Lemeshow goodness of fit (GOF) test; X-squared = 7.063, df = 8, p-value = 0.530 | Null deviance: 793.36 on 852 degrees of freedom; Residual deviance: 587.51 on 832 degrees of freedom; AIC: 629.51; Number of Fisher Scoring iterations: 16; McFadden R2: 0.259; Hosmer and Lemeshow goodness of fit (GOF) test; X-squared = 9.134, df = 8, p-value = 0.331 | |||||||||
| Short Trip (≤35 min) | Long Trip (>35 min) | ||||||||||
|---|---|---|---|---|---|---|---|---|---|---|---|
| Estimate | Std. Error | z Value | Pr(>|z|) | OR | Estimate | Std. Error | z Value | Pr(>|z|) | OR | ||
| (Intercept) | 0.991 | 0.851 | 1.165 | 0.244 | 2.695 | 4.587 | 1.381 | 3.323 | 0.001 | 98.216 | |
| IVT.BSS (min) | −0.325 | 0.067 | −4.840 | <0.001 | 0.722 | −0.099 | 0.023 | −4.321 | <0.001 | 0.906 | |
| OVT.BSS (min) | −0.208 | 0.054 | −3.841 | <0.001 | 0.812 | −0.043 | 0.026 | −1.672 | 0.094 | 0.958 | |
| Cost.BSS (€) | −3.045 | 0.304 | −10.021 | <0.001 | 0.048 | −2.122 | 0.303 | −7.006 | <0.001 | 0.120 | |
| IVT.Bus (min) | 0.213 | 0.047 | 4.479 | <0.001 | 1.237 | 0.036 | 0.016 | 2.277 | 0.023 | 1.036 | |
| Cost.Bus (€) | 1.409 | 0.426 | 3.304 | 0.001 | 4.091 | 0.240 | 0.070 | 3.418 | 0.001 | 1.271 | |
| Frequency | 2–3 Times a Day | −0.505 | 0.387 | −1.304 | 0.192 | 0.604 | 0.412 | 0.417 | 0.988 | 0.323 | 1.510 |
| 3–5 Times a Week | −1.703 | 0.446 | −3.817 | <0.001 | 0.182 | −0.754 | 0.365 | −2.064 | 0.039 | 0.470 | |
| 3–5 Times a Month | −1.622 | 0.532 | −3.049 | 0.002 | 0.198 | −0.110 | 0.434 | −0.253 | 0.800 | 0.896 | |
| Purpose | Other Reasons | 0.286 | 0.506 | 0.566 | 0.572 | 1.331 | 0.500 | 0.809 | 0.618 | 0.537 | 1.649 |
| Education | 0.291 | 0.372 | 0.782 | 0.434 | 1.338 | 0.387 | 0.377 | 1.026 | 0.305 | 1.473 | |
| Entertainment | 1.008 | 0.459 | 2.197 | 0.028 | 2.740 | −0.765 | 0.453 | −1.688 | 0.091 | 0.465 | |
| Sex | 0.973 | 0.312 | 3.117 | 0.002 | 2.647 | −0.148 | 0.284 | −0.520 | 0.603 | 0.863 | |
| Age Group | 25–34 | −0.598 | 0.325 | −1.841 | 0.066 | 0.550 | 0.369 | 0.325 | 1.136 | 0.256 | 1.446 |
| 35–44 | −0.394 | 0.465 | −0.849 | 0.396 | 0.674 | 0.375 | 0.466 | 0.805 | 0.421 | 1.455 | |
| 45–54 | −1.235 | 0.626 | −1.973 | 0.048 | 0.291 | −14.892 | 737.153 | −0.020 | 0.984 | 0.000 | |
| 55–64 | −0.246 | 0.615 | −0.400 | 0.689 | 0.782 | −2.764 | 0.759 | −3.640 | <0.001 | 0.063 | |
| >64 | −15.625 | 793.954 | −0.020 | 0.984 | 0.000 | - | - | - | - | - | |
| Higher Education | 2.586 | 0.500 | 5.167 | <0.001 | 13.279 | 2.248 | 0.810 | 2.773 | 0.006 | 9.466 | |
| Stable Schedule | −0.423 | 0.304 | −1.389 | 0.165 | 0.655 | −2.261 | 0.370 | −6.108 | <0.001 | 0.104 | |
| Household Income | 401–800 € | 0.661 | 0.414 | 1.597 | 0.110 | 1.936 | −0.898 | 0.439 | −2.048 | 0.041 | 0.407 |
| 801–1200 € | 0.439 | 0.461 | 0.954 | 0.340 | 1.552 | −0.651 | 0.462 | −1.409 | 0.159 | 0.521 | |
| 1201–1600 € | 0.899 | 0.466 | 1.930 | 0.054 | 2.457 | −1.808 | 0.516 | −3.506 | <0.001 | 0.164 | |
| 1601–2000 € | 1.425 | 0.582 | 2.447 | 0.014 | 4.160 | 1.398 | 0.778 | 1.797 | 0.072 | 4.046 | |
| 2001–2400 € | 0.812 | 0.601 | 1.350 | 0.177 | 2.251 | −2.089 | 0.695 | −3.006 | 0.003 | 0.124 | |
| More than 2400 € | 0.838 | 0.845 | 0.992 | 0.321 | 2.312 | −1.016 | 0.537 | −1.890 | 0.059 | 0.362 | |
| Goodness of Fit Metrics | Null deviance: 794.52 on 585 degrees of freedom; Residual deviance: 509.28 on 560 degrees of freedom; AIC: 561.28; Number of Fisher Scoring iterations: 15; McFadden R2: 0.359; Hosmer and Lemeshow goodness of fit (GOF) test; X-squared = 4.900, df = 8, p-value = 0.768 | Null deviance: 657.37 on 573 degrees of freedom; Residual deviance: 494.46 on 549 degrees of freedom; AIC: 544.46; Number of Fisher Scoring iterations: 15; McFadden R2: 0.248; Hosmer and Lemeshow goodness of fit (GOF) test; X-squared = 16.693, df = 8, p-value = 0.033 | |||||||||
| Short Trip (≤20 min) | Long Trip (>20 min) | ||||||||||
|---|---|---|---|---|---|---|---|---|---|---|---|
| Estimate | Std. Error | z Value | Pr(>|z|) | OR | Estimate | Std. Error | z Value | Pr(>|z|) | OR | ||
| (Intercept) | −2.227 | 0.902 | −2.469 | 0.014 | 0.108 | 6.678 | 1.589 | 4.201 | <0.001 | 794.572 | |
| T.BSS (min) | −0.404 | 0.086 | −4.699 | <0.001 | 0.668 | −0.178 | 0.053 | −3.328 | 0.001 | 0.837 | |
| T.Walk (min) | 0.517 | 0.069 | 7.507 | <0.001 | 1.678 | 0.051 | 0.037 | 1.401 | 0.161 | 1.053 | |
| Cost.BSS (€) | −3.138 | 0.342 | −9.181 | <0.001 | 0.043 | −4.206 | 0.491 | −8.560 | <0.001 | 0.015 | |
| Frequency | 2–3 Times a Day | 0.433 | 0.367 | 1.178 | 0.239 | 1.541 | 0.976 | 0.894 | 1.092 | 0.275 | 2.654 |
| 3–5 Times a Week | 0.278 | 0.376 | 0.738 | 0.460 | 1.320 | 2.048 | 0.620 | 3.303 | 0.001 | 7.752 | |
| 3–5 Times a Month | −0.384 | 0.440 | −0.873 | 0.383 | 0.681 | 2.017 | 0.930 | 2.170 | 0.030 | 7.514 | |
| Purpose | Other Reasons | 1.903 | 0.447 | 4.254 | <0.001 | 6.708 | −0.005 | 1.149 | −0.004 | 0.997 | 0.995 |
| Education | 1.464 | 0.446 | 3.284 | 0.001 | 4.322 | 1.754 | 0.819 | 2.142 | 0.032 | 5.778 | |
| Entertainment | 0.631 | 0.379 | 1.665 | 0.096 | 1.879 | −1.612 | 0.774 | −2.082 | 0.037 | 0.200 | |
| Sex | −0.074 | 0.262 | −0.281 | 0.779 | 0.929 | 1.585 | 0.503 | 3.154 | 0.002 | 4.880 | |
| Age Group | 25–34 | 0.874 | 0.364 | 2.402 | 0.016 | 2.397 | 0.196 | 0.672 | 0.292 | 0.771 | 1.216 |
| 35–44 | 1.356 | 0.452 | 3.003 | 0.003 | 3.881 | −0.552 | 0.911 | −0.606 | 0.545 | 0.576 | |
| 45–54 | −1.240 | 0.538 | −2.304 | 0.021 | 0.289 | 2.252 | 1.394 | 1.616 | 0.106 | 9.508 | |
| 55–64 | −1.743 | 0.686 | −2.539 | 0.011 | 0.175 | −3.790 | 1.232 | −3.076 | 0.002 | 0.023 | |
| >64 | −1.377 | 0.728 | −1.892 | 0.058 | 0.252 | 0.408 | 0.907 | 0.449 | 0.653 | 1.503 | |
| Higher Education | −0.770 | 0.371 | −2.075 | 0.038 | 0.463 | 0.842 | 0.521 | 1.617 | 0.106 | 2.321 | |
| Stable Schedule | −0.860 | 0.375 | −2.296 | 0.022 | 0.423 | −3.217 | 0.587 | −5.476 | <0.001 | 0.040 | |
| Household Income | 401–800 € | −0.177 | 0.425 | −0.416 | 0.677 | 0.838 | −2.847 | 0.837 | −3.400 | 0.001 | 0.058 |
| 801–1200 € | −0.105 | 0.421 | −0.250 | 0.803 | 0.900 | −2.842 | 0.797 | −3.564 | <0.001 | 0.058 | |
| 1201–1600 € | 0.253 | 0.455 | 0.555 | 0.579 | 1.287 | −3.267 | 0.993 | −3.289 | 0.001 | 0.038 | |
| 1601–2000 € | −0.473 | 0.534 | −0.887 | 0.375 | 0.623 | −2.843 | 0.899 | −3.164 | 0.002 | 0.058 | |
| 2001–2400 € | −0.143 | 0.614 | −0.233 | 0.816 | 0.867 | −0.584 | 1.105 | −0.528 | 0.597 | 0.558 | |
| More than 2400 € | 1.943 | 0.648 | 2.999 | 0.003 | 6.978 | −6.939 | 1.534 | −4.522 | <0.001 | 0.001 | |
| Goodness of Fit Metrics | Null deviance: 758.27 on 773 degrees of freedom; Residual deviance: 495.71 on 750 degrees of freedom; AIC: 543.71; Number of Fisher Scoring iterations: 6; McFadden R2: 0.346; Hosmer and Lemeshow goodness of fit (GOF) test; X-squared = 5.215, df = 8, p-value = 0.734 | Null deviance: 530.31 on 456 degrees of freedom; Residual deviance: 276.40 on 433 degrees of freedom; AIC: 324.4; Number of Fisher Scoring iterations: 7; McFadden R2: 0.479; Hosmer and Lemeshow goodness of fit (GOF) test; X-squared = 6.209, df = 8, p-value = 0.624 | |||||||||
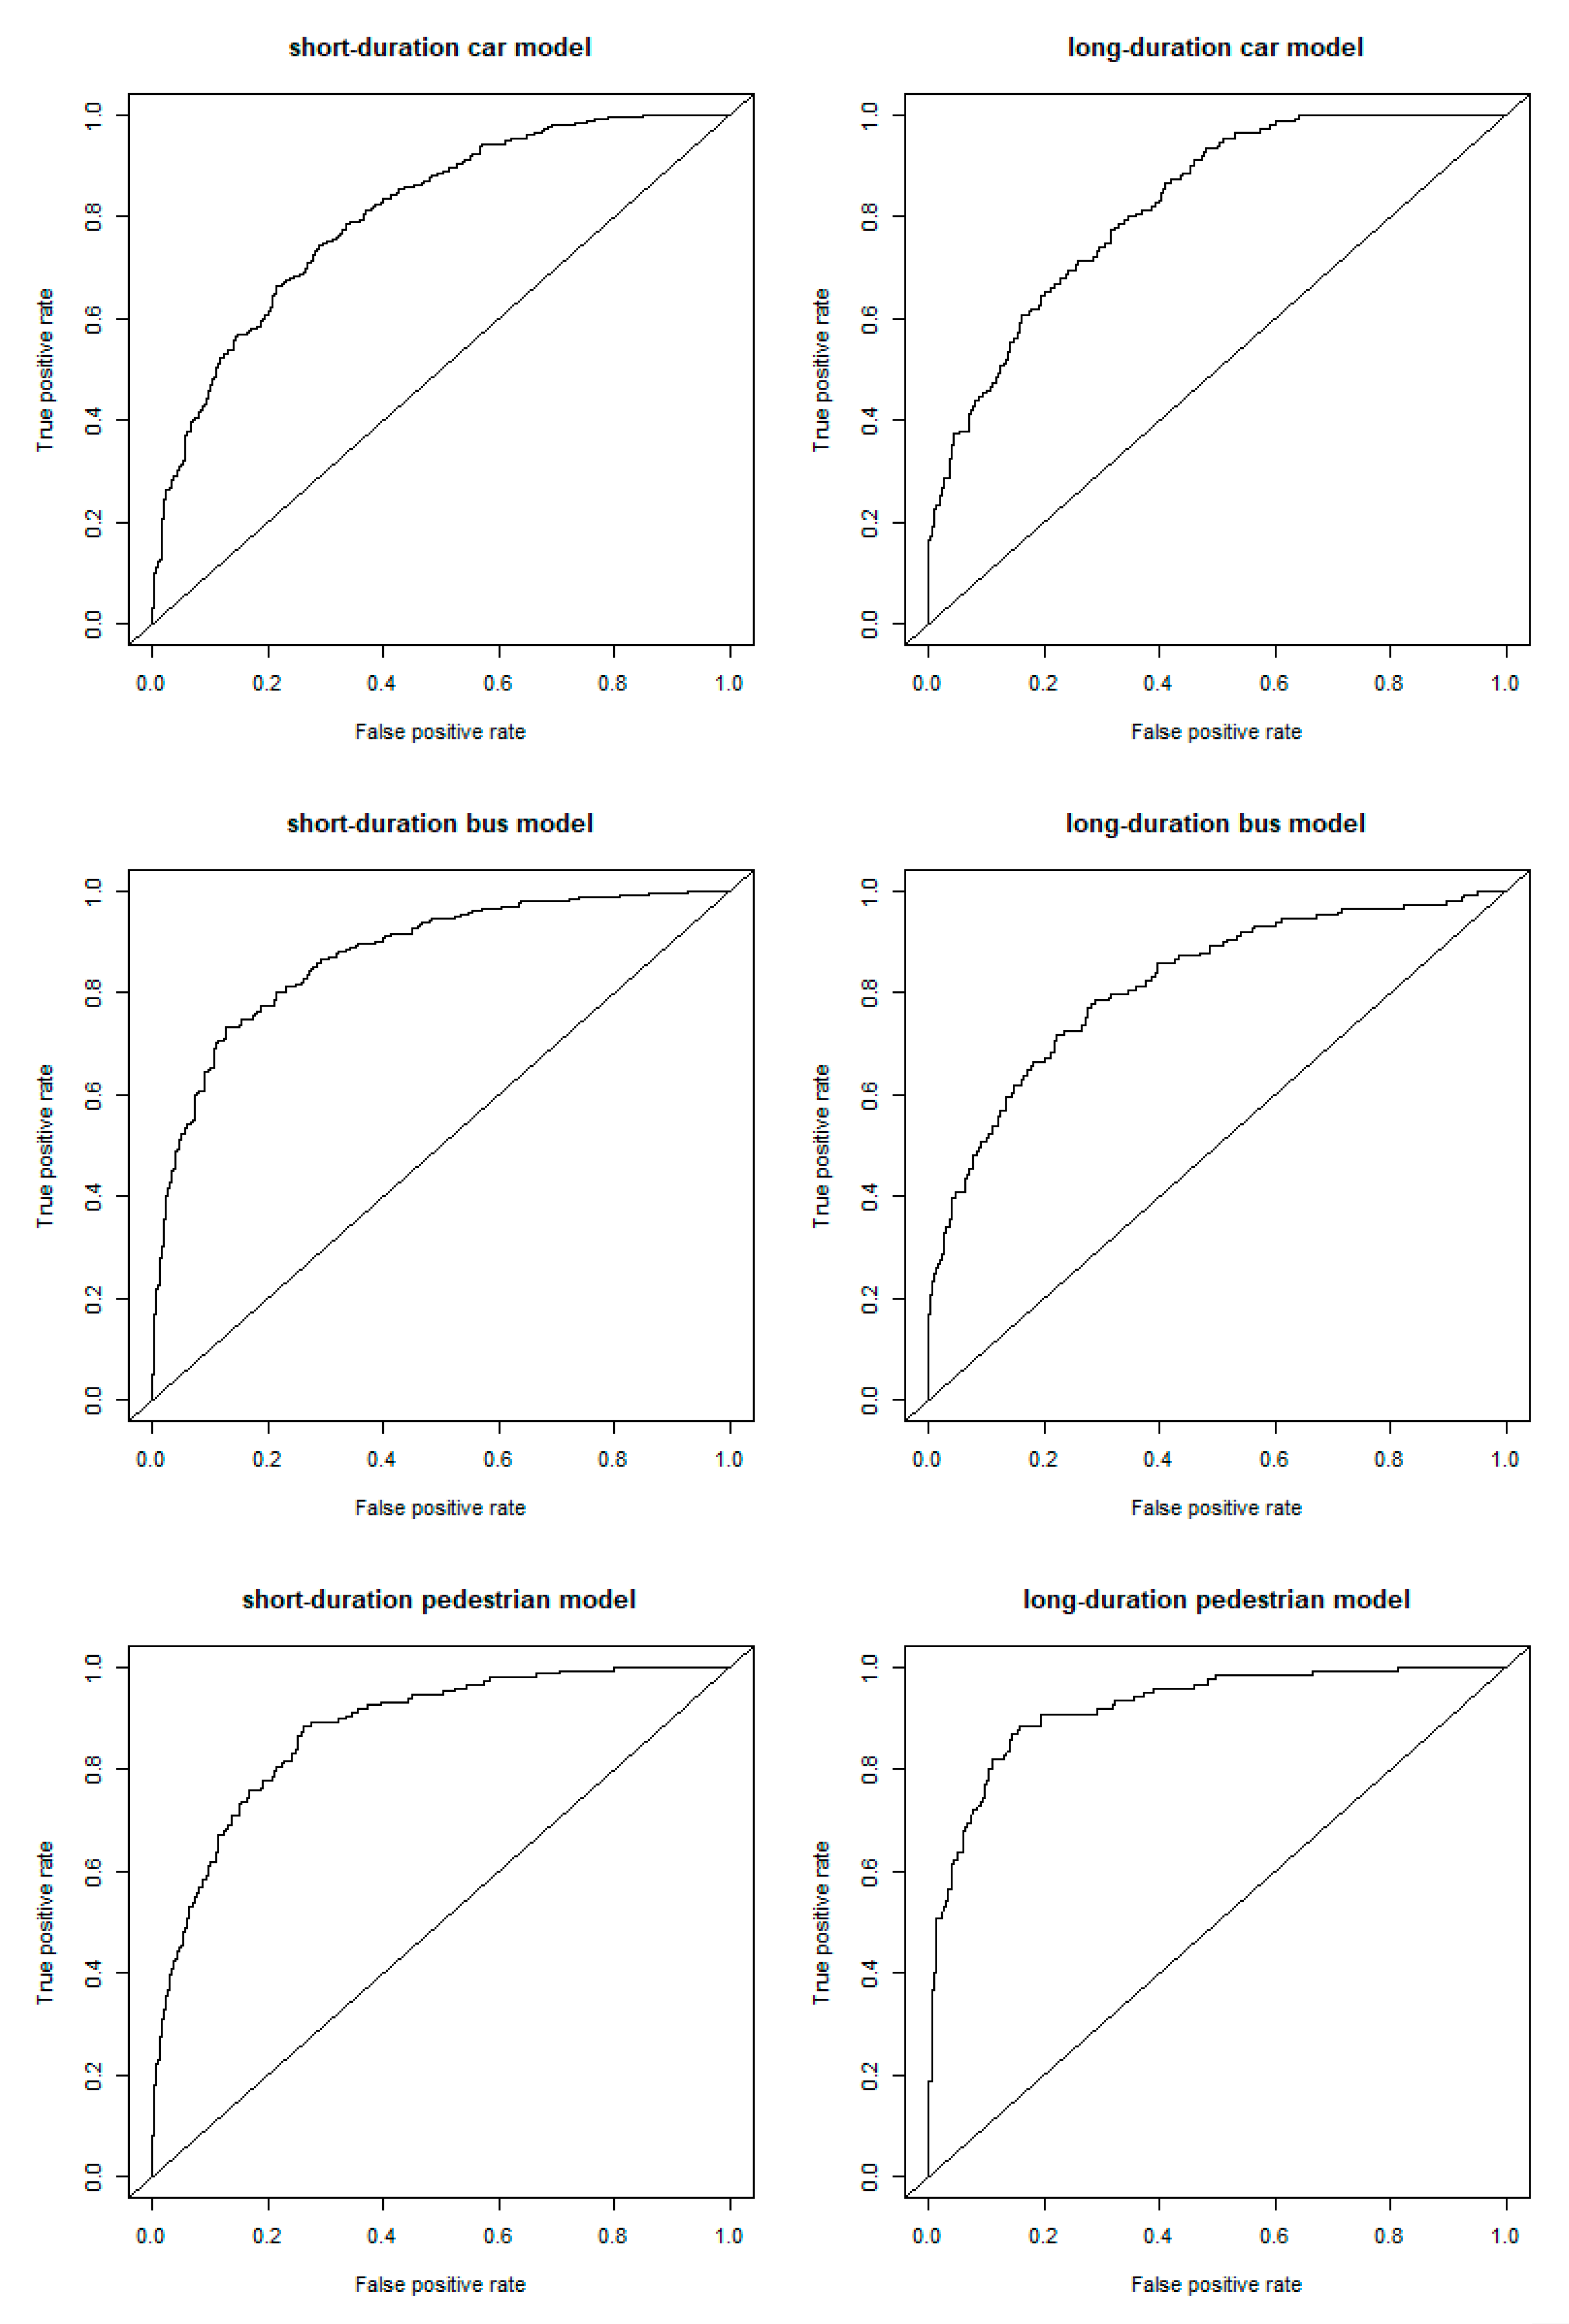
| Model | AUC |
|---|---|
| Short-Duration Car | 80.7% |
| Long- Duration Car | 82.4% |
| Short- Duration Bus | 87.5% |
| Long- Duration Bus | 82% |
| Short- Duration Pedestrian | 87.9% |
| Long- Duration Pedestrian | 92.3% |
© 2020 by the authors. Licensee MDPI, Basel, Switzerland. This article is an open access article distributed under the terms and conditions of the Creative Commons Attribution (CC BY) license (http://creativecommons.org/licenses/by/4.0/).
Share and Cite
Politis, I.; Fyrogenis, I.; Papadopoulos, E.; Nikolaidou, A.; Verani, E. Shifting to Shared Wheels: Factors Affecting Dockless Bike-Sharing Choice for Short and Long Trips. Sustainability 2020, 12, 8205. https://doi.org/10.3390/su12198205
Politis I, Fyrogenis I, Papadopoulos E, Nikolaidou A, Verani E. Shifting to Shared Wheels: Factors Affecting Dockless Bike-Sharing Choice for Short and Long Trips. Sustainability. 2020; 12(19):8205. https://doi.org/10.3390/su12198205
Chicago/Turabian StylePolitis, Ioannis, Ioannis Fyrogenis, Efthymis Papadopoulos, Anastasia Nikolaidou, and Eleni Verani. 2020. "Shifting to Shared Wheels: Factors Affecting Dockless Bike-Sharing Choice for Short and Long Trips" Sustainability 12, no. 19: 8205. https://doi.org/10.3390/su12198205
APA StylePolitis, I., Fyrogenis, I., Papadopoulos, E., Nikolaidou, A., & Verani, E. (2020). Shifting to Shared Wheels: Factors Affecting Dockless Bike-Sharing Choice for Short and Long Trips. Sustainability, 12(19), 8205. https://doi.org/10.3390/su12198205