Article

Investigation on Airport Landscape Cooling Associated with Irrigation: A Case Study of Adelaide Airport, Australia

1
Joint Research Centre for Future Cities, Southeast University-Monash University Joint Graduate School, Suzhou 215123, China
2
School of Civil Engineering, Southeast University, Nanjing 210096, China
3
School of Earth, Atmosphere and Environment, Monash University, Clayton 3800, Australia
4
Cooperative Research Centre for Water Sensitive Cities, Melbourne 3800, Australia
5
Department of Civil Engineering, Nanjing University of Aeronautics and Astronautics, Nanjing 210016, China
6
Business Development Management, South Australian Water, Adelaide 5000, Australia
*
Authors to whom correspondence should be addressed.
Sustainability 2020, 12(19), 8123; https://doi.org/10.3390/su12198123
Submission received: 2 September 2020 / Revised: 22 September 2020 / Accepted: 29 September 2020 / Published: 1 October 2020
(This article belongs to the Section Sustainable Urban and Rural Development)

Abstract

:
Extreme summertime heat is becoming a major issue for aircraft operations. As global temperatures continue to rise, some of the heaviest planes on the longest flights may eventually be unable to depart during the hottest part of summer days. During summer days, some airports have to reduce the payload of aircraft, including cargo and/or passengers in the hotter days of summer. Nonetheless, there is no existing body of research on the potential for airport cooling. Furthermore, extreme heat on the ground also affects airport workers; loading and unloading luggage and servicing platforms between flights could become more arduous. With global warming proceeding, it is becoming increasingly urgent to find a suitable strategy to cool airport environments, perhaps by irrigation of a vegetated landscape. All airports have large enclosed areas (usually of grass) acting as a buffer between airport activities and the adjacent industrial, commercial and residential land utilization. This paper describes the trial of irrigating the buffer area of Adelaide airport and analyzes the performance of irrigation cooling for Adelaide airport, examining whether this can benefit human thermal comfort. Results indicate that irrigation provides cooling, and the cooling effect reduces along with the increasing instance from the middle of the irrigation area. At 15:00, the average air temperature was 1.8 °C cooler in the middle of the irrigation area than in the non-irrigation area, and the relative humidity was 5.8% higher during the trial period. On an extremely hot day (the maximum air temperature was 45.4 °C), it was 1.5 °C cooler in the middle of the irrigation area than upwind the of irrigation area, and 0.8 °C cooler than downwind of the irrigation area at 13:00. Human thermal comfort (HTC) is unfavorable in the runway, but greater improvements can be made through promotion of irrigation.

1. Introduction

Constant rise in urban temperature is a critical issue and challenge for scientists and urban planners, presenting a need to adapt control measures. Urban greening has been a key strategy in promoting urban cooling [1,2]. In light of the rising temperatures due to climate change and the urban heat island (UHI) [3,4], it is important to recognize the role of irrigated public open space as a mitigating strategy for reducing urban heat and promoting human thermal comfort (HTC) [5,6]. In a previous study, simulation data analysis results showed that the combination of water bodies and vegetation had a synergistic cooling effect [7,8]. Public open spaces have a unique role in climate change adaptation in several ways. As reported earlier by Lloyd et al. [9], the Australian government have devoted a great deal of human, material and financial resources to water-sensitive urban construction in recent years. Water-sensitive urban design (WSUD) is ‘a thoughtful way of urban design which is to minimize the hydrological influences of urban development on the adjoining environment’ [8,9,10]. Stormwater management is a part of the WSUD approach that aims at collecting stormwater to supply water sources for non-potable uses [3,10]. Water-sensitive urban design technologies could be used to retain and/or re-integrate stormwater in the urban environment, thereby promoting evapotranspiration, and providing valuable urban cooling [11,12]. It has begun to gain traction as a sustainable urban water management approach, and certain cooling benefits have been recently elaborated [13,14]. However, opportunities to use cooling in an applied way to improve safety and economics, for example, of transport systems, have not yet been explored very well.
Generally, each major city has an airport, and many of them have more than one. All airports have large enclosed areas (usually of grass fields) acting as a buffer between airport activities and the adjacent industrial, commercial and residential land utilization. The principal intention of the buffer area is to safeguard security of the airport activities, and to reduce the public exposure from high frequency and levels of noise [15]. This buffer area must be designed and managed in a way that does not hinder airport operations, including mitigating the risk of bird strike, flooding and the generation of dust. The utilization of this buffer area needs to satisfy the airport operation, the airline operators and the civil aviation regulators [16]. Most global cities and airports are dealing with low-density air and an increase in aircraft operational performance for geographical reasons of climate and altitude. Nevertheless, climate change can make the situation even worse. Extreme heat is one of the apparent characteristics of climate change [17]. In a previous study [18], Steffen et al. pointed out that approximately one third of the world’s population is currently exposed to dangerous heat waves for more than twenty days per year due to global warming. Researchers found that extreme heat also has an impact on airport operations to the extent that extreme summertime may lead to a loss in aircraft maximum takeoff weight by 5% and a reduced payload of 1% as a global average [19]. Research studies have proved that at higher temperatures, air has a lower density. Therefore, aircraft engines need to generate more thrust to take off (Figure 1).
A previous study examined the negative impact of extreme summer temperatures on aviation through a modelling approach for Phoenix airport [20,21]. In reality, more than 40 flights were cancelled when the temperature increased to about 48.9 °C in Phoenix, Arizona on 20 June 2017, because it was too hot for the planes to fly. Finding ways to generate cooling air at airports is very significant for safety and economics reasons. With global warming proceeding, it is becoming increasingly urgent to find a suitable strategy for cooling the surrounding environment at airports. Coffel et al. [22] have also reported in their study that a steadily rising mean and extreme temperature due to climate change can impact air transportation in coming decades. They reported that as temperature rises at a constant pressure, air density declines, which results in less lift generation by an aircraft wing at a given airspeed, potentially imposing a weight restriction on departing aircraft [22].
Adelaide is a center of managed aquifer recharge (MAR) using the aquifer storage and recovery (ASR) method of MAR [23,24]. There are more than 30 ASR schemes operating around Adelaide, most of which are used to collect stormwater [25]. Therefore, a significant proportion of urban run-off is captured rather than being discharged to the sea. The Adelaide airport stormwater ASR scheme has been running since May 2015. Stormwater is harvested from the nearby Brownhill Creek and injected into the Tertiary 2 aquifer located 200 m underground. South Australian Water (SAW) has an Environment Protection Authority (EPA) licence to inject 300 million litres of stormwater per year from the creek into the T2 aquifer, via four bores, and an approval to extract 270 million litres per year from these bores following injection. Adelaide has some of the highest summertime temperatures experienced in any Australian capital city according to the Bureau of Meteorology database [26]. The average summertime mean maximum temperature is 30.5 °C for Adelaide, compared to 27.5 °C for Melbourne and 27.3 °C for Sydney. An earlier study suggested that large scale irrigation can modify the local climate, and especially at arid or semi-arid locations [27]. There is a unique opportunity to cool the airport and surroundings by reusing stormwater from the ASR scheme to irrigate the vegetation in the buffer area of Adelaide Airport. A two-round trial was established at the Adelaide international airport to enable the quantification of the benefits associated with irrigating open space using stormwater from the ASR scheme. The aim of this trial is to quantify the performance of irrigation cooling for Adelaide airport and to examine whether this can benefit human thermal comfort.

2. Materials and Methods

2.1. Experimental Site

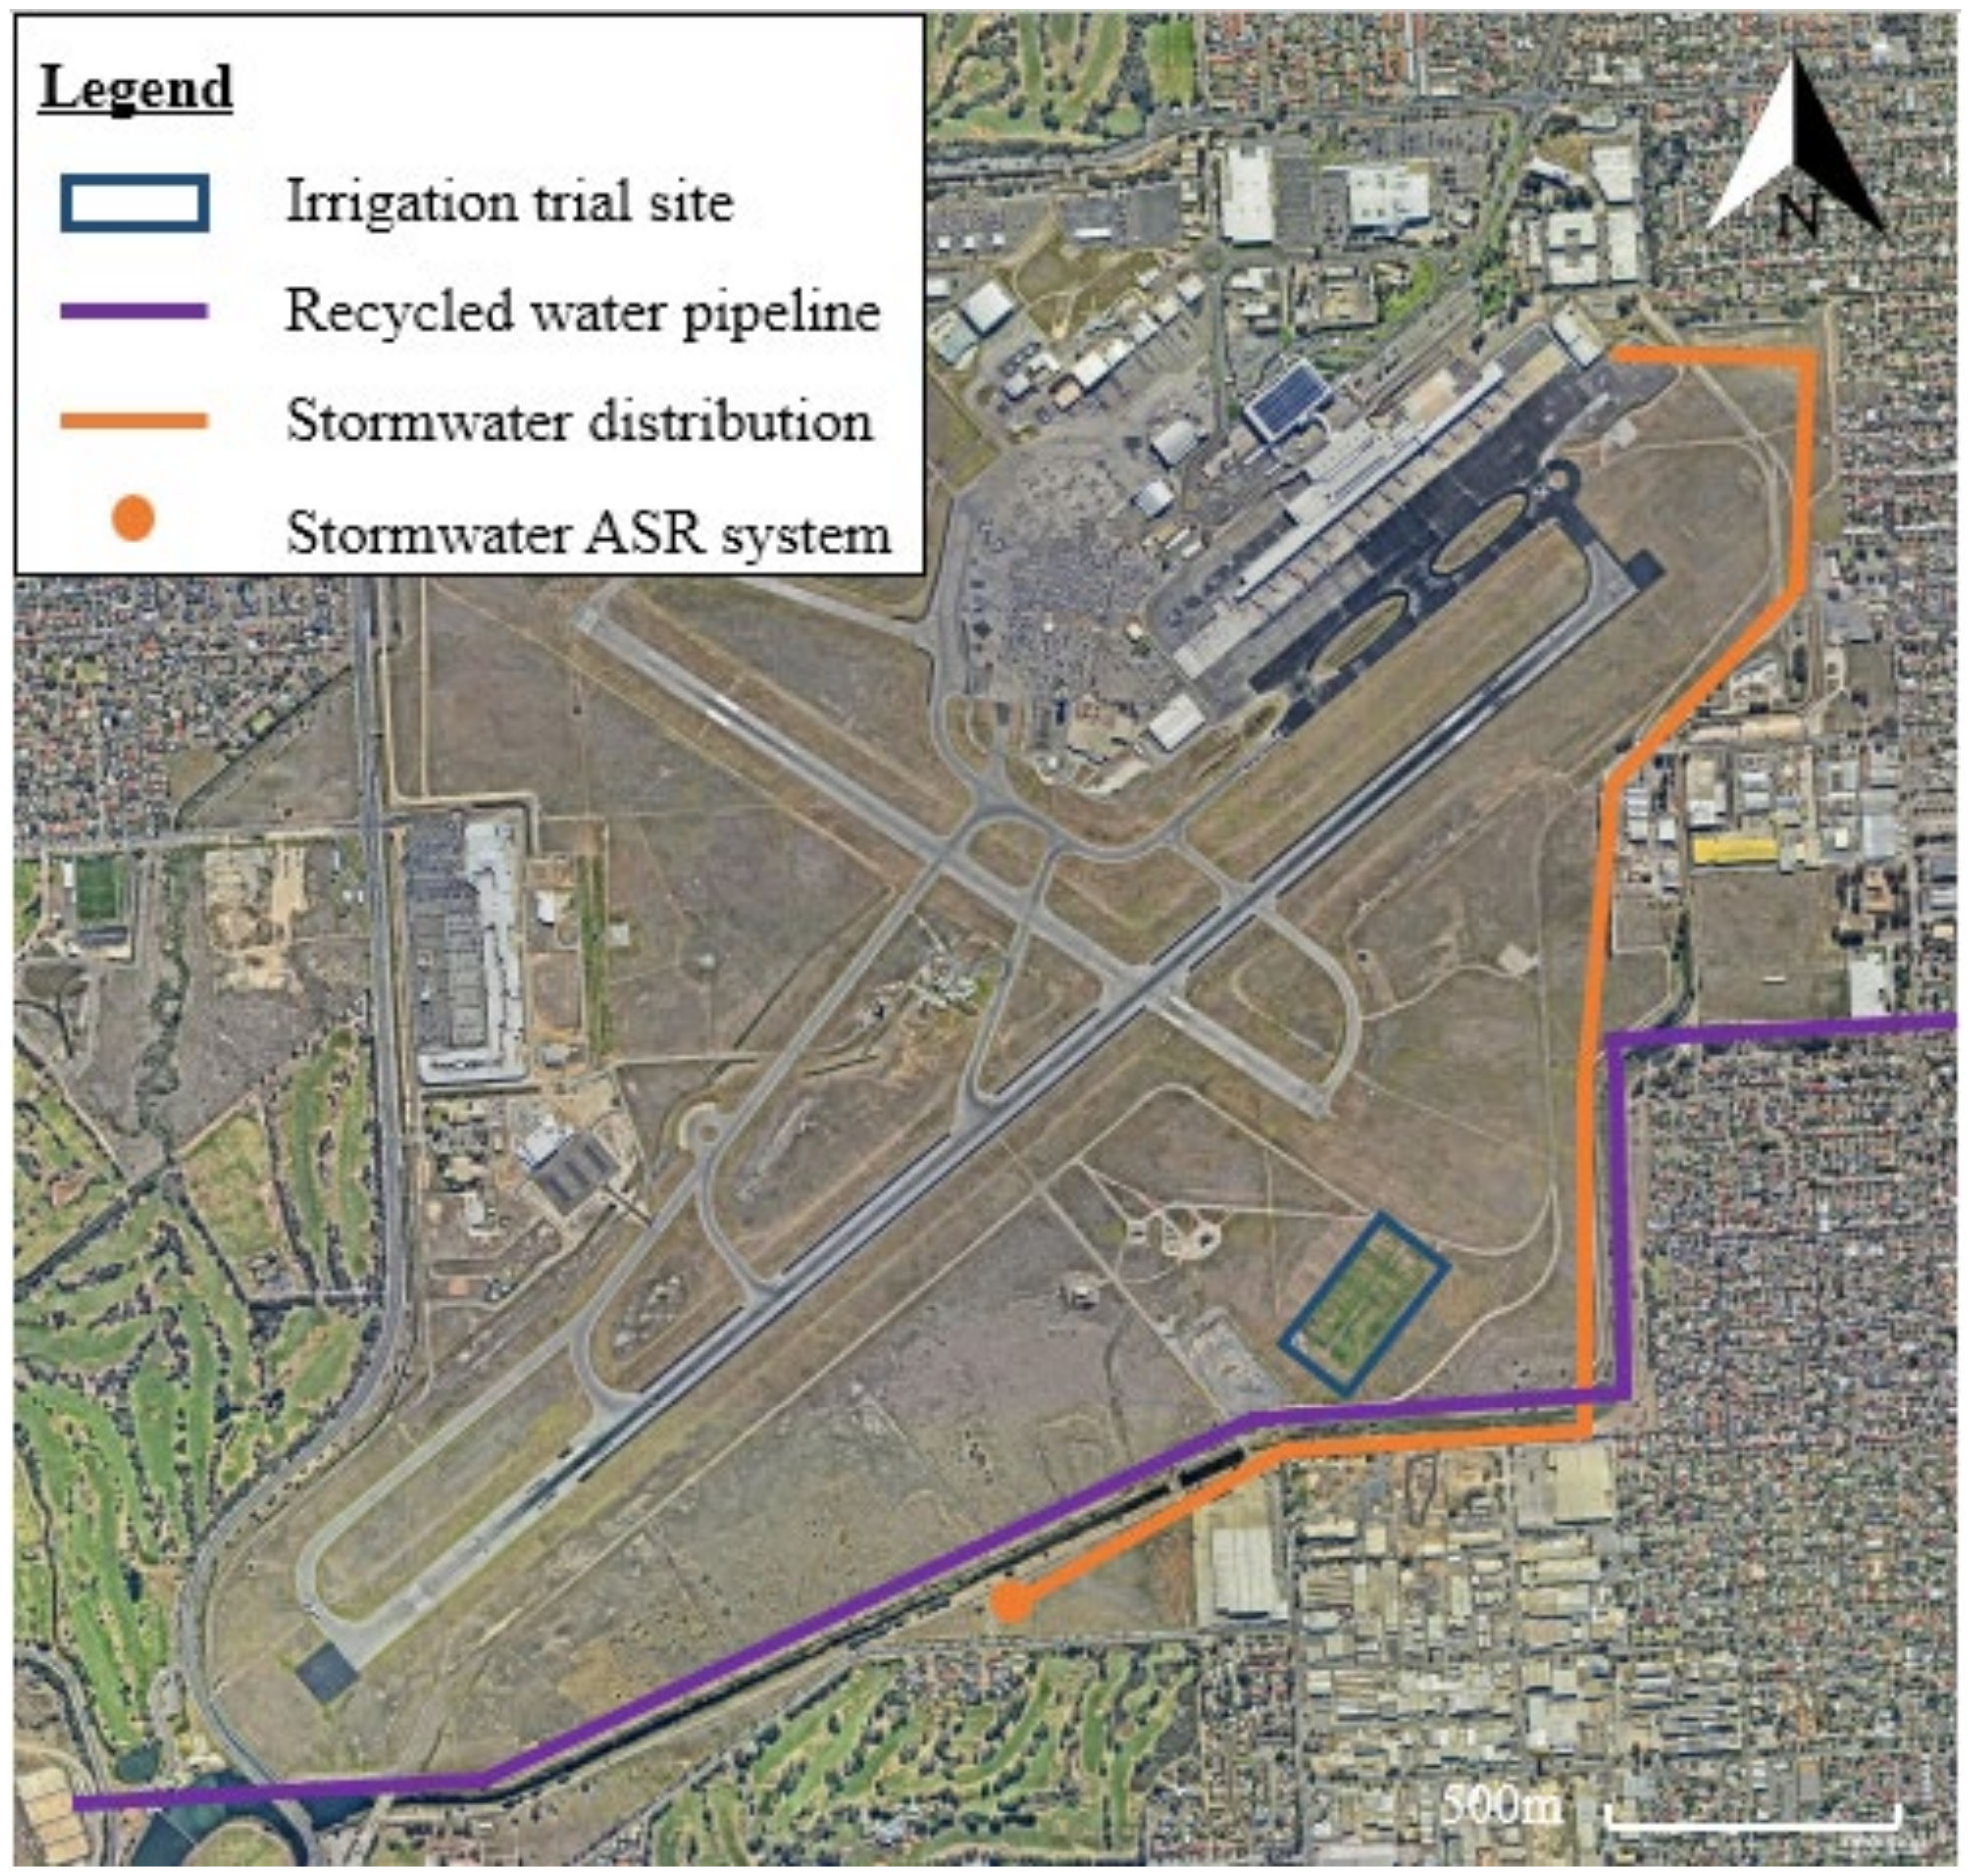
The experimental site of Adelaide Airport is located near the storm water aquifer storage and recovery (ASR) distribution network. It contains a 3.5 ha irrigation area (blue area in Figure 1) with a surrounding unirrigated control area (Figure 2). With the pressure available from the ASR distribution system pump station, the cannon sprinkler head has a radial throw of around 37 m. The irrigators are equipped with a 250 m hose reel that enables irrigation coverage of just over 3.5 ha.
Storm water distribution pipelines for the trial were connected, and the trial grass areas were established in SAW during earlier work. The first round of irrigation commenced in mid-December 2015 and continued until the end of April 2016. The second round of irrigation trial, undertaken from November 2017 to the end of May 2018, applied 5 L/m2 water over a period of four hours from 23:00 to 05:00 on specified days. Due to the potential risk of attracting birds to the airport, the irrigators were only operated during the mandatory Adelaide Airport aircraft curfew period between the hours of 23:00 and 05:00. In addition to instruments from the previous SAW trial, a network of microclimate stations was established by Monash University on and adjacent to the irrigation plot.
Relevant data were acquired by Campbell Scientific automatic weather stations (AWS), a Hobo Logger cluster and an eddy covariance (EC) system. The current study mainly focused on three important and representative areas at Adelaide Airport: the irrigated area (Figure 2), the non-irrigated area (all other grassed areas) and the runway. The three main temperature measures used were land surface temperature (LST), air temperature, and physiological equivalent temperature (PET). Air temperature is an objective measure of the atmospheric thermal environment and often used as a key measure for heat health thresholds and to characterize energy use demands in urban areas [28]. It is also important to consider human thermal comfort (e.g., PET), as it is essential for creating thermally comfortable environments and is a better indicator of heat stress than air temperature at the airport. The observation periods of each set of equipment are shown in Table 1.

2.2. Automatic Weather Stations (AWS) Analysis

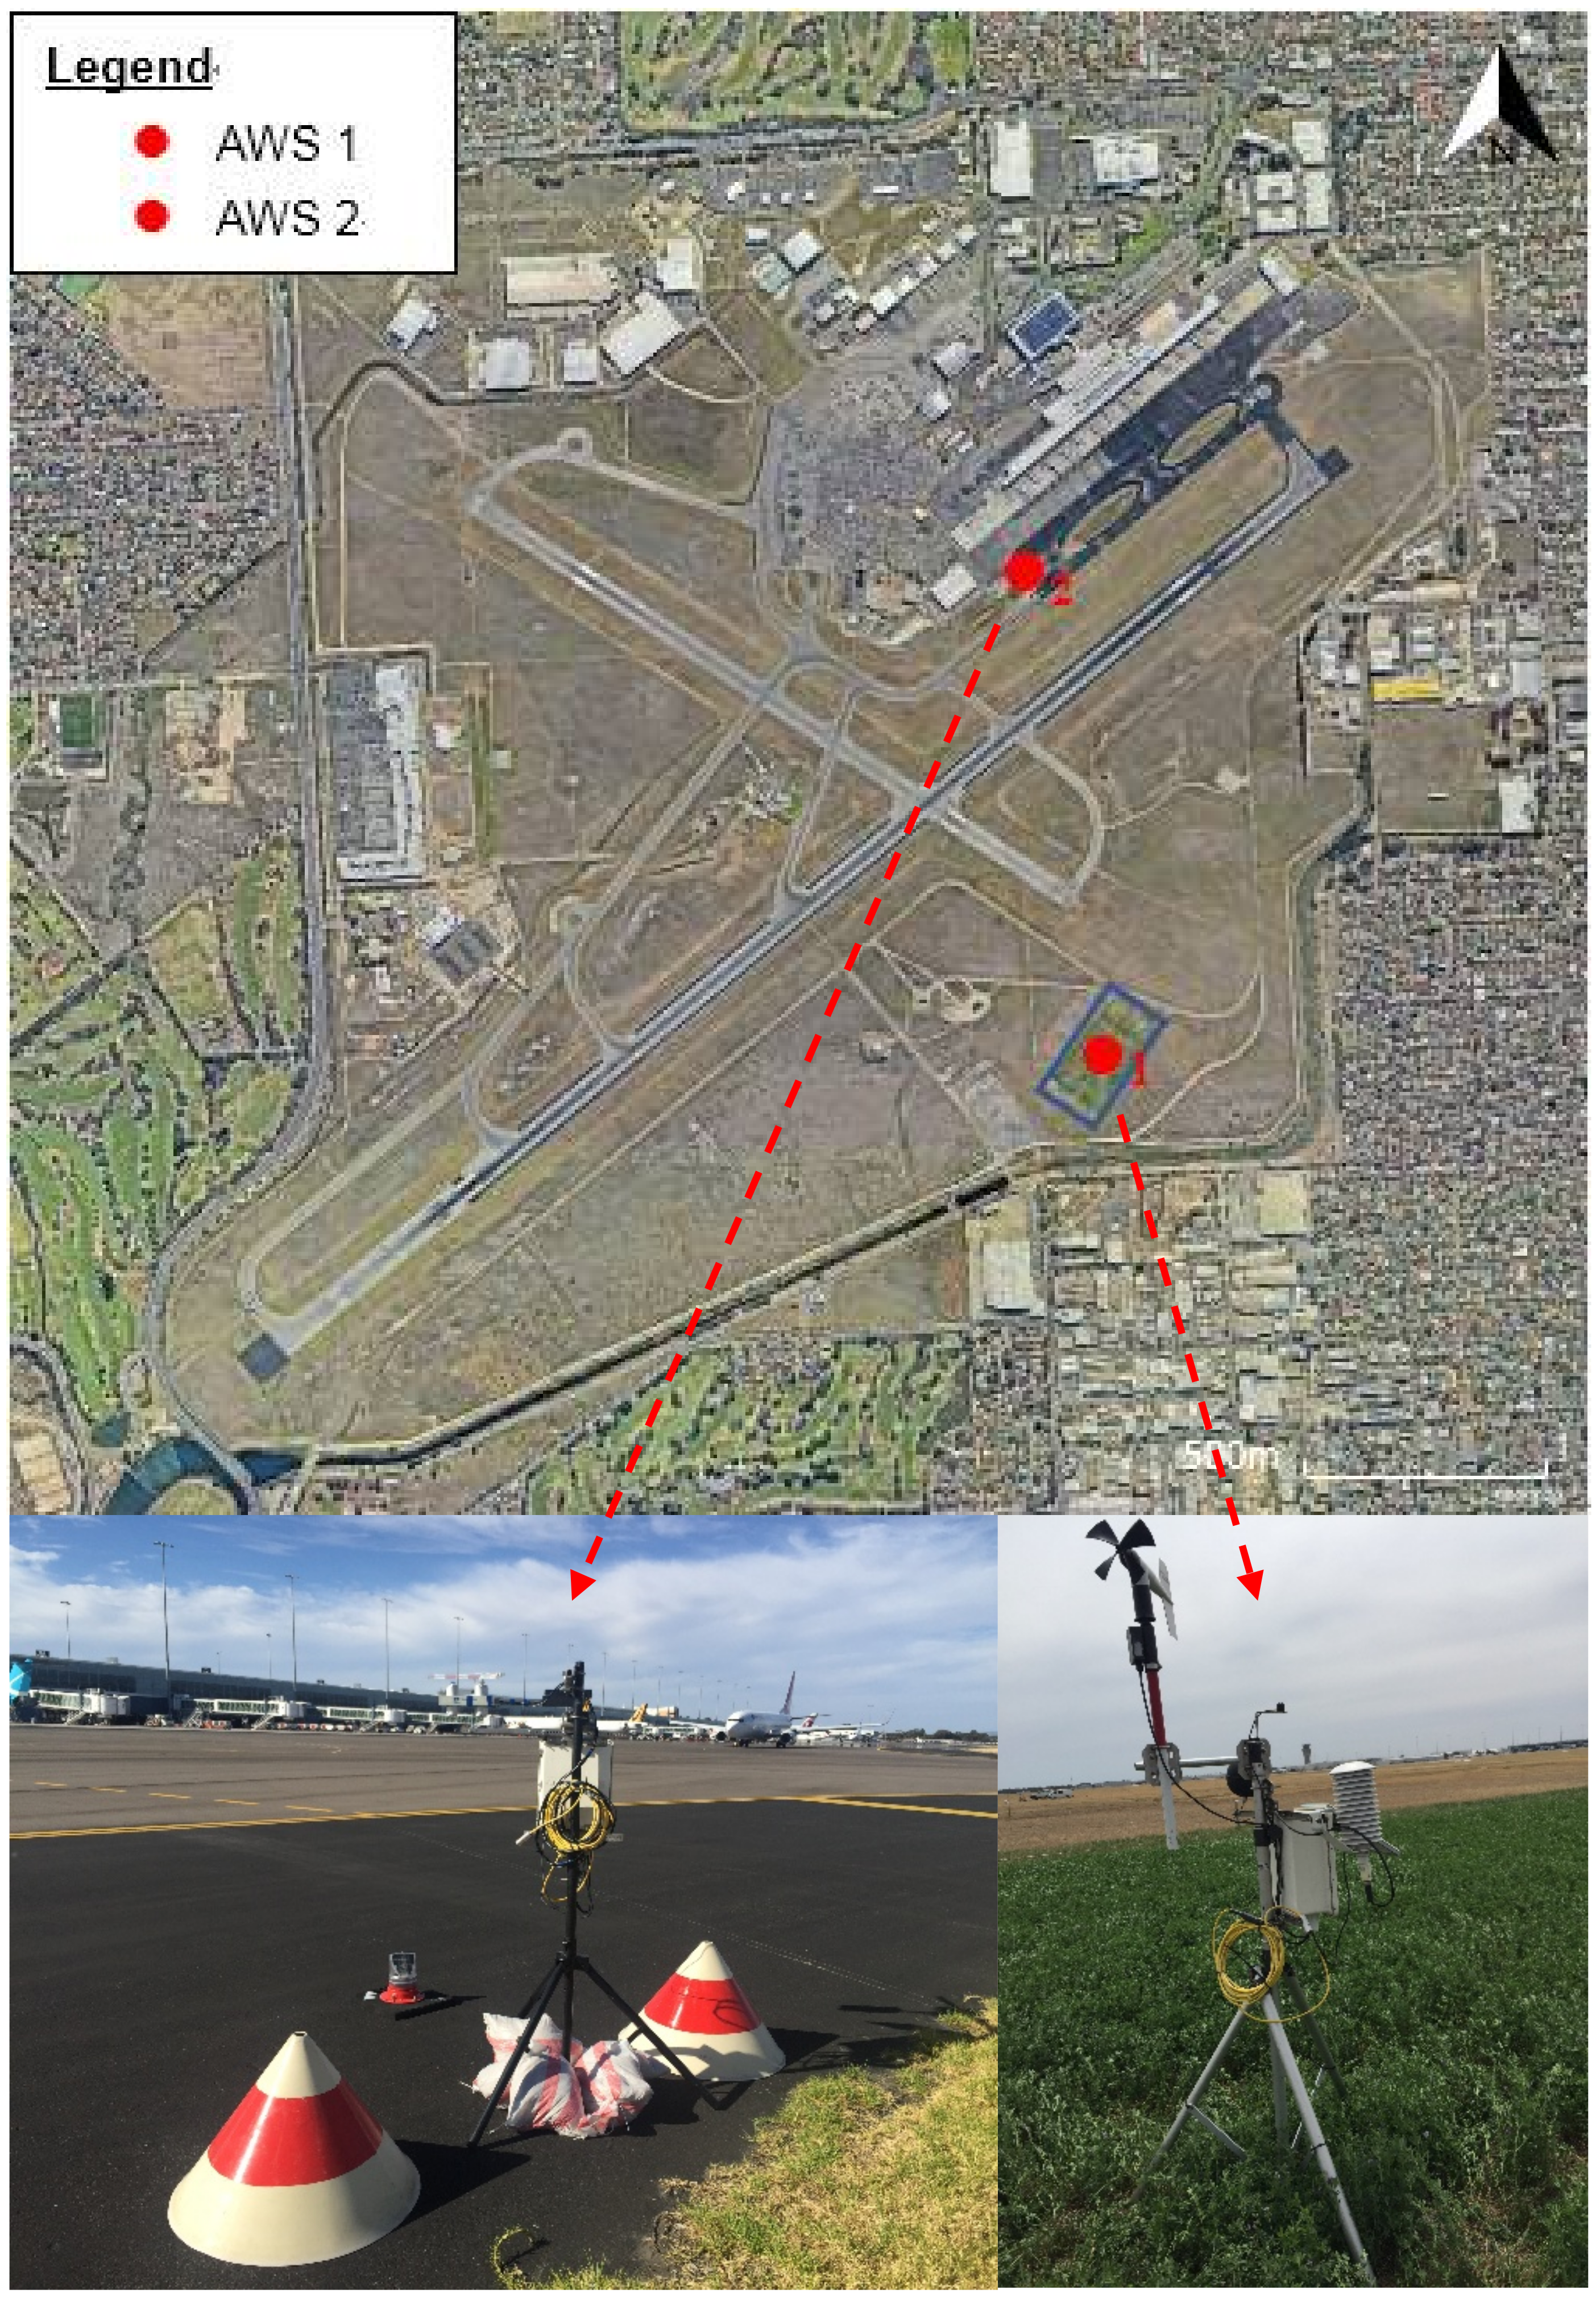
AWSs (CR1000) were used in the second trial, AWS 1 was in the middle of the irrigation area, and AWS 2 was located at the airport apron as shown in Figure 3. The daily average, daily minimum, and daily maximum air temperature/surface temperature/relative humidity along with 15 min measurements were collected and stored in the equipment. The AWS 2 on the apron was purposefully deployed with instruments that allowed for human thermal comfort (HTC) indices to be calculated close to where airport workers undertake their duties.

2.3. Hobo Logger Cluster Analysis

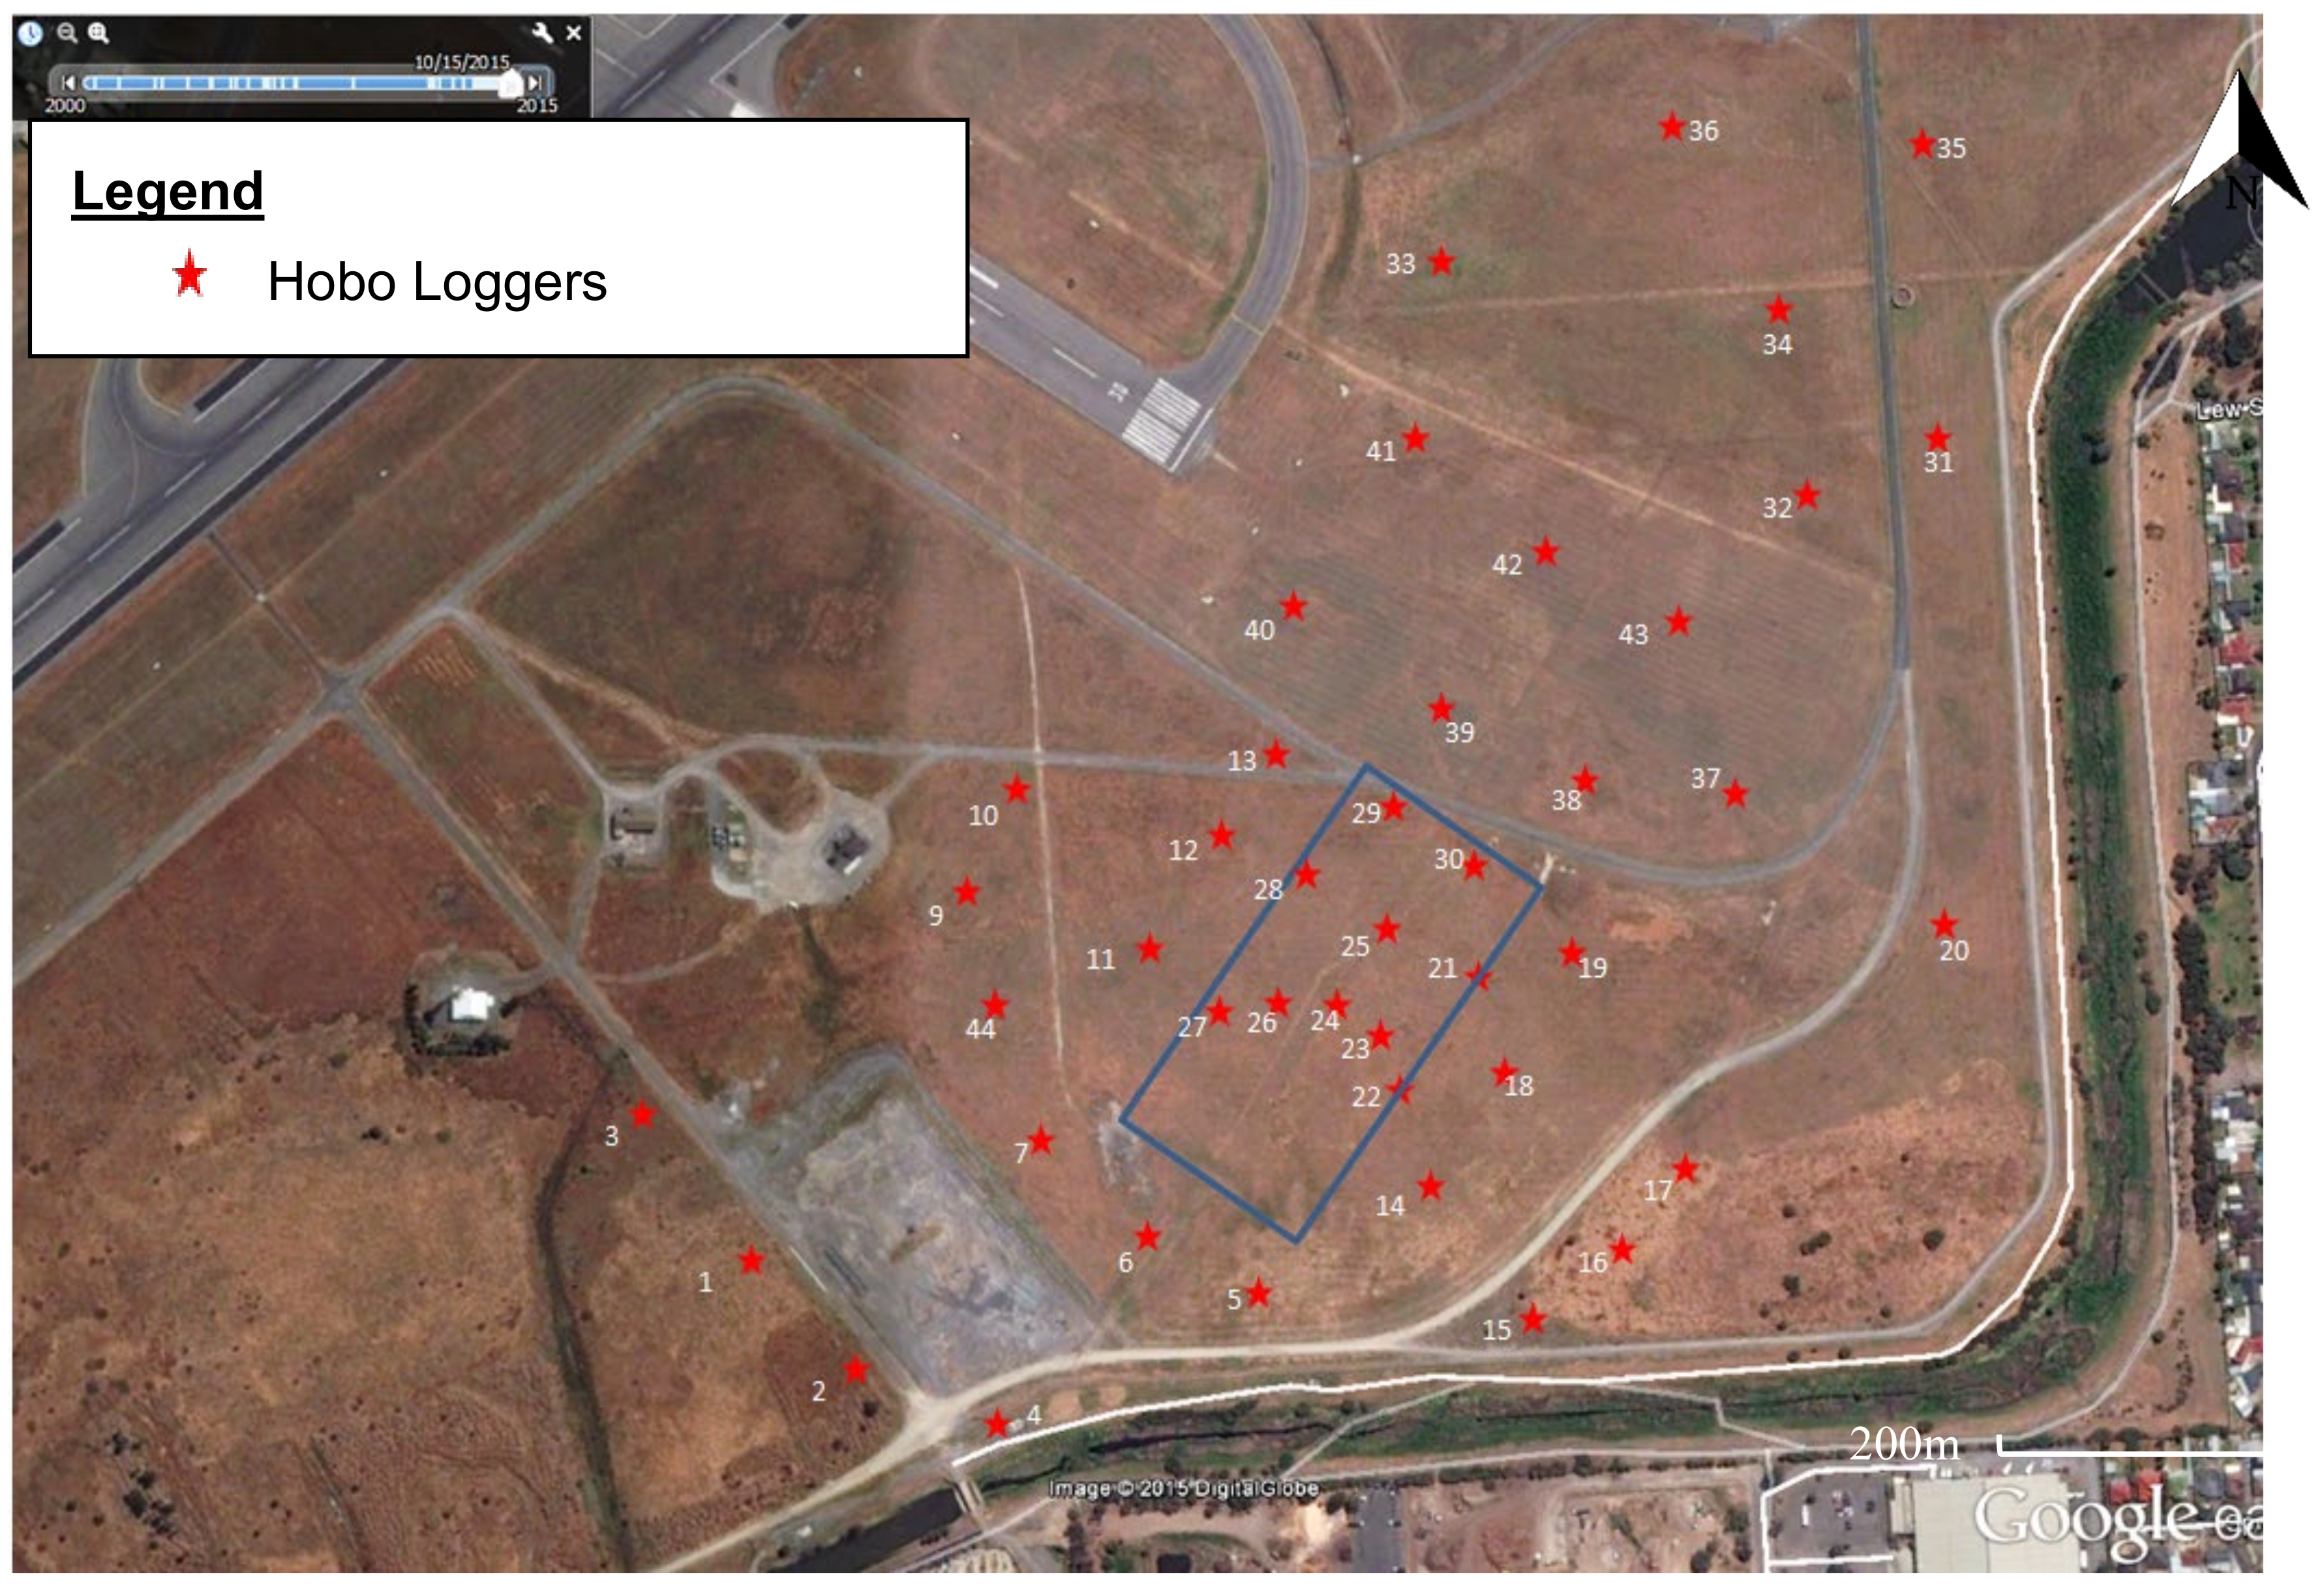
In the earlier trial (trial 1), to compare the cooling effectiveness between the irrigated and non-irrigated area, a total of 43 Hobo Logger sites were used (Figure 4) during the summer of 2015–2017. However, issues with the mounting structure caused 7 of these to have repeated failings of the mounting structure, which for air crash safety reasons, were designed to collapse easily under lateral pressure. The loggers and solar radiation shields were placed at a height of approximately 1.2 m above the ground surface. The loggers were configured to take a temperature and relative humidity reading every 5 min. Sensor data were manually downloaded monthly and stored on a PC for later analysis.

2.4. RayMan Model

In current study, physiological equivalent temperature (PET) was used as the key measure for human thermal comfort (HTC). The RayMan model was used to calculate PET [29]. Hourly average air temperature, mean radiant temperature (MRT), wind speed, and relative humidity were used to calculate hourly PET for each AWS. The mean radiant temperature was calculated from black globe temperature, air temperature and wind speed. The following variables were used for all PET calculations in this research: height = 1.75 m, weight = 75 kg, age = 35, sex = male, clothing = 0.6, and activity = 80 W. The clothing value of 0.6 is equal to somebody wearing trousers and a long-sleeved shirt.

3. Results and Discussion

3.1. Variability of Air Temperature between the Irrigated and Non-Irrigated Area

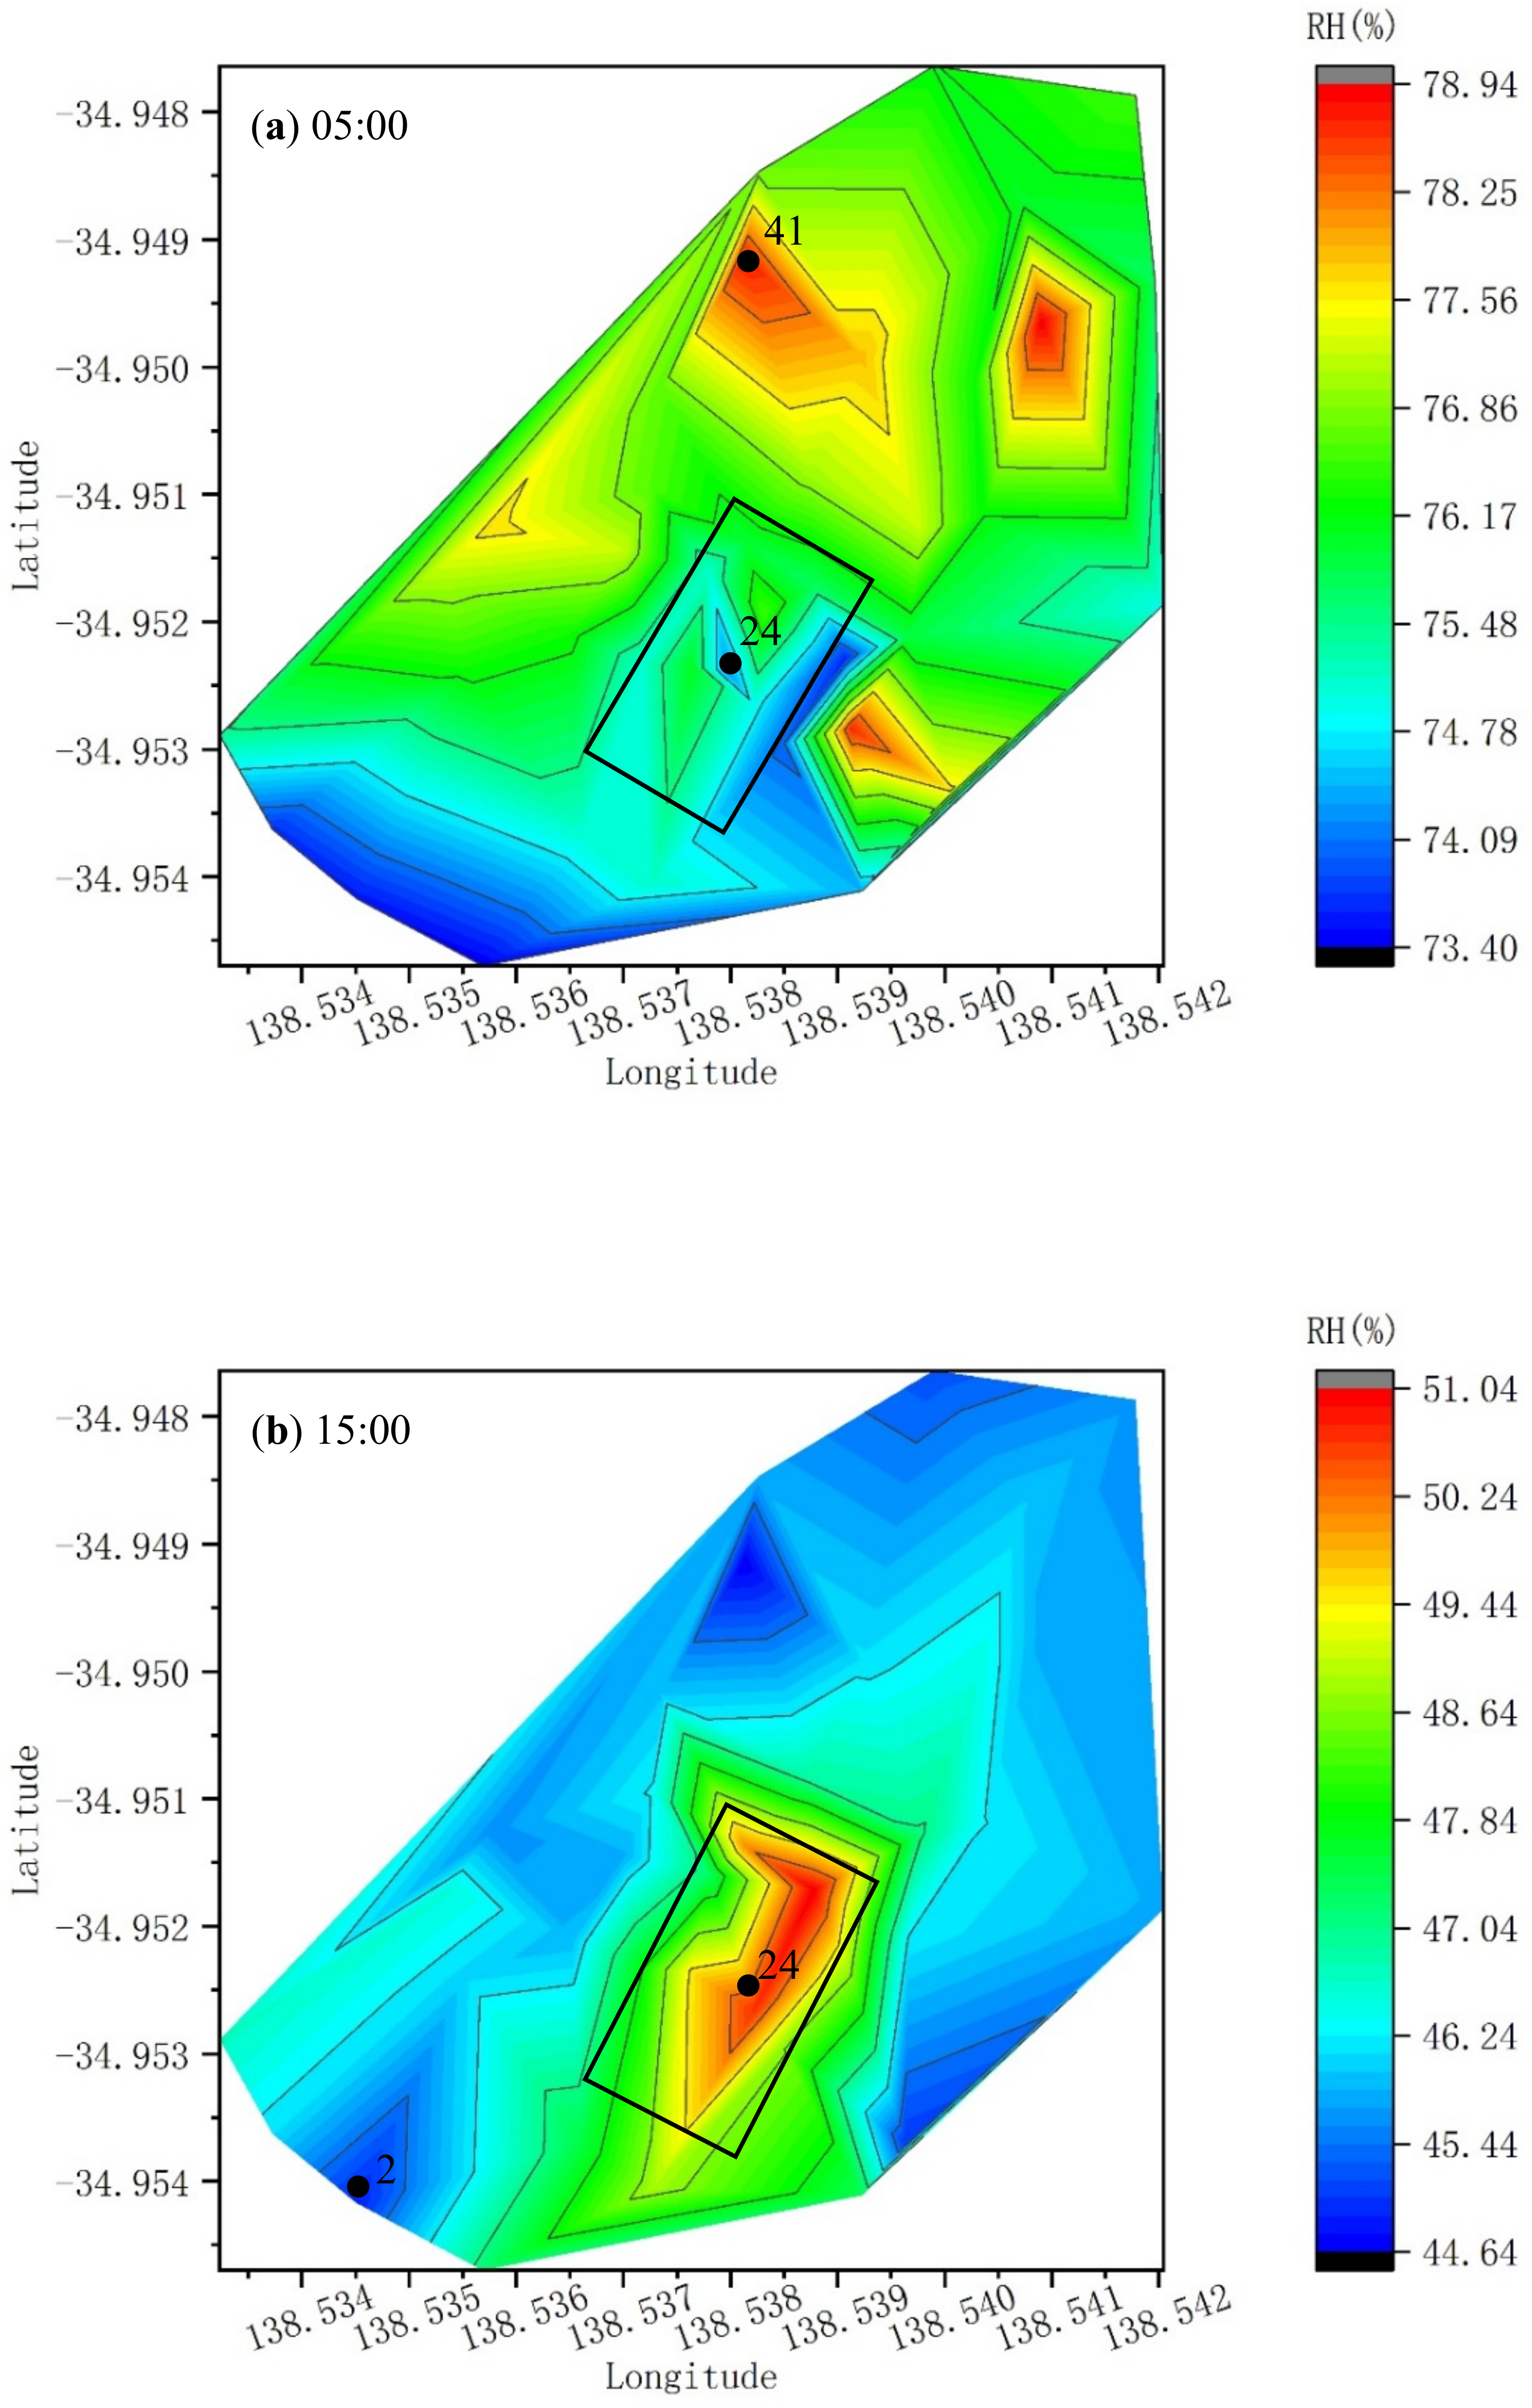
Using data collected in the first-round of trial, temperature and humidity data from 20 December 2015 to 11 April 2016 were analyzed. The contour maps of mean average air temperature and relative humidity at 1.2 m during the whole four months period at 05:00 and 15:00 are shown in Figure 5 and Figure 6 (the black rectangle is the irrigation area). The contour maps were creating by four steps: triangulation, linear interpolation, drawing of contour lines and connecting.
There was a substantial difference in air temperature and relative humidity across the site in daytime and nighttime (Table 2). At 05:00, the average air temperature was 1.4 °C warmer in the middle of the irrigation area at Hobo no. 24 than at Hobo no. 41 in the non-irrigation area, and the average relative humidity was 4.8% lower. At 15:00, the average air temperature was 1.8 °C cooler in the middle of the irrigation area at Hobo no. 24 than at Hobo no. 2 in the non-irrigation area, and the relative humidity was 5.8% higher. Previous research has found that pavement watering is an effectual approach for limiting maximum daily heat stress in urban roads, which observed maximum effects of up to 0.79 °C reduction in 1.5m air temperatures and a 4.1% increase in 1.5 relative humidity [30]. In the current study, the cooling effectiveness of irrigating the grass in buffer area in daytime and nighttime was compared. Irrigation can provide cooling and moisturizing effects in daytime, and an opposite effect in nighttime. Compared to the airport area, Lee et al. (2018) [31] conducted a study on temperature reduction by water spray systems within urban street canyons and noted that the most effective cooling area was the area just under the spray nozzles. However, in a narrow street canyon, people in the middle of the street may feel the cooling effect because of the dispersion and accumulation of cooled air. Simulations demonstrated that air under the nozzles was saturated, and this revealed that under drier conditions, the water spray systems will have a higher cooling performance. It was also found in this study that using large water droplets created a wider cooling area in the middle of the street canyon [31].
With the large number and spatial spread of Hobo loggers, the air temperature at 1.2m of each hour during the entire period of four months were analyzed. At 13:00 on 31 December 2015, the highest air temperature was 45.4 °C at Hobo no. 41, shown in Figure 7 (the black rectangle is the irrigation area). The lowest air temperature was 37.2 °C at Hobo no. 30 in the irrigation area. The difference between the highest and lowest was 8.2 °C. These observations show that irrigation can provide a significant cooling effect on extremely hot days.
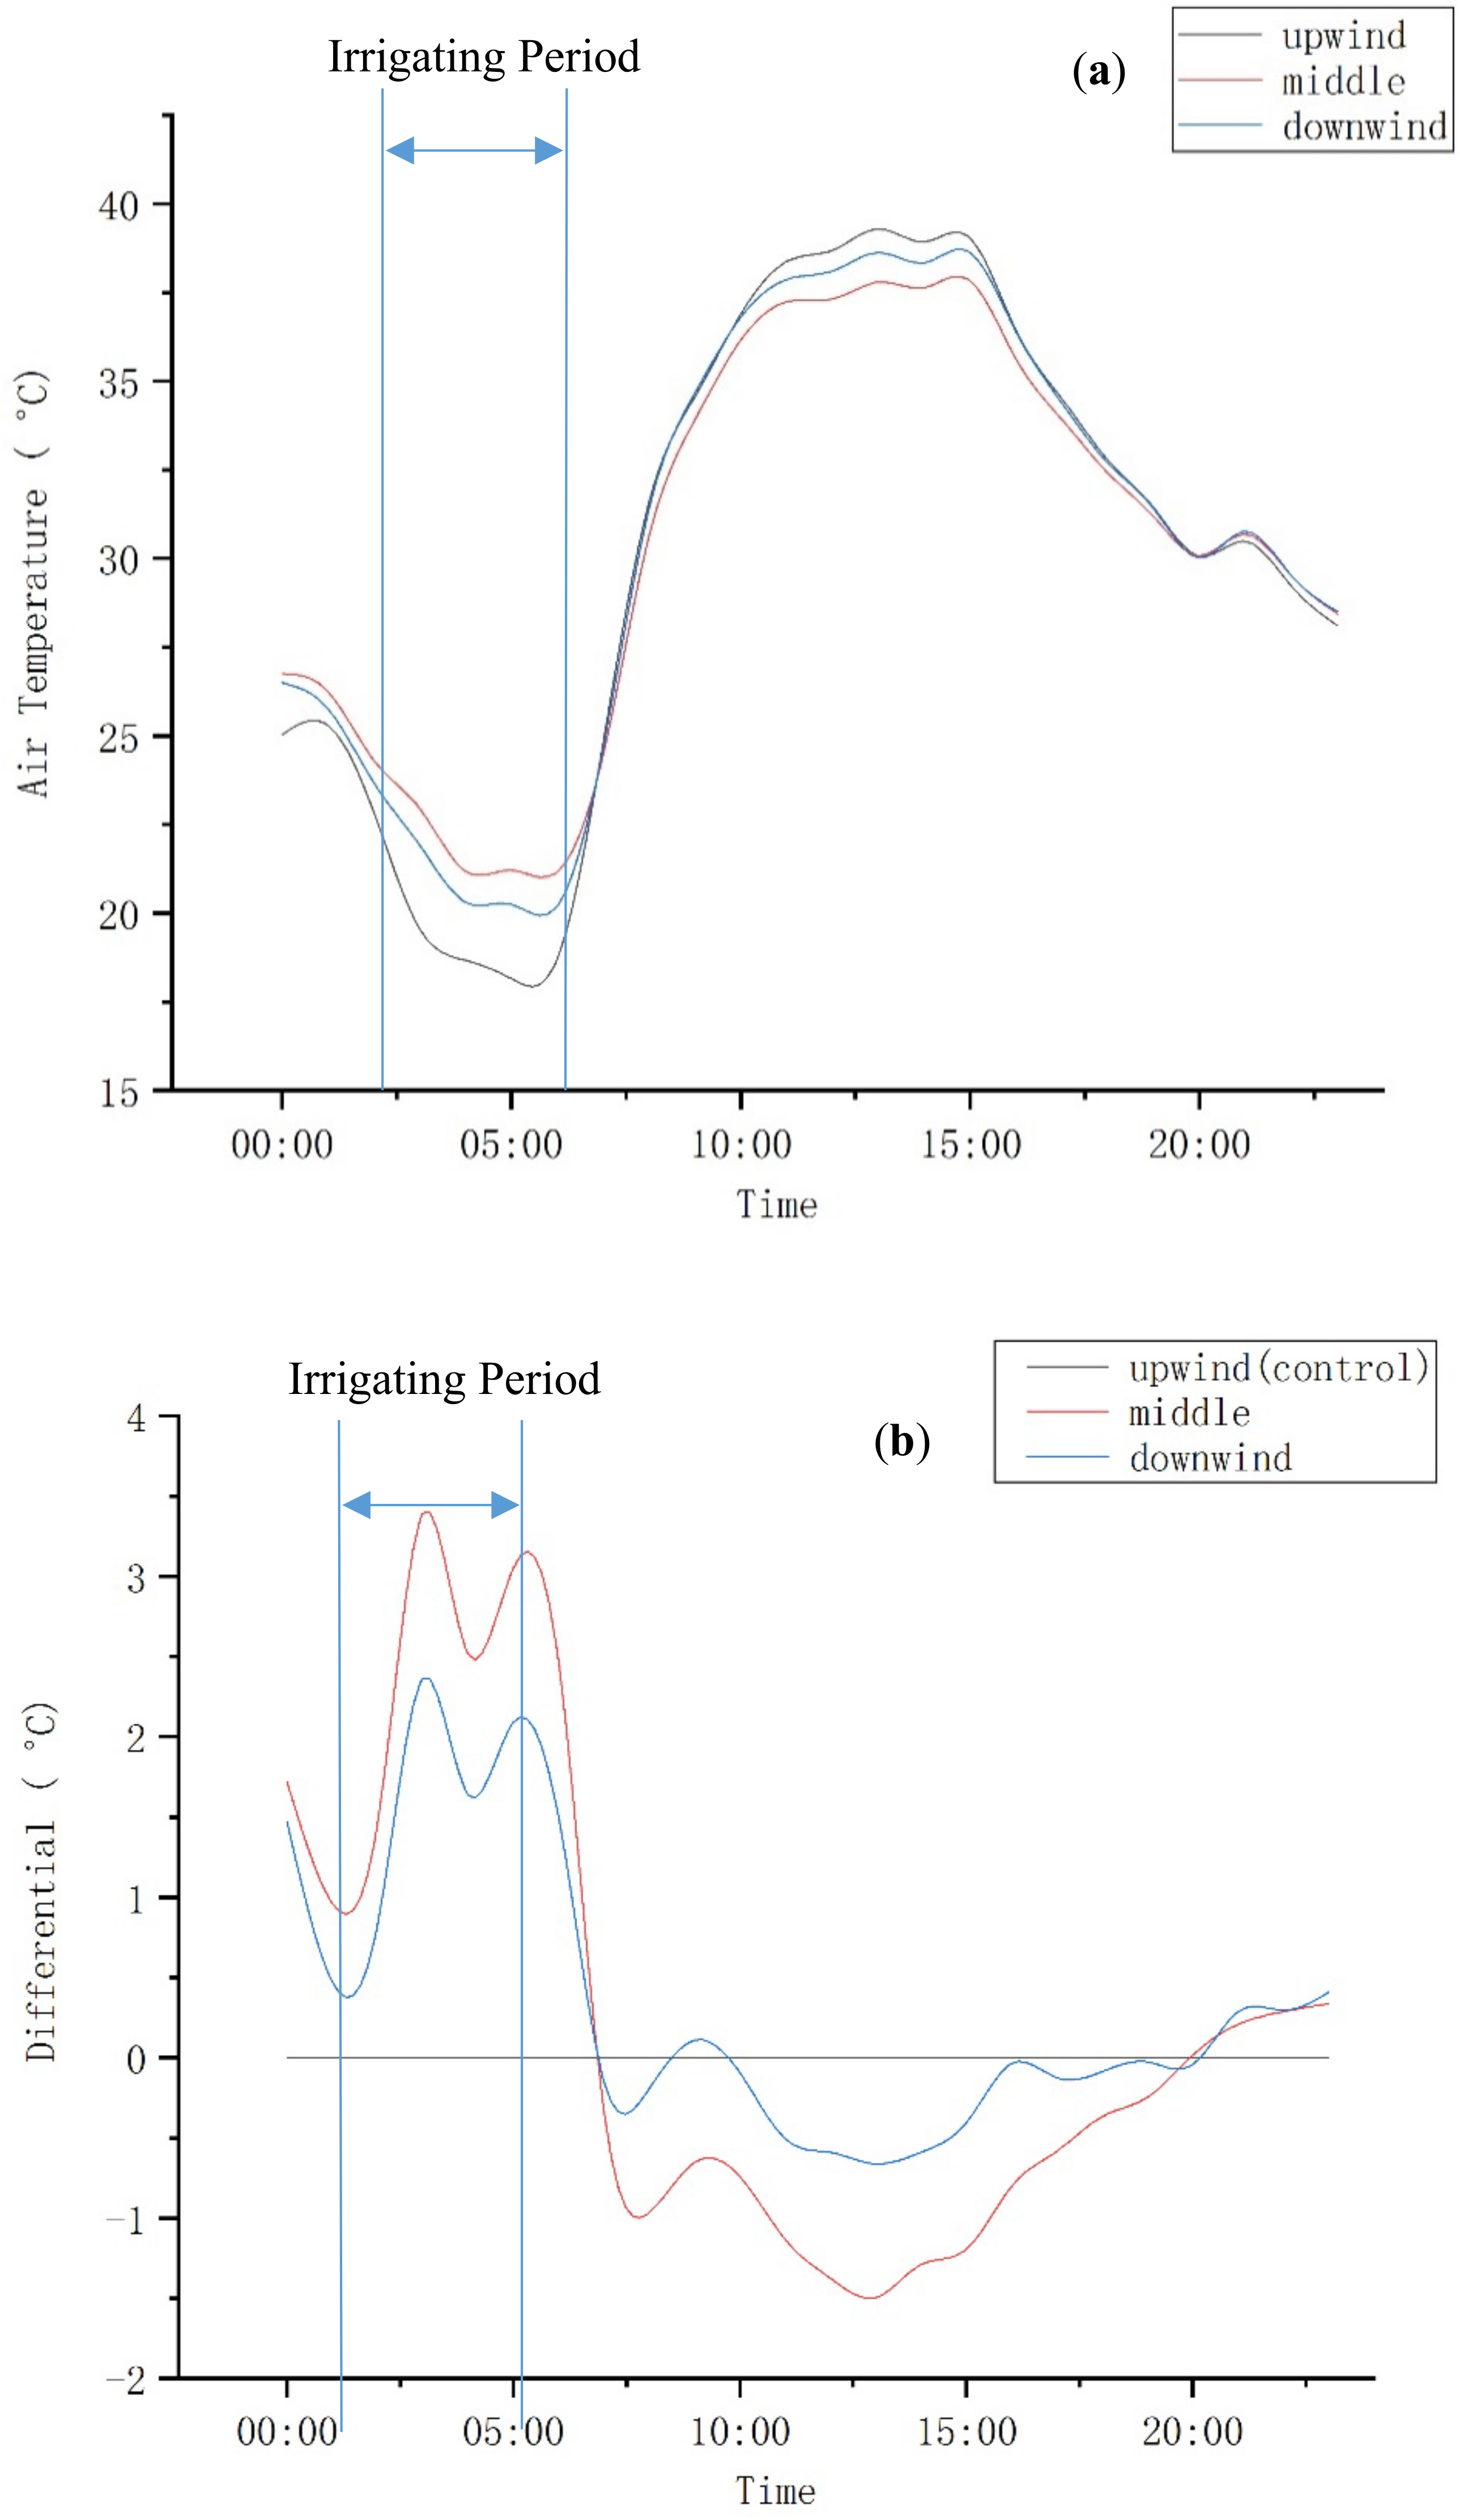
To investigate the temperature differentiation across the trial area, the hottest day was selected and assessed in detail to investigate the temperature differentiation between the irrigation and non-irrigation area. The air temperature (1.2 m above surface) and cooling effect from 00:00 to 24:00 on 31 December 2015 are shown in Figure 8. The wind direction was north-west on this day. Three sensors along a transect were used for this assessment: Hobo no. 12 upwind of the irrigation area, Hobo no. 25 in the middle of the irrigation area, and Hobo no. 19 downwind of the irrigation area (Figure 4).
There was a substantial difference in air temperature across the site on 31 December 2015. At 03:00, it was 3.4 °C warmer in the middle of the irrigation area than upwind of irrigation area and 2.4 °C warmer than downwind of the irrigation area. At 13:00, it was 1.5 °C cooler in the middle of the irrigation area than upwind of the irrigation area, and 0.8 °C cooler than downwind of the irrigation area. The temperature was much lower in the middle of irrigation area than the non-irrigation area in the daytime. In conclusion, these finding revealed that there was a substantial difference in air temperature across the site. Although there was only a limited range of cooler air, as shown by the downwind temperature being slightly higher than the middle temperature, the influence from the evapotranspiration within the irrigation area can provide a significant cooling effect for this area. The results of a previous study also generally showed a warming process and an acceleration of the atmospheric evaporative demand, which took place since the mid-1970s. The latter had a significant positive trend, while the period before the break point of the 1970s had a cooling effect. Moreover, the warming effect was more pronounced for minimum temperatures [32]. The current results are also consistent with previous work where similar trends for heat mitigation by irrigation in urban areas were reported [33,34].

3.2. Comparison of AWS Data from the Airport Apron and Irrigated Areas of Adelaide Airport

Paved surfaces play a crucial role in the daily operation of the airport because they provide areas for aircraft operation and maintenance. Land surface type (LST) measurement is a relatively straightforward way to assess the effect of land surface types (e.g., paved/built surfaces such as in a city or on an airport runway) on local climate.

3.2.1. Land Surface Temperature, Air Temperature and Relative Humidity

Land surface temperature (LST) is an effective way to capture and assess built surface temperatures with extensive spatial coverage, like a runway. Land surface temperature and air temperature are highly correlated, and, therefore, the LST is a convenient way to capture spatially comprehensive temperatures over built and/or urban surfaces [12,31]. Air temperature is an important metric because it is an objective measure of the thermal environment in urban areas. Furthermore, air temperature is often used as a key measure for heat health thresholds and to characterize energy use demands in urban areas. Land surface temperature, air temperature and humidity data above the airport apron (AWS 2) and irrigated grass (AWS 1) from 2 February 2018 to 25 February 2018 were analyzed. Figure 9 and Table 3 show the overall results from the AWS measurements during this period.
During the daytime, the average air temperature, relative humidity and land surface temperature in the apron were 29.9 °C, 31.1% and 42.8 °C, respectively. In contrast, the average air temperature, relative humidity and land surface temperature in the irrigated area were 27.8 °C, 36.5% and 31.1 °C, respectively. Between 7 and 8 February, the air temperature reached 37.9 °C, and the land surface temperature reached 56.5 °C. Comparing the land surface temperature in the runway and in the irrigated grass, on all days, the maximum land surface temperature of each day was much higher in the runway than in the irrigated grass (Figure 9). An earlier study also observed that water-sensitive urban design facilities and irrigation can reduce surface and air temperature, as described in previous research [13]. An earlier study reported that the surface temperature can drop by an average of 5.9 °C in the afternoon and increase by 2.3 °C in the morning by watering the pavement [33]. In a follow-up study, the influence of the runway by cooling the airport buffer area will be simulated by a modeling approach.

3.2.2. Physiological Equivalent Temperature (PET)

The AWSs were purposefully deployed with instruments that allowed for HTC indices to be calculated. It is important that both air temperature and HTC were considered simultaneously, as HTC indices are affected by meteorological variables other than air temperature. PET is considered as the most comprehensive bio-meteorological index to assess the outdoor human thermal environment, as it is based on the human energy balance and thermo-physiological concepts [34,35]. The physiological equivalent temperature also has the advantage of a widely known unit (°C), which makes the PET index more comprehensible [36]. HTC indices such as PET show the specific meteorological and non-meteorological processes that lead to discomfort. The data from 7 to 9 February were selected to analyze HTC (Figure 10), as these were the three sequential extremely hot days (temperature > 35 °C). At 15:00, the average PET on the runway apron was 43.7 °C and the average air temperature was 34.9 °C. The daytime PET was much larger than air temperature. The reasons that PET was significantly large are related to the fact that HTC is affected by unfavorable MRT, wind speed and relative humidity in the runway. Overall, the magnitude of PET variability was greater than air temperature, and the general pattern of PET was similar (with some notable differences) to the observed air temperature variability. Comparing the PETs among the runway and irrigated grass, the daytime (08:00–20:00) average PETs were 39.3 °C and 33.8 °C. Irrigating the grass can improve HTC in the daytime. Nevertheless, the magnitude of nighttime PET variability was found to be smaller than daytime PET, with an average range of 2.4 °C and an average daily variability of 5.5 °C.
Water-sensitive urban design features can provide positive benefits for improving HTC and thermal comfort assessment (TCA) through reductions in air temperature and surface temperature, but important enhancements can also be obtained through amplifying the effect of shade and ventilation [13,37,38]. Other studies explored the role of street trees in cooling the urban microclimate and improving HTC, and noted that street tree canopies increases the cooling effect as street canyon geometry shallows and broadens [38,39]. However, in this study, HTC has a lesser effect of shade and ventilation in the airport apron, which is an open area without trees. Thus, air temperature and surface temperature are the two major parameters for HTC in the airport apron.

4. Conclusions

The MAR captures urban runoff and stores more water underground. This has positive advantages for urban ecology and flood mitigation. Therefore, decreasing stormwater and greywater discharge into urban watercourses should undoubtedly be conducted, regardless of the thermal benefits. ASR schemes can be used to capture and store stormwater and greywater supplies. This water can then be re-integrated during heatwave conditions to provide cooling effectiveness. Findings revealed that irrigation provides cooling, and the cooling effect reduces along with the increasing instance from the middle of the irrigation area. Consistent temperature differences were observed between the irrigated and unirrigated areas at the experimental site during trial experiments. Temperature difference on extreme hot days tended to be larger, and it might be expected that this could have a significant influence on the airport operation if the entire buffer area was irrigated. It is also expected that full expansion of the irrigation area across the airside land could achieve a greater reduction in air temperature, as the influence from the current unirrigated areas could be reduced. This could be simulated and quantified in the following trials through modelling approaches. Human temperature comfort was also unfavorable in the runway, but greater improvements can be made through promotion of irrigation. The AWS data show that the peak value of PET was much larger than air temperature, which could be related to small amounts of shade in the runway. As PET is influenced by some basic weather parameters, such as air temperature, mean radiant temperature (MRT), wind speed and relative humidity, irrigating the buffer area can help improve HTC through reducing air temperature in the runway.

Author Contributions

Conceptualization, N.T. and G.I.; Methodology, J.Q., S.M., N.T. and J.X.; Software, J.Q. and J.X.; Validation, J.Q., S.M. and J.X.; Formal analysis, J.Q. and N.T.; Investigation, J.Q., N.T. and G.I.; Resources, J.X.; Data curation, J.Q. and G.I.; Writing—original draft preparation, J.Q.; Writing—review and editing, J.Q., S.M., N.T. and J.X.; Visualization, J.Q., S.M and J.X.; Supervision, N.T.; Project administration, J.Q., N.T. and G.I.; Funding acquisition, J.Q., S.M. and N.T.. All authors have read and agreed to the published version of the manuscript.

Funding

At Monash University, work was funded by the Cooperative Research Centre for Water Sensitive Cities, an Australian Government initiative, while at Southeast University, work was supported by the National Natural Science Foundation of China (grant No.41807514), Natural Science Foundation of Jiangsu Province (grant No.BK20170682), and the Priority Academic Program Development of the Jiangsu Higher Education Institution, Jiangsu Province, China.

Acknowledgments

Thanks to Leigh Burgess, Leigh Gapp and Celeste Morgan, who guided and supported us when conducting these experiments during the Adelaide Airport field campaign.

Conflicts of Interest

The authors declare no conflict of interest.

References

  1. Tapper, N.J.; Coutts, A.; Loughnan, M.; Pankhania, D. Urban population vulnerability to climate extremes: Mitigating urban heat through technology and water-sensitive urban design. In Low Carbon Cities: Transforming Urban Systems; Lehmann, S., Ed.; Routledge: England, UK, 2014; Volume 3, pp. 361–375. ISBN1 13: 978-0415729833. ISBN2 10: 0415729831. [Google Scholar]
  2. Wu, Z.; Zhang, Y. Spatial variation of urban thermal environment and its relation to green space patterns: Implication to sustainable landscape planning. Sustainability 2018, 10, 2249. [Google Scholar] [CrossRef] [Green Version]
  3. Reis, C.; Lopes, A. Evaluating the cooling potential of urban green spaces to tackle urban climate change in Lisbon. Sustainability 2019, 11, 2480. [Google Scholar] [CrossRef] [Green Version]
  4. Ma, R.; Xie, M.; Yun, W.; Zhu, D. Evaluating responses of temperature regulating service to landscape pattern based on ‘Source-Sink’ theory. Int. J. Geoinf. 2020, 9, 295. [Google Scholar] [CrossRef]
  5. Lafortezza, R.; Carrus, G.; Sanesi, G.; Davies, C. Benefits and well-being perceived by people visiting green spaces in periods of heat stress. Urban For. Urban Green. 2009, 8, 97–108. [Google Scholar] [CrossRef]
  6. Liu, B.; Lian, Z.; Brown, R.D. Effect of landscape microclimates on thermal comfort and physiological wellbeing. Sustainability 2019, 11, 5387. [Google Scholar] [CrossRef] [Green Version]
  7. Lin, Y.; Tsai, K. Screening of tree species for improving outdoor human thermal comfort in a Taiwanese city. Sustainability 2017, 9, 340. [Google Scholar] [CrossRef] [Green Version]
  8. Jiang, Y.; Song, D.; Shi, T.; Han, X. Adaptive analysis of green space network planning for the cooling effect of residential blocks in summer: A case study in Shanghai. Sustainability 2018, 10, 3189. [Google Scholar] [CrossRef] [Green Version]
  9. Lloyd, S.D.; Wong, T.H.F.; Chesterfield, C.J. Water Sensitive Urban Design—A Stormwater Management Perspective. (Industry Report No. 02/10); Cooperative Research Centre for Catchment Hydrology: Melbourne, Australia, 2002. [Google Scholar]
  10. Wong, T.H.F. Water sensitive urban design—The journey thus far. Aust. J. Water Resour. 2006, 10, 213–222. [Google Scholar] [CrossRef]
  11. Gill, S.E.; Handley, J.F.; Ennos, A.R.; Pauleit, S. Adapting cities for climate change: The role of the green infrastructure. Built Environ. 2007, 33, 115–133. [Google Scholar] [CrossRef] [Green Version]
  12. Broadbent, A.M. The Effect of Water Sensitive Urban Design and Outdoor Water-Use Practices on Urban Microclimate. Ph.D. Thesis, Monash University, Melbourne, Australia, 2016. [Google Scholar]
  13. Broadbent, A.M.; Coutts, A.M.; Tapper, N.J.; Demuzere, M.; Beringer, J. The microscale cooling effects of water sensitive urban design and irrigation in a suburban environment. Theor. Appl. Climatol. 2017, 1–23. [Google Scholar] [CrossRef]
  14. West, C.; Kenway, S.; Hassall, M.; Yuan, Z. Integrated project risk management for residential recycled-water schemes in Australia. J. Manag. Eng. 2019, 35, 04018063. [Google Scholar] [CrossRef]
  15. Freestone, R.; Baker, D. Challenges in land use planning around Australian airports. J. Air Transp. Manag. 2010, 16, 264–271. [Google Scholar] [CrossRef] [Green Version]
  16. Stevens, N.J. Land Use Planning and the Airport Metropolis. Ph.D. Thesis, Queensland University of Technology, Yabrisbane, Australia, 2012. [Google Scholar]
  17. Nicholls, N.; Alexander, L. Has the climate become more variable or extreme? Progress 1992–2006. Prog. Phys. Geogr. 2007, 31, 77–87. [Google Scholar] [CrossRef]
  18. Steffen, W.; Hughes, L.; Perkins, S. Heatwaves: Hotter, Longer, More Often. Available online: https://www.climatecouncil.org.au/uploads/9901f6614a2cac7b2b888f55b4dff9cc.pdf (accessed on 1 June 2018).
  19. Ren, D.; Dickinson, R.E.; Fu, R.; Bornman, J.F.; Guo, W.; Yang, S.; Leslie, L.M. Impacts of climate warming on maximum aviation payloads. Clim. Dynam. 2019, 52, 1711–1721. [Google Scholar] [CrossRef] [Green Version]
  20. Coffel, E.; Horton, R. Climate change and the impact of extreme temperatures on aviation. Weather Clim. So. 2015, 7, 94–102. [Google Scholar] [CrossRef]
  21. Ryley, T.; Baumeister, S.; Coulter, L. Climate change influences on aviation: A literature review. Transp. Policy 2020, 92, 55–64. [Google Scholar] [CrossRef]
  22. Coffel, E.D.; Thompson, T.R.; Horton, R.M. The impact of rising temperatures on aircraft takeoff performance. Clim. Chang. 2017, 144, 381–388. [Google Scholar] [CrossRef]
  23. Helm, L.; Molloy, R.; Lennon, L.; Clark, R.; Barton, A.; Dillon, P. Potential for harvesting Adelaide stormwater via managed aquifer recharge: Preliminary assessment of the influence of urban open space. In CSIRO Water for a Healthy Country Flagship Report to National Water Commission for Raising National Water Standards Project: Facilitating Recycling of Stormwater and Reclaimed Water via Aquifers in Australia—Milestone Report 3.3.3; Commonwealth Scientific and Industrial Research Organization (CSIRO): Adelaide, Australia, 2009; Available online: http://www.clw.csiro.au/publications/waterforahealthycountry/2009/wfhc-MAR-policy-design-milestone3.3.3.pdf (accessed on 1 January 2018).
  24. Robert, M.; Lauren, H.; Peter, D. Facilitating recycling of stormwater and reclaimed water via aquifers in Australia. In Milestone Report 4.3.1—Follow up Report for Opportunity Assessment (Mapping) Component; National Water Commission: Kingston, Jamaica; Government of Australia: Canberra, Australia, 2009. [Google Scholar]
  25. Newland, P.Q. The development, application and acceptance of environmental and health risk assessment methodology for mar schemes in South Australia. Environ. Earth Sci. 2015, 73, 1–7. [Google Scholar] [CrossRef]
  26. Bureau of Meteorology. Available online: http://www.bom.gov.au/climate/data/ (accessed on 1 June 2019).
  27. Oke, T. Boundary Layer Climates; Methuen: London, UK, 1987. [Google Scholar]
  28. Stewart, I.D.; Oke, T.R. Local climate zones for urban temperature studies. Bull. Am. Meteorol. Soc. 2012, 93, 1879–1900. [Google Scholar] [CrossRef]
  29. Matzarakis, A.; Rutz, F.; Mayer, H. Modelling radiation fluxes in simple and complex environments-application of the RayMan model. Int. J. Biometeorol. 2007, 51, 323–334. [Google Scholar] [CrossRef]
  30. Hendel, M.; Gutierrez, P.; Colombert, M.; Diab, Y.; Royon, L. Measuring the effects of urban heat island mitigation techniques in the field: Application to the case of pavement-watering in Paris. Urban Clim. 2016, 16, 43–58. [Google Scholar] [CrossRef]
  31. Lee, Y.; Chang, T.; Hsieh, C. A numerical study of the temperature reduction by water spray systems within urban street canyons. Sustainability 2018, 10, 1190. [Google Scholar]
  32. Elferchichi, A.; Giorgio, G.A.; Lamaddalena, N.; Ragosta, M.; Telesca, V. Variability of temperature and its impact on reference evapotranspiration: The test case of the Apulia region (Southern Italy). Sustainability 2017, 9, 2337. [Google Scholar] [CrossRef] [Green Version]
  33. Hendel, M.; Royon, L. The effect of pavement-watering on subsurface pavement temperatures. Urban Clim. 2015, 14, 650–654. [Google Scholar] [CrossRef] [Green Version]
  34. Wang, C.; Wang, Z.; Yang, J. Urban water capacity: Irrigation for heat impact. Comput. Environ. Urban Syst. 2019, 78, 101397. [Google Scholar] [CrossRef]
  35. Santos Nouri, A.; Charalampopoulos, I.; Matzarakis, A. Beyond singular climatic variables—Identifying the dynamics of wholesome thermo-physiological factors for existing/future human thermal comfort during hot dry Mediterranean summers. Int. J. Environ. Res. Public Health 2018, 15, 2362. [Google Scholar] [CrossRef] [Green Version]
  36. Charalampopoulos, I. A comparative sensitivity analysis of human thermal comfort indices with generalized additive models. Appl. Clim. 2019, 137, 1605–1622. [Google Scholar] [CrossRef]
  37. Potchter, O.; Cohen, P.; Lin, T.P.; Matzarakis, A. Outdoor human thermal perception in various climates: A comprehensive review of approaches, methods and quantification. Sci. Total Environ. 2018, 631, 390–406. [Google Scholar] [CrossRef]
  38. Kiil, M.; Simson, R.; Thalfeldt, M.; Kurnistski, J. A comparative study on cooling period thermal comfort assessment in modern open office landscape in Estonia. Atmosphere 2020, 11, 127. [Google Scholar] [CrossRef] [Green Version]
  39. Coutts, A.M.; White, E.C.; Tapper, N.J.; Beringer, J.; Livesley, S.J. Temperature and human thermal comfort effects of street trees across three contrasting street canyon environments. Theor. Appl. Climatol. 2016, 124, 55–68. [Google Scholar] [CrossRef]
Figure 1. The influence of temperature on aircraft (Retrieved from https://www.nytimes.com/2017/06/20/business/flying-climate-change.html).
Sustainability 12 08123 g001
Figure 2. Irrigation trial site in relation to the Adelaide Airport land parcel (Adapted from Nearmap, 2017).
Sustainability 12 08123 g002
Figure 3. The location of AWS sites during the second trial (the irrigation area is located within the blue rectangle) (Adapted from Nearmap, 2017).
Sustainability 12 08123 g003
Figure 4. The location of Hobo Loggers during the 2015–2017 trial (irrigation area located within the blue rectangle) (Adapted from Google map, 2015).
Sustainability 12 08123 g004
Figure 5. Contour maps of average 05:00 (a) and 15:00 (b) air temperature (°C) for the irrigated portion of Adelaide airport for the period of from 20 December 2015 to 11 April 2016.
Sustainability 12 08123 g005
Figure 6. Contour maps of average 05:00 (a) and 15:00 (b) relative humidity (%) for the irrigated portion of Adelaide airport for the period of from 20 December 2015 to 11 April 2016
Sustainability 12 08123 g006
Figure 7. Contour map of air temperature (°C) at 13:00 at Adelaide airport (on 31 December 2015).
Sustainability 12 08123 g007
Figure 8. Temperature (a) and differential (b) from upwind to downwind between the irrigation and non-irrigation area (on 31 December 2015).
Sustainability 12 08123 g008
Figure 9. Relative humidity (a), air temperature (b), and land surface temperature (c) data from 2 February 2018 to 25 February 2018 of AWS 1 and 2.
Sustainability 12 08123 g009
Figure 10. Physiological equivalent temperature (PET) in the runway and grass from 7 February 2018 to 9 February 2018.
Sustainability 12 08123 g010
Table 1. A summary of the observation periods.
No.EquipmentDateNote
1Hobo Loggers 1–438 December 2015–11 April 2016First round trial
2AWS 1–21 February 2018–1 March 2018Second round trial
Table 2. Averages over the observation period of from 20 December 2015 to 11 April 2016.
StationAir Temperature (°C)Relative Humidity (%)
05:00Hobo no. 2417.274.0
Hobo no. 4115.878.8
Difference1.44.8
15:00Hobo no. 2425.250.7
Hobo no. 227.044.9
Difference1.85.8
Table 3. A summary of the observations from AWS 1 & 2.
TitleAir Temperature (°C)Land Surface Temperature (°C)Relative Humidity (%)
ApronIrrigated GrassApronIrrigated GrassApronIrrigated Grass
Whole period average23.723.631.623.151.657.3
Daytime average25.524.937.427.947.052.3
Daytime average (max temperature over 30 °C)29.927.842.831.131.136.5
Maximum37.937.256.543.593.795.5
Minimum11.013.717.68.216.319.4