Article

Identifying the Major Construction Wastes in the Building Construction Phase Based on Life Cycle Assessments

1
Department of Architectural Engineering, Kangwon National University, Samcheok 25913, Korea
2
GREENers, Ansan 15455, Korea
3
School of Architecture, Kumoh National Institute of Technology, Gumi 39177, Korea
4
Department of Civil Engineering, Kangwon National University, Samcheok 25913, Korea
*
Authors to whom correspondence should be addressed.
Sustainability 2020, 12(19), 8096; https://doi.org/10.3390/su12198096
Submission received: 3 August 2020 / Revised: 9 September 2020 / Accepted: 23 September 2020 / Published: 1 October 2020

Abstract

:
The purpose of this study was to identify the major wastes generated during the construction phase using a life cycle assessment. To accomplish this, the amount of waste generated in the construction phase was deduced using the loss rate and weight conversions. Major construction wastes were assessed using six comprehensive environmental impact categories, including global warming potential, abiotic depletion potential, acidification potential, eutrophication potential, ozone depletion potential, and photochemical ozone creation potential. According to the analysis results, five main construction wastes—concrete, rebar, cement, polystyrene panel, and concrete block—comprehensively satisfied the 95% cutoff criteria for all six environmental impact categories. The results of the environmental impact characterization assessment revealed that concrete, concrete block, and cement waste accounted for over 70% of the contribution level in all the environmental impact categories except resource depletion. Insulation materials accounted for 1% of the total waste generated but were identified by the environmental impact assessment to have the highest contribution level.

1. Introduction

In 2015, South Korea attended the 21st Conference of the Parties (COP21) at the United Nations Framework Convention on Climate Change (UNFCCC) held in Paris, France, and declared their Intended Nationally Determined Contributions (INDC) to voluntarily reduce greenhouse gas emissions by 37% by 2030. Meanwhile, the construction industry has been regarded as a key area with excellent potential to reduce greenhouse gases and contribute to achieving the national greenhouse gas reduction goals [1,2,3,4,5,6]. Since the importance of reducing waste in the construction industry has been recognized, there has been increasing interest in life cycle assessments of environmental impacts spanning from the production and construction phases to the demolition phases. Considering the progression of global warming, reducing the environmental load of the construction sector is essential in decreasing its environmental impact [7,8,9,10].
Efforts are actively being made to develop eco-friendly construction production systems that minimize the environmental load from a life cycle perspective by reducing waste and greenhouse gas emissions from buildings [11,12,13]. Studies on the demolition phase, such as separating demolition items to minimize waste and maximize recycling rates, and establishing databases for waste units, are conducted within the construction industry. Studies on the construction phase, on the other hand, fail to keep up with the demolition phase due to frequent design changes that make it difficult for the amount of generated waste and environmental load to be controlled [14,15,16].
In particular, the construction phase prefers discharging its waste altogether rather than separately storing and discharging the waste materials to minimize the disposal costs and clean construction site management of narrow spaces. Mixed construction waste should be separated according to the characteristics of each piece and be accompanied by more appropriate and detailed treatments, such as recycling, incineration, and landfill. When two or more types of construction waste are mixed, the combination is classified as mixed construction waste. According to the Korean Ministry of Environment’s guidelines on the standards and methods for the disposal of construction waste, mixed construction waste will have less than a 5% mixture rate of non-flammable and other waste in terms of the weight. However, the amount of mixed waste at the construction site is increasing due to the mixing of small amounts of foreign substances creating large quantities of mixtures, as the method of inspecting construction wastes is only visual. The main reason is that there are few cases where separate discharge obligations are fulfilled at construction sites since supervision and regulation for those failing to discharge separate emissions are not normally carried out [17,18].
The mixed construction waste generated in this way is transported by waste collection and transportation companies, waste intermediate treatment companies, and waste recycling companies. However, regarding mixed construction waste, many types of construction waste are in this mixture, and high-quality construction waste that can be recycled is not completely reclassified and is being landfilled or incinerated [19,20]. This passive classification and management of mixed construction waste at the construction stage, which relies solely on the intermediate waste disposal companies, serves as a factor hindering the efforts to reduce waste at those sites. As a result, it not only lowers the potential for recycling various wastes but also makes it difficult to manage special waste, such as designated wastes. In addition, it is difficult to establish a management plan based on the amount of generated waste and its environmental impact due to the nature of the waste, thus hindering efficient environmental management. Selective waste management during the construction phase will not only contribute to the establishment of an eco-friendly construction production system that minimizes waste and maximizes recycling rates but will also provide economic benefits [21,22,23].
Therefore, the purpose of this study was to determine the major wastes generated during the construction phase from the perspective of an environmental impact evaluation by applying the life cycle assessment method.
The major construction wastes were determined through a life cycle assessment in two steps: calculating the amount of the generated waste and using that calculation to determine the major construction wastes for six types of environmental impacts. To achieve this, the quantities of generated waste were analyzed using the material loss rates and weight conversion factors. The loss rates were taken from research reports on the standard of estimation for construction projects, construction waste separation, and the generation units published by the Korea Institute of Construction Technology and the Ministry of Land, Infrastructure, and Transport in 2017 [24,25]. The weight conversion factors from the standard of estimation for construction projects were used to standardize the specifications of various materials. The materials requiring specific management were determined based on the calculated amounts of construction waste generated and through a comprehensive analysis of six types of environmental impacts: global warming potential (GWP), abiotic depletion potential (ADP), acidification potential (AP), eutrophication potential (EP), ozone depletion potential (ODP), and photochemical ozone creation potential (POCP).

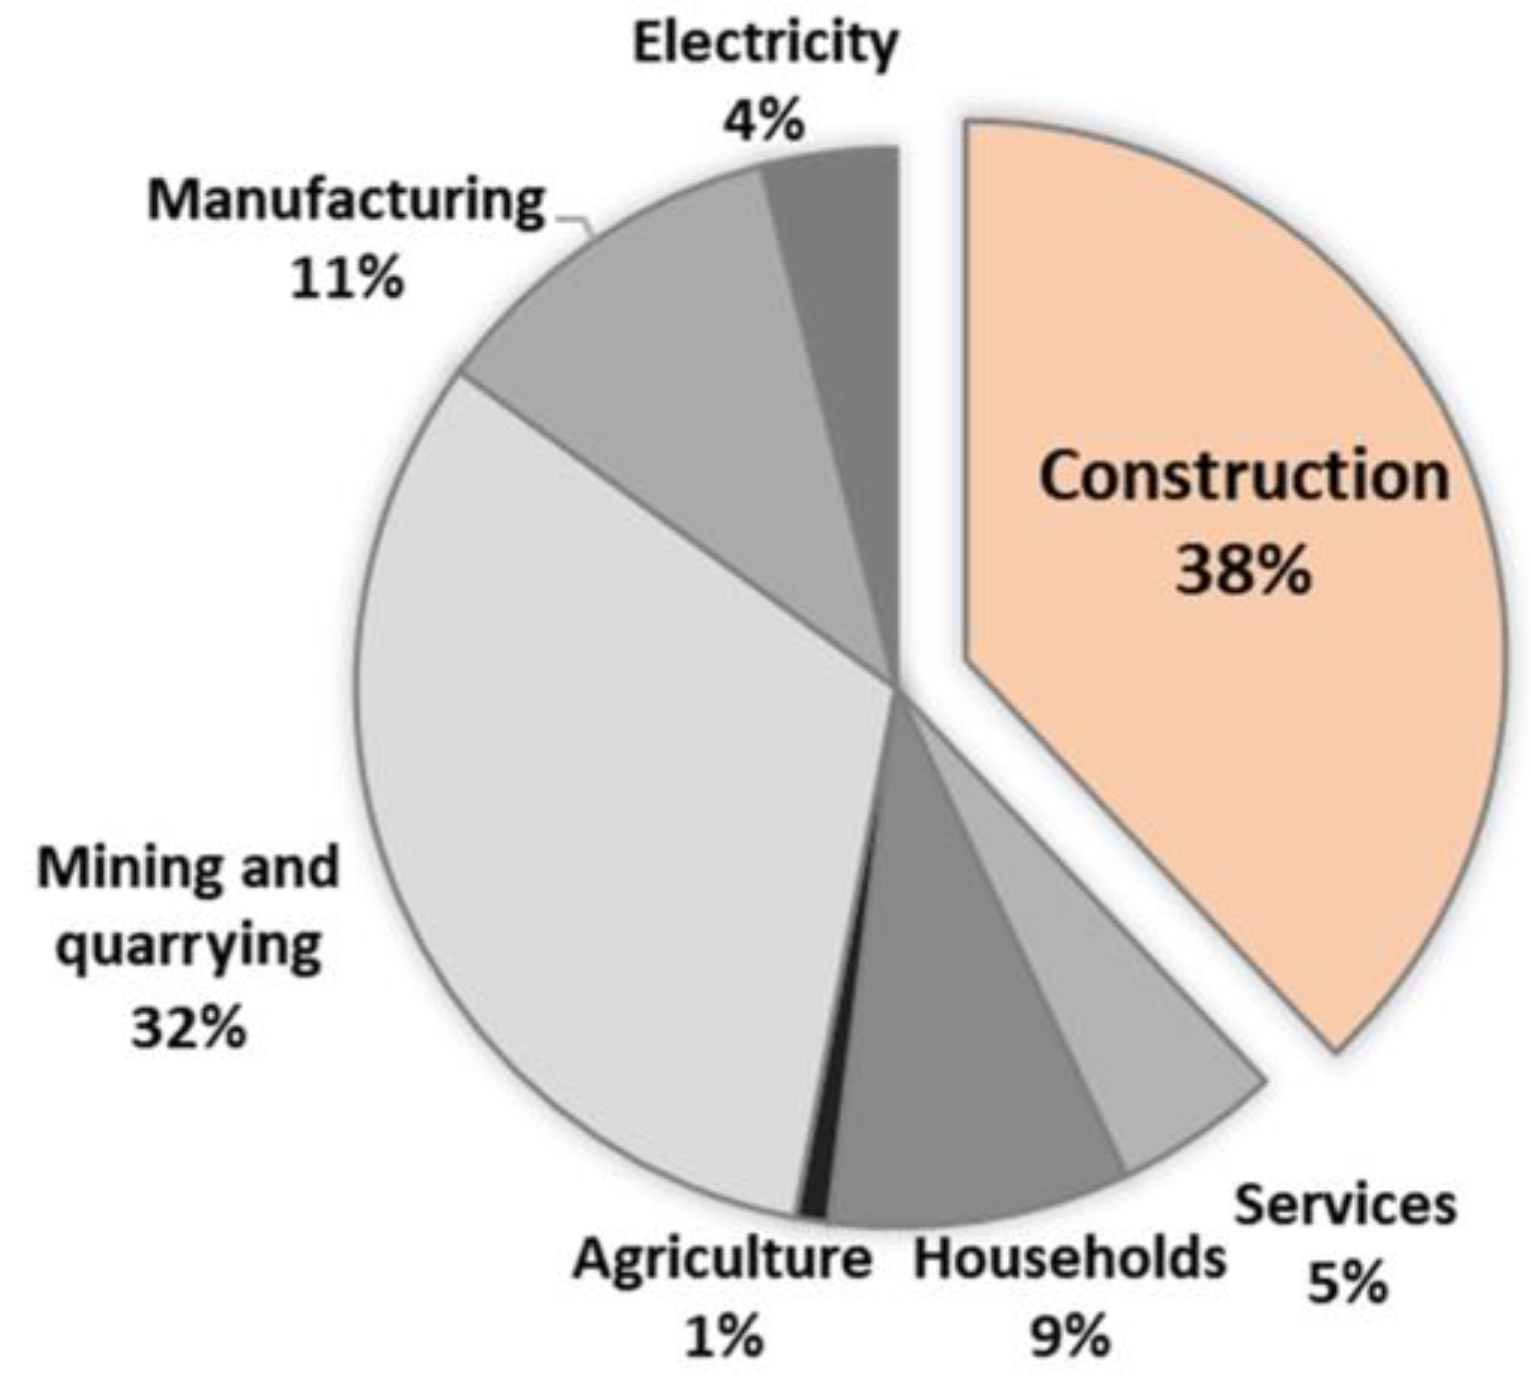
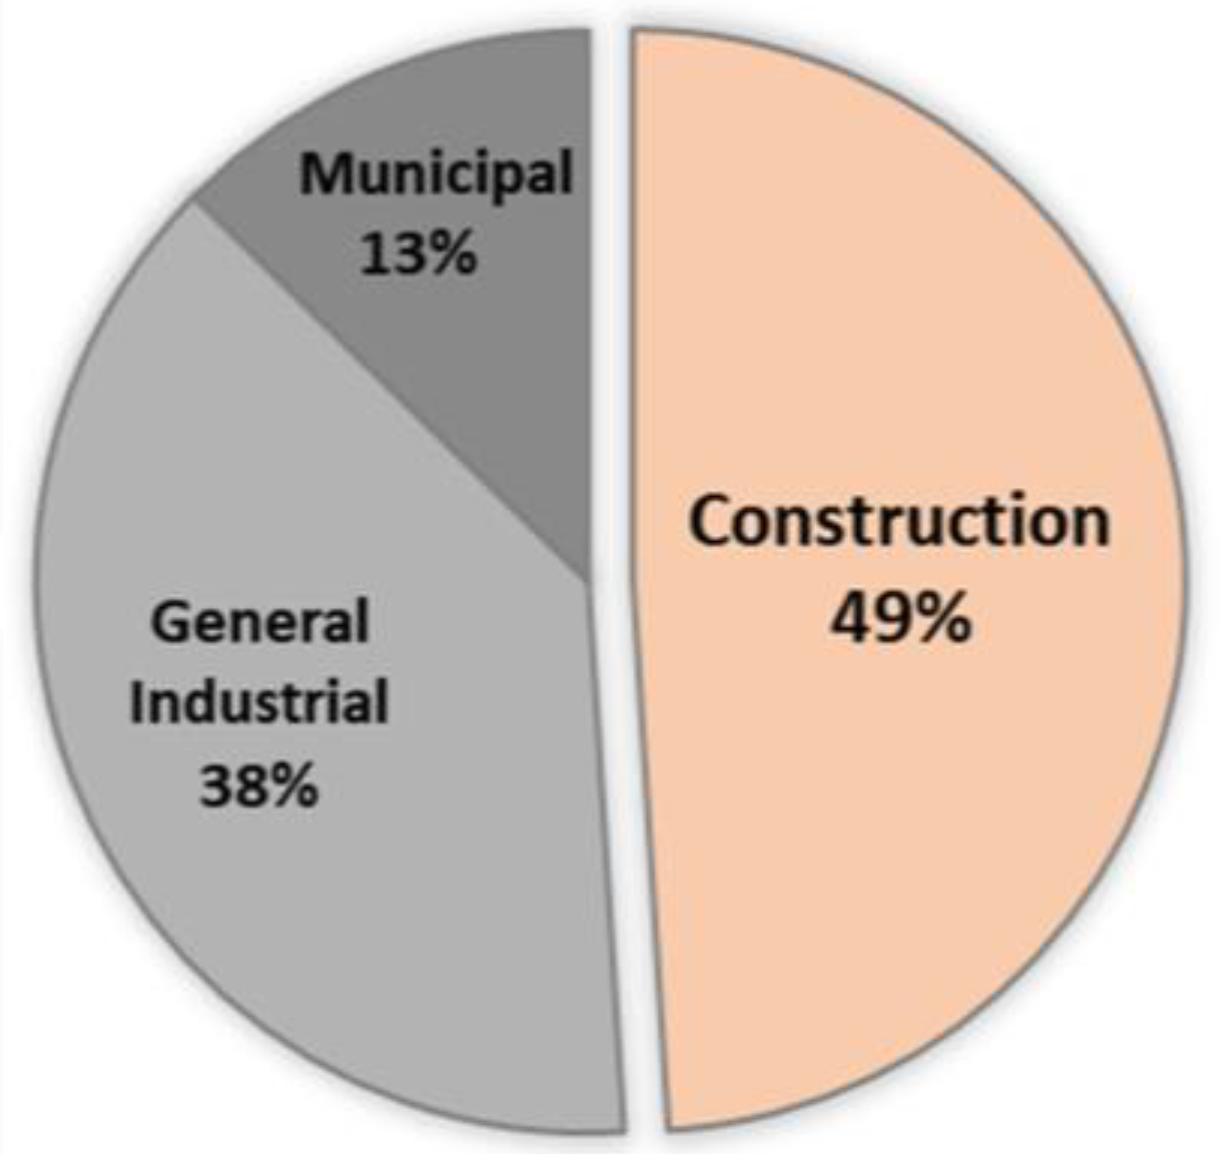
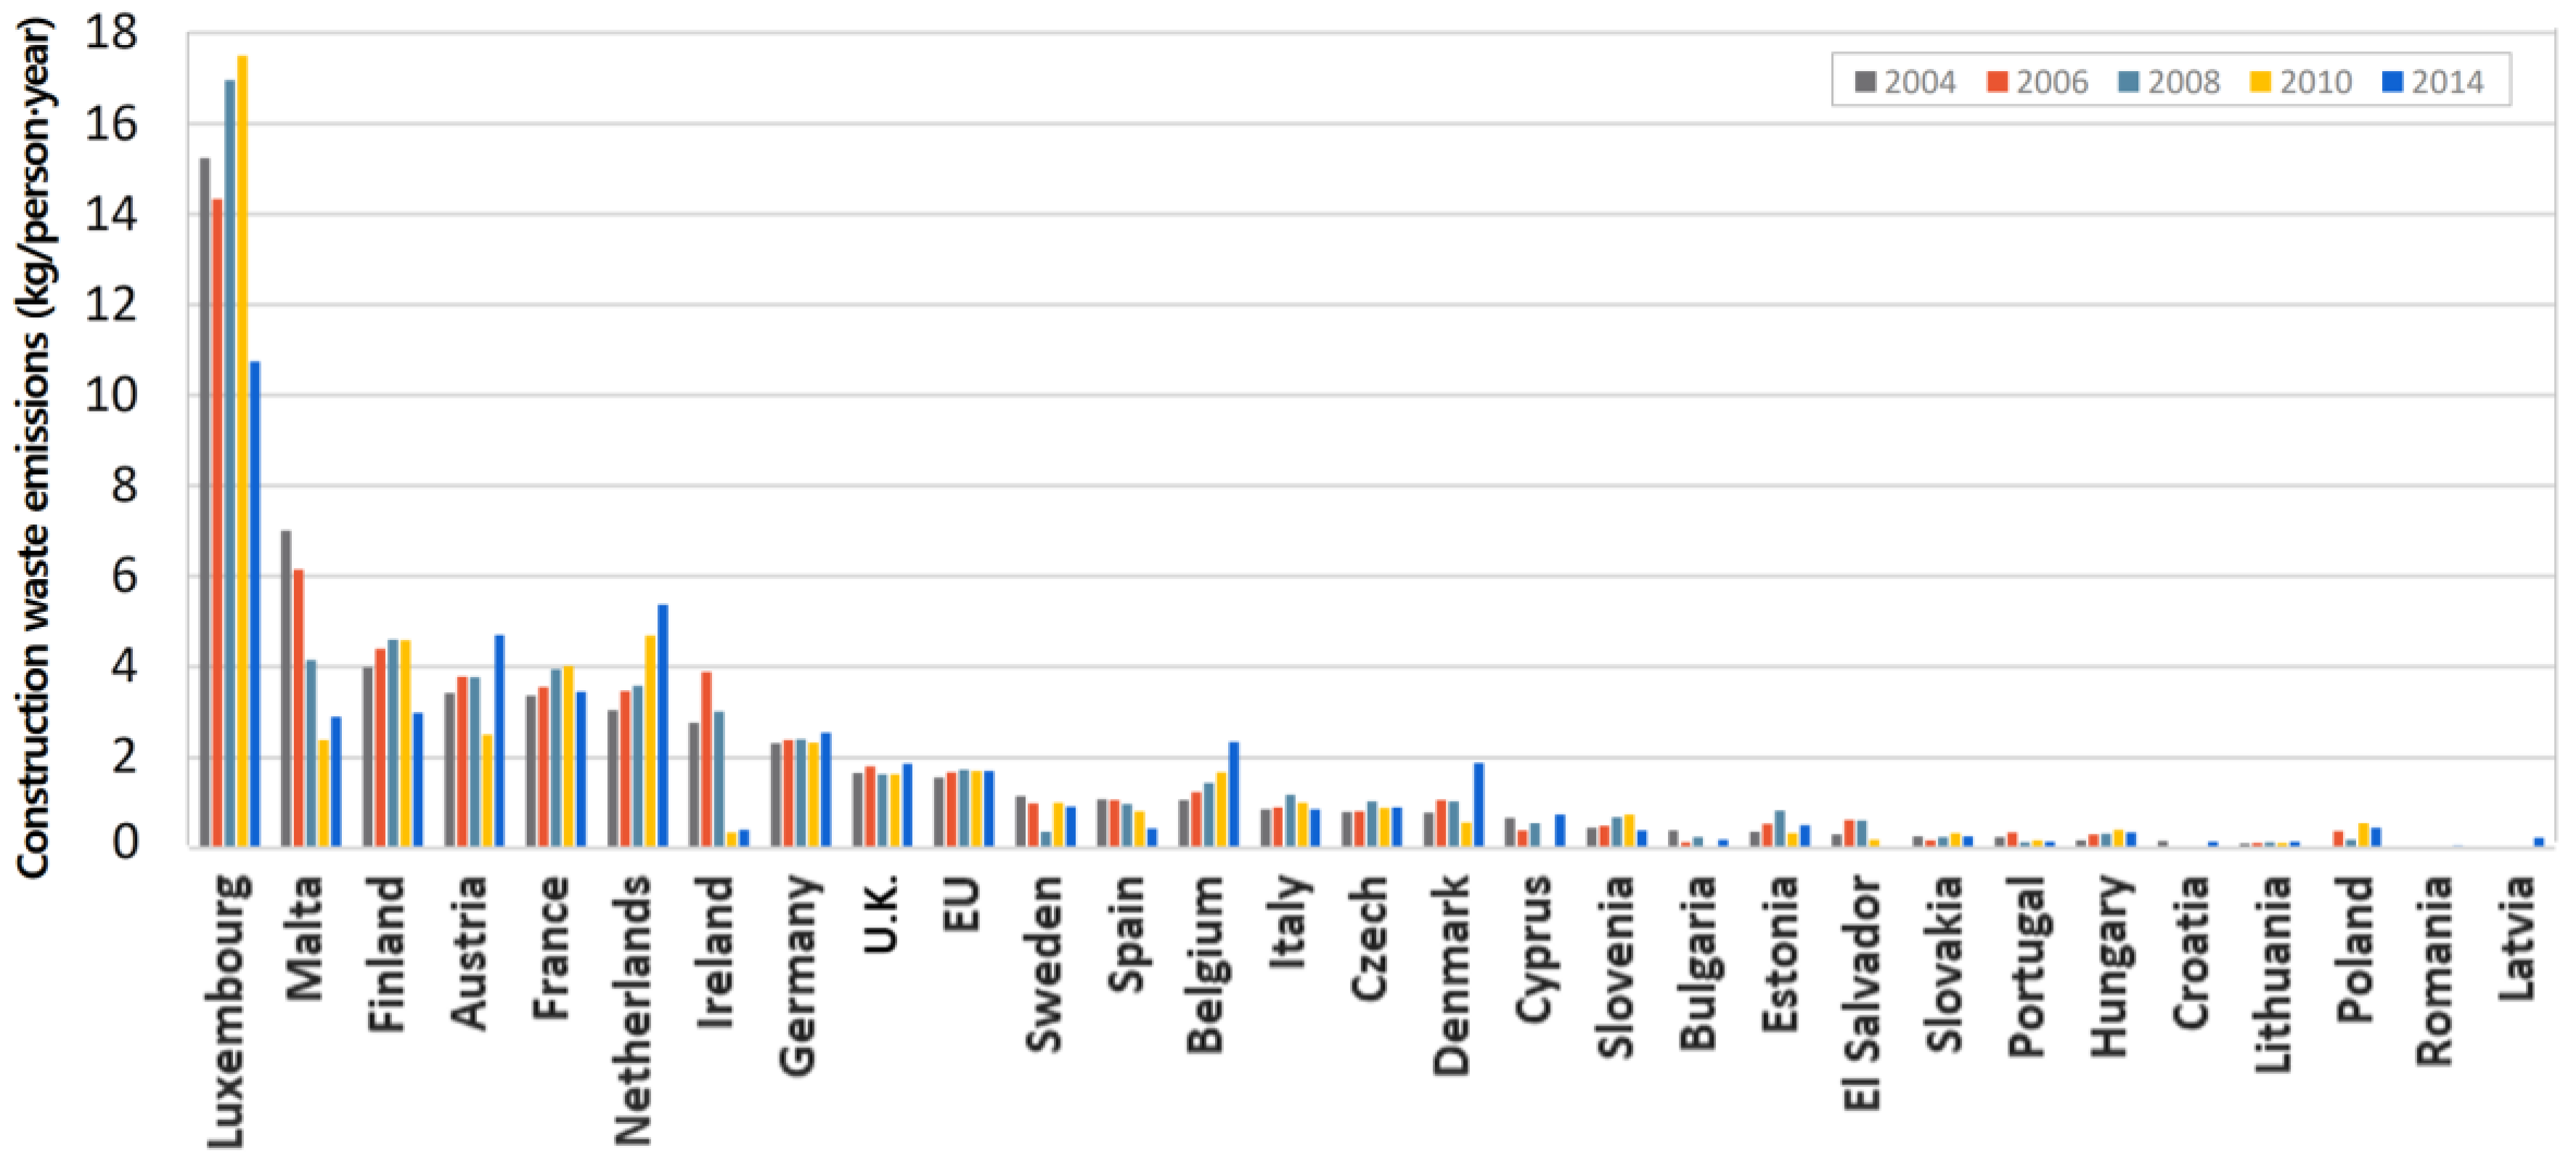
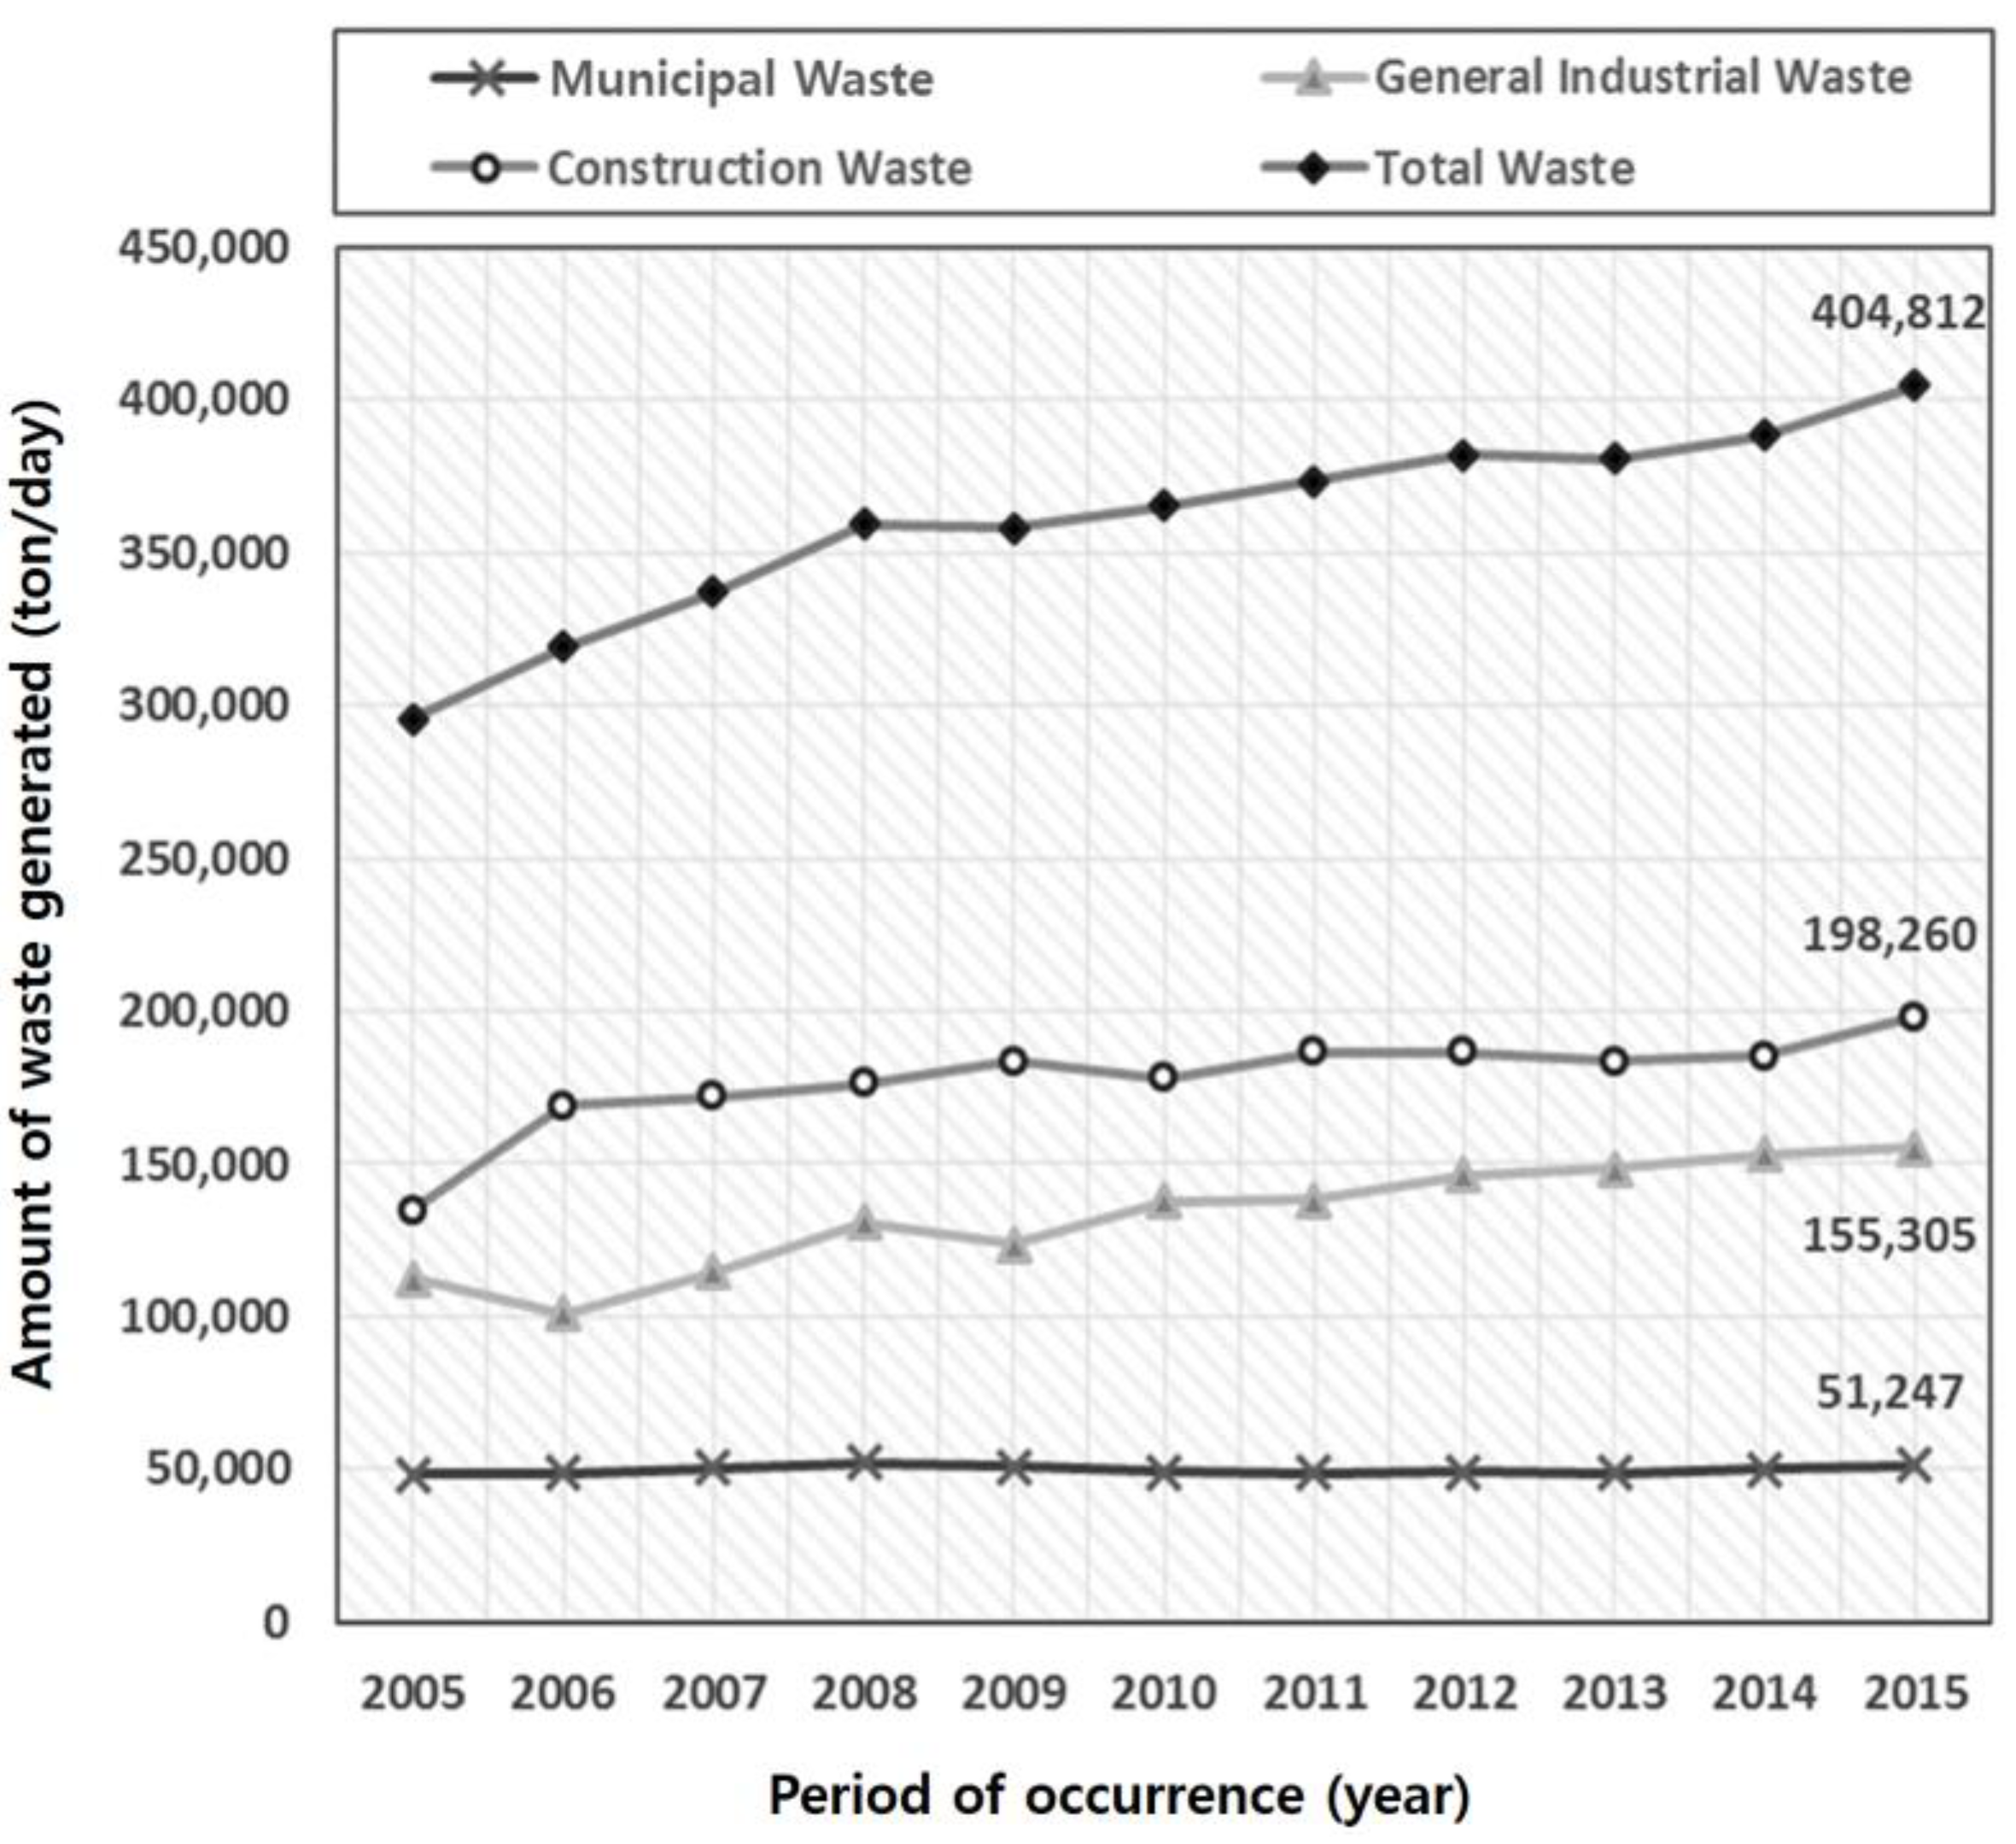
2. Characteristics of Construction Wastes and the Current State of Management

The European Commission report, Resource Efficiency Opportunities in the Building Sector, urges the reduction of environmental impacts throughout the life cycle of buildings. In other words, resources should be utilized efficiently, not only in new buildings but also in commercial, residential, and public buildings undergoing large renovations. According to the report, since one-third of the total waste generated in the EU is construction and demolition waste (C&DW), the European Commission introduced a strategy, the Construction 2020 Action Plan, with the key objective of improving resource efficiency, environmental performance, and business opportunities. The strategy focuses on energy and resource efficiency to strengthen sustainable competitiveness in the construction sector and related companies. The specific policy measures of the Construction 2020 Action Plan are the Cohesion Policy and Horizon 2020, which include policies incentivizing energy and resource efficiency and supporting public green space procurement guidelines. Resource efficiency in the construction sector is mainly evaluated in terms of the environmental impact of inputs and outputs during raw material production, construction, utilization, maintenance, demolition, and disposal activities. The state of resource efficiency in the construction sector is analyzed through available data indicators provided by the companies responsible for the direct generation and disposal of construction wastes. According to the 2014 statistics on waste generation in the EU, 38% was generated in the construction sector, as shown in Figure 1 [26,27]. According to the 2015 waste generation and disposal statistics published by the Ministry of Environment and the Korea Environment Corporation, construction waste accounted for the largest portion (48.9%) of total waste in South Korea, as shown in Figure 2 [19,28].
In Figure 3, the average amount of construction waste decreased by 10.7% from 2010 to 2014 in the EU. The amount of waste discarded per capita since 2014 reflects the population size and activity level in the construction sector. The amount of waste generated has declined in half of the member countries, and especially in Spain, with a significant drop of 59.3% between 2010 and 2014 [26,27]. However, as shown in Figure 4, the amount of construction waste in South Korea has steadily increased compared to domestic and general waste from commercial businesses. Additionally, construction waste generation in the country is expected to increase further since the reconstruction period has recently been shortened from 40 to 30 years for row houses and apartment buildings [19,28].
Construction wastes were classified as shown in Table 1. The amount of construction waste generated from 2010 to 2015 indicates that concrete and mixed waste are the dominant types. As shown by the loss rates of building materials, waste generation in various types and amounts is unavoidable at construction sites. Regarding the disposal and management processes for wastes generated in the construction phase, collection and transport companies take the waste from site storage yards and primarily separate them by type at their sites. Intermediary disposal companies, such as specialized disposal companies and local logistics centers, are contracted to handle recyclable wastes that are mostly simple, low-value roadbed materials [29]. Subsequently, the construction wastes are recycled as secondary concrete products, and those that cannot be recycled are taken to the final disposal site to be incinerated and buried in landfills. Although the waste generated in the construction phase is more diverse and distinctive in terms of the material characteristics compared to the waste generated in the demolition phase, it is not completely reclassified and is landfilled or incinerated [30,31].
The narrow range of waste classification is not suitable for encouraging its separation and reduction. Currently, combustible and non-flammable wastes are mixed, stored in arm-roll boxes, collected, and transported to collection yards to be buried without specific separation [32,33]. Identifying the key waste generated during the construction phase will contribute to establishing an eco-friendly construction production system that can minimize construction waste and maximize recycling rates.

3. Materials

In this study, the amount of waste generated at a construction site was estimated by obtaining the bill of quantities from an actual multi-family housing building to determine the major construction wastes using a life cycle assessment. Multi-family housing buildings, which account for the largest portion of the permit area used in South Korea, were selected as the subject for the case study analysis, and the result was used to determine the major wastes. As shown in Table 2, a high-rise capital apartment complex project with 643 household units, completed by a construction company known for excellent site management skills, was the site selected for the case study.

4. Methods

4.1. Analysis of the Construction Waste Quantities

The amount of waste generated at the construction site was estimated based on the quantities bill of the project and by converting the various units of the materials using the weight conversion factors and loss rates. The quantity, specification, weight, and product name of each material were confirmed through the quantities bill, and the materials were arranged by weight based on the unit weight conversion, as shown in Table 3. Thousands of materials and processes are used to complete a single building, and it is inefficient to analyze all possible materials and processes. Many of them are used for large multi-family housing buildings, such as the subject of this analysis.
In this study, the cutoff criteria provided in ISO 21930 were used to conduct the life cycle assessment of the construction waste. The cutoff criteria specify the unit processes, quantities, energy consumption, environmental significance, etc., to be excluded in a study. ISO 21930 recommends that a life cycle assessment includes materials that contribute at least 95% of the mass or environmental relevance among all the materials that constitute the subject of the assessment. Hence, in this study, the amount of construction waste generated was analyzed for the materials accounting for 95% of the cumulative weight contribution. The standard of estimation from the Korea Construction Management Corporation and data from the Passive House Institute Korea were used as the basis for the unit weight, and in the case of manufactured products, units were converted based on the weight of each product [33].

4.2. Life Cycle Assessment

A life cycle assessment is an environmental evaluation technique that quantifies the amount of input resources and pollutant emissions generated throughout the entire process of raw material production, manufacture, usage, and disposal of a product. In addition to a risk assessment, the International Organization of Standardization established the technical specifications for a life cycle assessment under the ISO 14000 environmental management family. In this study, the assessment was conducted based on the ISO 14040 series (life cycle assessments) and ISO 21930 (environmental declaration of building products). The major waste materials were determined by evaluating the six types of environmental impacts that could not be analyzed through simple quantification: GWP, ADP, AP, EP, ODP, and POCP. The impact quantification factor (characterization factor) of each category was calculated, and the potential contribution to the environmental load was obtained by multiplying the loads (emission or release) of the inventory data classified into each impact category by the characterization factor (Equation (1)):
Impact category indicatori = Σ(Ej or Rj) × CFi,j,
where the impact category indicator (characterization value, impact category indicator i) is the indicator value i for the impact category per functional unit; Ej or Rj (emission or release) is the emission j or resource consumption j per functional unit; CFi,j is the characterization factor that represents the contribution of emission j or resource consumption j to impact category i.
The reference materials and impact index for each environmental impact category were applied based on the environmental product declaration labeling database, the national life cycle inventory database (LCI DB; Ministry of Trade, Industry, and Energy and Ministry of Environment), and the National Environmental Information DB (Ministry of Land, Transport and Maritime Affairs), as shown in Table 4 [33,34,35,36,37,38].
Global warming is the rise in the average temperature of the Earth’s surface. Its major cause is the emission of greenhouse gases, including CO2. The reference substance for global warming is CO2, and there are 23 impact substances, including CH4, N2O, HFCs, and SF6. In this study, the global warming potential was calculated using CO2 as the reference substance and applying the GWP provided by the International Panel on Climate Change (IPCC) to the environmental loads of the impact substances [39]. Ozone depletion is the reduction in density of the ozone layer in the stratosphere, which is 15 to 30 km above the ground. This is mainly caused by CFCs and causes skin cancer because of the increase in ultraviolet rays reaching the Earth’s surface. The reference substance for ozone depletion is trichlorofluoromethane (CFC-11), and there are 22 impact substances, including bromotrifluoromethane (Halons 1301), hydrobromofluorocarbons, hydrochlorofluorocarbons, methyl bromide, and methyl chloride. The ozone layer impact was calculated using CFC-11 as the reference substance and applying the ODP provided by the World Meteorological Organization (WMO) to the environmental loads of the impact substances [40,41]. Acidification is the increase in the acidity of rivers, streams, and soil due to atmospheric pollutants, such as SO2, NH3, and NOx. It increases the elution of heavy metals and affects ecosystems, such as the nutrient and feed supplies of fish, plants, and animals. The reference substance of acidification is SO2, and there are 23 impact substances, including NH3, H2SO4, and NOx. The acidification was calculated using SO2 as the reference substance and applying the AP provided by Heijung et al. and Hauschild and Wenzel to the environmental loads of the impact substances [42,43]. Abiotic depletion is the environmental impact caused by the use of resources. The reference substance is Sb, and there are more than 90 impact substances, including Al, Cd, Fe, Au, Hg, natural gas, and crude oil. The abiotic depletion was calculated using Sb as the reference substance and applying the ADP provided by Guinee et al. to the environmental loads of the impact substances [44]. Photochemical oxidant creation refers to the reaction between air pollutants and sunlight, which creates chemical compounds, such as ozone. Such chemical compounds adversely affect ecosystems, including human health and crop growth. The reference substance of photochemical oxidant creation is ethylene, and there are more than 100 impact substances, including acetone, benzene, CO, ethane, methane, and toluene. The photochemical oxidant creation was calculated using ethylene as the reference substance and applying the POCP provided by Jenkin and Hayman and Derwent et al. to the environmental loads of the impact substances [45,46]. The eutrophication is the rapid multiplication of algae due to an oversupply of nutrients in the aquatic ecosystem from chemical fertilizers and sewage, causing red tides. The reference substance of eutrophication is PO43−, and there are 11 impact substances, including NH3, NH4, N2, NO2, and P. The eutrophication was calculated using PO43− as the reference substance and applying the EP provided by Heijung et al. to the environmental loads of the impact substances [42].

5. Results

5.1. Analysis of the Major Wastes in the Construction Phase

The results of the multi-family housing complex construction site waste analysis showed that 167 types of waste materials were generated, 41 of which accounted for 95% of the cumulative weight contribution. The quantity, weight conversion factors, and loss rates for the top 20 waste materials are listed in Table 5. Materials not included in Table 5 include plywood gypsum boards for woodwork, steel trowel finish for plasterwork, and specific stones for masonry work.
To easily conduct an environmental impact assessment through characterization, 41 materials were grouped into nine categories: concrete, concrete blocks, rebar, sand, general cement, gypsum board, tile, insulation, and stone. As shown in Table 6, the total weight of the construction waste generated was 1,951,939 kg, where concrete accounted for 883,437 kg, or 45%. Despite having a low loss rate of 0.003%, concrete accounted for the largest portion of waste because, according to the bill of quantities, it is a major input material. The most common construction wastes after concrete were concrete block, rebar, sand, general cement, and gypsum boards. Insulation and granite materials accounted for the smallest amounts at 1.53% and 0.70%, respectively.
Since over 95% of concrete and cement products are recycled in South Korea, albeit in the form of simple roadbed materials, and rebar is fully recycled, the remaining gypsum boards are a major waste that needs to be managed. In Japan, where the recycling rate of construction waste is outstanding, gypsum board manufacturers have implemented a broad-range recycling strategy with a zero-waste goal. Gypsum boards used in new buildings generate approximately 420,000 tons of waste, or 10% of the total annually. Approximately 110,000 tons of gypsum board waste is reused in the manufacturing process through active management and the Japanese broad-range recycling strategy, whereby a manufacturer can recover and recycle its product when it becomes an industrial waste by transporting it back to its sales branch without requiring a separate business permit for waste disposal.

5.2. Analysis of Major Construction Wastes Using the Life Cycle Assessment

The waste materials derived with loss rates were analyzed using a life cycle assessment. The environmental impact characterization index was calculated based on the production stage of the material and was adopted from a study arguing that materials discarded as waste can be considered as unnecessary production. In this study, as shown in Table 7, the major construction wastes were identified via the life cycle assessment by using a characterization technique that evaluated the six types of environmental impacts: GWP, ADP, AP, EP, ODP, and POCP. Using the cutoff criteria, the 41 material types were grouped into nine environmental impact characterization index items: concrete, concrete block, general cement, rebar, tile, gypsum board, insulation, sand, and granite. Each category was analyzed for the environmental impact characterization value under the six environmental impact categories. Cement bricks and cement blocks used for plastering, waterproofing, and masonry were grouped into the concrete block category. The environmental impact characterization index for a life cycle assessment of cement bricks was also used for cement blocks, while that of mortar was derived based on the mixing ratio of cement and sand. The material units that had been converted to determine the construction waste quantity were reconverted based on the characterized life cycle assessment units.
Figure 5 shows the contribution of each construction waste by environmental impact. The analysis indicated that the construction wastes with a significant impact on global warming were concrete blocks, concrete, cement, and rebar, with a contribution level of 95% or higher. The waste accounting for 95% of the contribution level in other categories was: insulation material at 51%, rebar at 18%, concrete block at 12%, and concrete at 10% for resource depletion; concrete block at 28%, rebar at 27%, insulation materials at 22%, general cement at 9%, and concrete at 5% for acidification; and concrete block at 31%, rebar at 28%, stone material at 15%, insulation material at 10%, and general cement at 8% for eutrophication.
Meanwhile, regarding ozone depletion, concrete contributed 42%, concrete block 32%, general cement 13%, and rebar 7%. Regarding photochemical ozone creation, concrete, concrete block, rebar, insulation material, and general cement constituted 93%. The results of the environmental impact characterization assessment revealed that concrete, concrete block, and cement waste accounted for over 70% of the contribution level in all of the environmental impact categories except resource depletion. Table 8 shows the details of the environmental impact assessment of the construction waste. The shaded cells indicate the materials accounting for the top 95% cumulative contribution for each environmental impact category. Based on the contribution level analysis, the five major construction wastes selected were concrete, rebar, cement, gypsum board, insulation material, and concrete block, which collectively satisfied the cutoff criteria of 95%.
Stone materials were found to be a major construction waste for the eutrophication category but were ultimately excluded because their contribution level, 0.5%, was minimal in all other environmental impact categories. Gypsum boards were one of the most discarded materials in terms of weight, but they were found to provide a minimal contribution, namely, under 5% in all six environmental impact assessment categories. In contrast, insulation materials were selected as a major waste based on the high contribution level of 51% in the resource depletion category, as well as relatively high levels in the acidification, eutrophication, and photochemical ozone creation categories, despite accounting for only 1% or 29,886 kg of the total construction waste generated.

6. Conclusions

In the construction phase, despite the various high-quality construction waste that can be recycled being generated because of the application of the loss rates, the current wastes are not completely reclassified and are being landfilled or incinerated. Selective waste management during the construction phase will not only contribute to the establishment of an eco-friendly construction production system that minimizes waste and maximizes recycling rates but will also provide economic benefits.
In this study, the major construction wastes from an environmental impact perspective were identified through a life cycle assessment. The quantities of the 167 types of construction waste were estimated for a multi-family housing construction site using material loss rates and weight conversion factors. An environmental impact assessment was conducted in six categories on the construction waste constituting 95% of the cumulative weight contribution, or 41 types of waste, and the following conclusions were made:
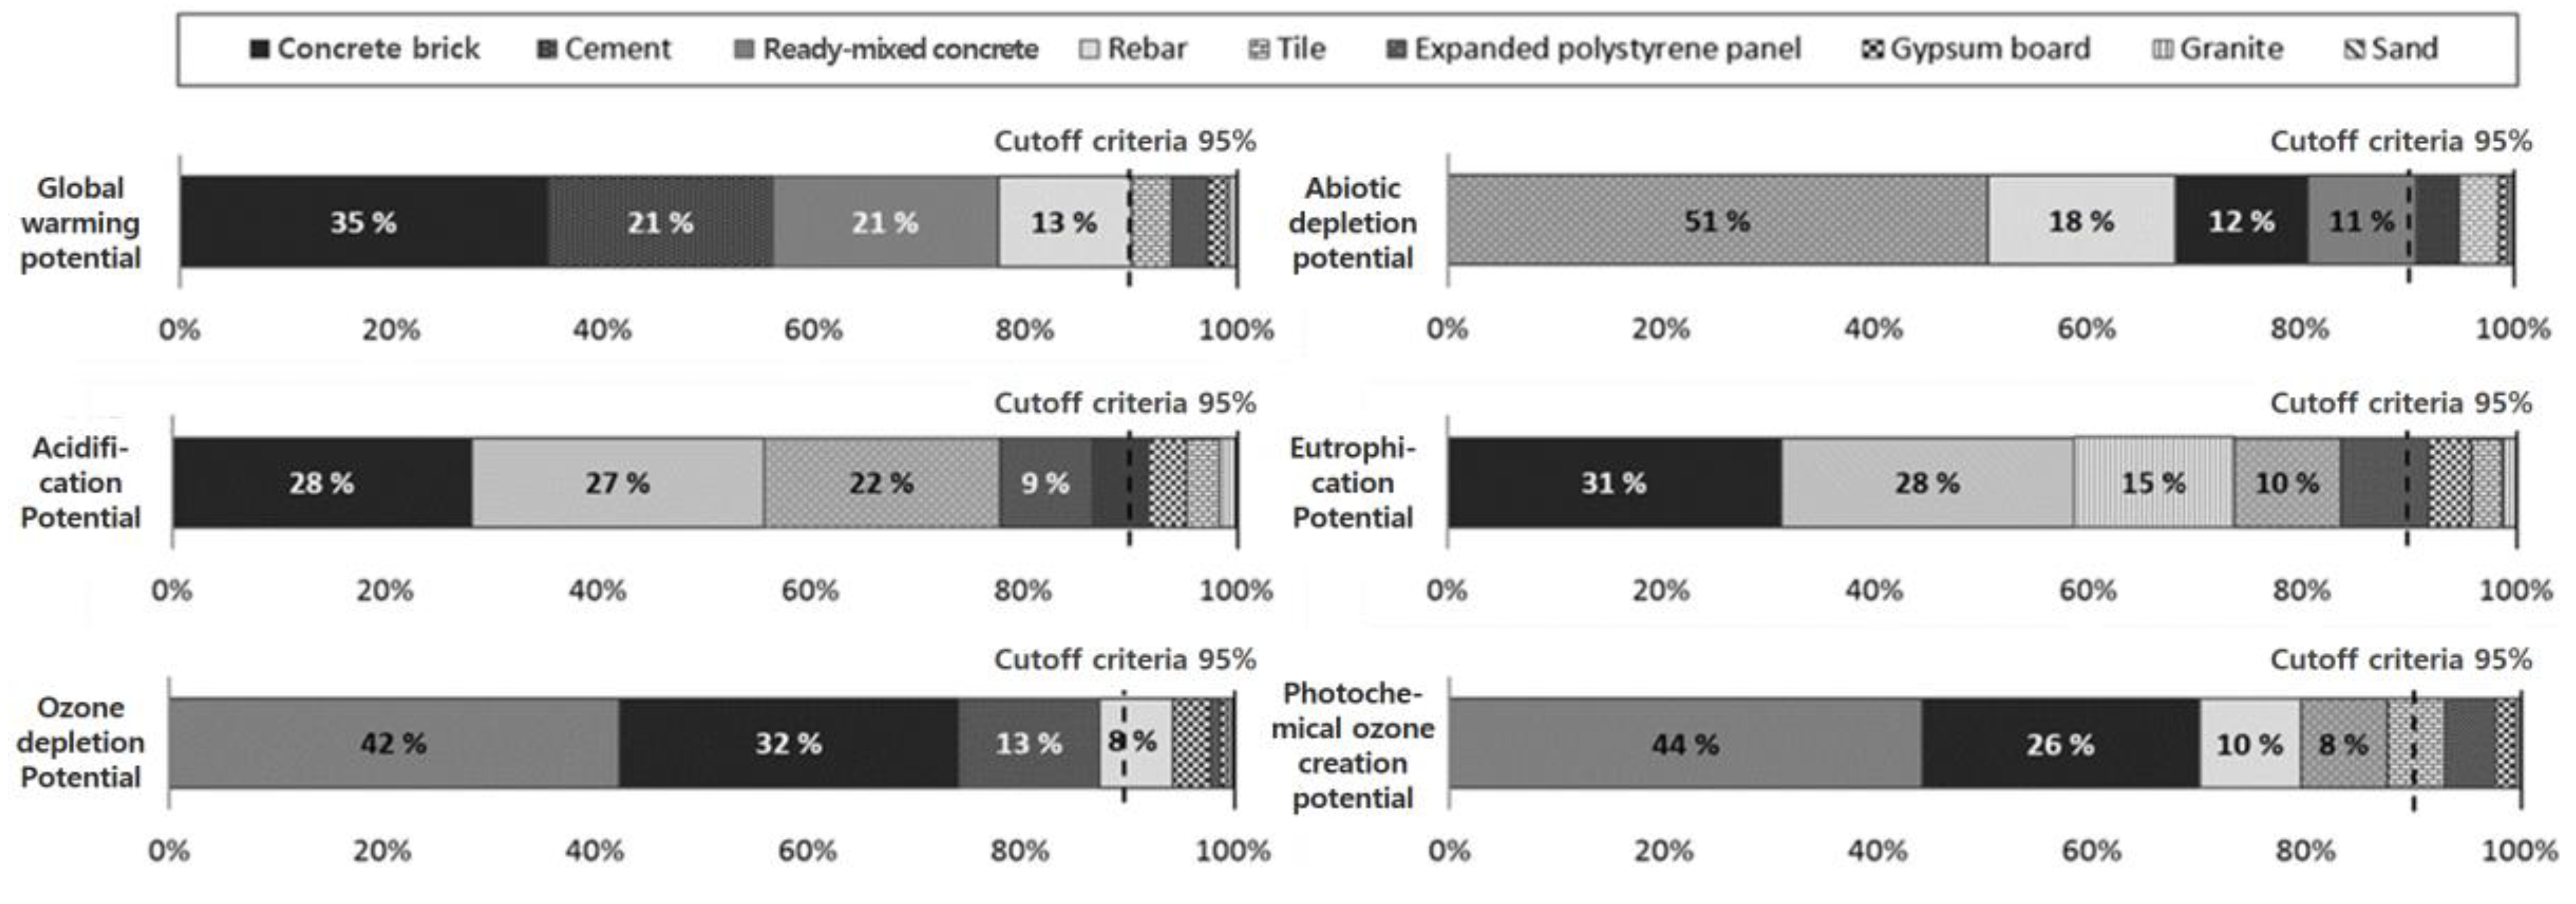
  • Based on the contribution level analysis results, and the cutoff criteria of 95%, five types of major construction wastes were determined: concrete, rebar, cement, insulation material, and concrete blocks.
  • As a key management target in the construction phase, concrete was the most discarded material in terms of weight and demonstrated the highest contribution levels of 42% and 44% in ozone depletion and photochemical ozone creation, respectively, while contributing little to acidification and eutrophication.
  • Gypsum boards were found to be heavily discarded in terms of the waste amount as a weight, but the environmental impact assessment results indicated the lowest contribution level of less than 5% in all six categories.
  • In contrast to gypsum boards, insulation materials accounted for 1% of the total waste generated but were identified by the environmental impact assessment to have the highest contribution level in resource depletion (51%) and relatively high levels of acidification, eutrophication, and photochemical ozone creation.
  • The results from the environmental impact characterization assessment indicated that concrete, concrete block, and cement waste accounted for over 70% of the contribution level in all the environmental impact categories except resource depletion.
In this study, apartment buildings made using reinforced concrete, which account for the largest portion of the permit area used in South Korea, were selected as the subjects for the analysis, and the result was used to determine the major wastes. As a follow-up study, we plan to examine the derived major construction waste, which will be further subdivided through the analysis of construction waste according to buildings of various uses and structure types. This is believed to contribute to the use of government policies to reinforce the obligation to select construction waste targets to be suppressed and separately discharged at construction sites.

Author Contributions

Conceptualization, W.-J.P. and H.B.; methodology, R.K. and S.R.; formal analysis, R.K.; data curation, S.R.; writing—original draft preparation, W.-J.P.; writing—review and editing, R.K. and S.R.; supervision, S.R.; project administration, H.B.; funding acquisition, W.-J.P. All authors have read and agreed to the published version of the manuscript.

Funding

This research was supported by a grant (20CTAP-C141186-03) from the Technology Advancement Research Program (TARP) funded by the Ministry of Land, Infrastructure and Transport of the Korean Government. This work was supported by the National Research Foundation of Korea (NRF) grant funded by the Korea government (No.NRF-2018R1D1A3B07045700).

Conflicts of Interest

The authors declare no conflict of interest.

References

  1. Wang, H.; Chen, W. Gaps between pre-2020 climate policies with NDC goals and long-term mitigation targets: Analyses on major regions. Energy Procedia 2019, 158, 3364–3369. [Google Scholar] [CrossRef]
  2. Hulme, M. 1.5 °C and climate research after the Paris Agreement. Nat. Clim. Chang. 2016, 6, 222–224. [Google Scholar] [CrossRef] [Green Version]
  3. O’Neill, B.C.; Oppenheimer, M. Dangerous Climate Impacts and the Kyoto Protocol. Am. Assoc. Adv. Sci. 2002, 14, 1971–1972. [Google Scholar]
  4. Rogelj, J.; Elzen, M.G.D.; Höhne, N.; Fransen, T.; Fekete, H.; Winker, H.; Schaeffer, R.; Sha, F.; Riahi, K.; Meinshausen, M. Paris Agreement climate proposals need a boost to keep warming well below 2 °C. Nature 2016, 534, 631–639. [Google Scholar] [CrossRef] [Green Version]
  5. Park, S.W. Post-2020 climate regime and Paris Agreement. Environ. Law Policy 2016, 16, 285–322. [Google Scholar]
  6. Ministry of Environment. The Korean Government, Roadmap for Achieving the National Greenhouse Gas Reduction Target (Plan), Korea; Ministry of Environment: Sejong City, Korea, 2018. [Google Scholar]
  7. Kim, K.T.; Jang, M.K.; Song, I.H.; Kim, S.M. A study on the energy self-sufficiency rate based on the analysis of building energy efficiency rating system. Korean Inst. Archit. Sustain. Environ. Build. Syst. 2017, 11, 331–341. [Google Scholar]
  8. Tan, M.Q.B.; Tan, R.B.H.; Khoo, H.H. Prospects of carbon labelling a life cycle point of view. J. Clean. Prod. 2014, 72, 76–88. [Google Scholar] [CrossRef]
  9. Ibbotson, S.; Kara, S. LCA case study. Part 1: Cradle-to-grave environmental footprint analysis of composites and stainless steel I-beams. Int. J. Life Cycle Assess. 2013, 18, 208–217. [Google Scholar] [CrossRef]
  10. Biswas, W.K.; Alhorr, Y.; Lawania, K.K.; Sarker, P.K.; Elsarrag, E. Life cycle assessment for environmental product declaration of concrete in the Gulf States. Sustain. Cities Soc. 2017, 35, 36–46. [Google Scholar] [CrossRef]
  11. Oh, D.Y.; Noguchi, T.; Kitagaki, R.; Park, W.J. CO2 emission reduction by reuse of building material waste in the Japanese cement industry. Renew. Sustain. Energy Rev. 2014, 38, 796–810. [Google Scholar] [CrossRef]
  12. Zimbili, O.; Salim, W.; Ndambuki, M. A review on the usage of ceramic wastes in concrete production. Int. J. Civ. Arch. Struct. Constr. Eng. 2014, 8, 91–95. [Google Scholar]
  13. Vieira, D.R.; Calmon, J.L.; Coelho, F.Z. Life cycle assessment (LCA) applied to the manufacturing of common and ecological concrete: A review. Constr. Build. Mater. 2016, 124, 656–666. [Google Scholar] [CrossRef]
  14. Architectural Institute of Japan. LCA Guidelines for Buildings: Evaluation Tools for Climate Change, Resource Consumption and Waste Management; Architectural Institute of Japan: Tokyo, Japan, 2006. [Google Scholar]
  15. Akihisa, K.; Kentaro, T.; Takeshi, K. Can Japan enhance its 2030 greenhouse gas emission reduction targets? Assessment of economic and energy-related assumptions in Japan’s NDC. Energy Policy 2019, 158, 328–340. [Google Scholar]
  16. Passer, A.; Lasvaux, S.; Allacker, K.; De Lathauwer, D.; Spirinckx, C.; Wittstock, B.; Kellenberger, D.; Gschösser, F.; Wall, J.; Wallbaum, H. Environmental product declarations entering the building sector: Critical reflections based on 5 to 10 years experience in different European countries. Int. J. Life Cycle Assess. 2015, 20, 1199–1212. [Google Scholar] [CrossRef] [Green Version]
  17. Ministry of Environment, Regulation No. 659, Standard Guidelines for Disposal of Construction Waste. 2019. Available online: http://www.law.go.kr/LSW//admRulInfoP.do?admRulSeq=2100000181428 (accessed on 28 September 2020).
  18. Sudokwon Landfill Site Management Corporation. A Study to Establish a Waste Management System for Sudokwon Landfill Site Management Corporation; Sudokwon Landfill Site Management Corporation: Incheon, Korea, 2018. [Google Scholar]
  19. Korea Institute of Civil Engineering and Building Technology. A Research of Consolidation Plan for Recyclability of Construction Wastes Resource; Korea Institute of Civil Engineering and Building Technology: Goyang City, Korea, 2014. [Google Scholar]
  20. Cha, N.; Park, W.; Kim, K. Construction waste management system for improving waste treatment on the construction site. Korean J. Constr. Eng. Manag. 2014, 15, 83–91. [Google Scholar] [CrossRef] [Green Version]
  21. Oshiro, A.; Positieri, M.; Cáceres, G.; Lopez, A.; Di Gioia, C.; Fernández, M. Contribution to the recycling of waste products in construction: Concrete made with non-traditional aggregates. Struct. Concr. Time Proc. Fib Symp. 2005, 2, 793–800. [Google Scholar]
  22. Aguilar-Penagos, A.; Gómez-Soberón, J.M.; Rojas-Valencia, M.N. Physicochemical, mineralogical and microscopic evaluation of sustainable bricks manufactured with construction wastes. Appl. Sci. 2017, 7, 1012. [Google Scholar] [CrossRef] [Green Version]
  23. Puertas, F.; Santos, R.; Alonso, M.M.; Del Río, M. Alkali-activated cement mortars containing recycled clay-based construction and demolition waste. Ceram. Silik. 2015, 59, 202–210. [Google Scholar]
  24. Korea Institute of Construction Technology. Standard of Estimate for Construction Works; Korea Institute of Construction Technology: Goyang, Korea, 2017. [Google Scholar]
  25. Korea Environment Institute. A Study on Separate Discharge of Construction Wastes and Computation of Basic Unit; Korea Environment Institute: Seoul, Korea, 2004. [Google Scholar]
  26. European Commission. On Resource Efficiency Opportunities in the Building Sector; European Commission: Brussels, Belgium, 2014. [Google Scholar]
  27. European Commission. European Construcion Sector Observatory—Improving Energy and Resource Efficiency; European Commission: Brussels, Belgium, 2018. [Google Scholar]
  28. Waste Generation and Processing Status of the Country; Ministry of Environment: Sejong-Si, Korean, 2015.
  29. Bovea, M.D.; Powell, J.C. Developments in life cycle assessment applied to evaluate the environmental performance of construction and demolition wastes. Waste Manag. 2016, 50, 151–172. [Google Scholar] [CrossRef]
  30. Kim, R.H. Current State of Carbon Dioxide Emission in Cement Industry and Proposal for the Environment Load Reducing Cement used Inorganic Construction Wastes. Korean Recycled Constr. Resour. Inst. 2019, 14, 22–28. [Google Scholar]
  31. Baek, C.; Park, S.; Suzuki, M.; Lee, S. Life cycle carbon dioxide assessment tool for buildings in the schematic design phase. Energy Build. 2013, 611, 75–87. [Google Scholar] [CrossRef]
  32. Yi, I.S.; Seo, K.S. Social Indicators in Korea; National Statistical Office: Seoul, Korea, 2010. [Google Scholar]
  33. Song, T.; Seong, J. Comparison of the Construction Waste Generated by the Project and the Estimation of the Waste Generation Unit. J. Rec. Const. Resour. 2017, 5, 427–435. [Google Scholar]
  34. Zabalza Bribián, I.; Valero Capilla, A.; Aranda Usón, A. Life cycle assessment of building materials: Comparative analysis of energy and environmental impacts and evaluation of the eco-efficiency improvement potential. Build. Environ. 2011, 46, 1133–1140. [Google Scholar] [CrossRef]
  35. Giesekam, J.; Barrett, J.R.; Taylor, P. Construction sector views on low carbon building materials. Build. Res. Inf. 2016, 44, 423–444. [Google Scholar] [CrossRef]
  36. Brown, M.T.; Buranakarn, V. Emergy indices and ratios for sustainable material cycles and recycle options. Resour. Conserv. Recycl. 2003, 38, 1–22. [Google Scholar] [CrossRef]
  37. Hendriks, C.A.; Worrell, E.; De Jager, D.; Blok, K.; Riemer, P. Emission reduction of greenhouse gases from the cement industry. World 2002. [Google Scholar] [CrossRef]
  38. Cabeza, L.; Rincon, L.; Vilarino, V.; Perez, G.; Castell, A. Life cycle assessment (LCA) and life cycle energy analysis (LCEA) of buildings and the building sector: A review. Renew. Sustain. Energy Rev. 2014, 29, 394–416. [Google Scholar] [CrossRef]
  39. IPCC. 2006 IPCC Guidelines for National Greenhouse Gas. Expert Meet. Rep. 2006, 2, 1–20. [Google Scholar]
  40. WMO; UNEP. Scientific Assessment of Ozone Depletion: 2006; Global Ozone Research and Monitoring Project—Report No. 50; WMO: Geneva, Switzerland; UNEP: Nairobi, Kenya, 2010. [Google Scholar]
  41. Albritton, D.L. Scientific Assessment of Ozone Depletion: 1991; World Meteorological Organization: Geneva, Switzerland, 1991. [Google Scholar]
  42. Heijungs, R.; Guinee, J.B.; Huppes, G.; Lankreijer, R.M.; Udo, D.H.; Sleeswijk, A.W.; Ansems, A.M.M.; Eggels, P.G.; Duit, R.; Goede, H.P. Environmental Life Cycle Assessment of Products—Vol 1: Guide; The Institute of Environmental Sciences: Leiden, the Netherlands, 1992. [Google Scholar]
  43. Hauschild, M.Z.; Wenzel, H. Environmental Assessment of Products. Vol. 2—Scientific Background; Chapman & Hall: London, UK, 1998. [Google Scholar]
  44. Guine, J.B. Development of a Methodology for the Environmental Life-Cycle Assessment of Products—With a Case Study on Margarines; The Institute of Environmental Sciences: Leiden, The Netherlands, 1995; p. 225. [Google Scholar]
  45. Jenkin, M.E.; Hayman, G.D. Photochemical ozone creation potentials for oxygenated volatile organic compounds: Sensitivity to variations in kinetic and mechanistic parameters. Atmos. Environ. 1999, 33, 1275–1293. [Google Scholar] [CrossRef]
  46. Derwent, R.G.; Jenkin, M.E.; Saunders, S.M.; Pilling, M.J. Photochemical ozone creation potentials for organic compounds in northwest Europe calculated with a master chemical mechanism. Atmos. Environ. 1998, 32, 2429–2441. [Google Scholar] [CrossRef]
Figure 1. EU-28 waste generation.
Sustainability 12 08096 g001
Figure 2. South Korea waste generation.
Sustainability 12 08096 g002
Figure 3. Generation of waste by the construction sector in the EU-28 in 2004, 2006, 2008, 2010 and 2014.
Sustainability 12 08096 g003
Figure 4. Current status of South Korea’s waste generation.
Sustainability 12 08096 g004
Figure 5. Contribution of the construction wastes on each environmental impact.
Sustainability 12 08096 g005
Table 1. Classification and occurrence of construction waste (unit: ton/day).
Waste Classification201020112012201320142015
Construction waste materialsConcrete114,302121,181117,754111,653114,908124,451
Asphalt concrete32,53535,24535,73835,39833,72535,509
Others 1213223392957328023933230
Sub total148,969158,765156,448150,331151,026163,190
Combustibility
wastes
Wood636592683704866923
Synthetic resin83910961261169515861654
Others 2982021196711
Sub total157317081964241825192588
Non-combustibility wastesConstruction sludge64514036441052707995
Others 3947617041
Sub total654140765110588771036
Construction soil debris534748385094506758637659
Mixed construction wastes 421,57719,69922,47124,66425,09723,787
Total178,120186,417186,629183,538185,382198,260
1 Construction waste materials: waste brick, waste block, and waste roofing tile. 2 Combustible wastes: waste fiber and waste wallpaper. 3 Non-combustible wastes: waste metal, waste glass, waste tile, and waste ceramics. 4 Mixed construction wastes: mixed construction waste, waste board, and waste panel.
Table 2. Overview of a high-rise capital apartment complex project.
ClassificationContents
Project titleS International multi-purpose complex
Structural typeReinforced concrete
Principal useApartment buildings
Site area40,548.50 m2
Building area5737.4747 m2
Gross floor area125,120.1410 m2
Floor area ratio14.14%
Floor space index219.67%
Number of households643 households
Table 3. Conversion factors of the main construction materials.
Construction MaterialsSpecificationUnitConversion Factor (ton/unit)Source
ConcreteReinforced concrete m32.40A
Plain concretem32.30A
Mortarm32.10A
CementCementm33.15A
InsulationExpanded polystyrene firstm30.030B
Expanded polystyrene secondm30.025B
Expanded polystyrene thirdm30.020B
Glass wool (24k)m30.024B
Glass wool (48k)m30.048B
Extruded polystyrene firstm30.030B
Extruded polystyrene secondm30.025B
Extruded polystyrene thirdm30.020B
Phenolic foam m30.030B
BoardGypsum boardm30.60B
GlassGlassm32.55B
A: Standard of the estimate for the construction works conversion factor. B: Passive House Institute Korea conversion factor.
Table 4. Selection of the life cycle inventory databases (LCI DBs) for the construction materials (partial).
ClassificationLCI DB TitleSource Data
ConcreteReady-mixed concrete 25-240-15National LCI DB
RebarElectric steel deformed barsNational LCI DB
SandSandNational environmental database
InsulationGlass woolNational LCI DB
CementCementNational LCI DB
Gypsum boardGypsum boardNational LCI DB
Polystyrene panelFoaming polystyrene boardNational environmental database
Table 5. Amounts of the construction wastes based on weight.
No.Work TypeConstruction MaterialsSpecificationUnitQuantity (Unit)Classification of WasteConversion FactorMaterial Loss RateConstruction Waste (kg)
1Reinforced concrete workConcrete20-240-15m391,563Concrete2300.000.003631,784.7
2Masonry workCement brick190*90*57EA4,593,749Concrete block2.000.030275,624.9
3Reinforced concrete workRebarH10-H13ton7518Rebar1000.000.030 225,540.0
4Plaster work CementBulkton4178Concrete1000.000.030125,340.0
5Reinforced concrete workConcrete pad25-180-12m39947Concrete2300.000.00368,634.3
6Water-proofing workOrdinary Portland cement40 kgbag35,795Cement40.000.03042,954.0
7Water-proofing workSand-m32214Sand1700.000.01037,638.0
8Plaster work CementBubble, Bulkton1243Concrete1000.000.03037,290.0
9Masonry workSand-m32145Sand1700.000.01036,465.0
10Plaster work Sand-m32091Sand1700.000.01035,547.0
11Plaster work Ordinary Portland cement 40 kgbag29,451Cement40.000.03035,341.2
12CarpentryGypsum board9.5 Tm267,694Gypsum board6.180.08033,440.8
13Tile workSand-m31743Sand1700.000.01031,331.0
14Masonry workCement brick6‘EA74,141Concrete block14.000.03031,139.2
15Reinforced concrete workGypsum board-m2190,231Gypsum board7.600.02028,915.1
16Tile workOrdinary Portland cement40 kgbag21,368Cement40.000.03025,641.6
17Plaster work MortarT18m242,835Concrete block18.000.03023,130.9
18Finishing work Gypsum board15 Tm224,047Gypsum board9.750.08018,756.7
19Tile workEarthenware -m236,917Tile14.400.03015,948.1
20Tile workEarthenware-m226,742Tile18.000.03014,548.7
Table 6. Results of construction waste amounts.
Classification of WasteConstruction Waste AmountShare
Concrete883,437 kg45.26%
Concrete block331,354 kg16.98%
Rebar225,540 kg11.55%
Sand147,416 kg7.55%
Cement126,520 kg6.48%
Gypsum board125,174 kg6.41%
Tile68,968 kg3.53%
Insulation29,886 kg1.53%
Granite13,645 kg0.70%
Total1,951,940 kg100.00%
Table 7. Amount of the construction wastes for each environmental impact.
Classification of WasteWork TypeUnitWaste Amount
(Unit)
Environmental Impact Assessment Result Value
GWPADPAPEPODPPOCP
kg-CO2eqkg-Sbkg-SO2eqkg-PO43-eqkg-CFC-11eqkg-C2H4eq
Concrete blockCement mortarPlasterton23.16.2 × 1041.4 × 1021.6 × 1022.8 × 1013.2 × 10−36.9 × 101
Steel trowel finishMasonryton17.34.7 × 1041.0 × 1021.2 × 1022.1 × 1012.4 × 10−35.2 × 101
Plasterton14.84.0 × 1048.6 × 1011.1 × 1021.8 × 1012.0 × 10−34.4 × 101
Protection mortarPlasterton14.33.9 × 1048.3 × 1011.0 × 1021.7 × 1012.0 × 10−34.3 × 101
Cement brickMasonryton261.93.2 × 1043.9 × 1014.1 × 1015.9 × 1001.3 × 10−33.4 × 100
Dry cement mortarMasonrym354.98.4 × 1011.3 × 10−11.8 × 10−12.7 × 10−23.2 × 10−61.5 × 10−1
Plasterm316.32.5 × 1014.0 × 10−25.3 × 10−28.0 × 10−39.4 × 10−74.5 × 10−2
RebarRebarReinforced concreteton225.57.9 × 1046.3 × 1025.2 × 1027.8 × 1012.4 × 10−37.7 × 101
CementCement bulkWater proofington43.04.5 × 1044.9 × 1015.6 × 1018.0 × 1001.5 × 10−31.3 × 101
Cement-40kgPlasterton35.33.7 × 1044.0 × 1014.6 × 1016.6 × 1001.3 × 10−31.1 × 101
Tileton22.62.4 × 1042.6 × 1012.9 × 1014.2 × 1008.0 × 10−46.8 × 100
Masonryton25.62.7 × 1042.9 × 1013.3 × 1014.8 × 1009.1 × 10−47.8 × 100
Concrete18 MPaReinforced concretem329.81.3 × 1044.7 × 1012.1 × 1012.4 × 1001.4 × 10−33.4 × 101
16 MPaReinforced concretem38.53.6 × 1031.3 × 1015.9 × 1006.9 × 10−13.9 × 10−49.6 × 100
24 MPaReinforced concretem3274.71.2 × 1053.0 × 1027.4 × 1012.5 × 10−11.3 × 10−23.2 × 102
BoardGypsum board-9.5TInterior finishington29.64.1 × 1031.1 × 1012.3 × 1013.9 × 1004.2 × 10−45.6 × 100
Plywood boardInterior finishington7.31.0 × 1032.8 × 1005.7 × 1009.6 × 10−11.0 × 10−41.4 × 100
Gypsum board-9.5TCarpentryton17.82.5 × 1036.9 × 1001.4 × 1012.4 × 1002.5 × 10−43.4 × 100
Gypsum board-15TCarpentryton11.61.6 × 1034.5 × 1009.1 × 1001.5 × 1001.6 × 10−42.2 ×100
Plywood boardCarpentryton2.94.0 × 1021.1 × 1002.3 × 1003.9 × 10−14.1 × 10−55.6 × 10−1
Sound-proofingCarpentryton16.62.3 × 1036.4 × 1001.3 × 1012.2 × 1002.4 × 10−43.2 × 100
InsulationT75Carpentryton6.51.4 × 1041.1 × 1032.7 × 1021.8 × 1011.9 × 10−44.2 × 101
T105Carpentryton3.87.9 × 1036.7 × 1021.6 × 1021.1 × 1011.1 × 10−42.5 × 101
SandSandWater proofingm320.98.1 × 1011.9 × 10−12.3 × 10−14.0 × 10−24.6 × 10−66.8 × 10−2
Plasterm322.18.6 × 1012.0 × 10−12.4 × 10−14.3 × 10−24.9 × 10−67.2 × 10−2
Tilem321.58.3 × 1012.0 × 10−12.4 × 10−14.1 × 10−24.7 × 10−66.9 × 10−2
Masonrym318.47.1 × 1011.7 × 10−12.0 × 10−13.5 × 10−24.1 × 10−66.0 × 10−2
TileCeramic tileTileton39.91.4 × 1047.7 × 1013.4 × 1014.9 × 1001.3 × 10−42.5 × 101
Porcelain tileTileton29.11.0 × 1045.6 × 1012.5 × 1013.6 × 1009.5 × 10−51.8 × 101
GraniteGraniteMasonrym35.94.9 × 1031.4 × 1013.0 × 1014.3 × 1011.6 × 10−42.2 × 100
ADP: abiotic depletion potential, AP: acidification potential, EP: eutrophication potential, GWP: global warming potential, ODP: ozone depletion potential, POCP: photochemical ozone creation potential.
Table 8. Environmental impact assessment of construction wastes per gross floor area.
Construction WasteGWPADPAPEPODPPOCP
EmissionShareEmissionShareEmissionShareEmissionShareEmissionShareEmissionShare
kg-
CO2eq
%kg-
Sbeq
%kg-
SO2eq
%kg-
PO43-eq
%kg-
CFC-11eq
%kg-
C2H4eq
%
Concrete1.34 × 10521.27 3.61 × 10210.12 1.00 × 1025.27 3.35 × 1001.17 1.44 × 10−242.28 3.60 × 10244.18
Concrete block2.20 × 10534.92 4.44 × 10212.44 5.35 × 10228.20 8.97 × 10131.32 1.09 × 10−232.00 2.11 × 10225.90
Cement1.34 × 10521.27 1.43 × 1024.01 1.65 × 1028.70 2.35 × 1018.21 4.49 × 10−313.18 3.83 × 1014.70
Rebar7.94 × 10412.60 6.29 × 10217.63 5.21 × 10227.46 7.84 × 10127.38 2.35 × 10−36.90 7.70 × 1019.45
Insulation2.14 × 1043.40 1.81 × 10350.73 4.20 × 10222.14 2.86 × 1019.99 3.00 × 10−40.88 6.63 × 1018.14
Tile2.43 × 1043.86 1.33 × 1023.73 5.83 × 1013.07 8.48 × 1002.96 2.24 × 10−40.66 4.34 × 1015.33
Gypsum board1.18 × 1041.87 3.32 × 1010.93 6.71 × 1013.54 1.13 × 1013.95 1.22 × 10−33.58 1.63 × 1012.00
Granite4.85 × 1030.77 1.41 × 1010.40 2.98 × 1011.57 4.29 × 10114.98 1.56 × 10−40.46 2.22 × 1000.27
Sand3.21 × 1020.05 7.66 × 10−10.02 9.11 × 10−10.05 1.59 × 10−10.06 1.82 × 10−50.05 2.68 × 10−10.03
ADP: abiotic depletion potential, AP: acidification potential, EP: eutrophication potential, GWP: global warming potential, ODP: ozone depletion potential, POCP: photochemical ozone creation potential.

