Article

GIS-Based Material Stock Analysis (MSA) of Climate Vulnerabilities to the Tourism Industry in Antigua and Barbuda

1
School of Environment, Enterprise and Development, University of Waterloo, Waterloo, ON N2L3G1, Canada
2
Department of Geography and Environmental Management, University of Waterloo, Waterloo, ON N2L3G1, Canada
3
School of Sustainability, Interdisciplinary Center (IDC), Herzliya 4610101, Israel
*
Author to whom correspondence should be addressed.
Sustainability 2020, 12(19), 8090; https://doi.org/10.3390/su12198090
Submission received: 27 July 2020 / Revised: 17 September 2020 / Accepted: 28 September 2020 / Published: 30 September 2020
(This article belongs to the Special Issue The Metabolism of Islands)

Abstract

:
In the past decades, the Caribbean economy has transformed to rely primarily on tourism with a vast amount of infrastructure dedicated to this sector. At the same time, the region is subject to repeated crises in the form of extreme weather events that are becoming more frequent, deadly, and costly. Damages to buildings and infrastructure (or the material stocks) from storms disrupt the local economy by an immediate decline in tourists and loss of critical services. In Antigua and Barbuda (A&B), tourism contributes 80% to the GDP and is a major driver for adding new material stocks to support the industry. This research analyzes A&B’s material stocks (MSs) in buildings (aggregates, timber, concrete, and steel) using geographic information systems (GIS) with physical parameters such as building size and footprint, material intensity, and the number of floors. In 2004, the total MSs of buildings was estimated at 4.7 million tonnes (mt), equivalent to 58.5 tonnes per capita, with the share of non-metallic minerals to be highest (2.9 mt), followed by aggregates (1.2 mt), steel (0.44 mt), and timber (0.18 mt). Under the National Oceanic and Atmospheric Administration’s (NOAA’s) 2 meter (m) sea level rise scenario, an estimated 4% of the island’s total MSs would be exposed. The tourism sector would disproportionately experience the greatest exposure of 19% of its MSs. By linking stocks to services, our research contributes to the understanding of the complexities between the environmental and economic vulnerability of island systems, and the need for better infrastructure planning as part of resilience building.

1. Introduction

As economies develop, they stimulate the demand for essential services that are provided by the built environment (also referred to as “material stocks”) in the production and consumption of goods and services, viewed as “the material basis of societal well-being” [1]. The growth and maintenance of these material stocks occur by mobilizing material and energy flows, either from domestic sources or through imports from other societies. The larger the stocks, the greater the flows required to maintain and reproduce these stocks, creating a feedback loop that has been termed as the “material–stock–flow–service nexus” (ibid.). This process of organizing and reproducing material stocks and flows by society is referred to as “social metabolism” [2].
Focusing on a small island state in the Caribbean, this research provides evidence on the extent to which the nation’s built environment is vulnerable to the impacts of climate change. Utilizing the state-of-the-art spatially explicit material stock accounting (MSA), we highlight the economic impacts on Antigua and Barbuda’s (A&B) tourism industry under a 1 m and 2 m sea level rise (SLR) scenario. Services including hotel accommodations, restaurants, real estate, yachting, and marina facilities are linked to the expansion of the tourism industry and the built infrastructure. With tourism contributing to approximately 80% to the GDP [3], the small island nation constantly experiences a heightened level of economic uncertainty due to its exposure to external economic shocks and climate-related events such as hurricanes. Based on our findings, we critique spatial planning and maladaptive practices such as coastal squeeze that need to be urgently considered for building system resilience. The Caribbean is the most tourism-reliant region in the world [4]. Tourism infrastructure and assets are mostly concentrated along the coasts and are subject to high risk from tropical storms. As such, tourism-dependent economies in the Caribbean face the highest risk worldwide [5]. Yet, growth and continued reliance on this climate-sensitive economic sector requires a continuous (re)accumulation of material stocks in buildings to meet growing demands. At the same time, the damages incurred from climate-related events are substantial in size in comparison to their economies. Ten percent of the worst impacted countries in terms of losses as a share of their GDP were Caribbean nations. For example, during the 2017 hurricane season, Sint Maarten’s losses were estimated at 797% of the country’s annual gross domestic product (GDP), the British Virgin Islands with 309% of their GDP, and Dominica with 259% of their GDP [6]. Sea level rise (SLR) is an imminent threat to small island developing states (SIDSs) as 26% of their land area is 5 m or less above sea level, equating to roughly 20 million people (or 30% of the SIDS population) living within these high-risk areas [7].
The high cost of loss and damage witnessed by these Caribbean islands is accompanied by excessive national debt, and the reliance on imports to supply new materials for infrastructure development and reconstruction [8,9]. Losses equate mostly to the damages caused to the built environment that delivers critical goods and services such as transport, health, food, and energy. By 2050, climate inaction is expected to cost Caribbean countries an estimated 10% of their GDP annually from hurricane damages and loss of tourism revenue alone, rising to 22% by 2100 [10]. By 2150, conservative estimates of SLR suggest that only a fraction of the current 66 million inhabitants of the small island developing states (SIDSs) will be spared from inundation [11]. In the face of these challenges and threats, achieving island sustainability is critical for these SIDSs [12,13]. In this study, island sustainability is defined as achieving a high quality of social and human wellbeing at the lowest environmental costs. Island sustainability also implies adapting and increasing resiliency to buffer against the adverse impacts of global environmental change and economic instabilities while maintaining resource security and self-reliance.
This study is part of a larger effort to study the metabolism of islands, an emerging research field within industrial ecology, that aims to seek solutions to sustainability challenges faced by small islands (see the initiative “Metabolism of Islands” (https://metabolismofislands.org) and the special issue Metabolism of Islands, Sustainability: https://www.mdpi.com/journal/sustainability/special_issues/metabolism_islands). The objectives of the research are two-fold. One is to contribute to the scant literature on the relationship of stocks and services, in particular tourism within an island context, and their exposure to climate vulnerability. We analyze these findings in the context of island sustainability by asking how can islands leverage spatial infrastructure planning as a way to build resilience and adapt to climate change, including sea level rise scenarios. Second, as a methodological contribution, this study introduces novelties to the geographical information systems (GIS)-based stock accounting method by presenting a building footprint-based identification of buildings and the use of Monte Carlo simulation in assigning material intensity typologies (MITs). In this study, the focus is directed towards classifying and estimating the material stock of construction materials including wood, non-metallic minerals, steel, and iron that are utilized for the growth and expansion of the building stocks.

2. Advances in Material Stock Accounting (MSA) Research

The 20th century has seen a massive increase in material flows that go into creating material stocks, from just over 20% in 1900 to over 50% in 2010 [14]. This has inspired several studies to focus on the dynamics and growth of anthropogenic stocks that require ever-increasing virgin materials [15]. Studies quantifying and characterizing the material composition of in-use material stocks as a potential pool of secondary resources for future material recovery are becoming important [16,17,18,19]. With the growing relevance of material stock accounting/analysis (MSA), researchers are constantly proposing additional approaches for improved material stock accounting. For example, Muller et al. [20] identified two main methodological approaches for material stock measurements, including a top-down and a bottom-up approach. Top-down approaches integrate historical data based on data availabilities on material inflows and material outflows determined by lifespan characteristics to quantify material stock [20,21]. In contrast, bottom-up approaches are data intensive and combine input parameters such as gross floor area, number of stories, and the average size of the dwelling area [22]. The bottom-up approaches require material end uses to be separated into categories sharing material intensities used to calculate material stock. This approach is mostly favored for the efficient use of GIS data [23] to explore spatial material stock accounts for local-scale studies worldwide [15,18,24,25,26]. Augiseau and Barles [27] analyzed thirty-one studies on material stocks and flows, along with distinguishing between six methodological approaches that were commonly used in such research.
Observing the surge of research related to the built environment within the past two decades, MSA is increasingly incorporating the use of GIS [16]. GIS comprises technology tailored to collecting, analyzing, and managing georeferenced data to produce location-specific information [23]. The application of GIS is not limited to calculating the size of the material stocks within a region but, from a spatial perspective, it can identify where material stocks have accumulated and how they are distributed within socio-economic systems. The applications of 4D-GIS and spatial data applied in previous studies focused on understanding the accumulation of material stocks on a temporal and spatial scale, in two different urban areas [24]. After a catastrophic earthquake and tsunami struck Japan, a material stock analysis (MSA) estimated the quantity of construction materials lost from the physical infrastructure (including buildings and roads) using GIS [25]. Wallsten et al. [28] combined a bottom-up material flow analysis (MFA) approach with GIS as an assessment tool to spatially characterize and examine hibernating metal stocks in urban infrastructure. Similarly, Kleemann et al. [15] utilized GIS data to quantify material stocks in buildings and map their spatial distribution within the city of Vienna through combining information about demolition activities to yield waste flow data. Mesta et al. [18] adopted a bottom-up approach to quantify the material stocks for residential buildings in Chiclayo (Peru) utilizing GIS data and data pertaining to the physical size of buildings. In Sweden, Heeren et al. [29] presented a bottom-up approach stock model with the use of geo-referenced building data to determine the building material stocks of Swiss residential buildings based on volumetric properties [29]. Symmes et al. [30] presented a bottom up GIS methodological approach to explore the vulnerability of material stock in buildings in Grenada [30]. Pott et al. [31] (paper submitted) adopt a spatial (bottom-up) GIS approach to study the relationship of in-use stocks and their services using a city and an island as cases.

3. Socio-Metabolic Research on Islands

Analyzing material stocks (MSs) plays an important and multifaceted role within socio-metabolic research, including functioning as service suppliers, wealth indicators, capital and resource repositories, and indicators for the spatial development of the built environment [32]. Small islands are ideal units of study for socio-metabolic research, with clear and distinct systems boundaries to track flows. At the same time, islands suffer from resource constraints due to their narrow resource base and limited waste absorption capabilities, causing sustainability problems both on the input side (scarcity and import dependency) and the output side (land and sea pollution) [17,33,34,35,36,37]. The lack of resources and relatively small populations limit the size of island economies and the ability to achieve economies of scale, thus pushing the overdependence of small island states on external markets to meet the majority of their resource needs. The openness of small island economies to external markets and their high dependency on trade to meet basic needs heighten their level of vulnerability.
Socio-metabolic research offers islands a unique perspective on sustainability, leveraging resource use patterns to build system resilience. Understanding the physical basis of island economies highlights areas of opportunities and constraints impacting sustainable development [38,39,40]. However, few socio-metabolic studies have been conducted on small islands. The first known material stock and flow account for an island was for Trinket (Nicobars, India) that portrayed the changing characteristic metabolic profile of an indigenous society subject to development programs from the Indian state [41], that was later compared with the rise in material and energy consumption due to the excessive aid following the 2004 Asian tsunami [42]. Krausmann et al. [43] focused on the application of a material flow analysis (MFA) for two high-income island states, Iceland and Trinidad and Tobago. The resource use patterns revealed that both islands heavily rely on domestic extractions, including fisheries, natural gas, and oil. Shah et al. [44] focused on institutional factors in Trinidad and Tobago and the challenges of implementing potential solutions tackling the island’s waste metabolism of plastics and packaging material. Okoli [45] quantified biomass flows for Jamaica from 1961 to 2013 in the context of national food security from an island perspective. Marcos-Valls et al. [46] applied an integrated multi-scale socio-metabolic analysis for Menorca (Spain) to analyze the environmental and economic performance of major economic activities such as tourism in an island context.
Material stocks and flows were studied on the Greek island of Samothraki using a socio-metabolic approach [40,47]. More recently, Fischer-Kowalski et al. [48] focused on Samothraki’s regime shift as the island transitions from an agriculture-based economy to a service (tourism) economy. In the Philippines, a material flow analysis was conducted to understand trends within a high-density country experiencing a shift from renewable to non-renewable materials as a result of ongoing development [49]. Symmes et al. [30] conducted the first material stock–flow analysis in the Caribbean, with a focus on Grenada’s metabolism of construction materials, how they are distributed across the different sectors of the economy, and the potential impacts as a consequence of sea level rise [30]. Pott et al. [31] (paper submitted) explore the material stock–service relationship in Grenada and examines future material stock scenarios with consequences for island sustainability. The lack of proper waste management systems on islands is a growing concern as they undergo rapid development, with waste produced as a by-product of economic activities. Recently, a case study on the Faroe Islands focused on the practice of sustainable land management through the lens of social metabolism within a growing local economy [50].

4. Study Area: Antigua and Barbuda

A&B is one of the Leeward Islands situated in the eastern Caribbean Sea [51]. The country’s political boundary consists of three islands: Antigua, Barbuda, and Redonda. Antigua functions as the mainland territory and is the largest of the three with an area of 280 sq. km. The sister isle of Barbuda is the second largest with an area of 161 sq. km. The smallest of the three, Redonda, is the only uninhabited island with an area of 1.6 sq. km [51]. Antigua’s landscape is divided into seven parishes, with St. John’s being Antigua’s capital city and Codrington being the capital of Barbuda.
The coupled relationship between the ecosystem and the economy has proven to be beneficial in sustaining economic growth in A&B. The country’s limited natural resources, distinct ecosystems, and its rich cultural heritage are all contributing factors in sustaining the island’s economy. Historically, economic growth was driven by agricultural products such as rum and sugar, but within the past decades, both agricultural and manufacturing activities have been on a drastic decline [52]. Economic driving forces have transitioned towards a more service-based economy, with the provision of services on the island contributing to 90% of the country’s GDP over the past forty years, as a result of the expanding tourism industry [9,52].
The World Bank Group reports that tourism accounts for approximately 80% of GDP, 85% of the foreign exchange, and contributes to 70% of direct and indirect employment in A&B [53]. A&B experiences high temperatures all year round ranging from (23 °C to 27 °C), as the climate is influenced by northeasterly trade winds distinguished by a dry and wet season [52]. The island’s tropical climate and diverse ecosystems support its dominant and flourishing sand, sun, and sea tourism industry. A&B has the highest share of tourism in GDP amongst the other tourism-dependent islands within the SIDSs [54]. Historically from the 1960s to 2018, A&B has witnessed frequent periods of tourism booms and, as such, has experienced significant growth in tourism-related services including, but not limited to, construction, sand mining, transport, and communication [55,56].
However, this small island nation is highly vulnerable to climate change. Among the Caribbean island nations, A&B is ranked 1st in the composite vulnerability index (CVI), followed by the Bahamas (2nd), Dominica (3rd), Grenada (4th), and Jamaica (5th) [57]. By 2050, climate inaction will cost A&B 25.8% of its GDP [10]. The impacts of sea level rise and storm surges amongst the Caribbean and the Caribbean Community (CARICOM) states introduce both short-term and long-term major threats. Global sea level rise is projected to range between 1–2 m above present levels at the end of the 21st century. The impact of the projected sea level rise within the Caribbean will be uniform, however, for smaller islands, the magnitude of economic loss in comparison to the size of the economy will be more greatly felt in St. Kitts and Nevis, Grenada, and A&B [58].

5. Methods

The methodology was conducted in two phases. For this study, the first phase included the state-of-the-art bottom-up approach we selected as the most appropriate with respect to the study’s objective. The alternative approach of quantifying material stocks that has been widely used in previous studies is a top-down method, that accounts for total quantities of stocked materials in a given system. This approach lacks information on the location of these stocks and their uses [59,60,61]. As our purpose is to highlight the vulnerabilities inherent in material stock patterns across the island, we opted for the bottom-up approach as the only other alternative. Alternative GIS datasets allowed us to quantify and map the spatial distribution and uses of the building material stock in A&B. In the second phase, a vulnerability assessment estimates the quantity of MSs threatened by various sea level rise scenarios.

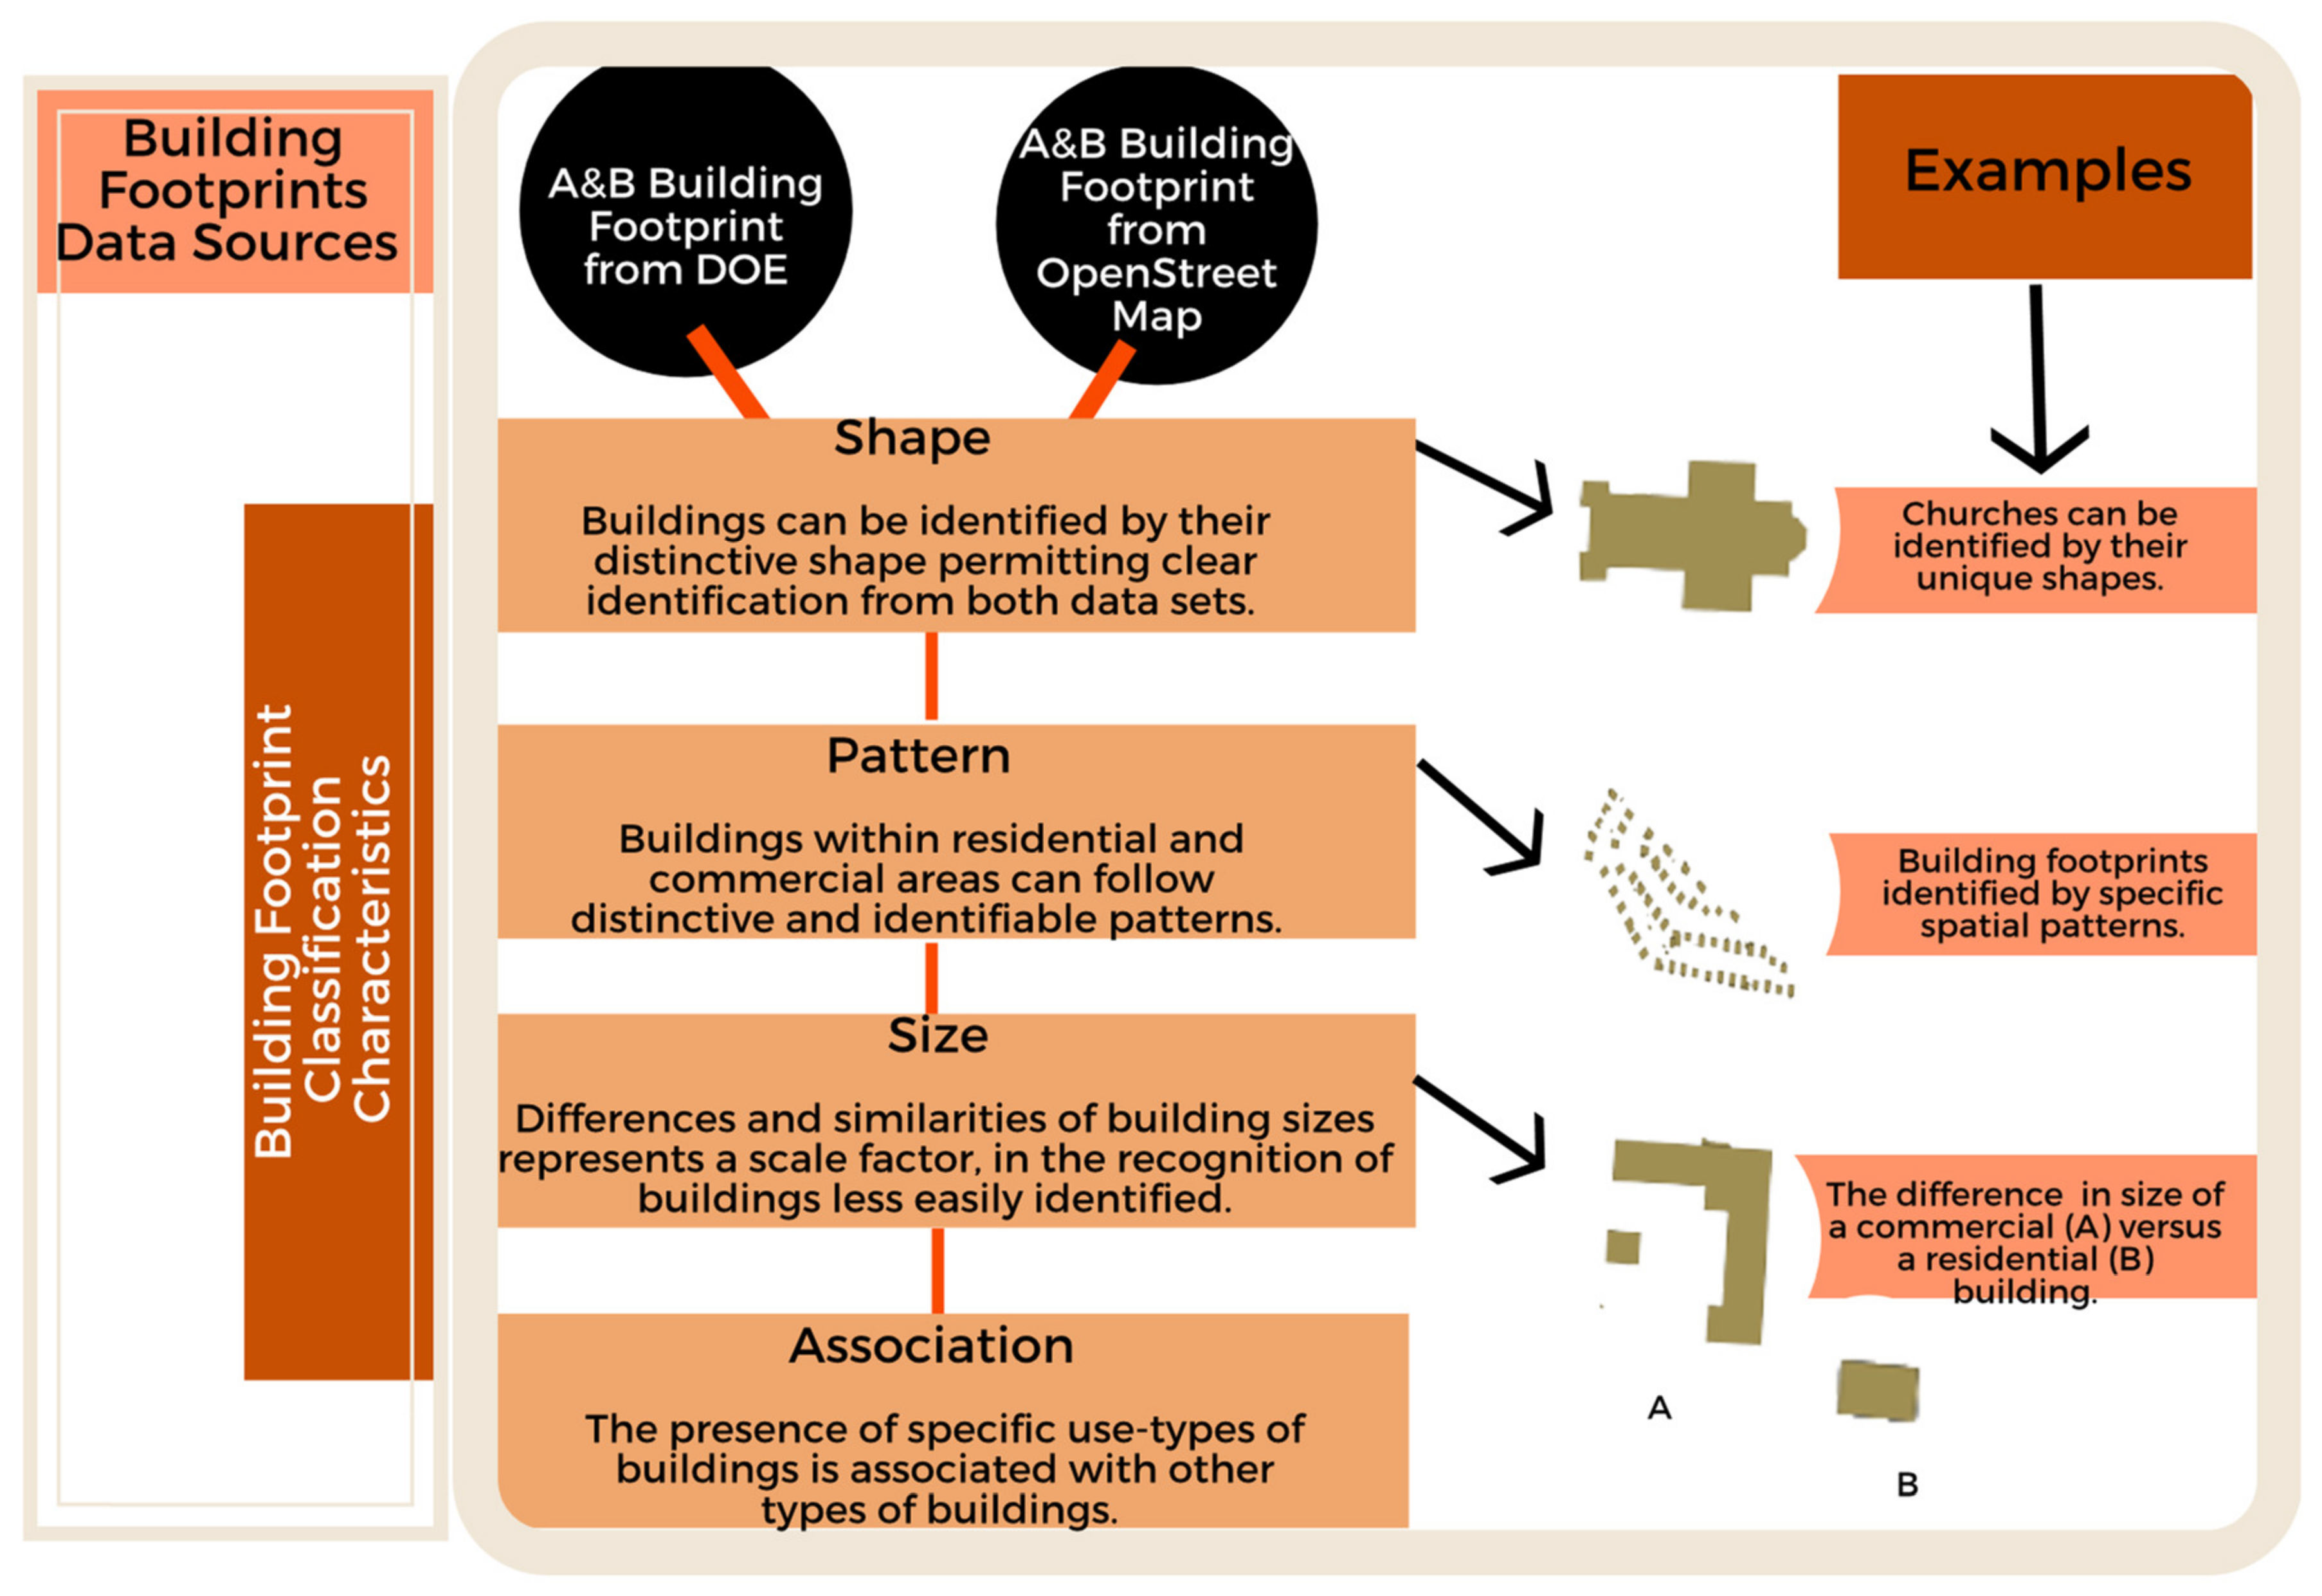
5.1. Material Stock Analysis (MSA) of Buildings

The building shapefile for A&B provided by the Department of Environment (DOE) consisted of 60,000 building footprints (BFs). The first step involved the creation of a classification system to categorize the BFs for the entire island into their respective building use type classes. It consisted of two main components: the interpretation and analysis of remote sensing satellite imagery and local knowledge of the physical infrastructure in A&B. Image interpretation included the analysis of basic elements, such as the shape, size, pattern (spatial distribution), and association of the BFs on external mapping platforms, such as OpenStreetMap (OSM) and Google Maps, as shown in Figure 1. The distinctive shapes of specific building typologies such as cathedrals and stadiums enabled for clear identification of buildings from the OSM data layers to the DOE data layer. Buildings within residential and commercial areas usually follow distinctive spatial patterns that can be identified by their size and layout. Understanding the contrast in sizes amongst different classes of buildings introduces a scale factor that allows for the recognition of buildings that are less easily identified than others. Association involved the observation that the presence of specific building use type classes influences the presence of others. Each village or parish in A&B has present their group of churches, healthcare clinics, and small shops.
The 2004 BF layer was sourced from the DOE in A&B [62] and used as a base map during the building classification process. The original BFs dataset only provided information on the area, perimeter, and feature attributes of each building footprint, resulting in all BFs to be considered as “unclassified” in the absence of assigned categories describing their specific use type role. To accurately compare and analyze the base map, a reference map was provided by OSM that provided greater details (e.g., supplementary geographic data at more defined scales, road networks, location tags of basic areas and other points of interest) during the classification process. Physical data were collected during empirical evaluations of a sample size of 303 building footprints, which were randomly selected within each of the seven parishes in A&B. These data included height measurements and the study of local construction styles for the material intensity typologies (MITs). The generation of material intensity typologies (MITs) is based on the local construction styles practiced within the country under the varying building use type classes. The MIT separates the material intensities (MIs) into four main categories of construction materials (aggregates, wood, concrete, steel). The adoption of GIS tools facilitated the calculation of the total estimated material stock within the island and generated maps of its spatial distribution.
In the absence of actual height measurements of the BFs, the number of stories or floors within each building was used as a proxy. A sensitivity analysis of the original floor estimates of +/− floor change in each building use type shows the fluctuations in the material stock (MS) estimates in Table S4 of the Supporting Information.
To calculate the gross floor area (GFA) for each building footprint (represented by b), the equation is as follows:
G F A   ( b )   = B u i l d i n g   F o o t p r i n t   A r e a   ( b )   ×   T h e   n u m b e r   o f   f l o o r   s t o r i e s   ( b )
MS, measured per material category m (aggregate, timber, concrete, or steel), for a building footprint b is calculated as follows:
M S   ( b , m )   =   G F A   ( b ) ×   M I   ( m )
Total MS ( M S s u m ) for the GFA of a building footprint b is calculated by the sum of the material stock measured per material category m (aggregate, timber, concrete, and steel):
M S s u m   =   Σ   M S ( b , m ) = M S   A g g r e g a t e   ( b , m )   + M S   T i m b e r   ( b , m )   + M S   C o n c r e t e   ( b , m ) + M S   S t e e l   ( b , m )
To calculate the total MSs for all the BFs from the 2004 BF layer, the M S s u m is summed for each BF.

5.2. Residential Material Intensity Distribution

The residential sector accounts for the majority of the material stock estimate, as after classifying the BFs of the entire island, residential dwellings constitute 90% of the BFs in A&B. As a result, the MITs distributed within the residential sector were determined using housing statistics in the 2001 National Census [63]. The ratio of the outer wall materials of household dwellings stated in the census was the determining factor in distributing the corresponding MITs. In the absence of on-site empirical evaluations, material intensities were assigned by a Monte Carlo simulation coded in R. To evaluate the level of uncertainty, the margin of error was assessed through running multiple iterations of the code. This step illustrates how the material stock estimates are affected by the random assignment of MITs that may result in the potential overestimation or underestimation of material stock estimates.

5.3. Estimating Vulnerable Building Stocks

Sea level rise (SLR) assessments in the study were based on 1 m and 2 m scenarios. These values were derived from four scenarios presented by Parris et al. [64], including an intermediate–low scenario measured at 0.5 m, and the highest scenario measured at 2 m. A triangulated irregular network (TIN) file containing elevation data for Antigua was sourced from the DOE [62] and converted into a 1 m resolution raster file. The 0–2 m elevation levels were extracted, while the resulting raster layer contained areas measured at 1 m or less in elevation. An overlay analysis of the elevation polygon file and the BF data layer identified buildings falling within the 1 m and 2 m boundary. These steps were repeated for the 2 m level rise analysis. This methodology was adopted in the absence of shoreline data and accounting for hydrological connectivity to the sea, as utilized in previous research [65,66,67].

6. Results

6.1. Material Intensity Typologies, Height Assumption, and Residential MITs

Table 1 shows the material intensities of the six different material intensity typologies (MITs) examined in this study, which reflect A&B’s local construction styles verified through on-site empirical evaluation observations. The table summarizes the different building use type classes that are categorized under each material typology class.

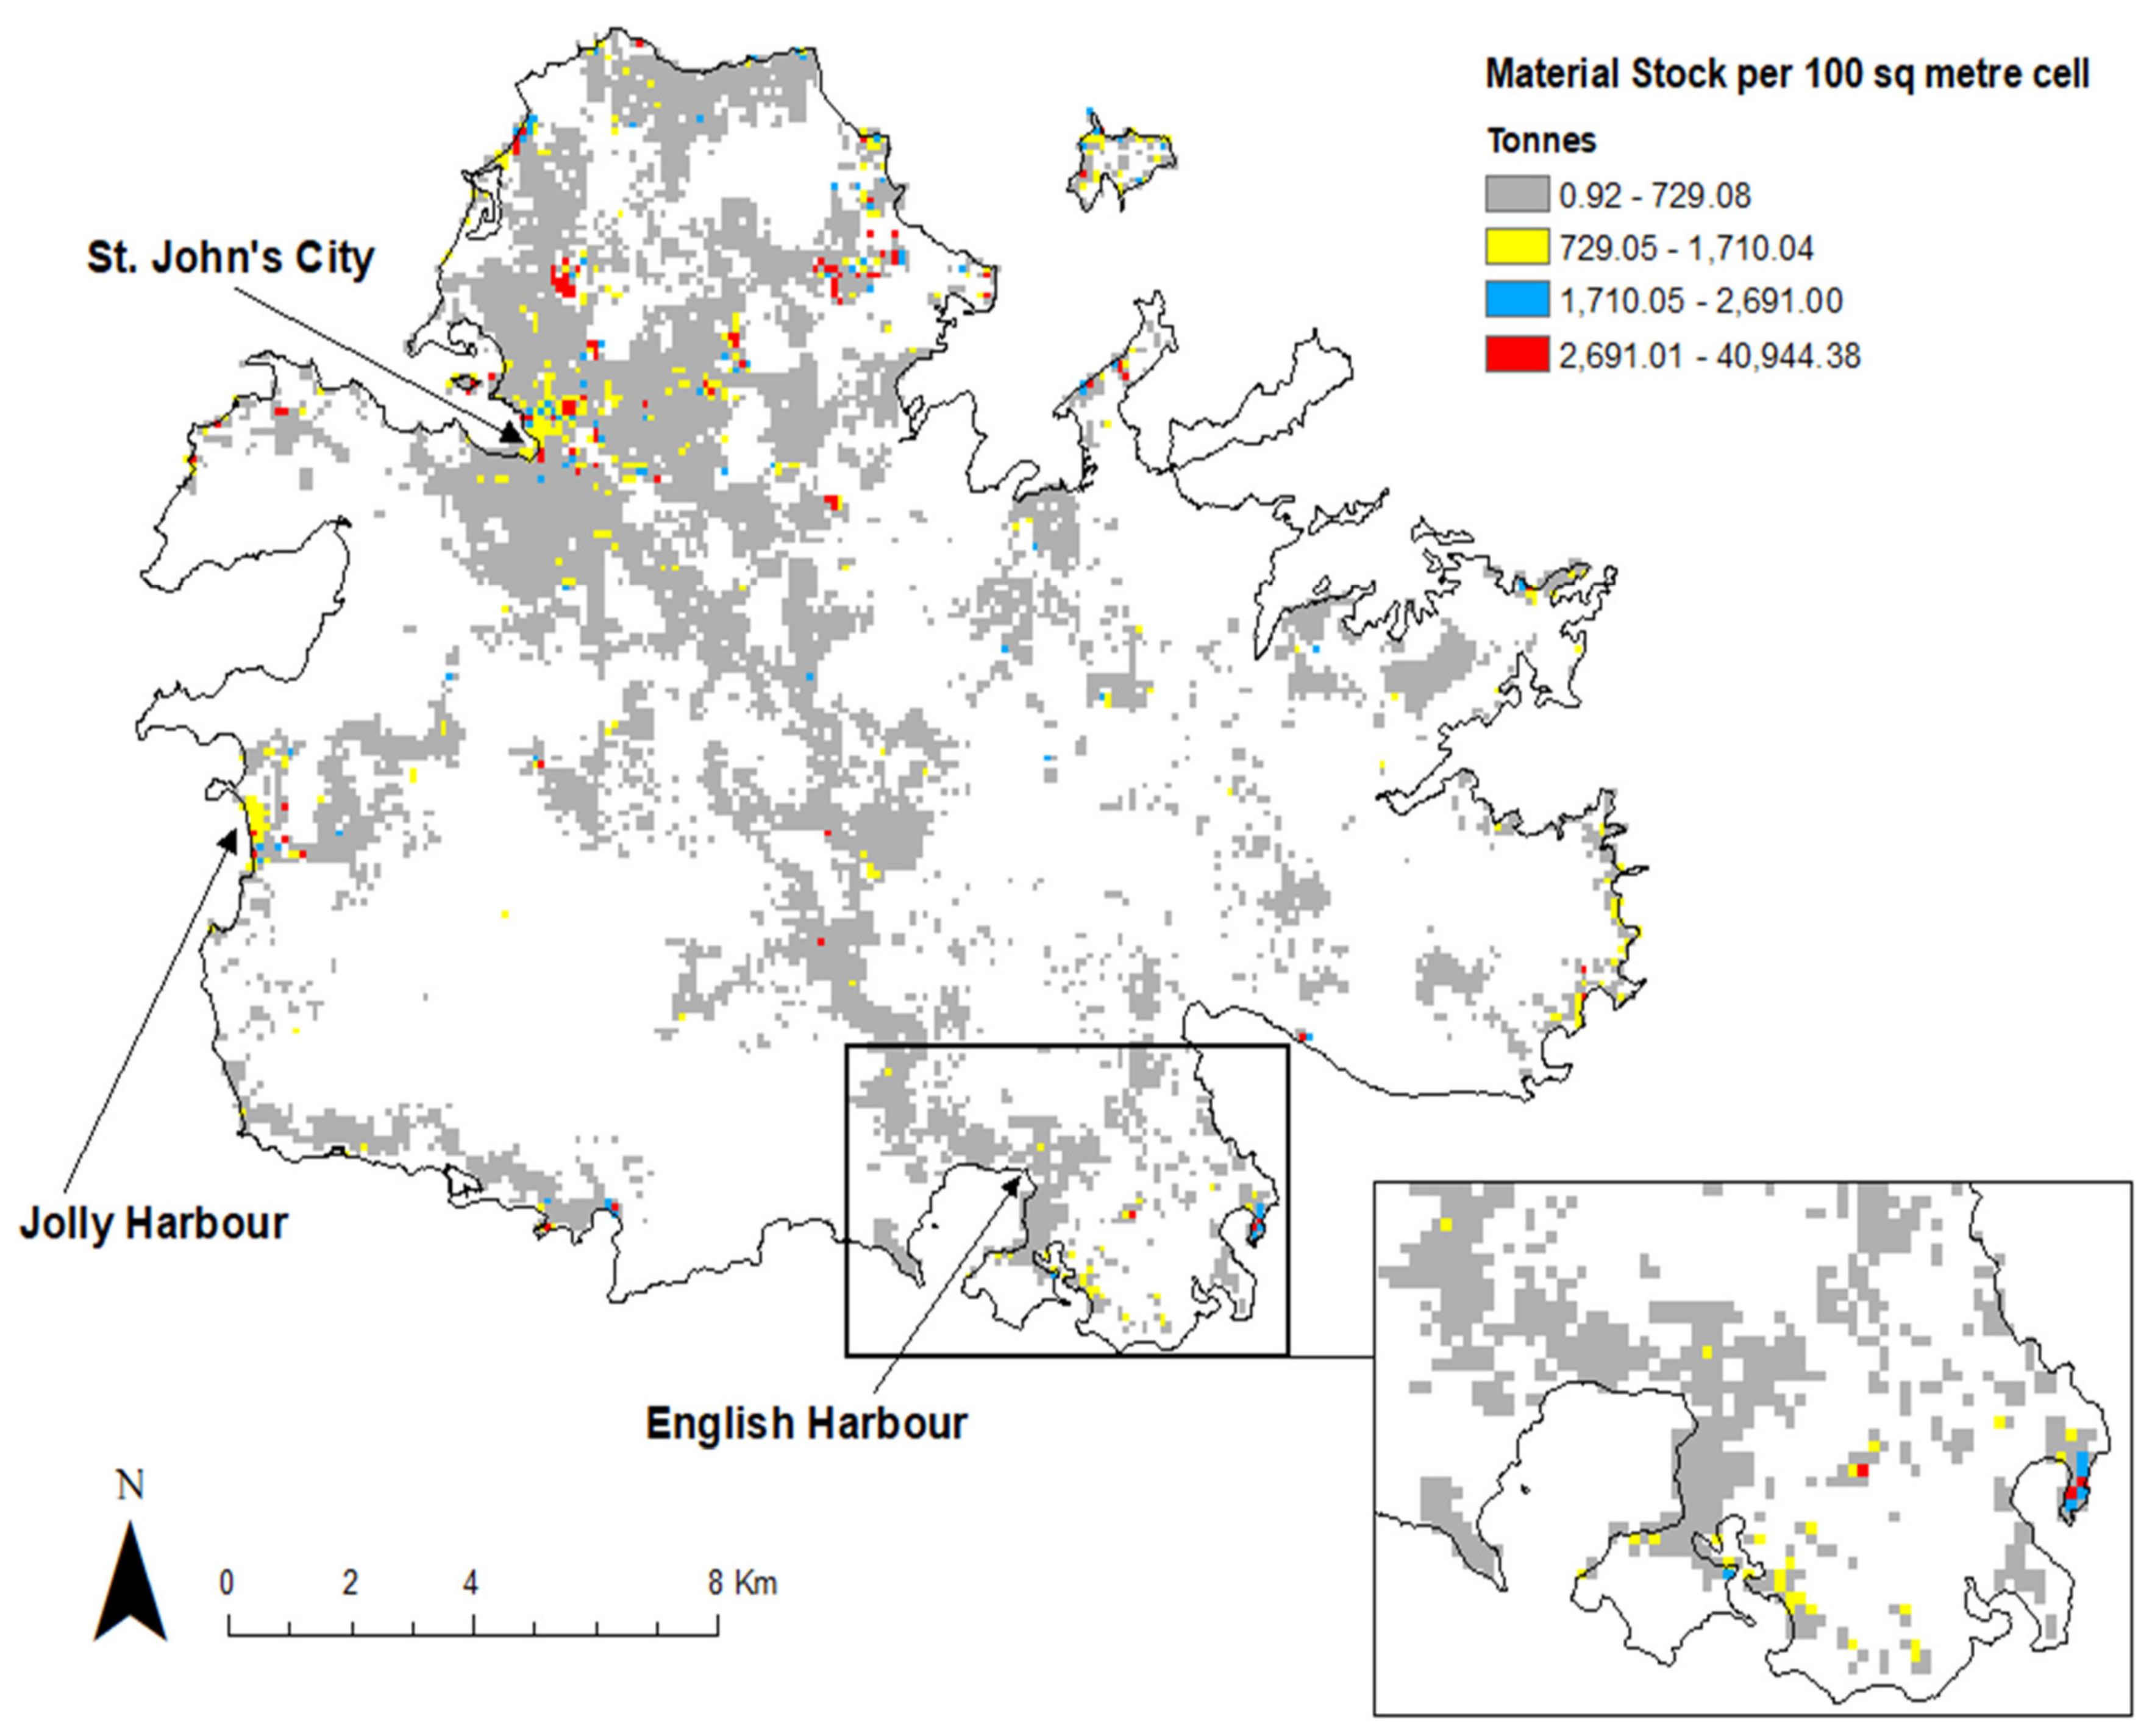
6.2. Material Stock (MS) of Buildings

In 2004, the total material stock for buildings in A&B was calculated at 4.7 million tonnes (mt), which is equivalent to 58.5 t/cap. Concrete accounts for more than half the total MS in buildings, at 62%. Aggregates consume the second-largest amount of materials at 25%, followed by steel and timber with 9% and 4%, respectively.
In terms of the building use type classes, Figure 2 shows that the residential building class dominated with 53% of the total material stock, accounting for 2.5 mt. Tourism and commercial buildings represented the next largest class, accounting for approximately 18% and 17% of the total material stocks, respectively.
Figure 3 shows the density (represented by the standard deviation) of the total material stocks by dividing the island into 100 m2 cells. The densest cells of material stocks are represented by blue and red, while the gray cells correspond to the low accumulation of material stocks.
The hotspots of building material stocks are located mainly around the coastal areas in high developmental areas and main tourism districts. There are a few dense cells located inland on the northern side of the island which are mostly associated with commercial and transport services.
St. John’s city is the main commercial district and the primary port of entry for both the trading of goods and cruise ship arrivals in A&B. The area demonstrated the highest accumulation of building material stocks concentrated within the city core. Other areas, such as Jolly Harbour and English Harbour, indicated high amounts of material stocks and are considered to be intensive tourism areas. The two locations are major tourist hubs with surrounding small-scale and large-scale hotels and restaurants located around the areas’ perimeter.

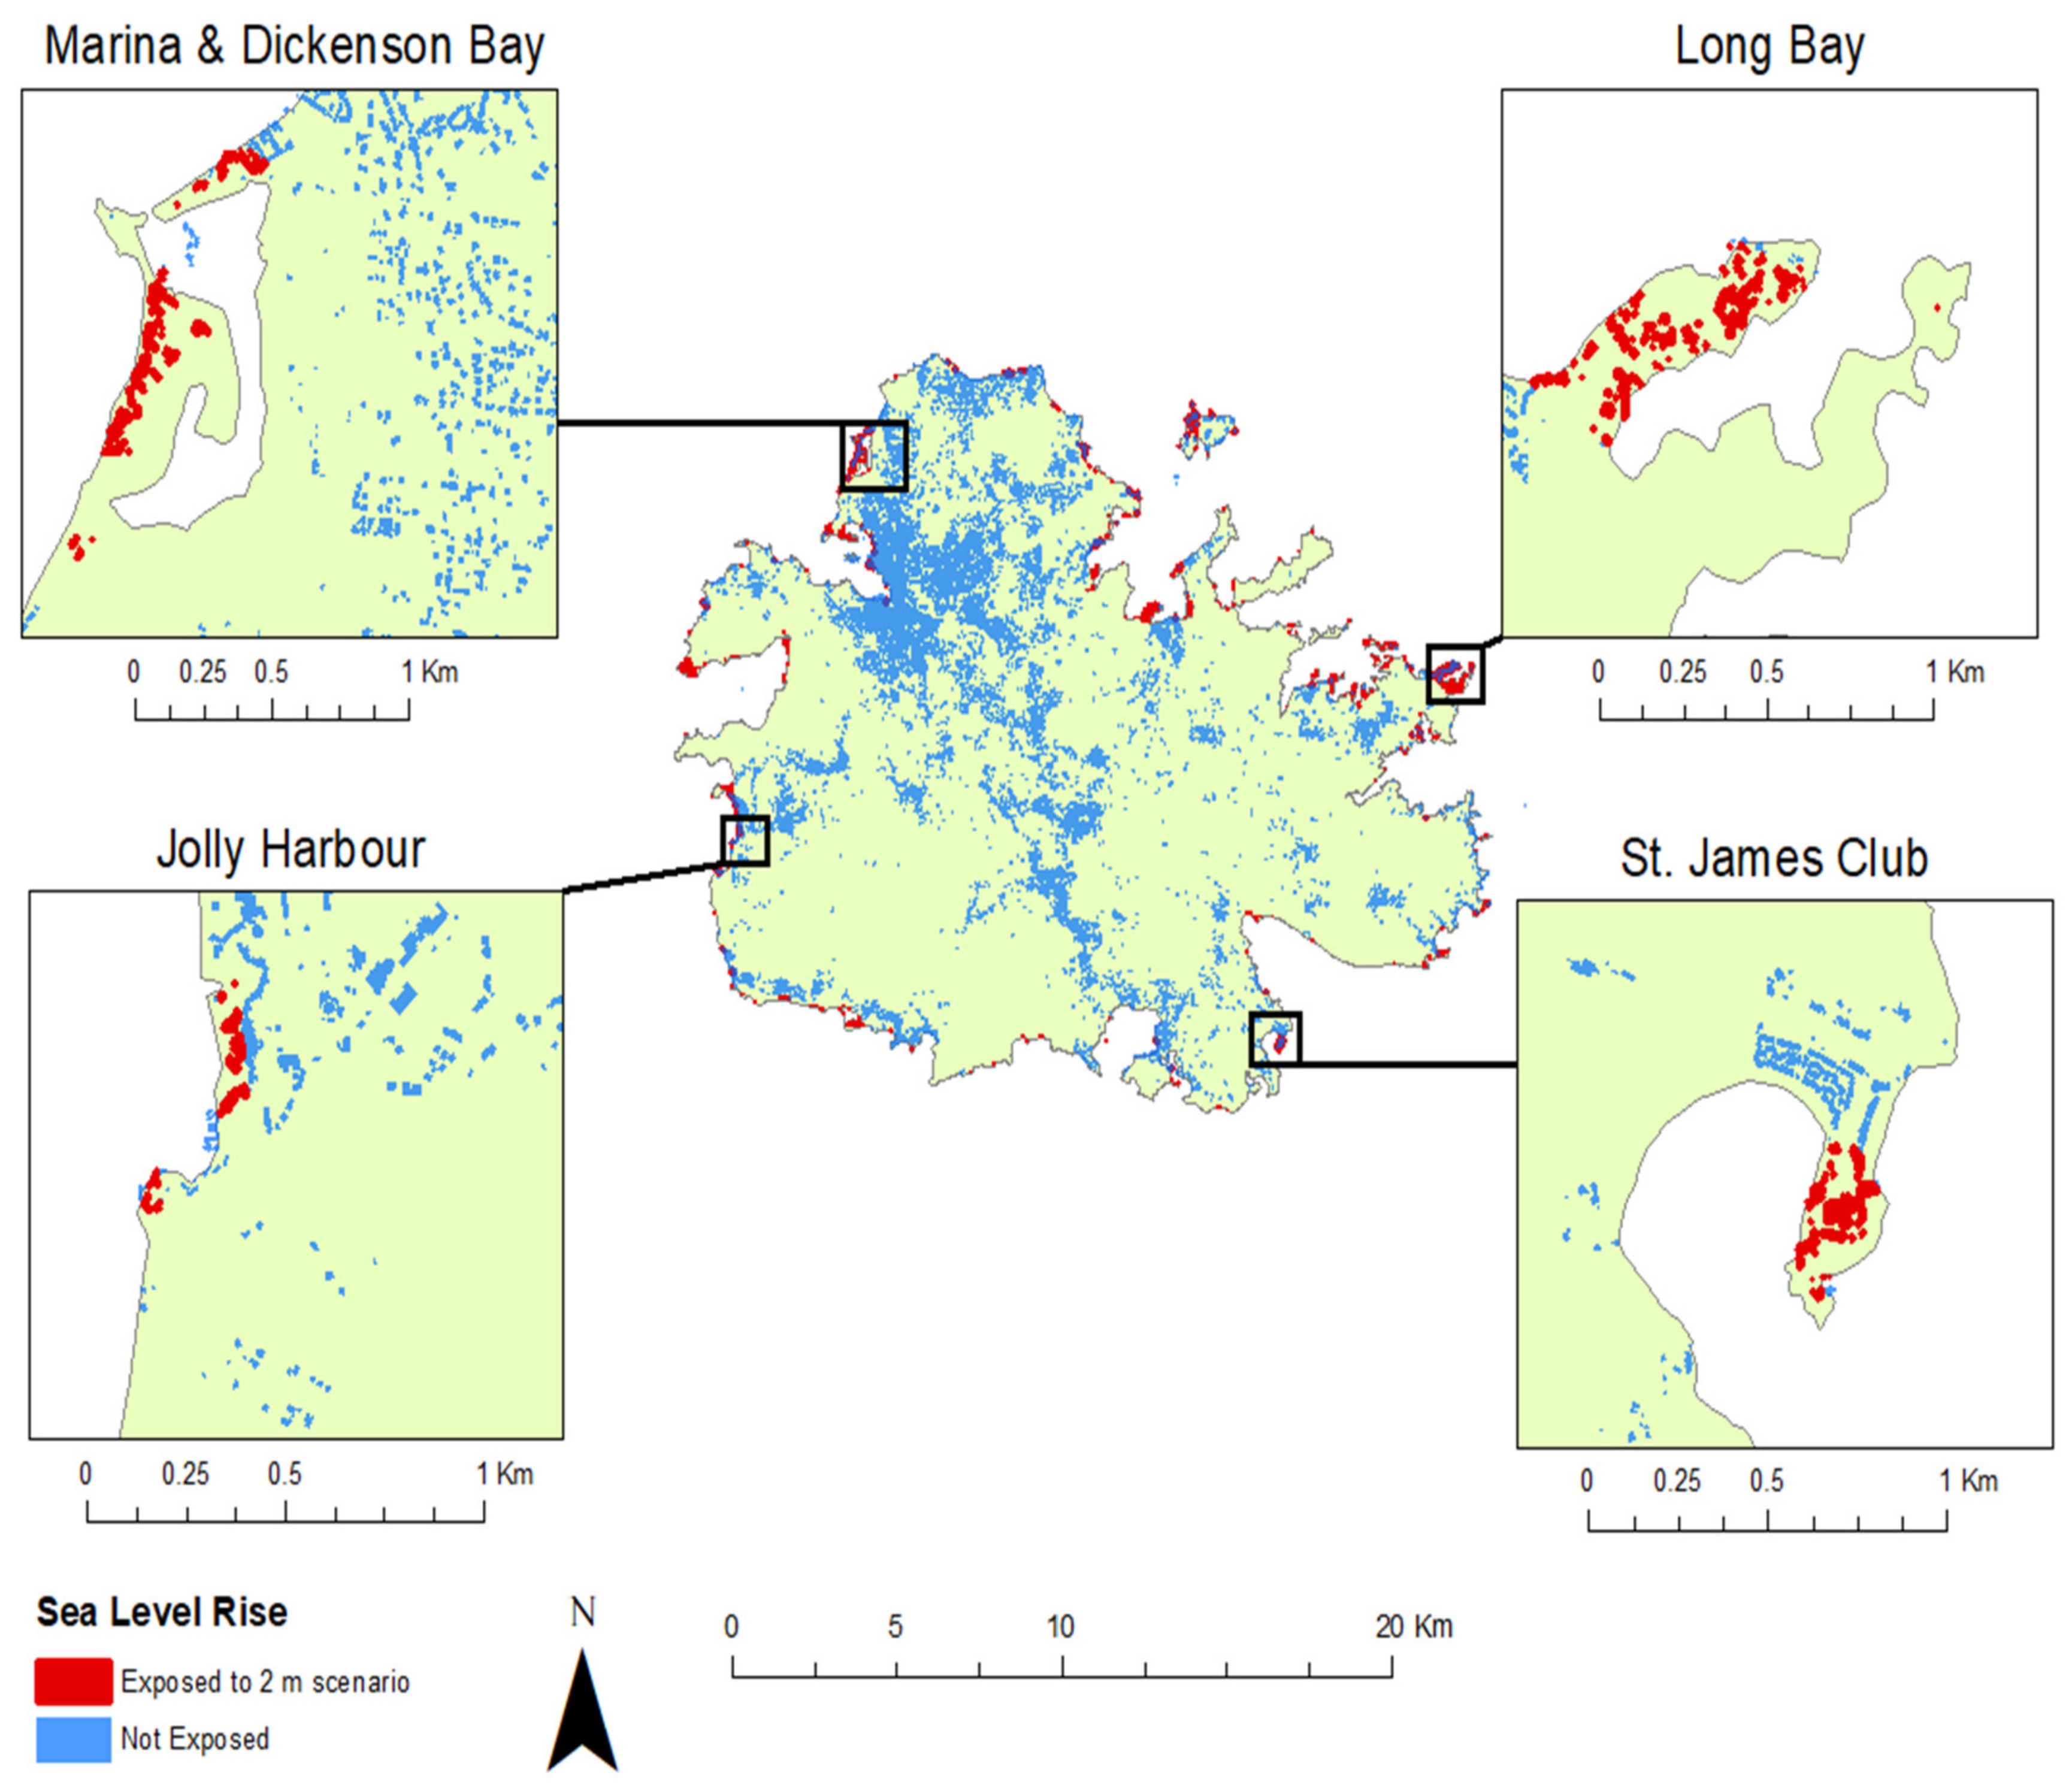
6.3. Sea Level Rise (SLR) Scenario

The vulnerability of the building material stocks in A&B was assessed in terms of a SLR analysis. This analysis identified the number of buildings, material stock, and the respective building use type categories that are exposed under a 1 m and 2 m sea level rise scenario based on global predictions for 2100 [64]. Tourism was the most impacted building use type under the 2 m sea level rise projections, as shown in Table 2 and Figure 4. The tourism industry accounted for approximately 81% of the total material stock exposed in A&B under a 2 m SLR scenario. This is equivalent to approximately 19% of the tourism industry’s material stock exposed and 16% of the country’s GDP.
The majority of the tourism facilities in A&B are situated on the coast and are directly exposed to the threat of SLR. Residential buildings located near the coast are also threatened and consist of 15% of the exposed buildings. In Table 2, tourism, historical sites, and transport-based buildings were most vulnerable as they accounted for the largest proportion of buildings exposed, assessed at 18.8%, 14.5%, and 14.3%, respectively.

7. Discussion

7.1. Resource Efficiency in the Tourism Sector: Maintenance and Replacement Requirements

The role of tourism for A&B is significant, accounting for approximately 80% of the country’s GDP [3], and remains the most productive sector in the constant reconstruction of the economy after a crisis. Before the economic recession in 2008, the island’s economic activity experienced positive growth rates of GDP, with 12% recorded in 2006 and 9% in 2007 [9]. This growth was in direct response to both the tourism and construction sectors that function as drivers of income and employment generation [68]. Apergis and Payne [69] studied the causal relationship between tourism and economic growth for nine Caribbean islands from 1995–2007 and found a bidirectional causality relationship between tourism and economic growth from both a long-term and short-term perspective.
Construction material production is a major driver of environmental and economic burdens, exacerbated in a SIDS like A&B which imports much of its construction materials, and so it is imperative to utilize the existing stock and plan future stock accumulation in a way that reduces demands for further inflows. Material extraction and imports are required to an extent for improving wellbeing and supporting the economy, and the inflows required for stock expansion to meet growing societal and economic demands is considered a characteristic of development [14,70]. Inflows for these ends may plateau and eventually perhaps even decline once material stocks reach a level of sufficiency or “saturation” [60,71,72]. Policy towards lowering this ultimate level using resource efficiency measures to “get more service from less material” [73], i.e., to minimize the need to further accumulate stocks, would be of high priority, especially in the context of a SIDS which, as an importer rather than a producer of materials, has little control over supply-side technical resource efficiency measures [73].
In this regard, our results show that the importance of tourism to A&B’s economy is physically reflected in its high share of nearly 20% of the country’s material stocks and brings to the forefront several otherwise obscured resource efficiency challenges. With visitors comprising 8–11 times the population of A&B, huge volumes of material stocks are needed to support the industry but are only in use for a few months of the year during the tourism season. This under-usage of buildings, infrastructure, and materials is perhaps not a serious issue for the bottom line of the tourism industry and developers. However, it stands as a resource utilization inefficiency and therefore perhaps represents a market failure from the sustainability perspective, similar to the case of idle vehicles recognized elsewhere [74].
Beyond the expansion of the stock, a second demand for inflows is for the maintenance, replacement, and operation of the already existing stock. As material stocks accumulate and eventually reach their end of life, this second type of demand increases [75], and even in economies with relatively steady levels of stock, substantial inflows are still required for these ends [76]. The extension of the useful life of buildings and infrastructure can lower the scales of these maintenance and replacement demands and concurrently also demolition outflows. However, in A&B’s recent history and perhaps its future, a substantial portion of the stock requires constant replacement not because of reaching its end of life but because of disasters, which means constant reliance on imports just to maintain current stock levels. This is extremely environmentally and economically unsustainable and requires measures involving integrated policy, planning, and construction of more resilient buildings and infrastructure to avoid these throughputs of materials. For any remaining unavoidable outflows, local technical and institutional capacities to reuse materials are required. Our results can directly inform the formulation of such policy.

7.2. The Influence of Tourism Material Stocks on the Growth of Island Services

At the same time, a spatial analysis of the distribution of material stocks in A&B highlights the hotspots of the location of the built environment and their associated services. The concentration is in areas of increased commercial centers and tourism-based services, where most physical infrastructure development also takes place. The main hotspots are close to the island’s coastal areas. The capital, St. John’s, shows a high material stock accumulation within its core, and this location also hosts one of the island’s central business hubs, in addition to accommodating the passage of all the cruise ships docking on the island and the main seaport. The high accumulation of material stocks with St. John’s city (Figure 4) can be connected to the many services that are provided by the built environment within the city core, thus building upon the material stock–flow–service nexus, a feedback loop recently explored by Pott et al. [31] (paper submitted) in Grenada.
The outskirts of the city core are surrounded by a growing urban residential area where a smaller quantity of MSs can be found. Residential development has favored the northern side of the island where pockets of medium–high material stocks are distributed, as well as where the airport is situated. MS is present with low–medium levels in the middle of the island where primary and secondary roads are used to travel to the southern end of the island. This type of development is referred to as ribbon development and, according to Davies (as cited in Cohen, [77]), (p. 226), ribbon developments are “beaded clusters of activities strung out alongside major roads…that may contain a high incidence of services and sometimes a mixture of small wholesale and manufacturing establishments’’. Figure 4 also illustrates secondary hotspots on the island which coincide with major tourist hubs including Jolly Harbour and English Harbour. Both tourism hotspots are identified as “intensive tourism activity areas” and the developmental pattern is reinforced for areas that are already economically successful in A&B [52]. Such a model of development stimulates additional services (outside the focus of hotels and restaurants) which can be easily accessible to visitors such as non-resident villas, marinas, car rentals, shopping centers, and banking facilities.

7.3. The Importance of Building Resilience

The spatial distribution of material stocks and services raises concerns about the levels of vulnerability the tourism industry faces with climate change. As illustrated by Figure 4, the concentration of material stocks for tourism is primarily located along coastal areas. Beachfront properties are ideal locations for access to beaches, resorts, and other tourist accommodations. As a result of this concentration of development on the coast, SLR and extreme climatic events can result in abruptions and disturbances within the tourism sector [78]. Tourism is identified as the most vulnerable building use type exposed under a 2 m sea rise scenario. The study takes a conservative approach on the SLR vulnerability assessment, based on estimates of the global SLR by 2100, with the highest scenarios measured at 2 m. Emerging studies show estimates of global SLR ranging below 2 m [79] and after a revision of the NOAA SLR scenarios in 2017, the worst-case scenario increased by 0.5 m, with the current estimates measured at 2.5 m by 2100 [80]. While estimates continue to change with ongoing research and evidence, the key message in this paper does not change: SIDSs are faced with major threats to their infrastructure with a 2 m SLR [26,30,81]. In fact, under a 1 m sea level rise scenario, 29% of the major resorts in the Caribbean would be partially or fully inundated [82]. Moreover, the economic evaluation conducted by Moore et al. [83] of various climate change scenarios for Caribbean destinations estimated a projected loss of USD 118–156 million in tourist expenditure by 2100 as a result of projected climatic shifts.
In addition to SLR, hurricanes and the higher frequency of strong weather systems is another area of concern [84]. A&B has experienced severe category 5 hurricanes in the past, causing widespread damage. The 2017 category 5 hurricane Irma resulted in significant destruction of Barbuda, both by being in the direct path of the storm, as well as by virtue of its low elevation of 3 m above sea level [85]. The aftermath left behind high volumes of debris from the dysfunctional infrastructure, which accounted for 90% of the total buildings in Barbuda, resulting in the loss of essential services such as transport, health, and education. Between 1851 and 2017, A&B has experienced 128 storms and hurricanes, and the financial cost due to this has been USD 950 million in the past 12 years alone [85,86].
Tourism is both weather dependent and reliant on natural ecosystem services (beaches, coral reefs, waterfalls, etc.), and impacted by climate change [78,87,88]. In fact, tourism is one of the most climate-sensitive sectors globally, impacted by all 10 types of climate change impacts (such as floods, droughts, warming, heatwaves, precipitation, and sea level rise) [89]. Moreover, the development of tourism itself threatens the fragile ecosystem on which it depends. In A&B, for example, the YIDA International development project gained the public’s immediate attention when over 2000 acres of coastal land, one of the largest marine protected areas (MPAs), were sold to establish an “economic zone”. This area included mangroves and nesting grounds for endangered and threatened species. The loss of 75% of mangroves resulted in a loss of local livelihoods depending on these resources, but also increased exposure to the impact of hurricanes and flooding [88,90], creating a negative feedback loop for the economy. At the same time, tourism relies on the international transport industry and the high level of interconnectivity by air or sea to global markets. In A&B, the majority of the visiting tourist population originates from the US, Canada, and Europe [91]. In 2017, tourists from the USA accounted for 39% of total air arrivals, Europe 37%, and Canada 9%. Therefore, for the island’s tourism sector to be operational, the country depends on international airlines and the cruise industry. However, in situations where the country is in shutdown and transport is suspended due to a natural disaster or a worldwide pandemic (such as COVID-19), the sector comes to a standstill. Besides the loss of jobs, large portions of the built infrastructure for tourism will remain further underutilized. Transport infrastructure located on the coast is highly threatened by the effects of climate vulnerability and change [81], as observed in A&B. Table 2 illustrates that in an under 2 m SLR scenario, approximately 14% of transportation material stocks would be exposed, including airports and seaports.
Thus, small island states like A&B, where tourism is a high contributor to the GDP, are among the most vulnerable nations, with climate change posing significant barriers to tourism’s contribution to the Sustainable Development Goals (SDGs) [5]. In 2014, the UN World Tourism Organization [92] outlined core challenges facing the survival of the tourism industry, from climate change to the need to conserve the stressed and fragile local ecosystems, to the drain on foreign exchange of recurring imports of construction material. The Caribbean Group for Cooperation in Economic Development [93] explains that natural disasters are inherently a developmental issue, as there is evidence of unsustainable planning and investment decisions in the aftermath that contributes to vulnerability. Although tourism is the main economic driver in A&B, it is also the most vulnerable and volatile industry. All of this questions the sustainability of material stock accumulation within A&B’s tourism sector, and the urgent need for economic diversification.

8. Conclusions and Outlook

Socio-metabolic research on small islands in the context of sustainability is still an emerging field, and the body of literature surrounding this field is only now beginning to show. As reviewed in Section 3, most socio-metabolic studies so far have been “flow” focused, and very few on “material stocks”. This paper is a novel contribution to our understanding of societal services (tourism in this case) from the perspective of material stocks and flows (referred to as the “material stock–flow–service nexus”). A socio-metabolic perspective on tourism can offer relevant information to policymakers to identify opportunities to decouple the tourism sector from resource requirements and build system resilience [1].
In a single-driven service based-economy like A&B and other Caribbean countries, the material stock–flow–service nexus is an instrumental approach in understanding local-scale resource flows, material stock growth, and determining resource requirements for achieving the Sustainable Development Goals (SDGs), in particular SDG 12 (responsible consumption and production) and 13 (climate action). The material stock–flow–service nexus approach has the potential to offer insights to better understand island economies and their overall sustainability. By focusing on the interrelationship between stocks, flows, and service, policymakers can identify those services that are driving biophysical growth, who benefits from them, and to accordingly foster inclusive sustainable development. It is argued that tourism can also create spatial disparities in terms of social and economic development, where an island’s spatial distribution impacts the island’s societal development which can differ amongst islands [94,95,96]. For example, decisions that restrict access of local residents to beaches located within tourism hotspots or the amount of land made available for tourism expansion versus the amount of land catered towards societal development. In addition to the volume of infrastructure attributed to tourists compared to local residents, tourist-centered areas can become “islands within islands” that restrict the use and access to services by residents from the surrounding communities. Local development projects must take into consideration these concerns before future tourism-related construction takes place on the island. The government and policymakers will need to create greater inclusivity and sustainable growth within the sector [97], asking whether the costs and benefits of building stocks and related services are equally distributed across society. In other words, sustainable infrastructure development and the allocation of material stocks should consider the resident population and their social and economic wellbeing (SDG 13—sustainable communities) [98].
There is no doubt that SIDSs are threatened by a heightened risk from climate change. Increasing disaster preparedness and to protect the socio-economic services delivered by the tourism sector, the combined use of geospatial analysis, material stock–flow–service accounting approaches, and scenario exercises can assist island governments and businesses in improved planning and dealing with uncertainties [99]. SIDSs will benefit from further research incorporating new data sets with the study’s methodology to expand on the sea level rise and climate vulnerability analysis. Sustainable tourism must include several core principles such as economic viability, physical integrity, community wellbeing, and resource efficiency [78]. A holistic and inclusive approach is likely to enhance tourism’s ability to contribute to the SDGs and, to some degree, shield it from the negative impacts of climate change. However, factors such as geographic location and the country’s ability to build adaptive capacities to cope with expected changes will also be key in increasing the sector’s resiliency.

Supplementary Materials

The Supplementary Information provides greater detail on the methodology section of the research including the material stock analysis (MSA) of buildings, building footprint classification, empirical evaluation and data collection, building use type classes and height assumption, material intensity typology, and residential material intensity: Monte Carlo simulation. Available online: https://www.mdpi.com/2071-1050/12/19/8090/s1.

Author Contributions

Conceptualization, J.B., S.J.S., S.-Y.T., and T.F.; methodology, J.B., S.-Y.T., K.P., and T.F.; validation, J.B., S.J.S., S.-Y.T., and T.F; writing—original draft preparation, J.B. and S.J.S.; writing—review and editing, J.B., S.J.S., S.-Y.T., and T.F.; visualization, J.B. and S.-Y.T.; supervision, S.J.S., S.-Y.T., and T.F. All authors have read and agreed to the published version of the manuscript.

Funding

This research received no external funding.

Conflicts of Interest

The authors declare no conflict of interest.

References

  1. Haberl, H.; Wiedenhofer, D.; Erb, K.H.; Görg, C.; Krausmann, F. The Material Stock–Flow–Service Nexus: A New Approach for Tackling the Decoupling Conundrum. Sustainability 2017, 9, 1049. [Google Scholar] [CrossRef] [Green Version]
  2. Fischer-Kowalski, M.; Weisz, H. The Archipelago of Social Ecology and the Island of the Vienna School. Soc. Ecol. 2016. [Google Scholar] [CrossRef]
  3. Thomas, D. The Caribbean Tourism Industry in the 21st Century: An Assessment. In Kimberley Green Latin American and Public Affairs; Caribbean Center: Miami, FL, USA, 2015. [Google Scholar]
  4. Economic Impact|World Travel & Tourism Council (WTTC). Available online: https://wttc.org/Research/Economic-Impact (accessed on 24 August 2020).
  5. Scott, D.; Hall, C.M.; Gössling, S. Global tourism vulnerability to climate change. Ann. Tour. Res. 2019, 77, 49–61. [Google Scholar] [CrossRef]
  6. CRED. UNISDR Economic Losses, Poverty & Disasters: 1998–2017—UNDRR. Available online: https://www.unisdr.org/we/inform/publications/61119 (accessed on 1 January 2019).
  7. UNDESA Partnerships Briefs for Small Island Developing States Climate Change & Disaster Risk Management Division for Sustainable Development UNDESA 2014 UN Conference on Small Island Developing States. 2014. Available online: https://sustainabledevelopment.un.org/content/documents/1344SIDS_BRIEFS_ClimateChange.pdf (accessed on 2 January 2020).
  8. Caribbean Small States—Challenges of High Debt and Low Growth. Policy Pap. 2013, 2013. [CrossRef]
  9. Eastern Caribbean Central Bank DashboardDatas|Eastern Caribbean Central Bank. Available online: https://www.eccb-centralbank.org/statistics/dashboard-datas/ (accessed on 1 January 2020).
  10. Bueno, R.; Herzfeld, C.; Stanton, E.; Ackerman, F. The Caribbean and Climate Change: The Costs of Inaction; Stockholm Environment Institute, US Center and Global Development and Environment Institute, Tufts University: Medford, MA, USA, 2008. [Google Scholar]
  11. Rasmussen, D.J.; Bittermann, K.; Buchanan, M.K.; Kulp, S.; Strauss, B.H.; Kopp, R.E.; Oppenheimer, M. Extreme sea level implications of 1.5 °C, 2.0 °C, and 2.5 °C temperature stabilization targets in the 21st and 22nd centuries. Environ. Res. Lett. 2018, 13, 034040. [Google Scholar] [CrossRef]
  12. Popescu, R.; Beraud, H.; Barroca, B. The Impact of Hurricane Irma on the Metabolism of St. Martin’s Island. Sustainability 2020, 12, 6731. [Google Scholar] [CrossRef]
  13. Van der Ploeg, J.; Sukulu, M.; Govan, H.; Minter, T.; Eriksson, H. Sinking Islands, Drowned Logic; Climate Change and Community-Based Adaptation Discourses in Solomon Islands. Sustainability 2020, 12, 7225. [Google Scholar] [CrossRef]
  14. Krausmann, F.; Lauk, C.; Haas, W.; Wiedenhofer, D. From resource extraction to outflows of wastes and emissions: The socioeconomic metabolism of the global economy, 1900–2015. Glob. Environ. Change 2018, 52, 131–140. [Google Scholar] [CrossRef]
  15. Kleemann, F.; Lederer, J.; Rechberger, H.; Fellner, J. GIS-based Analysis of Vienna’s Material Stock in Buildings. J. Ind. Ecol. 2017, 21, 368–380. [Google Scholar] [CrossRef]
  16. Lanau, M.; Liu, G.; Kral, U.; Wiedenhofer, D.; Keijzer, E.; Yu, C.; Ehlert, C. Taking Stock of Built Environment Stock Studies: Progress and Prospects. Environ. Sci. Technol. 2019, 53, 8499–8515. [Google Scholar] [CrossRef]
  17. Schiller, G.; Müller, F.; Ortlepp, R. Mapping the anthropogenic stock in Germany: Metabolic evidence for a circular economy. Resour. Conserv. Recycl. 2017, 123, 93–107. [Google Scholar] [CrossRef]
  18. Mesta, C.; Kahhat, R.; Santa-Cruz, S. Quantification of lost material stock of buildings after an earthquake. A case study of Chiclayo, Peru. In Proceedings of the 16th World Conference on Earthquake Engineering, 16WCEE, Santiago, Chile, 9–13 January 2017; pp. 1–12. [Google Scholar]
  19. Kalcher, J.; Praxmarer, G.; Teischinger, A. Quantification of future availabilities of recovered wood from Austrian residential buildings. Resour. Conserv. Recycl. 2017, 123, 143–152. [Google Scholar] [CrossRef]
  20. Müller, E.; Hilty, L.M.; Widmer, R.; Schluep, M.; Faulstich, M. Modeling metal stocks and flows: A review of dynamic material flow analysis methods. Environ. Sci. Technol. 2014, 48, 2102–2113. [Google Scholar] [CrossRef] [PubMed]
  21. Moynihan, M.; Allwood, J. The flow of steel into the construction sector. Resour. Conserv. Recycl. 2012, 68, 88–95. [Google Scholar] [CrossRef]
  22. Sartori, I.; Bergsdal, H.; Müller, D.; Brattebø, H. Towards modelling of construction, renovation and demolition activities: Norway’s dwelling stock, 1900–2100. Build. Res. Inf. 2008, 36, 412–425. [Google Scholar] [CrossRef]
  23. Zhu, X. GIS and Urban Mining. Resources 2014, 3, 235–247. [Google Scholar] [CrossRef]
  24. Tanikawa, H.; Hashimoto, S. Urban stock over time: Spatial material stock analysis using 4d-GIS. Build. Res. Inf. 2009, 37, 483–502. [Google Scholar] [CrossRef]
  25. Tanikawa, H.; Managi, S.; Lwin, C.M. Estimates of Lost Material Stock of Buildings and Roads Due to the Great East Japan Earthquake and Tsunami. J. Ind. Ecol. 2014, 18, 421–431. [Google Scholar] [CrossRef]
  26. Merschroth, S.; Miatto, A.; Weyand, S.; Tanikawa, H.; Schebek, L. Lost Material Stock in Buildings due to Sea Level Rise from Global Warming: The Case of Fiji Islands. Sustainability 2020, 12, 834. [Google Scholar] [CrossRef] [Green Version]
  27. Augiseau, V.; Barles, S. Studying construction materials flows and stock: A review. Resour. Conserv. Recycl. 2017, 123, 153–164. [Google Scholar] [CrossRef]
  28. Wallsten, B.; Magnusson, D.; Andersson, S.; Krook, J. The economic conditions for urban infrastructure mining: Using GIS to prospect hibernating copper stocks. Resour. Conserv. Recycl. 2015, 103, 85–97. [Google Scholar] [CrossRef] [Green Version]
  29. Heeren, N.; Fishman, T. A database seed for a community-driven material intensity research platform. Sci. Data 2019, 6, 23. [Google Scholar] [CrossRef] [PubMed]
  30. Symmes, R.; Fishman, T.; Telesford, J.N.; Singh, S.J.; Tan, S.; De Kroon, K. The weight of islands: Leveraging Grenada’s material stocks to adapt to climate change. J. Ind. Ecol. 2019, 24, 369–382. [Google Scholar] [CrossRef]
  31. Pott, K.; Tan, S.-Y.; Singh, S.; Symmes, R.; Fishman, T.; Telesford, J. A Study of Building Material Stocks and the Service-Nexus in the City of Kitchener from a 4D GIS perspective. J. Ind. Ecol. 2020. [Google Scholar]
  32. Pauliuk, S.; Müller, D.B. The role of in-use stocks in the social metabolism and in climate change mitigation. Glob. Environ. Change 2014, 24, 132–142. [Google Scholar] [CrossRef] [Green Version]
  33. Mohammadi, E.; Singh, S.J.; Habib, K. Electronic waste in the Caribbean: An impending environmental disaster or an opportunity for a circular economy? Resour. Conserv. Recycl. 2020, 164, 105106. [Google Scholar] [CrossRef]
  34. Taylor, M.A.; Clarke, L.A.; Centella, A.; Bezanilla, A.; Stephenson, T.S.; Jones, J.J.; Campbell, J.D.; Vichot, A.; Charlery, J. Future Caribbean Climates in a World of Rising Temperatures: The 1.5 vs 2.0 Dilemma. J. Clim. 2018, 31, 2907–2926. [Google Scholar] [CrossRef]
  35. Hay, J.E. Small island developing states: Coastal systems, global change and sustainability. Sustain. Sci. 2013, 8, 309–326. [Google Scholar] [CrossRef]
  36. Pichler, A.; Striessnig, E. Differential Vulnerability to Hurricanes in Cuba, Haiti, and the Dominican Republic: The Contribution of Education. Ecol. Soc. 2013, 18. [Google Scholar] [CrossRef] [Green Version]
  37. Pelling, M.; Uitto, J.I. Small island developing states: Natural disaster vulnerability and global change. Environ. Hazards 2001, 3, 49–62. [Google Scholar] [CrossRef]
  38. Wallner, H.P.; Narodoslawsky, M.; Moser, F. Islands of Sustainability: A Bottom-up Approach towards Sustainable Development. Environ. Plan. Econ. Space 1996, 28, 1763–1778. [Google Scholar] [CrossRef]
  39. Deschenes, P.J.; Chertow, M. An island approach to industrial ecology: Towards sustainability in the island context. J. Environ. Plan. Manag. 2004, 47, 201–217. [Google Scholar] [CrossRef]
  40. Noll, D.; Wiedenhofer, D.; Miatto, A.; Singh, S.J. The expansion of the built environment, waste generation and EU recycling targets on Samothraki, Greece: An island’s dilemma. Resour. Conserv. Recycl. 2019, 150, 104405. [Google Scholar] [CrossRef]
  41. Singh, S.J.; Grünbühel, C.M.; Schandl, H.; Schulz, N. Social metabolism and labour in a local context: Changing environmental relations on Trinket Island. Popul. Environ. 2001, 23, 71–104. [Google Scholar] [CrossRef]
  42. Singh, S.J.; Fischer-Kowalski, M.; Haas, W. The Sustainability of Humanitarian Aid: The Nicobar Islands as a Case of ‘Complex Disaster. Asian Tsunami Post-Disaster Aid 2018. [Google Scholar] [CrossRef]
  43. Krausmann, F.; Richter, R.; Eisenmenger, N. Resource Use in Small Island States. J. Ind. Ecol. 2014, 18, 294–305. [Google Scholar] [CrossRef] [PubMed]
  44. Shah, K.U.; Niles, K.; Ali, S.H.; Surroop, D.; Jaggeshar, D. Plastics Waste Metabolism in a Petro-Island State: Towards Solving a “Wicked Problem” in Trinidad and Tobago. Sustainability 2019, 11, 6580. [Google Scholar] [CrossRef] [Green Version]
  45. Okoli, A. Socioeconomic Metabolism of Biomass in Jamaica in the Context of Trade and National Food Security: A Time Series Biophysical Analysis (1961–2013). Master’s Thesis, University of Waterloo, Waterloo, ON, Canada, 2016. [Google Scholar]
  46. Marcos-Valls, A.; Kovacic, Z.; Giampietro, M.; Kallis, G.; Rieradevall, J. Isolated yet open: A metabolic analysis of Menorca. Sci. Total Environ. 2020, 738, 139221. [Google Scholar] [CrossRef]
  47. Petridis, P.; Fischer-Kowalski, M. Island Sustainability: The Case of Samothraki. Soc. Ecol. 2016. [Google Scholar] [CrossRef]
  48. Fischer-Kowalski, M.; Löw, M.; Noll, D.; Petridis, P.; Skoulikidis, N. Samothraki in Transition: A Report on a Real-World Lab to Promote the Sustainability of a Greek Island. Sustainability 2020, 12, 1932. [Google Scholar] [CrossRef] [Green Version]
  49. Martinico-Perez, M.F.G.; Fishman, T.; Okuoka, K.; Tanikawa, H. Material Flow Accounts and Driving Factors of Economic Growth in the Philippines. J. Ind. Ecol. 2016, 21, 1226–1236. [Google Scholar] [CrossRef]
  50. Bogadóttir, R. The Social Metabolism of Quiet Sustainability in the Faroe Islands. Sustainability 2020, 12, 735. [Google Scholar] [CrossRef] [Green Version]
  51. The Commonwealth Antigua and Barbuda|The Commonwealth. Available online: https://thecommonwealth.org/our-member-countries/antigua-and-barbuda (accessed on 1 January 2020).
  52. UNEP Sustainable Island Resource Management Zoning Plan for Antigua and Barbuda (Including Redonda). 2011. Available online: https://www.unenvironment.org/resources/report/sustainable-island-resource-management-zoning-plan-antigua-and-barbuda-including (accessed on 2 February 2020).
  53. World Bank Group World Bank Climate Change Knowledge Portal. Available online: https://climateknowledgeportal.worldbank.org/country/antigua-and-barbuda (accessed on 1 January 2020).
  54. UN-OHRLLS SIDS in Numbers Climate Change Edition 2015. Available online: http://unohrlls.org/sids-in-numbers-climate-change-edition-2015/ (accessed on 2 January 2020).
  55. De Albuquerque, K.; McElroy, J.L. Antigua and Barbuda: A Legacy of Environmental Degradation, Policy Failure, and Coastal Decline. 1995. Available online: https://ageconsearch.umn.edu/record/11913 (accessed on 1 January 2020).
  56. Montevago, J. Antigua and Barbuda Tourism Boom Continues. Available online: https://www.travelmarketreport.com/articles/Antigua-and-Barbuda-Tourism-Boom-Continues (accessed on 1 January 2020).
  57. Atkins, J.P.; Mazzi, S.; Easter, C.D. A Commonwealth Vulnerability Index for Developing Countries; Economic Paper; OECD Publishing: London, UK, 2000; ISBN 978-1-84859-716-7. [Google Scholar]
  58. Simpson, M.C. Quantification and Magnitude of Losses and Damages Resulting from the Impacts of Climate Change: Modelling the Transformational Impacts and Costs of Sea Level Rise in the Caribbean (Key Points and Summary for Policy Makers Document). In Quantification and Magnitude of Losses and Damages Resulting from the Impacts of Climate Change: Modelling the Transformational Impacts and Costs of Sea Level Rise in the Caribbean (Key Points and Summary for Policy Makers Document); United Nations Development Programme (UNDP): Barbados, Caribbean, 2010. [Google Scholar]
  59. Daigo, I.; Igarashi, Y.; Matsuno, Y.; Adachi, Y. Accounting for Steel Stock in Japan. ISIJ Int. 2007, 47, 1065–1069. [Google Scholar] [CrossRef] [Green Version]
  60. Fishman, T.; Schandl, H.; Tanikawa, H.; Walker, P.; Krausmann, F. Accounting for the material stock of nations. J. Ind. Ecol. 2014, 18, 407–420. [Google Scholar] [CrossRef] [PubMed] [Green Version]
  61. Condeixa, K.; Haddad, A.; Boer, D. Material Flow Analysis of the Residential Building Stock at the city of Rio de Janeiro. J. Clean. Prod. 2017, 149, 1249–1267. [Google Scholar] [CrossRef]
  62. Department of Environment Building. Footprint of Antigua & Barbuda-Shapefile; Department of Environment: St. Johns, Antigua & Barbuda, 2012. [Google Scholar]
  63. Statistics Division Population and Housing Census Antigua & Barbuda. 2001. Available online: https://statistics.gov.ag/wp-content/uploads/2017/11/2011-Antigua-and-Barbuda-Population-and-Housing-Census-A-Demographic-Profile.pdf (accessed on 4 October 2018).
  64. Parris, A.S.; Bromirski, P.; Burkett, V.; Cayan, D.R.; Culver, M.E.; Hall, J.; Horton, R.M.; Knuuti, K.; Moss, R.H.; Obeysekera, J. Global sea level rise scenarios for the United States National Climate Assessment. NOAA Technical Report OAR CPO-1 2012. Available online: https://scenarios.globalchange.gov/sites/default/files/NOAA_SLR_r3_0.pdf (accessed on 5 May 2020).
  65. Lichter, M.; Felsenstein, D. Assessing the costs of sea-level rise and extreme flooding at the local level: A GIS-based approach. Ocean Coast. Manag. 2012, 59, 47–62. [Google Scholar] [CrossRef]
  66. Poulter, B.; Halpin, P.N. Raster modelling of coastal flooding from sea-level rise. Int. J. Geogr. Inf. Sci. 2008, 22, 167–182. [Google Scholar] [CrossRef]
  67. Gesch, D.B. Analysis of Lidar Elevation Data for Improved Identification and Delineation of Lands Vulnerable to Sea-Level Rise. J. Coast. Res. 2009, 53, 49–58. [Google Scholar] [CrossRef]
  68. Urosevic, Z. Making Tourism Work for Small Island Developing States; World Tourism Organization (WTO): Madrid, Spain, 2004; ISBN 92-844-0782-6. [Google Scholar]
  69. Apergis, N.; Payne, J.E. Tourism and Growth in the Caribbean—Evidence from a Panel Error Correction Model. Tour. Econ. 2012, 18, 449–456. [Google Scholar] [CrossRef]
  70. Guo, J.; Fishman, T.; Wang, Y.; Miatto, A.; Wuyts, W.; Zheng, L.; Wang, H.; Tanikawa, H. Urban development and sustainability challenges chronicled by a century of construction material flows and stocks in Tiexi, China. J. Ind. Ecol. 2020. [Google Scholar] [CrossRef]
  71. Bleischwitz, R.; Spataru, C.; VanDeveer, S.D.; Obersteiner, M.; van der Voet, E.; Johnson, C.; Andrews-Speed, P.; Boersma, T.; Hoff, H.; van Vuuren, D.P. Resource nexus perspectives towards the United Nations Sustainable Development Goals. Nat. Sustain. 2018, 1, 737. [Google Scholar] [CrossRef] [Green Version]
  72. Cao, Z.; Shen, L.; Liu, L.; Zhao, J.; Zhong, S.; Kong, H.; Sun, Y. Estimating the in-use cement stock in China: 1920–2013. Resour. Conserv. Recycl. 2017, 122, 21–31. [Google Scholar] [CrossRef]
  73. Allwood, J.M. Unrealistic techno-optimism is holding back progress on resource efficiency. Nat. Mater. 2018, 17, 1050–1051. [Google Scholar] [CrossRef] [PubMed]
  74. Cabrera Serrenho, A.; Allwood, J.M. Material Stock Demographics: Cars in Great Britain. Environ. Sci. Technol. 2016, 50, 11403–11413. [Google Scholar] [CrossRef] [Green Version]
  75. Nguyen, T.C.; Fishman, T.; Miatto, A.; Tanikawa, H. Estimating the Material Stock of Roads: The Vietnamese Case Study. J. Ind. Ecol. 2018, 23, 663–673. [Google Scholar] [CrossRef]
  76. Wiedenhofer, D.; Steinberger, J.K.; Eisenmenger, N.; Haas, W. Maintenance and Expansion: Modeling Material Stocks and Flows for Residential Buildings and Transportation Networks in the EU25. J. Ind. Ecol. 2015, 19, 538–551. [Google Scholar] [CrossRef] [Green Version]
  77. Cohen, E. Touristic craft ribbon development in Thailand. Tour. Manag. 1995, 16, 225–236. [Google Scholar] [CrossRef]
  78. Eco-union. Sustainable Blue Tourism Blue Tourism Study. 2019. Available online: http://www.ecounion.eu/wp-content/uploads/2019/06/TRIPA_Angles_2_p.pdf (accessed on 10 February 2020).
  79. Kulp, S.A.; Strauss, B.H. New elevation data triple estimates of global vulnerability to sea-level rise and coastal flooding. Nat. Commun. 2019, 10, 1–12. [Google Scholar]
  80. Sweet, W.V.; Kopp, R.E.; Weaver, C.P.; Obeysekera, J.; Horton, R.M.; Thieler, E.R.; Zervas, C. Global and regional sea level rise scenarios for the United States. In NOAA Technical Report NOS CO-OPS 083; National Oceanic and Atmospheric Administration: Washington, DC, USA, 2017; 75p. [Google Scholar]
  81. Monioudi, I.Ν.; Asariotis, R.; Becker, A.; Bhat, C.; Dowding-Gooden, D.; Esteban, M.; Feyen, L.; Mentaschi, L.; Nikolaou, A.; Nurse, L.; et al. Climate change impacts on critical international transportation assets of Caribbean Small Island Developing States (SIDS): The case of Jamaica and Saint Lucia. Reg. Environ. Change 2018, 18, 2211–2225. [Google Scholar] [CrossRef] [Green Version]
  82. Scott, D.; Simpson, M.C.; Sim, R. The vulnerability of Caribbean coastal tourism to scenarios of climate change related sea level rise. J. Sustain. Tour. 2012, 20, 883–898. [Google Scholar] [CrossRef]
  83. Moore, W.R. The impact of climate change on Caribbean tourism demand. Curr. Issues Tour. 2010, 13, 495–505. [Google Scholar] [CrossRef] [Green Version]
  84. Burgess, C.P.; Taylor, M.A.; Spencer, N.; Jones, J.; Stephenson, T.S. Estimating damages from climate-related natural disasters for the Caribbean at 1.5 °C and 2 °C global warming above preindustrial levels. Reg. Environ. Change 2018, 18, 2297–2312. [Google Scholar] [CrossRef]
  85. United Nations Environment Program. Green Climate Fund-GCF Resilience to Hurricanes, Floods and Droughts in the Building Sector in Antigua and Barbuda; United Nations Environment Program: Antigua and Barbuds, Caribbean, 2017. [Google Scholar]
  86. Destin, D. Antigua and Barbuda Meteorological Services- Hurricanes and Storms- 1851 to 2019. Available online: http://www.antiguamet.com (accessed on 1 January 2020).
  87. Pang, S.F.H.; McKercher, B.; Prideaux, B. Climate Change and Tourism: An Overview. Asia Pac. J. Tour. Res. 2013, 18, 4–20. [Google Scholar] [CrossRef]
  88. Brown, N.A.; Rovins, J.E.; Feldmann-Jensen, S.; Orchiston, C.; Johnston, D. Exploring disaster resilience within the hotel sector: A systematic review of literature. Int. J. Disaster Risk Reduct. 2017, 22, 362–370. [Google Scholar] [CrossRef] [PubMed]
  89. Mora, C.; Spirandelli, D.; Franklin, E.C.; Lynham, J.; Kantar, M.B.; Miles, W.; Smith, C.Z.; Freel, K.; Moy, J.; Louis, L.V.; et al. Broad threat to humanity from cumulative climate hazards intensified by greenhouse gas emissions. Nat. Clim. Change 2018, 8, 1062–1071. [Google Scholar] [CrossRef]
  90. Handy, G. Antigua: Sprawling “Chinese Colony” Plan across Marine Reserve Ignites Opposition. The Guardian. 2019. Available online: https://www.theguardian.com/world/2019/jun/20/antigua-yida-project-chinese-colony-controversy (accessed on 25 May 2020).
  91. Antigua Hotel and Tourist Association-AHTA Tourism Statistics for Antigua & Barbuda: Tourist Arrivals by Country. Available online: http://members.antiguahotels.org/tourism-statistics-for-antigua-and-barbuda/ (accessed on 1 January 2020).
  92. UNWTO. Tourism in Small Island Developing States (SIDS)—Building a more Sustainable Future for the People of Islands; World Trade Organization: Madrid, Spain, 2014. [Google Scholar] [CrossRef]
  93. Caribbean Group for Cooperation in Economic Development Caribbean Economic Overview 2002: Macroeconomic Volatility, Household Vulnerability, and Institutional and Policy Responses; World Bank: Washington, DC, USA, 2002.
  94. Weaver, D.B. The evolution of a ‘plantation’ tourism landscape on the caribbean island of antigua. Tijdschr. Voor Econ. En Soc. Geogr. 1988, 79, 319–331. [Google Scholar] [CrossRef]
  95. Grydehøj, A.; Hayward, P. Social and economic effects of spatial distribution in island communities: Comparing the Isles of Scilly and Isle of Wight, UK. J. Mar. Isl. Cult. 2014, 3, 9–19. [Google Scholar] [CrossRef] [Green Version]
  96. Rutty, M.; Gössling, S.; Scott, D.; Hall, C. The Global Effects and Impacts of Tourism. An Overview in the Routledge Handbook of Tourism and Sustainability; Hall, C.M., Gössling, S., Scott, D., Eds.; Routledge: Abingdon, UK, 2015; pp. 36–62. [Google Scholar]
  97. Schandl, H.; Marcos-Martinez, R.; Baynes, T.; Yu, Z.; Miatto, A.; Tanikawa, H. A spatiotemporal urban metabolism model for the Canberra suburb of Braddon in Australia. J. Clean. Prod. 2020, 265, 121770. [Google Scholar] [CrossRef]
  98. Adenle, A.A.; De Steur, H.; Hefferon, K.; Wesseler, J. Two Decades of GMOs: How Modern Agricultural Biotechnology Can Help Meet Sustainable Development Goals. In Science, Technology, and Innovation for Sustainable Development Goals; Oxford University Press: Oxford, UK, 2020; ISBN 0-19-752890-2. [Google Scholar]
  99. Gössling, S.; Scott, D. Scenario planning for sustainable tourism: An introduction. J. Sustain. Tour. 2012, 20, 773–778. [Google Scholar] [CrossRef]
Figure 1. Schematic of the building footprint classification process adopted for Antigua and Barbuda. Image interpretation required the use of a base map provided by the Department of Environment (DOE) which was compared and contrasted to a reference map from OpenStreetMap. The four main characteristics guiding the classification process included: shape, pattern, size, and association.
Sustainability 12 08090 g001
Figure 2. The percentage share of material stock illustrated by the building use type categories in Antigua and Barbuda for 2004.
Sustainability 12 08090 g002
Figure 3. A standard deviation map of the spatial distribution of the total material stock (MS) of construction materials within buildings in Antigua and Barbuda (2004).
Sustainability 12 08090 g003
Figure 4. Four impacted areas on the island that would be exposed under a 2 m sea level rise scenario including Marina and Dickenson Bay, St. James’s Club, Jolly Harbour, and Long Bay. Exposed areas are highlighted in orange.
Sustainability 12 08090 g004
Table 1. Material intensity typologies (MITs) for Antigua and Barbuda (kg/m2) based on local construction styles. All numbers are rounded to one significant digit.
Construction StyleAggregate
(kg/m2)
Wood
(kg/m2)
Concrete
(kg/m2)
Steel
(kg/m2)
Building Use Type Classes
Concrete Structure 1
Foundation pad footing76.20.991.530.5
Hotels;
Rural area single-family dwelling;
Urban area single-family dwelling
Rural residential area family dwelling;
Double house family;
Business and dwelling;
Townhouse.
Foundation—column and beam0.00.00.00.0
Ground slab0.00.0227.313.8
Floors (suspended)0.00.0227.313.8
Walls110.07.79.0
Roof frame0.015.455.85.6
Roof covering0.00.00.03.9
Total186.224.0610.967.6
Concrete Structure 2
Foundation—strip foundation110.01.6116.845.4
Churches;
Schools;
Hospitals;
Health clinics;
Commercial;
Police stations;
Fire station;
Government Offices;
Airport;
Bus terminals;
Stadium;
Sports complex;
Rural area single-family dwelling;
Urban area single-family dwelling;
Rural residential area family dwelling;
Double house family;
Business and dwelling;
Townhouse.
Foundation—concrete blocks009.00
Ground slab00227.313.8
Floors (suspended)00227.313.8
Walls110.07.79.00
Roof frame015.455.85.6
Roof covering0003.9
Total220.024.7645.282.5
Concrete Structure 3
Foundation—pile01.2152.630.1
Rural area single-family dwelling;
Urban area single-family dwelling;
Rural residential area family dwelling;
Double house family;
Business and dwelling;
Townhouse.
Foundation—pile cap and beam0000
Ground slab00227.313.8
Floors (suspended)00227.313.8
Walls110.07.79.00
Roof frame015.455.85.6
Roof covering0003.9
Total110.024.3672.067.2
Timber
Foundation—strip foundation/concrete pillars110.01.6117.445.4
Business and dwelling mixed use.
Rural area single-family dwelling;
Urban area single-family dwelling;
Rural residential area family dwelling;
Double house family;
Business and dwelling;
Townhouse.
Floors04.600
Walls06.200
Roof frame015.400.8
Roof covering0003.9
Total110.027.7117.450.0
Concrete/Timber Mixed Structure
Foundation—strip foundation110.01.6116.845.4
Rural area single-family dwelling;
Urban area single-family dwelling;
Rural residential area family dwelling;
Double house family;
Business and dwelling;
Townhouse.
Foundation—concrete blocks003.00
Ground slab00115.46.2
Floors00115.46.2
Walls111.73.93.00
Roof frame015.455.85.6
Roof-Covering0003.9
Total221.720.9409.467.3
Cut-stone Historical Buildings
Foundation—strip footing110.01.6116.845.4
Historical buildings;
Cathedral.
Ground slab—concrete00227.313.8
Floors (suspended)0000
Walls—cut stone and concrete0000
Roof frame—timber015.455.85.6
Roof covering—galvanized0003.9
Total110.017.0399.968.7
Steel Structure
Foundation—column beam and foundation pad76.20.991.530.5
Industrial;
Seaport.
Floor slab0000
Walls—concrete block walls0000
Roof covering—galvanized sheeting and steel0000
Roof frame—steel0000
Roof covering0003.9
Total76.20.991.534.4
Table 2. The percentage of exposed material stock within the affected building use type categories identified in the sea level rise analysis and flood risk assessment.
Building Use Type1 m Sea Level Rise Scenario2 m Sea Level Rise Scenario
MS Exposed
(kt)
% of Use Type MS ExposedMS Exposed
(kt)
% of Use Type MS Exposed
Institutional3.00.6%5.11.1%
Transport7.417.0%6.214.3%
Tourism143.316.7%161.418.8%
Commercial7.71.0%13.31.7%
Sports and Recreation0.10.7%0.10.7%
Historical Sites and Protected Areas2.414.7%2.314.5%
Residential7.70.3%9.40.4%
Industrial0.10.4%0.10.4%

