Article

Reporting of Intellectual Capital Management Using a Scoring Model

1
Centre for Socioeconomic and Territorial Studies (DINÂMIA’CET-ISCTE), Instituto Universitário de Lisboa (ISCTE-IUL), 1649-026 Lisboa, Portugal
2
ICLab-ICAA-Intellectual Capital Association, 2005-162 Santarém, Portugal and CINAV-Naval School, 2810-001 Almada, Portugal
3
UNIDEMI, Department of Mechanical and Industrial Engineering, NOVA School of Science and Technology, Universidade NOVA de Lisboa, 2829-516 Caparica, Portugal
*
Author to whom correspondence should be addressed.
Sustainability 2020, 12(19), 8086; https://doi.org/10.3390/su12198086
Submission received: 3 August 2020 / Revised: 28 September 2020 / Accepted: 30 September 2020 / Published: 30 September 2020
(This article belongs to the Special Issue Intellectual Capital and Sustainability)

Abstract

:
The global transformation of the economy, driven by digital transformation and sustainability challenges, is placing its focus on the evaluation of companies’ intangible assets. Thus, if the report of those intangible assets, namely intellectual capital (IC) management, is endowed with credible metrics, recognized, and accepted, it can work as a guarantee, ensuring the reliability and sustainability of an organization. The aim of this research is to propose a data-driven Intellectual Capital Management Scoring System to be used in the auditing of the IC management of organisations. This paper presents one of the first attempts to use Path Modelling and the Partial Least Squares (PLS) Methodology, combined with Biplots, to define and validate Intellectual Capital Scoring Systems. This system relies on a model estimated using the PLS Path Modelling methodology and uses data from two independent random samples of Portuguese small and medium-sized enterprises (SMEs), which, in turn, was used to obtain two independent model estimates. The results obtained with the mentioned methodology show a good consistency both in performance and very similar parameters estimates, suggesting the validity of the associated scoring function.

1. Introduction

The global economy has been suffering profound structural changes, driven by digital transformation and sustainability challenges, and it is placing its focus on the evaluation of companies’ intangible assets, especially intellectual capital (IC) management. The sustainable development of companies, in a world where knowledge has become one of the main productive forces, depends to a great extent on the effectiveness in the management of IC. However, in practice, not all intangible assets are managed with effectiveness, which could have a negative influence on sustainable development of organizations. Therefore, this paper intends to support the development of a methodological instrument for auditing small and medium-sized enterprises’ (SMEs’) IC management. This research adds to the framework proposed by Matos [1] by emphasising new modelling tasks and aiming the development of a new scoring system to support auditing tasks in this domain.
In this paper, data from a random sample of 112 Portuguese SMEs obtained in 2011 and data from a new sample of 38 Portuguese SMEs, obtained in 2016, were used. In both cases, the same questionnaire targeted at SMEs’ top management was employed. This questionnaire is composed of 97 questions covering relevant aspects of IC management, having in mind current theories expressed in the Intellectual Capital Model (ICM), proposed by Matos and Lopes (2009) [2], which was used as an inspiration and support for this research. Although many IC measuring methodologies are available, there are no relevant methodologies for assessing intellectual capital management that are accepted as instruments to be used by companies on risk and sustainability issues.
This model was selected since, according to the literature, it is the most robust and comprehensive one, considering the intellectual capital literature [1].
The choice of this model is linked to the need of being able to identify, in an integrated and consistent way, the complexity of the factors in the framework of organizational knowledge. Compared with other models, the ICM seems to be more adapted to evaluate the intellectual capital management.
The first validated sample corresponds to a sample of Portuguese SMEs considered the “PME Líder” (in English: “SME leader”), that is, the best SMEs based in Portugal in 2010. The second dataset was constructed using answers to the same questionnaire, applied to a random sample of Portuguese SMEs that were included in the Portuguese Agency for Competitivity and Innovation (IAPMEI) database in 2016.
Given the large amount of time elapsed between the two samples, it was decided to conduct two completely independent studies using the same methodology, aiming to evaluate the result’s sensitivity in relation to these varying conditions (see Section 3 and Section 4).
The main research questions related to this research are:
  • How to recognise, subjacent to the top-level managers’ answers to the questionnaires, the existence of intangibles with meanings compatible with the ICM (Matos and Lopes, 2009) [2]?
  • How to obtain a mathematical model compatible with the ICM (Matos and Lopes, 2009) [2] that accounts for the meaning of intangibles involved in the IC concept and for the implicit or assumed causal relations between those variables?
  • How to estimate and validate the ICM (Matos and Lopes, 2009) [2] by using observed data from the available answers to the associated ICM questionnaire, applied a significant number of times in varied and controlled situations?
  • How to use the estimated model as a scoring function in order to evaluate the observed SMEs’ IC management?
For the first, the second and third questions, structural equations modelling (SEM) and model estimation using the PLS approach were used (see Section 4).
Finally, for the fourth question, latent variable scores obtained with PLS-PM methods were used as scores for the latent variables involved in the structural models (see Section 4).

2. Theoretical Background

The term “intellectual capital” has its origins in a publication by Galbraith (1967) [3]. However, the idea that intellectual capital is a resource that can be measured and managed finds its beginning in three different sources: first, in the work of Itami [4], who studied the effects of invisible assets in the management of Japanese companies. The second was found in the work of many economists (e.g., Penrose, Rumelt, Wemerfelt, and others), who sought a new vision of businesses; and finally, the third, in the works of Sveiby [5] in Sweden. Only from the work of this last author, the intellectual capital would truly win the protagonism that it is currently acknowledged to it, which brought a new vision by considering intangible assets as a key strategic issue to be raised to organisations.
Sveiby (1997) [6] developed a measurement methodology, the “Intangible Assets Monitor,” by dividing the intangible assets into three groups: individual competence, internal structure, and external structure. This methodology is based on quantitative and qualitative indicators to assess the intellectual capital. The “Intangible Assets Monitor” is used by several companies around the world and offers an overview of intellectual capital. Sveiby [6] recommends replacing the traditional accounting methodology with a new one, focused on a knowledge perspective. For the author, this methodology is very important to complete the financial information and evaluate the company’s efficiency and stability.
Despite Sveiby’s role, it was Stewart (1991) [7], in an article entitled: “Brainpower-Intellectual capital is becoming corporate America’s most valuable asset and can be its sharpest competitive weapon. The challenge is to find what you have—and use it,” who definitely brought the term “intellectual capital” to the vocabulary of management. In this article, Stewart states that “the whole company depends increasingly on knowledge—patents, processes, management skills, technologies, information about customers and suppliers, and old experience. This knowledge added is the intellectual capital.” This author became the main reference of intellectual capital when he published the book “Intellectual Capital: The New Wealth of Organizations” [8]. In 2001, Stewart, when explaining the intellectual capital concept, said: “it has become a standard to say that a company’s intellectual capital is the sum of its human capital (talent), structural capital (intellectual property, methodologies, software, documents, and other knowledge artefacts), and customer capital (client relationships)” (Stewart, 2001) [9].
Stewart and others (e.g., [10,11,12,13]) consider that intellectual capital includes tacit knowledge, which is a set of resources that can help in creating organisational value.
In 1997, Leif Edvinsson, while corporate director in Skandia AFS, was inspired by the work of Sveiby [6] and was a pioneer in calling the intangible assets “intellectual capital.” He developed the concept and defined intellectual capital as “a combination of human capital—the brains, skills, insights, and potential of those in an organization and structural capital—things like the capital wrapped up in customers, processes, databases, brands, and IT systems. It is the ability to transform knowledge and intangible assets into wealth creating resources, by multiplying human capital with structural capital” [14].
Edvinsson (1997) [15] uses a metaphor to explain the intellectual capital. The author compares a company to a fruit tree where the roots that give long-term sustainability are the intellectual capital and the fruits are the financial results.
Edvinsson and Malone (1997) [16] proposed a model, “Skandia Navigator,” which divides intellectual capital into two categories: human capital and structural capital.
Among the most relevant methodologies to evaluate intellectual are also the “Balanced Scorecard” [17,18,19], the “IC Accounting System” [20], the “Value Explorer” [21], and the “Intellectual Capital Benchmarking System” [22].
Zhou and Fink (2003) [23] consider that it is very complex to define and control the intellectual capital due to its intangible nature. However, the intellectual capital, being understood as an intangible asset able to create value for the organisation, gains a new dimension as a competitive advantage factor for the organisations (e.g., [24,25,26]).
According to the view of these authors and others [27,28,29,30,31,32,33,34], intellectual capital is a composite or multicomponent variable, with four components: human capital, structural capital, processes capital, and relational capital (clients capital). Those components are not necessarily independent: between them may exist dependencies, interactions, or causality relations. IC can be expressed (scored) both by a scalar or by some other function of its components, justified both in theoretical and empirical grounds. Thus, the different theories and methodologies of intellectual capital present a theoretical problem that was not possible to solve. In fact, among specialists and the academic community, there are several definitions and various types of intellectual capital, with no agreement on their definition or composition [35]. However, there seems to be a consensus that intellectual capital is an intangible asset that needs to be managed and evaluated and intellectual capital reports should complement the financial reports of companies [5,7,8,9,28,36,37,38].
This lack of consensus regarding intellectual capital’s definition and composition has direct implications in the difficulty of identifying unobservable (latent) dimensions of intellectual capital and which are the best measures to assess these perceptions. Several authors have suggested different Likert scales applied to questionnaires [1,30,39,40]. However, a problem persists: the subjectivity of the questions and scales and the low representativeness of the samples used in the surveys, since they normally have a low response rate [41].
Despite these considerations and the importance and relevance of these methodologies, all of them are centred on the evaluation of intellectual capital and not on the evaluation of how this asset is managed. Two studies, by Matos [1] and Matos and Lopes [2], based on the concepts of intellectual capital defined by the main authors, present the “ICM—Intellectual Capital Model” that focuses on the need to assess how this asset is being managed. In fact, it is not a question of assessing the quality of intellectual capital, but of assessing the quality of the management of this asset. Effectively, the IC management must verify that each individual in the organization is applying its knowledge for the organization’s benefit. This concept follows the idea of dynamism in intellectual capital and its association with strategy as it is proposed by several authors, such as Viedma [22] and Andriessen [35], among others.
When considering the intellectual capital report, sustainability emerges as a relevant topic. The relationship between intellectual capital and sustainability has only recently started to be discussed by the researchers. However, there is evidence of a cause-effect relationship between the two concepts [42].
Some authors [43,44] recommend that the disclosure of corporate sustainability reports can influence the impact of intellectual capital on organizational performance. In addition, organizations that implement practices of intellectual capital management seem to be more concerned with the integration of economic, social, and environmental sustainability [43].
This idea is also defended by Matos et al. (2017) [45] and by Matos et al. (2019) [46] who present intellectual capital as the main driver of sustainability. The authors present a concept of intellectual capital integrated with the 5 pillars of the United Nations’ Sustainable Development Goals that they identify as “IC 5P for the future,” arguing that it is the management of intellectual capital that allows reaching each of the pillars of sustainable development: People, Planet, Prosperity, Peace, and Partnership.

3. Support Framework

The model used in this research is based on the ICM framework of Matos and Lopes (2009) [2]. The same concept of IC management (see Figure 1a) is considered, and the questionnaire of Matos (2013) [1] was applied to a new sample of data obtained in 2016. Furthermore, in order to conduct this research, the results of this study are compared to the new sample. The two samples were obtained in contexts with no interaction (separated by 5 years that, in the management context, is an enormous period of time), where the probability that the same top manager has answered the two questionnaires is almost null.
According to this framework, the universe of IC assets is structured by two axes representing Knowledge (opposing Tacit Knowledge and Explicit Knowledge) and Organization (opposing Human Capital and Structural Capital). The Quadrants I, II, III, and IV, defined by those axes (see Figure 1a), are associated with IC assets and their management tasks. As an example, each point in Quadrant I corresponds to a form of IC resulting from a specific weighed combination of Human Capital and Tacit Knowledge. So, Quadrant I can be labelled IDC (Individual Capital). Following the same logic, the labels for the other quadrants are: II—Team Capital (TC); III—Processes Capital (PC); IV—Clients Capital (CC). The central part of Figure 1a represents the influence of New Technologies of Information and Communication (NTIC) combined with Network (NET) in all IC management functions and tasks [47].
Figure 1b is a 3D interpretation of the same concept, in which the influence of NET in the formation of all IC components is explicitly acknowledged and represented in a third dimension. This means that NET is not seen here as an IC component, but that its presence and contribution is interpreted as having a catalytic effect in every activity related to the IC formation. Considering an analogy from chemistry, NET must be present for the “reaction to take place,” but it is not a “reagent.”

3.1. Individual Capital (IDC)

Within ICM, the Tacit Knowledge/Human Capital Quadrant is called Individual Capital (IDC). It represents the knowledge not formalized, inherent to the individual themselves, and contains the real source of value, talents, and skills to generate innovation. This capital includes the theoretical and practical knowledge of every individual that can be made available to the organization, transforming tacit knowledge into explicit knowledge responsible for organizational innovation.

3.2. Team Capital (TC)

Team Capital corresponds to the Human Capital/Explicit Knowledge Quadrant. The knowledge of the individual is operationalized in the knowledge of the teams when the tacit knowledge is made explicit, transforming itself into structural capital that is safeguarded in the form of manuals, description of processes, rules, regulations, etc.
This process is complex and depends on the existence of a solid culture of teamwork and the organization’s ability to manage its talents.

3.3. Processes Capital (PC)

Processes Capital corresponds to the knowledge that is not owned by individuals but by the organisation, being recognised in the Structural Capital. This capital is the repository of knowledge that remains in the organization when individuals leave, constituting organizational memory.
The systematization of processes is a determining factor in the search for total quality and organizational sustainability.

3.4. Clients Capital (CC)

The Clients Capital is the result of the interaction Structural Capital/Tacit Knowledge. Customers’ capital is created by the organization’s knowledge of the market and of its customers, internal and external. This capital is created by all the relationships and interactions of the organization, which constitute the relational capital.

3.5. NTIC and Network (NET)

Networks promote knowledge sharing and strengthen organizational relationships between the other 4 Quadrants.
Technologies facilitate the creation of knowledge repositories while acting as channels of organizational communication, creating virtual spaces for sharing knowledge. Network and NTIC are therefore aggregators and catalysts of intellectual capital management.

3.6. Questionnaire

This questionnaire proposed by Matos (2013) [1] is a data collection device structured according to the ICM expressed in Figure 1a. It was developed to be used as an instrument of observation and data collection of the SMEs’ top managers’ opinions about IC management. In its current version, the questionnaire is composed of 97 questions, clustered in 22 parameters/groups, structured according to the Quadrants of Figure 1a (see Section 5).
According to Matos (2013) [1], ICM parameters are:
  • Individual Capital Quadrant:
    Training/Qualification and Talent Management.
    Valuation of Know—How and Innovation.
    Investment in Innovation and Development (I & D).
    Existence of a Policy for Talent Retention.
  • Team Capital Quadrant:
    Training/Qualification Team.
    Teamwork.
    Innovation in Teams.
    Leadership in Teams.
  • Processes Capital Quadrant:
    Processes Systematization.
    Registration of Organizational Knowledge.
    Existence of Certifications, Environmental, and Social policies.
    Partnerships.
    Investment in Innovation and Development (I & D).
    Brands Creation and Management.
    Complaints System.
    Existence of Awards.
  • Clients Capital Quadrant:
    Market Audits.
    Management of the Clients’ Satisfaction.
    Clients’ Complaints System.
    New Markets and Internationalization.
    Networks.
    New Technologies of Information and Communication.

4. Methodology

4.1. Intellectual Capital as a Vector with Latent Components

IC can be interpreted both as a scalar (number) or as a vector with several quantitative components. In those interpretations, the multivariate nature of IC is theoretically very useful, being frequently used to define univariate (scalar) functions of its components: simple sums or “composites” such as weighted sums of components. For example:
I C = I D C ( I n d i v i d u a l   C a p i t a l ) + T C ( T e a m   C a p i t a l ) + P C ( P r o c e s s e s   C a p i t a l ) + C C ( C l i e n t s   C a p i t a l )
Or
IC   =   α 1 × I D C + α 2 × T C + α 3 × P C + α 4 × C C   w i t h   α 1 + α 2 + α 3 + α 4 = 1
In what follows, to distinguish IC as a vector from IC as a scalar or number, a convention was followed: vectors are underlined.
For example, IC = [IC1, IC2,…,ICp]T means that, in this case, intellectual capital is interpreted as a vector with (p) components. In this case,
I C = i = 1 p α i × I C i
would mean that IC is a scalar (a number), obtained by the weighted sum of IC components.
When it is assumed that IC = [IDC, TC, PC, CC]T, those components are not, in general, independent and, frequently, causal influences can be noticed between components. For example, the hypothesis that IDC (Individual Capital) influences TC (Team Capital) would appear as natural because individual training and skills affect teamwork. That specific causal hypothesis (to be tested against data) is expressed by writing IDC → TC, where → means that “the first influences the second, not the reverse.”
IC and its components, being intangibles, are not directly observable and are represented in statistics by latent variables. The observable effects of latent variables manifest itself through observable indicators. In what follows, the latent character of a variable will be acknowledged prefixing its symbol by an “L” (e.g., LPC, means that Processes Capital is represented by the latent variable LPC).
In this research, the main methodological goal is to investigate the problem of IC scoring using functions that acknowledge not only the multivariate nature of IC, but also the possible causal relations between its components.
Path Modelling is used to construct theoretical models (in which to base the definition of scoring functions for IC, relating the latent components of vector IC = [IDC, TC, PC, CC]T with its observable indicators). The specific models must be coherent, in the first place, with basic assumptions of the ICM and with other more complex causal hypothesis believed to relate those latent components (see Section 4.2, Figure 2).
Those models are then estimated with the PLS Path Modelling (PLS-PM) methodology, using data from the ICM questionnaire from Matos [1] and the new sample of 2016.
This choice is justified by the nature of data available: the number of variables ≥ the number of observations, the absence of any distributional hypothesis, small datasets, and an assumed data structure with a priori defined variable groups. In this setting, literature points to Path Modelling and model estimation using Partial Least Squares (PLS) as a good choice [48,49,50,51,52]. Specifically, Trinchera and Russolillo [51] suggest using PLS estimations of the latent variables as scoring functions for composite concepts, such as IC and its components. For the corresponding computations, the R-Package “plspm” from Sanchez [49] and Sanchez et al. [53] was employed. The final scoring results were studied using biplots. To account for some criticism about possible convergence between PLS estimations and local solutions, models were also estimated with the R-Package “GESCA” [54], the results being similar in this specific case.

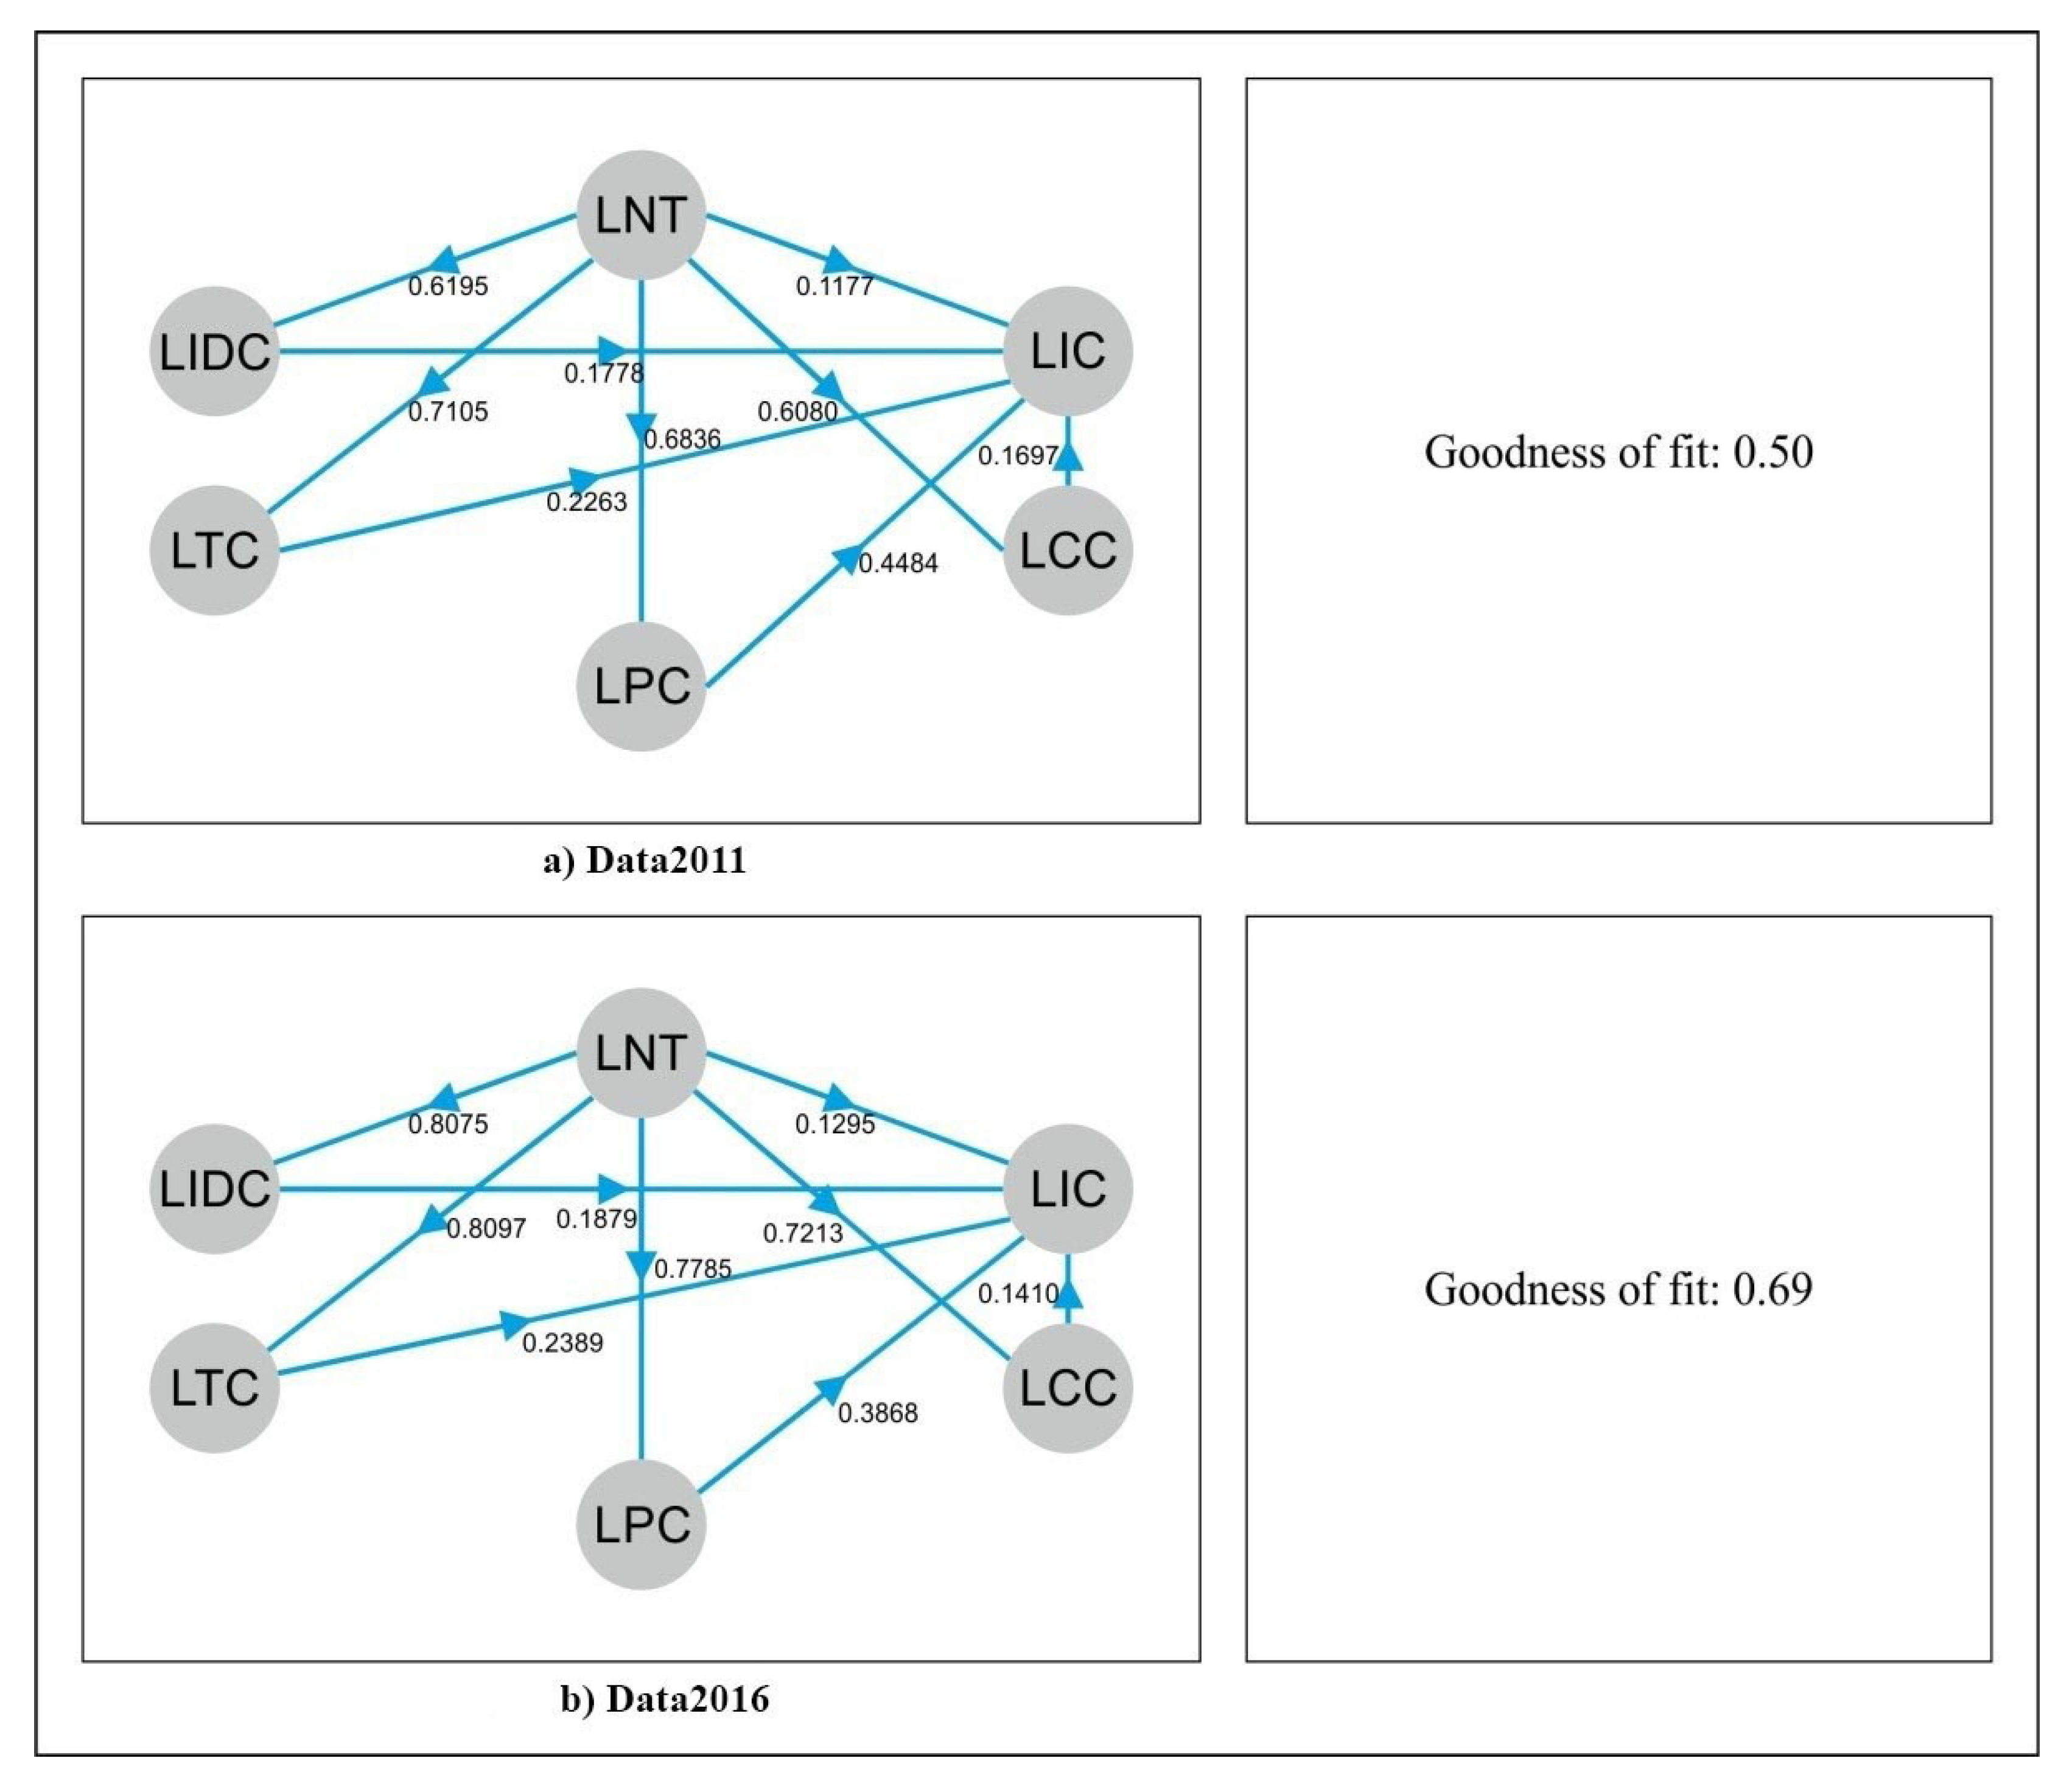
4.2. A Path Model for ICM

A Path Model corresponding to the ICM basic assumptions is presented in Figure 2. This means that IC is seen as a vector with four components [IDC, TC, PC, CC]. As for NTIC/NET, although not being considered an IC component, both play a determinant role in conditioning the development of all IC components and in facilitating (catalytic effect) the development of interactions through information accessibility and transfer between those components. In the ICM, the interactions between IC components were not tested. However, in the absence of experimental evidence of those interactions, it seems obvious that, given a powerful and flexible NTIC/NET, multiple opportunities for interaction between Individual Capital and Team Capital, for example, can be considered. It is then a matter of personal experience to postulate, for example, a causality relation IDC → TC because of NET → IDC and NET → TC.
Furthermore, in the ICM, IC and its components, being intangible assets, are modelled as Latent Variables (LVs). These variables are not directly observable, but have observable manifestations, the “Manifest Variables” (MV). The MV´s identifiers are inside the peripheral rectangles in Figure 2. In this research, each parameter is composed of questions whose mean of its answers integrate each one of the 22 parameters in the questionnaire (see Section 5). For example: QCIP2 is the mean of the answers to the questions QCIP2.1, QCIP2.2, QCIP2.3, and QCIP2.4.
This means that, given the scarcity of data in the first model (see Figure 1), the answers to the 97 questions are not directly used as manifests, but replaced by 22 manifest variables obtained averaging the answers to the questions belonging to each one of those 22 groups. This is justified by the fact that, according to a previous study by Matos [1], the variables in each group show large values of Cronbach α, large average positive correlations, and the first principal component (from Principal Component Analysis) explains the largest part of group total variance, all this suggesting that the group can be replaced by a single variable (see Figure 2).
For example, the groups of indicators (Manifest Variables) corresponding to the questions QCIP4.1, QCIP4.2, QCIP4.3, and QCIP4.4 (Quadrant Individual Capital, questions 1 to 4) were replaced by the new indicator:
QCIP 4   = 1 4 × ( Q C I P 4.1   +   Q C I P 4.2   +   Q C I P 4.3   +   Q C I P 4.4 )
The same procedure is used for all 22 other groups of indicators.
Latent Variables (LVs) are identified inside ellipses in the structural models in Figure 2 and have the following meanings:
  • LNT—LV NTIC and Network.
  • LIDC—LV Individual Capital.
  • LPC—LV Processes Capital.
  • LTC—LV Team Capital.
  • LCC—LV Clients Capital.
  • LIC—LV Intellectual Capital, represented as a scalar value.
The Structural Model (also known as Inner Model) is a directed graph (DAG—Directed Acyclic Graphs), having as nodes the LVs and as arcs the assumed causal influences: from LNT on LIC components and from LIC components on LIC; other possible influences between IC components were omitted.
The Observation Model (External Model) covers the assumed causal relations between LVs and their corresponding MVs. In our case, all these causal relations are assumed to be of a reflective type, meaning that MVs are LVs manifestations, not the reverse.
As seen before, LIC = [LIDC, LPC, LTC, LCC]T. This means that there are no MVs directly associated to the scalar LIC. Instead, LIC is modelled as a level 2 latent variable—Hierarchical model (Wald’s test, also called the Wald Chi-Squared Test)—using as MVs associated to LIC, the variables (P1 … P22) that are the MVs associated to its components [49] (see bottom of Figure 2, in blue bold).
In Figure 2, causal relations such as LIDC → LTC, LP → LCC, and LIDC → LPC are absent, meaning that there is no empirical evidence of its existence being available.
As mentioned before, according to Trinchera and Russolillo [51], PLS Path Modelling is an adequate method to be used in the construction of composite indicators. In our case, the SMEs’ latent variable scores, estimated by the PLS, can be used to build indicators or scoring functions both for IC components and IC itself.
As previously indicated in Section 4.1, R Package “plspm” [49,53] was used as a computational instrument for estimation work.
Biplots were used to study the LVs estimated scores to help in the identification of the relations between MVs, LVs, and SMEs and to identify also SMEs’ subgroups for which it could make sense the specification of sub-models [55,56].

5. Data

5.1. Questionnaire

As has been reported in Matos [1], the questionnaire associated to ICM, in its present form, has 97 questions structured in 22 groups, corresponding to aspects and/or features (parameters) assumed relevant for the IC management of an SME (see Figure 3).
Each group Pj (j = 1,,22) in Figure 3 contains one or more questions whose answers are expressed in a five level Likert Scale. Each column corresponds to a specific question and, from the point of view of computation, each one represents a manifest/observable variable—the corresponding dataset having 97 variables or columns. These variables are grouped in 22 groups corresponding to 22 parameters. For example, Quadrant I—Individual Capital (QCI) is covered by 4 parameters (P1, P2, P3, P4), whose meanings and labels in the questionnaire are:
  • Parameter 1 (QCIP1)—Training/Qualification and Talent Management (associated with 3 questions—Q1.1, Q1.2, Q1.3).
  • Parameter 2 (QCIP2)—Valuation of Know-How and Innovation (associated with 3 questions—Q2.1, Q2.2, Q2.3).
  • Parameter 3 (QCIP3)—Investment in Innovation and Development (associated with 8 questions—Q3.1…Q3.8).
  • Parameter 4 (QCIP4)—Existence of Policy for Talent Retention (associated with 4 questions—Q4.1, Q4.2, Q4.3, Q4.4).
This means that Quadrant I—Individual Capital is the object of 4 parameters (P1 to P4) and of 18 questions [for the complete questionnaire see [1]].

5.2. Data Organization

Using the questionnaire just described in 5.1 and the results obtained in Matos [1], along with the new sample obtained in 2016, two final datasets were considered. In what follows, those datasets are going to be identified by Data2011 and Data2016. Both datasets have the same structure exemplified in Figure 3. Data2011 contains the answers from 112 Portuguese SMEs to the questionnaire already described in Matos [1]. The dataset Data2016 contains the answers to the same questionnaire obtained from 38 Portuguese SMEs in 2016. Both datasets have 97 columns and were applied to Portuguese SMEs samples.

6. Data Analysis Results

6.1. Structural Model Estimation

Applying the methodology explained in Section 4 to the model specified in Figure 2 and Figure 3 and using the R Package “plspm” [49,53] to estimate the structural relations between the defined LVs, Table 1 and Table 2 were obtained. These tables show that the results obtained with both samples are similar, coherent, and the global quality of fit, not being outstanding, is fair enough.
The meanings of the column labels in Table 1 and Table 2 are:
  • Mode “A”—Means that all MVs for a LV are of the reflective type: MVs are manifestations of the corresponding LVs. The observed values are caused by the behaviour of the corresponding latent variable.
  • Cronbach α—This value measures the coherence and homogeneity of MVs associated with the corresponding LV.
  • R2—Quality of fit of the LV by a weighted combination of its MVs.
  • First Eigen/Second Eigen—This quotient is an indicator that shows if the first principal component of the MVs group can represent the group. It is the quotient between the first and second eigenvalues for data in each group. The greater the quotient, the greater the importance of the first component; consequently, this quotient indicates the quality of the first principal component as representative of the group.
Figure 4 presents the ICM estimation results with the corresponding numerical values being shown in Table 3.
The assumed causal effects are significant at level 0.01 (based on bootstrap sampling). This means that, as expected from the ICM, there is empirical evidence that the observed SMEs’ top managers (both in 2011 and 2016) seem to feel that the use of NTIC and Network (LNT) have significant causal effects on the development of all the components of Intellectual Capital.
As can be seen from Figure 4, the goodness of fit for the model corresponding to Data2011 and Data2016 are 0.50 and 0.69, respectively, considered fair enough.
The meanings of the column labels in Table 3 are [49]:
  • TYPE—Variables exogenous or endogenous in relation to the inner model.
  • R2—Determination coefficient as in multiple regression.
  • Commun.—Communality: Is the percentage of variance of MVs that is explained by the corresponding latent variable.
  • Redund.—Redundancy: Given a dependent LV and its independents LVs, it is the percentage of variability of the MVs of those independent LVs that is explained by the dependent LV manifests variance.
  • AVE—Average Variance Extracted: the percentage of variance extracted from its indicators in relation to error variance.
This table shows not only that both samples support clearly the ICM specified in Figure 1, but also that there is a strong coherence between the results obtained with the two samples. This coherence means that, subjacent to the expressed answers by top managers in the two occasions, there is an implicit agreement about IC management characterised by the tasks expressed in the questionnaire.

6.2. Estimation of the Measurement Model

Examining the outputs from the R Package “plspm,” the loadings (correlations between LVs and their MVs) and the weights associated to the MVs are obtained.
Table 4 presents the weights of MVs associated to each one of LVs for the ICM, estimated from the two samples. From these weights, the LVs estimated scores could be computed for each SME in the datasets, obtaining scores for LIC and for each one of its components.
As an example, for the ICM Model (Matos and Lopes, 2009) [2], using only results from Data2011 and extracting the estimated values from the edges of Figure 4a, the following expression for SMEs’ scores is obtained:
L I C   =   0.1177 × L N T   +   0.1778 × L I D C   +   0.2283 × L T C   +   0.4484 × L P C
Using now the weights from Table 4 (column 3), the expressions for the LVs scores estimations can be obtained, leading to a scoring function for LIC that depends only on observed data. This expression is then calculated for each SME, obtaining an estimated score for that company. It must be observed that with this procedure scoring functions for LIC and for each one of its latent component variables is obtained. The result can be collected in a data table with n rows (number of observed SMEs) and p columns (number of LIC components) that can be used to analyse the quality and other features.

6.3. Estimating ICM Variants

As observed before, it makes sense to experiment adding, incrementally, to the ICM model specified in Figure 2 some new edges that can be justified, given the meaning of LIC components, examining the results of model fitting to see if the data supports those additional hypothetical causal effects. For example, the edges that could be easily justifiable on the grounds of logic and some experience are: LNT → LTC (New Technologies of Information and Communication influences Team Capital) [57]; LIDC → LPC (e.g., [57]) (Individual Capital influences Processes Capital) (e.g., [58]); LPC → LCC (Processes Capital influences Clients Capital) (e.g., [8]). Table 5 shows the effect of these incremental modifications on the global goodness of fit of the model, starting from the ICM Basic Model (BM) and finishing with the Saturated Model, including all possible influences.
In Table 5, BM means the Basic Model expressed in Figure 2, while (BM) + (LIDC → LTC) means that it was added to the Basic Model (BM) of the hypothesis that Individual Capital (LIDC) influences Team Capital (LTC), which resulted in a goodness of fit observed in two occasions: 2011 and 2016 (0.50 and 0.69, respectively). The same applies for other hypotheses.
As can be seen from Table 5, the specified incremental modifications of the Basic Model (BM) structure (see hypothesis in the leftmost column) produce slight increases in the global goodness of the fit index, showing that it makes sense to add these modifications to the basic model. In fact (see the last row), this experience was also repeated for the “saturated model,” adding the remaining missing edges in Figure 4. This last experience was repeated with all available information, resulting from the merge of both datasets and it was observed that the edges (LIDC → LPC), (LIDC → LCC), and (LTC → LCC) are not supported by available data (not significant at level 0.01, using bootstrap sampling). The final fitted model, with the global goodness of fit of 0.6, can be seen in Figure 5.

6.4. Analysis of LVs Scores Using Biplots

The methodology used to obtain scores for SMEs LIC out of the answers to the specified questionnaire, allows, as seen before, the estimation of scores for all other latent variables in the model, including LIC components. Biplots [55] can be useful in this context not only to present graphically the estimated correlations between LVs, but also to relate LVs with its MVs, to relate LVs with SMEs (rows of dataset) and to relate visually the LVs scores with other external variables observed on SMEs—such as economic classifications represented by qualitative variables. This possibility may allow the identification of subsets of SMEs for which it could make sense the formulation of specific scoring models. The possibilities just described are illustrated in the Biplot of Figure 6, created using the software described in Vairinhos [59] and the data resulting from the merge of SMEs 2011 and SMEs 2016. The combined dataset has n   =   112   +   38   =   150 rows and p =   4 columns, including both the scores obtained for IC and its components in the two occasions (2011 and 2016). The specific clusters of SMEs were obtained using a cluster analysis method (Ward’s method) and plotted using its convex closures.
The SMEs (blue points) and LVs (red vectors) are plotted in the same graph. LIC was added, later, as a supplementary variable.
These groups can now be characterised using the original MVs or the LVs estimations. For example, the group with the number 1 has the following characterisation using the MVs: the set of SMEs for which (1 ⇐ PR ⇐ 2.5) AND (1 ⇐ QCCP4 ⇐ 1.8), meaning: the set of SMEs for which their top-level managers answered to the question Network Parameter (PR) with values between 1 and 2.5 and to the QCCP4—Quadrant Clients Capital—Question 4. This can be used to identify and characterise groups of SMEs that justify, eventually, the need of specific versions for the scoring framework.

7. Results Discussion

The results presented in this paper were obtained using two small independent random samples (n1 = 112 and n2 = 38) of Portuguese SMEs obtained in a previous study by Matos (2013) [1] and in another study from 2016, respectively. The data was collected using the answers to a questionnaire with 97 questions described in Matos (2013) [1], aiming to characterise the IC management practices of Portuguese SMEs’ top managers.
As can be seen by the statistical methods mentioned in the methodology section, the study is essentially an exercise of descriptive multivariate exploratory data analysis. The idea is to use the available data not to formally infer (using the probability theory or classical mathematical theory) general properties for the target population, but to search for eventual relevant patterns in data or regularities that can justify the choice of future orientations of research. In this context, the only reference to statistical inference is the use of the bootstrap method, where 500 bootstrap pseudo-samples were drawn to get an “extra feeling” about the eventual existence of regularities (bootstrapped “confidence intervals” for the estimation of the main parameters).
The main result from this study is a method to score SME´s IC, using as input the perceptions of its top managers about management practices, related with IC, expressed in the form of answers to a questionnaire with 97 questions using Likert scales of 5 values.
The proposed method is based in a Path Model for data formed by the top managers’ answers and estimated using the PLS Path Modelling (PLSPM) technique [49]. The use of PLS is made in the perspective of an exploratory data analysis, data driven, and interactive modelling process, as initially synthetised in Henseler et al. [60]. PLS was chosen as an instrument of descriptive statistics, having in mind its applicability to small datasets with the number of variables greater than the number of observations, where no distributional hypothesis is made. PLS has been frequently questioned in theoretical grounds. This is the case of the criticism referred in Henseler et al. [60]; as can be seen in that reference, some of this criticism has sometimes a biased nature.
Hwang and Takane [54] present a solution for another kind of PLS shortcoming, related to the possibility of convergence of basic PLS algorithm to local extremes; this solution, named Generalised Structural Component Analysis (GSCA) was used with similar results to those presented in this work.
Assuming that IC is a latent variable represented by a vector of latent component variables (LVs), the corresponding structural model is formed by the assumed relations between those latent components. The measurement model is defined using, for each LV, a set of manifest variables (MVs), formed by the answers to specific groups of questions, those 22 groups, named parameters, having previously been defined in the context of a framework described in Section 3 of this work.
The scores—both for IC and its components—are the estimations of LV´s obtained using PLSPM. The set of scores obtained for the observed SMEs on the estimated LVs are graphically represented using biplots, whose coordinates can be clustered (these clusters being used to characterise specific groups of SMEs and detect the need of specific versions of the model).
Given the nature of data available and the exploratory character of this research, no attempt was made of formal modelling or statistical generalization of sampling results to the populations involved; the performance indexes presented in Table 1, Table 2 and Table 3 have only the descriptive and exploratory purpose of synthesizing the current evidence.
To compare the results obtained in this work with the results of similar studies described in the literature, serving as benchmark, it is possible to find similarities in Tenenhaus et al. [50], whose first example analyses the so-called European Consumers Satisfaction Model (ECSI). The modelling problem being similar, its results were obtained with a greater sample of 250 observations.

8. Conclusions, Limitations, and Future Work

Designing and articulating a successful competitive strategy is a never-ending task. It is a process of forming a sustainable advantage as a dynamic and innovative process with a changing and adaptive distinctive strategy. In this context, the IC management plays an important role in influencing the heterogeneity of companies and their sustainable competitive advantage. The goal of this study was to offer a data-driven Intellectual Capital Management Scoring System that can be utilized in the auditing of the IC management of organisations. This research belongs to an ongoing process of data collection allowing the creation of a time series of observations of Portuguese SMEs aiming to evaluate and characterise the behaviour of the corresponding model parameter estimations, the eventual convergence of these estimations to stable values, and the reliability of the framework.
Data analysis of the two initial datasets, using the specified methodology based on Path Models estimated with Partial Least Squares (PLS) and using Biplots to identify and characterise homogeneous groups of SMEs, showed that the results obtained from these two independent samples were not only comparable but also similar and coherent with the ICM [2].
This data collection effort is to be continued in the near future, considering SMEs from several countries and economic contexts, allowing to identify eventual needs of specific variants of the framework, the aim being, at the end, to have an operational version, able to be used for the IC measurement of specific organizations and objective comparisons of IC between several SMEs.
These two studies showed encouraging evidence that researching the proposed framework is worthy and that new opportunities arise if further efforts are put into data collection and statistical treatment. The methodology associated with this framework is easily replicable, since its main components—Questionnaire, Path Modelling, PLS estimation, and Biplots which describe the results and identify homogeneous groups of SMEs—are easily available through open and free software, both in R and Python languages.
In addition, this same methodology can also be applied when some or all observable variables—that, in the present version, are opinions of top managers—are replaced by physical, economic, or social variables. The setup of an operational version of this framework can have meaningful social impact since it could guide companies in the management of their IC and other intangible assets, monitoring the creation of a sustainable competitive advantage.
The main limitation of this work is the process of data collection and the associated difficulty in attracting the support of potential data suppliers. Future work must address this shortcoming and the development of specific versions of the framework to address the needs of specific organizations clusters.

Author Contributions

Formal analysis, F.M. and R.G.; supervision, F.M. and V.V.; writing—original draft, V.V. and F.M.; writing—review and editing, F.M., R.G. All authors have read and agreed to the published version of the manuscript.

Funding

Radu Godina acknowledges Fundação para a Ciência e a Tecnologia (FCT—MCTES) for its financial support via the project UIDB/00667/2020 (UNIDEMI).

Conflicts of Interest

The authors declare no conflict of interest.

References

  1. Matos, F. A Theoretical Model for the Report of Intellectual Capital. Electron. J. Knowl. Manag. 2013, 11, 339–360. [Google Scholar]
  2. Matos, F.; Lopes, A. Intellectual Capital Management—SMEs Accreditation Methodology. In Proceedings of the European Conference on Intellectual Capital, Haarlem, The Netherlands, 28–29 April 2009; Stam, C., Ed.; Academic Publishing Limited: Reading, UK, 2009; pp. 344–354. [Google Scholar]
  3. Galbraith, J.K. The New Industrial State; Houghton Mifflin Company: Boston, MA, USA, 1967. [Google Scholar]
  4. Itami, H. Mobilizing Invisible Assets; Harvard University Press: Cambridge, UK, 1987. [Google Scholar]
  5. Konrad Group. The Invisible Balance Sheet; Sveiby, K., Ed.; Affärsvärlden Förlag: Stockholm, Sweden, 1990; ISBN 91-85804-22-3. [Google Scholar]
  6. Sveiby, K. The New Organizational Wealth: Managing and Measuring Knowledge-Based Assets; Berrett-Koehler Publishers: San Francisco, CA, USA, 1997; ISBN 1576750140. [Google Scholar]
  7. Stewart, T.A. Brainpower: How Intellectual Capital is Becoming America’s Most Important Asset. Available online: https://archive.fortune.com/magazines/fortune/fortune_archive/1991/06/03/75096/index.htm (accessed on 1 July 2020).
  8. Stewart, T.A. Intellectual Capital: The New Wealth of Organizations; Currency Doubleday: New York, NY, USA, 1997; ISBN 0385482280. [Google Scholar]
  9. Stewart, T.A. The Wealth of Knowledge: Intellectual Capital and the Twenty-First Century Organization; Currency/Doubleday: New York, NY, USA, 2001; ISBN 0385500718. [Google Scholar]
  10. Bontis, N. World Congress on Intellectual Capital Readings; Elsevier Butterworth Heinemann KMCI Press: Boston, MA, USA, 2002. [Google Scholar]
  11. Nonaka, I.; Takeuchi, H. The Knowledge-Creating Company: How Japanese Companies Create the Dynamics of Innovation; Oxford University Press: New York, NY, USA, 1995; ISBN 978-0195092691. [Google Scholar]
  12. Senge, P.M. The Fifth Discipline: The Art and Practice of the Learning Organization; Doubleday/Currency: New York, NY, USA, 1990. [Google Scholar]
  13. Sullivan, P.H. Profiting from Intellectual Capital: Extracting Value from Innovation; Wiley: Hoboken, NJ, USA, 1998; ISBN 978-0-471-19302-9. [Google Scholar]
  14. Edvinsson, L. Corporate Longitude: What You Need to Know to Navigate the Knowledge Economy; Financial Times Prentice Hall: London, UK, 2002; ISBN 0273656279. [Google Scholar]
  15. Edvinsson, L. Developing Intellectual Capital at Skandia. Long Range Plan. 1997, 30, 366–373. [Google Scholar] [CrossRef]
  16. Edvinsson, L.; Malone, M.S. Intellectual Capital: Realizing Your Company’s True Value by Finding Its Hidden Brainpower; Harper Business: New York, NY, USA, 1997; ISBN 0887308414. [Google Scholar]
  17. Kaplan, R.S.; Norton, D.P. The Balanced Scorecard: Measures that Drive Performance. Harv. Bus. Rev. 1992, 70, 71–79. [Google Scholar] [PubMed]
  18. Kaplan, R.S.; Norton, D.P. The Balanced Scorecard: Translating Strategy into Action; Harvard Business School Press: Boston, MA, USA, 1996; ISBN 0875846513. [Google Scholar]
  19. Kaplan, R.S.; Norton, D.P. Using the Balanced Scorecard as a Strategic Management System. Harv. Bus. Rev. 1996, 74, 75–85. [Google Scholar]
  20. Mouritsen, J.; Larsen, H.T.; Bukh, P.N. Intellectual Capital and the ‘Capable Firm’: Narrating, Visualising and Numbering for Managing Knowledge. Account. Organ. Soc. 2001, 26, 735–762. [Google Scholar] [CrossRef]
  21. Andriessen, D.; Tissen, R. Weightless Weight—Find Your Real Value in a Future of Intangible Assets; Pearson Education: London, UK, 2000. [Google Scholar]
  22. Viedma Martí, J.M. ICBS—Intellectual Capital Benchmarking System. J. Intellect. Cap. 2001, 2, 148–165. [Google Scholar] [CrossRef] [Green Version]
  23. Zhou, A.Z.; Fink, D. The Intellectual Capital Web. J. Intellect. Cap. 2003, 4, 34–48. [Google Scholar] [CrossRef]
  24. Abeysekera, I.; Guthrie, J. An Empirical Investigation of Annual Reporting Trends of Intellectual Capital in Sri Lanka. Crit. Perspect. Account. 2005, 16, 151–163. [Google Scholar] [CrossRef] [Green Version]
  25. Andriessen, D.; Stam, C. Intellectual Capital of The European Union. In Proceedings of the 7th McMaster World Congress on the Management of Intellectual Capital and Innovation, Hamilton, ON, Canada, 19–21 January 2005. [Google Scholar]
  26. Martí, J.M.V. In Search of an Intellectual Capital General Theory. Electron. J. Knowl. Manag. 2003, 1, 213–226. [Google Scholar]
  27. Abhayawansa, S.A. A review of guidelines and frameworks on external reporting of intellectual capital. J. Intellect. Cap. 2014, 15, 100–141. [Google Scholar] [CrossRef]
  28. Dumay, J. Reflections on interdisciplinary accounting research: The state of the art of intellectual capital. Account. Audit. Account. J. 2014, 27, 1257–1264. [Google Scholar] [CrossRef]
  29. Dumay, J. A critical reflection on the future of intellectual capital: From reporting to disclosure. J. Intellect. Cap. 2016, 17, 168–184. [Google Scholar] [CrossRef]
  30. Subramaniam, M.; Youndt, M.A. The Influence of Intellectual Capital on the Types of Innovative Capabilities. Acad. Manag. J. 2005, 48, 450–463. [Google Scholar] [CrossRef] [Green Version]
  31. Lo, C.; Wang, C.; Chen, Y.-C. The Mediating Role of Intellectual Capital in Open Innovation in the Service Industries. Sustainability 2020, 12, 5220. [Google Scholar] [CrossRef]
  32. Martín-de-Castro, G.; Delgado-Verde, M.; López-Sáez, P.; Navas-López, J.E. Towards ‘An Intellectual Capital-Based View of the Firm’: Origins and Nature. J Bus Ethics 2011, 98, 649–662. [Google Scholar] [CrossRef]
  33. Choong, K.K. Intellectual capital: Definitions, categorization and reporting models. J. Intellect. Cap. 2008, 9, 609–638. [Google Scholar] [CrossRef] [Green Version]
  34. Chen, J.; Zhu, Z.; Yuan Xie, H. Measuring intellectual capital: A new model and empirical study. J. Intellect. Cap. 2004, 5, 195–212. [Google Scholar] [CrossRef] [Green Version]
  35. Andriessen, D. IC valuation and measurement: Classifying the state of the art. J. Intellect. Cap. 2004, 5, 230–242. [Google Scholar] [CrossRef]
  36. Buenechea-Elberdin, M.; Kianto, A.; Sáenz, J. Intellectual capital drivers of product and managerial innovation in high-tech and low-tech firms. RD Manag. 2018, 48, 290–307. [Google Scholar] [CrossRef]
  37. Cabrilo, S.; Kianto, A.; Milic, B. The effect of IC components on innovation performance in Serbian companies. Vine J. Inf. Knowl. Manag. Syst. 2018, 48, 448–466. [Google Scholar] [CrossRef]
  38. Dumay, J.; Guthrie, J.; Rooney, J. Being critical about intellectual capital accounting in 2020: An overview. Crit. Perspect. Account. 2020, 70, 102185. [Google Scholar] [CrossRef]
  39. Martínez-Torres, M.R. A procedure to design a structural and measurement model of Intellectual Capital: An exploratory study. Inf. Manag. 2006, 43, 617–626. [Google Scholar] [CrossRef]
  40. Martín-de Castro, G.; Delgado-Verde, M.; Navas-López, J.E.; Cruz-González, J. The moderating role of innovation culture in the relationship between knowledge assets and product innovation. Technol. Forecast. Soc. Chang. 2013, 80, 351–363. [Google Scholar] [CrossRef]
  41. Martín-de Castro, G. Intellectual capital and the firm: Some remaining questions and prospects. Knowl. Manag. Res. Pract. 2014, 12, 239–245. [Google Scholar] [CrossRef]
  42. Matos, F.; Vairinhos, V.; Osinski, M. Intellectual capital management as an indicator of sustainability. In Proceedings of the European Conference on Knowledge Management, Academic Conferences International Limited, Barcelona, Spain, 7–8 September 2017; pp. 655–663. [Google Scholar]
  43. Utama, A.A.G.S.; Mirhard, R.R. The influence of sustainability report disclosure as moderating variable towards the impact of intellectual capital on company’s performance. Int. J. Econ. Financ. Issues 2016, 6, 1262–1269. [Google Scholar]
  44. Rodrigues, L.L.; Tejedo-Romero, F.; Craig, R. Corporate governance and intellectual capital reporting in a period of financial crisis: Evidence from Portugal. Int. J. Discl. Gov. 2017, 14, 1–29. [Google Scholar] [CrossRef] [Green Version]
  45. Matos, F.; Vairinhos, V.M. Intellectual capital management as a driver of competitiveness and sustainability. J. Intellect. Cap. 2017, 18, 466–469. [Google Scholar] [CrossRef] [Green Version]
  46. Matos, F.; Vairinhos, V.; Selig, P.M.; Edvinsson, L. Introduction. In Intellectual Capital Management as a Driver of Sustainability; Matos, F., Vairinhos, V., Selig, P., Edvinsson, L., Eds.; Springer: Cham, Switzerland, 2019; p. 5. [Google Scholar]
  47. Matos, F.; Lopes, A.; Matos, N.; Vairinhos, V. Testing the Intellectual Capital Model Using Biplots. In Proceedings of the European Conference on Knowledge Management, Cartagena, Spain, 6–7 September 2012; Academic Publishing Limited: Reading, UK, 2012; Volume 1, pp. 717–725. [Google Scholar]
  48. Abdi, H.; Chin, W.W.; Vinzi, V.E.; Russolillo, G.; Trinchera, L. (Eds.) New Perspectives in Partial Least Squares and Related Methods; Springer: Berlin/Heidelberg, Germany, 2013. [Google Scholar]
  49. Sanchez, G. PLS Path Modeling with R.; Trowchez Editions: Berkeley, CA, USA, 2013. [Google Scholar]
  50. Tenenhaus, M.; Vinzi, V.E.; Chatelin, Y.-M.; Lauro, C. PLS Path Modeling. Comput. Stat. Data Anal. 2005, 48, 159–205. [Google Scholar] [CrossRef]
  51. Trinchera, L.; Russolillo, G. On the Use of Structural Equation Models and PLS Path Modeling to Build Composite Indicators. 2010. Available online: https://core.ac.uk/download/pdf/6471123.pdf (accessed on 1 July 2020).
  52. Vinzi, V.E.; Russolillo, G. Partial Least Squares Algorithms and Methods. Wiley Interdiscip. Rev. Comput. Stat. 2012, 5, 1–19. [Google Scholar] [CrossRef]
  53. Sanchez, G.; Trinchera, L.; Russolillo, G. R Package “plspm”: Tools for Partial Least Squares Path Modeling (PLS-PM). 2015. Available online: https://rdrr.io/cran/plspm/f/inst/doc/plspm_introduction.pdf (accessed on 1 July 2020).
  54. Hwang, H.; Takane, Y. Generalized Structured Component Analysis: A Component-Based Approach to Structural Equation Modeling; Chapman and Hall/CRC: London, UK, 2014; ISBN 978-0-429-16845-1. [Google Scholar]
  55. Gabriel, K.R. The Biplot Graphic Display of Matrices with Application to Principal Component Analysis. Biometrika 1971, 58, 453–467. [Google Scholar] [CrossRef]
  56. Vairinhos, V.; Galindo Villardón, M.P. Biplots PMD—Data Mining Centrada em Biplots. Apresentação de um Protótipo. 2004. Available online: https://www.academia.edu/25177669/Biplots_PMD_Data_Mining_Centrada_em_Biplots_Apresenta%C3%A7%C3%A3o_de_um_Prot%C3%B3tipo (accessed on 1 July 2020).
  57. Alvarenga, A.; Matos, F.; Godina, R.; C. O. Matias, J. Digital Transformation and Knowledge Management in the Public Sector. Sustainability 2020, 12, 5824. [Google Scholar] [CrossRef]
  58. Karier, T. Intellectual Capital: Forty Years of the Nobel Prize in Economics; Cambridge University Press: New York, NY, USA, 2010; ISBN 978-0-521-76326-4. [Google Scholar]
  59. Vairinhos, V.M. BiplotsPMD—Un programa para Análisis Multivariante Centrada en Biplots. In Proceedings of the Congreso Internacional de Estadística y Medio Ambiente (EMA4), Salamanca, Spain, 24–26 September 2003. [Google Scholar]
  60. Henseler, J.; Dijkstra, T.K.; Sarstedt, M.; Ringle, C.M.; Diamantopoulos, A.; Straub, D.W.; Ketchen, D.J., Jr.; Hair, J.F.; Hult, G.T.M.; Calantone, R.J. Common Beliefs and Reality About PLS: Comments on Ro nkko and Evermann (2013). Organ. Res. Methods 2014, 17, 182–209. [Google Scholar] [CrossRef] [Green Version]
Figure 1. Intellectual Capital Model (ICM) [2]: (a) 2D Model View; (b) 3D Model View.
Sustainability 12 08086 g001
Figure 2. Path Model corresponding to the ICM [1] represented in Figure 1.
Sustainability 12 08086 g002
Figure 3. Dataset structure associated to the Questionnaire (97 questions). Questions (Q’s) are clustered in 22 Parameters (P’s).
Sustainability 12 08086 g003
Figure 4. Structural model estimation using the datasets: (a) Data2011; (b) Data2016.
Sustainability 12 08086 g004
Figure 5. Final fitted model using the merge of data sets Data2011 and Data2016. The missing edges are not significant.
Sustainability 12 08086 g005
Figure 6. Biplot obtained from the scores of LVs.
Sustainability 12 08086 g006
Table 1. Dataset Data2011. Unidimensional groups of Manifest Variables (MVs) associated to Latent Variables (LVs).
Latent VariableNumber of Manifest VariablesModeCronbach αR2First Eigen/Second Eigen
LNT2A0.720.873.6
LIDC4A0.830.894.1
LTC4A0.790.875.6
LPC8A0.810.862.9
LCC4A0.490.601.2
LIC22A0.920.933.5
Table 2. Dataset Data2016. Unidimensional groups of MVs associated to LVs.
Latent VariableNumber of Manifest VariablesModeCronbach αR2First Eigen/Second Eigen
LNT2A0.940.9715.5
LIDC4A0.920.947.9
LTC4A0.920.946.9
LPC8A0.830.872.6
LCC4A0.800.872.3
LIC22A0.960.965.9
Table 3. Summary of the Inner Models quality for the two data sets.
Data2011Data2016
LVTYPER2Commun.Redund.AVER2Commun.Redund.AVE
LNTExog.0.000.770.000.780.000.930.000.93
LIDCEndog.0.380.670.260.670.650.800.520.80
LTCEndog.0.510.620.310.620.660.790.500.79
LPCEndog.0.470.420.200.420.610.470.290.47
LCCEndog.0.370.370.140.380.520.600.310.60
LICEndog.1.000.400.400.401.000.550.550.55
Table 4. Estimated Weights from the MVs associated with IC LVs components using two datasets (Data2011 and Data2016).
LVsMVsData2011Data2016
LNTPR0.943750.6388
PNT0.607510.4384
LIDCQCI P10.487700.3256
QCI P20.456310.3398
QCI P30.463180.2950
QCI P40.459370.3384
LPCQCP P10.235140.1441
QCP P20.066160.2054
QCP P30.153510.0342
QCP P40.229850.1803
QCP P50.305790.2492
QCP P60.192600.1410
QCP P70.177730.1578
QCP P80.261650.1153
LCCQCC P10.546260.4906
QCC P20.045440.3185
QCC P30.082310.2433
QCC P40.777590.4100
LTCQCE P10.348710.2606
QCE P20.413280.3172
QCE P30.580690.3630
QCE P40.331920.2260
Table 5. Modification of Goodness of Fit as a function of several causal hypotheses.
HypothesisGoodness of Fit
(Data2011) (Data2016)
Basic Model (BM)0.500.69
(BM) + (LIDC → LTC)0.520.66
(BM) + (LPC → LCC)0.520.66
(BM) + {(LIDC → LTC), (LPC → LCC)}0.540.68
(BM) + {(LIDC → LTC), (LPC → LCC), (LIDC → LPC)}0.540.68
Saturated Model0.600.60

