Assessing the Risk of Natural Disaster-Induced Losses to Tunnel-Construction Projects Using Empirical Financial-Loss Data from South Korea


Abstract
1. Introduction
1.1. Research Background and Objective
1.2. Literature Review
2. Research Methods
2.1. Case-Study Approach
2.2. Data Collection and Management
2.3. Dependent Variable
2.4. Independent Variables
3. Results
3.1. Descriptive Statistics
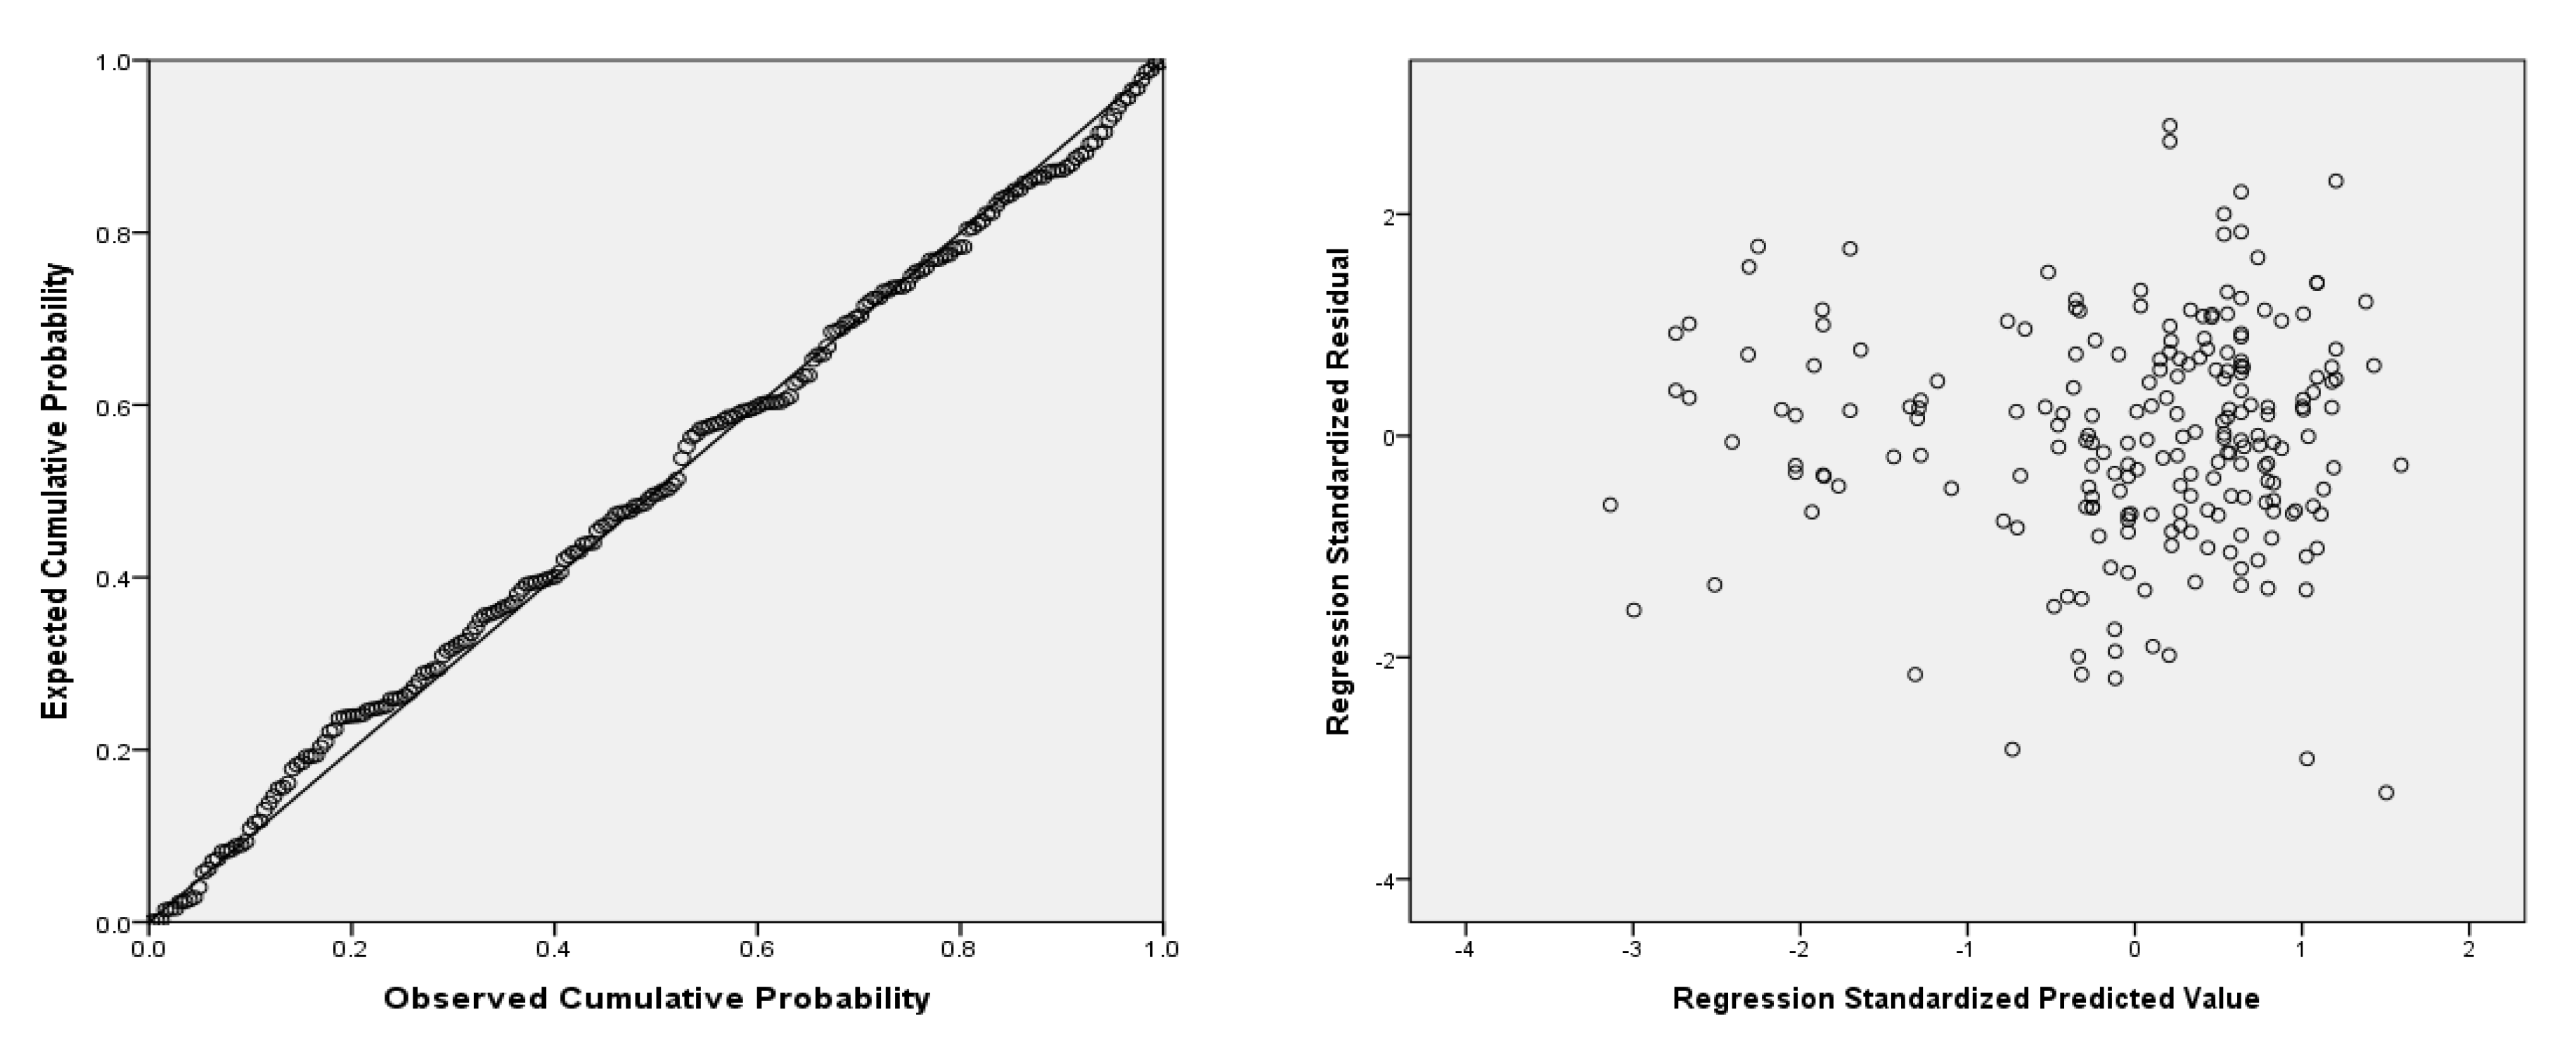
3.2. Multiple Regression Analysis
- : Constant;
- : Slope of high wind speed;
- : Slope of flooding;
- : Slope of rainfall.
4. Discussion
5. Conclusions
Author Contributions
Funding
Conflicts of Interest
References
- Shi, S.S.; Bu, L.; Li, S.C.; Xiong, Z.M.; Xie, X.K.; Li, L.P.; Zhou, Z.Q.; Xu, Z.H.; Ma, D. Application of comprehensive prediction method of water inrush hazards induced by unfavourable geological body in high risk karst tunnel: A case study. Geomat. Nat. Hazard Risk 2017, 8, 1407–1423. [Google Scholar] [CrossRef]
- Vanuvamalai, A.; Jaya, K.P.; Balachandran, V. Seismic performance of tunnel structures: A case study. Nat. Hazards 2018, 93, 453–468. [Google Scholar] [CrossRef]
- Wu, K.; Shao, Z.S.; Qin, S.; Li, B.X. Determination of deformation mechanism and countermeasures in silty clay tunnel. J. Perform. Constr. Facil. 2020, 34, 04019095. [Google Scholar] [CrossRef]
- Liang, D.X.; Jiang, Z.Q.; Zhu, S.Y.; Sun, Q.; Qian, Z.W. Experimental research on water inrush in tunnel construction. Nat. Hazards 2016, 81, 467–480. [Google Scholar] [CrossRef]
- Lai, J.X.; Wang, X.L.; Qiu, J.L.; Chen, J.X.; Hu, Z.N.; Wang, H. Extreme deformation characteristics and countermeasures for a tunnel in difficult grounds in southern Shaanxi. Environ. Earth Sci. 2018, 77, 1–14. [Google Scholar] [CrossRef]
- Li, Z.; Wu, S.; Cheng, Z.; Jiang, Y. Numerical investigation of the dynamic responses and damage of linings subjected to violent gas explosions inside highway tunnels. Shock Vib. 2018, 2018, 1–20. [Google Scholar] [CrossRef]
- Li, P.F.; Zou, H.H.; Wang, F.; Xiong, H.C. An analytical mechanism of limit support pressure on cutting face for deep tunnels in the sand. Comput. Geotech. 2020, 119, 103372. [Google Scholar] [CrossRef]
- Lin, D.M.; Yuan, R.; Shang, Y.J.; Bao, W.X.; Wang, K.Y.; Zhang, Z.J.; Li, K.; He, W.T. Deformation and failure of a tunnel in the restraining bend of a strike–slip fault zone: An example from Hengshan Mountain, Shanxi Province, China. Bull. Eng. Geol. Environ. 2017, 76, 263–274. [Google Scholar] [CrossRef]
- Cheng, W.C.; Li, G.; Liu, N.; Xu, J.; Horpibulsuk, S. Recent massive incidents for subway construction in soft alluvial deposits of Taiwan: A review. Tunn. Undergr. Space Technol. 2020, 96, 103178. [Google Scholar] [CrossRef]
- Li, P.; Liu, C.; Zhang, Y.X.; Zhang, J.; Yang, J.S.; Feng, T.G. Construction practice of landslide during tunneling in hilly topography. Eng. Fail. Anal. 2019, 104, 1234–1241. [Google Scholar] [CrossRef]
- Kim, J.M.; Kim, T.; Son, K.; Yum, S.G.; Ahn, S. Measuring Vulnerability of Typhoon in Residential Facilities: Focusing on Typhoon Maemi in South Korea. Sustainability 2019, 11, 2768. [Google Scholar] [CrossRef]
- Korea Insurance Development Institute. Insurance Statistical Month Book; Korea Insurance Development Institute: Seoul, Korea, 2016. [Google Scholar]
- Vaughan, E.J.; Vaughan, T.M. Essentials of Insurance: A Risk Management Perspective, 1st ed.; Wiley: Hoboken, NJ, USA, 1995. [Google Scholar]
- Paudel, Y. A Comparative study of public—private catastrophe insurance systems: Lessons from current practices. Geneva Pap. Risk Ins. 2012, 37, 257–285. [Google Scholar] [CrossRef]
- Wood, G.; Ellis, R.C.T. Risk management practices of leading UK cost consultants. Eng. Constr. Archit. Manag. 2003, 10, 254–262. [Google Scholar] [CrossRef]
- Dikmen, I.; Birgonul, M.T.; Arikan, A.E. A Critical Review of Risk Management Support Tools. In Proceedings of the 20th Annual Conference of Association of Researchers in Construction Management, Edinburgh, UK, 1–3 September 2004; pp. 1145–1154. [Google Scholar]
- Ahn, S.J.; Kim, T.; Kim, J.-M. Sustainable Risk Assessment through the Analysis of Financial Losses from Third-Party Damage in Bridge Construction. Sustainability 2020, 12, 3435. [Google Scholar] [CrossRef]
- Dewar, J. International Project Finance: Law and Practice; Oxford University Press: Oxford, UK, 2011. [Google Scholar]
- Odeyinka, H.A. An evaluation of the use of insurance in managing construction risks. Constr. Manag. Econ. 2000, 18, 519–524. [Google Scholar] [CrossRef]
- Fu, J.Y.; Yang, J.S.; Zhang, X.M.; Klapperich, H.; Abbas, S.M. Response of the ground and adjacent buildings due to tunnelling in completely weathered granitic soil. Tunn. Undergr. Space Technol. 2014, 43, 377–388. [Google Scholar] [CrossRef]
- Zhong, M.H.; Zhang, X.K.; Liu, T.M.; Wei, X.; Fan, W.C. Safety evaluation of engineering and construction projects in China. J. Loss. Prev. Process Ind. 2003, 16, 201–207. [Google Scholar] [CrossRef]
- Wang, T.T. Characterizing crack patterns on tunnel linings associated with shear deformation induced by instability of neighboring slopes. Eng. Geol. 2010, 115, 80–95. [Google Scholar] [CrossRef]
- Noferini, L.; Pieraccini, M.; Mecatti, D.; Macaluso, G.; Atzeni, C.; Mantovani, M.; Marcato, G.; Pasuto, A.; Silvano, S.; Tagliavini, F. Using GB-SAR technique to monitor slow moving landslide. Eng. Geol. 2007, 95, 88–98. [Google Scholar] [CrossRef]
- Wu, X.G.; Liu, H.T.; Zhang, L.M.; Skibniewski, M.J.; Deng, Q.L.; Teng, J.Y. A dynamic Bayesian network based approach to safety decision support in tunnel construction. Reliab. Eng. Syst. Saf. 2015, 134, 157–168. [Google Scholar] [CrossRef]
- Thomas, T. Breaking News—Prague Ring Road Tunnel Collapse. Tunnelling Journal. 7 July 2010. Available online: https://tunnellingjournal.com/breaking-news-prague-ring-road-tunnel-collapse/ (accessed on 7 August 2020).
- Qian, Q.; Lin, P. Safety risk management of underground engineering in China: Progress, challenges and strategies. J. Rock Mech. Geotech. Eng. 2016, 8, 423–442. [Google Scholar] [CrossRef]
- Yoo, C.; Lee, D. Deep excavation-induced ground surface movement characteristics: A numerical investigation. Comput. Geotech. 2008, 35, 231–252. [Google Scholar] [CrossRef]
- Duddeck, H. Challenges to tunneling engineers. Tunn. Undergr. Space Technol. 1996, 11, 5–10. [Google Scholar] [CrossRef]
- Eskesen, S.D.; Tengborg, P.; Kampmann, J.; Veicherts, T.H. Guidelines for tunneling risk management: International tunneling association working group No. 2. Tunn. Undergr. Space Technol. 2004, 19, 217–237. [Google Scholar] [CrossRef]
- ITIG (International Tunnelling Insurance Group). A Code of Practice for Risk Management of Tunnel Works; ITIG: Zurich, Switzerland, 2006. [Google Scholar]
- Smith, N.J.; Merna, T.; Jobling, P. Managing Risk in Construction Projects; Wiley-Blackwell: Hoboken, NJ, USA, 2009. [Google Scholar]
- Bhalla, S.; Yang, Y.W.; Zhao, J.; Soh, C.K. Structural health monitoring of underground facilities: Technological issues and challenges. Tunn. Undergr. Space Technol. 2005, 20, 487–500. [Google Scholar] [CrossRef]
- Chai, J.; Liu, J.X.; Qiu, B.; Li, Y.; Zhu, L.; Wei, S.M.; Wang, Z.P.; Zhang, G.W.; Yang, J.H. Detecting deformations in uncompacted strata by fiber Bragg grating sensors incorporated into GFRP. Tunn. Undergr. Space Technol. 2011, 26, 92–99. [Google Scholar] [CrossRef]
- Lin, P.; Li, Q.B.; Fan, Q.X.; Gao, X.Y.; Hu, S.Y. A real time location-based services system using Wi-Fi fingerprinting algorithm for safety risk assessment of workers in tunnels. Math. Probl. Eng. 2014. [Google Scholar] [CrossRef]
- Khoury, H.M.; Kamat, V.R. Evaluation of position tracking technologies for user localization in indoor construction environments. Autom. Constr. 2009, 18, 444–457. [Google Scholar] [CrossRef]
- Tu, Y.J.; Zhou, W.; Piramuthu, S. Identifying RFID-embedded objects in pervasive healthcare applications. Decis. Support Syst. 2009, 46, 586–593. [Google Scholar] [CrossRef]
- Rao, K.S.; Chandran, K.R. Mining of customer walking path sequence from RFID supermarket data. Electron. Gov. Int. J. 2013, 10, 34–55. [Google Scholar] [CrossRef]
- Carbonari, A.; Giretti, A.; Naticchia, B. A proactive system for real-time safety management in construction sites. Autom. Constr. 2011, 20, 686–698. [Google Scholar] [CrossRef]
- Behzadan, A.H.; Aziz, Z.; Anumba, C.J.; Kamat, V.R. Ubiquitous location tracking for context-specific information delivery on construction sites. Autom. Constr. 2008, 17, 737–748. [Google Scholar] [CrossRef]
- Shi, C.L.; Zhong, M.H.; Nong, X.Z.; He, L.; Shi, J.H.; Feng, G.G. Modeling and safety strategy of passenger evacuation in a metro station in China. Saf. Sci. 2012, 50, 1319–1332. [Google Scholar] [CrossRef]
- Bunni, N.G. Risk and Insurance in Construction, 2nd ed.; Spon Press: London, UK, 2003. [Google Scholar]
- Kunreuther, H.; Meyer, R.; Van den Bulte, C.; Chapman, R.E. Risk Analysis for Extreme Events: Economic Incentives for Reducing Future Losses; US Department of Commerce, Technology Administration, National Institute of Standards and Technology: Gaithersburg, MD, USA, 2004.
- Kuo, Y.-C.; Lu, S.-T. Using Fuzzy Multiple Criteria Decision Making Approach to Enhance Risk Assessment for Metropolitan Construction Projects. Int. J. Proj. Manag. 2013, 31, 602–614. [Google Scholar] [CrossRef]
- Chan, D.W.; Chan, A.P.; Lam, P.T.; Yeung, J.F.; Chan, J.H. Risk Ranking and Analysis in Target Cost Contracts: Empirical Evidence from the Construction Industry. Int. J. Proj. Manag. 2011, 6, 751–763. [Google Scholar] [CrossRef]
- Kim, K.S. A Study of the Risk Reflection on the Expansion of Construction Insurance. Ph.D. Thesis, Han Yang University, Seoul, Korea, 2009. [Google Scholar]
- Watson, C.C., Jr.; Johnson, M.E. Hurricane loss estimation models: Opportunities for improving the state of the art. Bull. Am. Meteorol. Soc. 2004, 85, 1713–1726. [Google Scholar] [CrossRef]
- Burton, C.G. Social vulnerability and hurricane impact modeling. Nat. Hazards Rev. 2010, 11, 58–68. [Google Scholar] [CrossRef]
- Vickery, P.J.; Skerlj, P.F.; Lin, J.; Twisdale, L.A., Jr.; Young, M.A.; Lavelle, F.M. HAZUSMH hurricane model methodology. II: Damage and loss estimation. Nat Hazards Rev. 2006, 7, 94–103. [Google Scholar] [CrossRef]
- Liu, M.; Burns, S.A.; Wen, Y. Optimal seismic design of steel frame buildings based on life cycle cost considerations. Earthq. Eng. Struct. Dyn. 2003, 32, 1313–1332. [Google Scholar] [CrossRef]
- Wen, Y.K.; Kang, Y.J. Minimum building life-cycle cost design criteria. II: Applications. J. Struct. Eng. 2001, 127, 338–346. [Google Scholar] [CrossRef]
- Wen, Y.K.; Kang, Y.J. Minimum building life-cycle cost design criteria. I: Methodology. J. Struct. Eng. 2001, 127, 330–337. [Google Scholar] [CrossRef]
- Toya, H.; Skidmore, M. Economic development and the impacts of natural disasters. Econ. Lett. 2007, 94, 20–25. [Google Scholar] [CrossRef]
- Daniell, J.E.; Khazai, B.; Wenzel, F.; Vervaeck, A. The CATDAT damaging earthquakes database. Nat. Hazards Earth Syst. Sci. 2011, 11, 2235–2251. [Google Scholar] [CrossRef]
- Cavallo, E.; Galiani, S.; Noy, I.; Pantano, J. Catastrophic Natural Disasters and Economic Growth. Rev. Econ. Stat. 2013, 95, 1549–1561. [Google Scholar] [CrossRef]
- Paul, S.; Sharif, H. Analysis of Damage Caused by Hydrometeorological Disasters in Texas, 1960–2016. Geosciences 2018, 8, 384. [Google Scholar] [CrossRef]
- Strömberg, D. Natural Disasters, Economic Development, and Humanitarian Aid. J. Econ. Perspect. 2007, 21, 199–222. [Google Scholar] [CrossRef]
- Alice, R.Z.; Jonathan, H.J. Dependence of US hurricane economic loss on maximum wind speed and storm size. Environ. Res. Lett. 2014, 9, 064019. [Google Scholar]
- Song, S.Y.; Park, M.J. Development of Damage Prediction Formula for Natural Disasters Considering Economic Indicators. Sustainability 2019, 11, 868. [Google Scholar] [CrossRef]
- Choi, H.H.; Mahadevan, S. Construction project risk assessment using existing database and project-specific information. J. Constr. Eng. Manag. 2008, 134, 894–903. [Google Scholar] [CrossRef]
- Shin, H.; Lee, W.; Byun, G.; Kim, J.; Jang, K.; Lee, J. Evaluation of the numerical models’ typhoon track predictability based on the moving speed and direction. Asia-Pac. J. Atmos. Sci. 2013, 10, 372–373. [Google Scholar]
- Kim, J.M.; Woods, P.K.; Park, Y.J.; Kim, T.; Son, K. Predicting hurricane wind damage by claim payout based on Hurricane Ike in Texas. Geomatics Nat. Hazards Risk 2015, 7, 1513–1525. [Google Scholar] [CrossRef]
- Ryu, H.; Son, K.; Kim, J.-M. Loss prediction model for building construction projects using insurance claim payout. J. Asian Archit. Build. Eng. 2016, 15, 441–446. [Google Scholar] [CrossRef]
- Choi, H.I. Spatial Assessment of Damage Vulnerability to Storms based on the Analysis of Historical Damage Cost Data in the Korean Peninsula. Sustainability 2019, 11, 6051. [Google Scholar] [CrossRef]
- Kim, J.-M.; Kim, T.; Son, K. Revealing building vulnerability to windstorms through an insurance claim payout prediction model: A case study in South Korea. Geomatics Nat. Hazards Risk. 2017, 8, 1333–1341. [Google Scholar] [CrossRef]
- Sinisuka, N.I.; Nugraha, H. Life cycle cost analysis on the operation of power generation. J. Qual. Maint. Eng. 2013, 19, 5–24. [Google Scholar] [CrossRef]


| Variable | Description | Unit | Data source |
|---|---|---|---|
| Dependent variable | |||
| Natural log-transformed damage ratio | Actual amount of loss dividend by total insured value of tunnel project | Ratio | Insurance company |
| Independent variables | |||
| High winds | Maximum sustained wind speed (10 m/s) 1: 21–40 2: 41–50 3: 51–60 4: 61–70 5: 71–80 | Ordinal scale | Natural Hazards Assessment Network |
| Flooding | Occurrence per year (number of times) 1: 0–1 2: 2 3: 3 4: 4 5: 5+ | Ordinal scale | Natural Hazards Assessment Network |
| Rainfall | Amount of precipitation (10 mm/h) 1: below 30 2: 30–70 3: 71–100 4: 101–110 5: 111–180 | Ordinal scale | Natural Hazards Assessment Network |
| Statistic | df | Significance | |
|---|---|---|---|
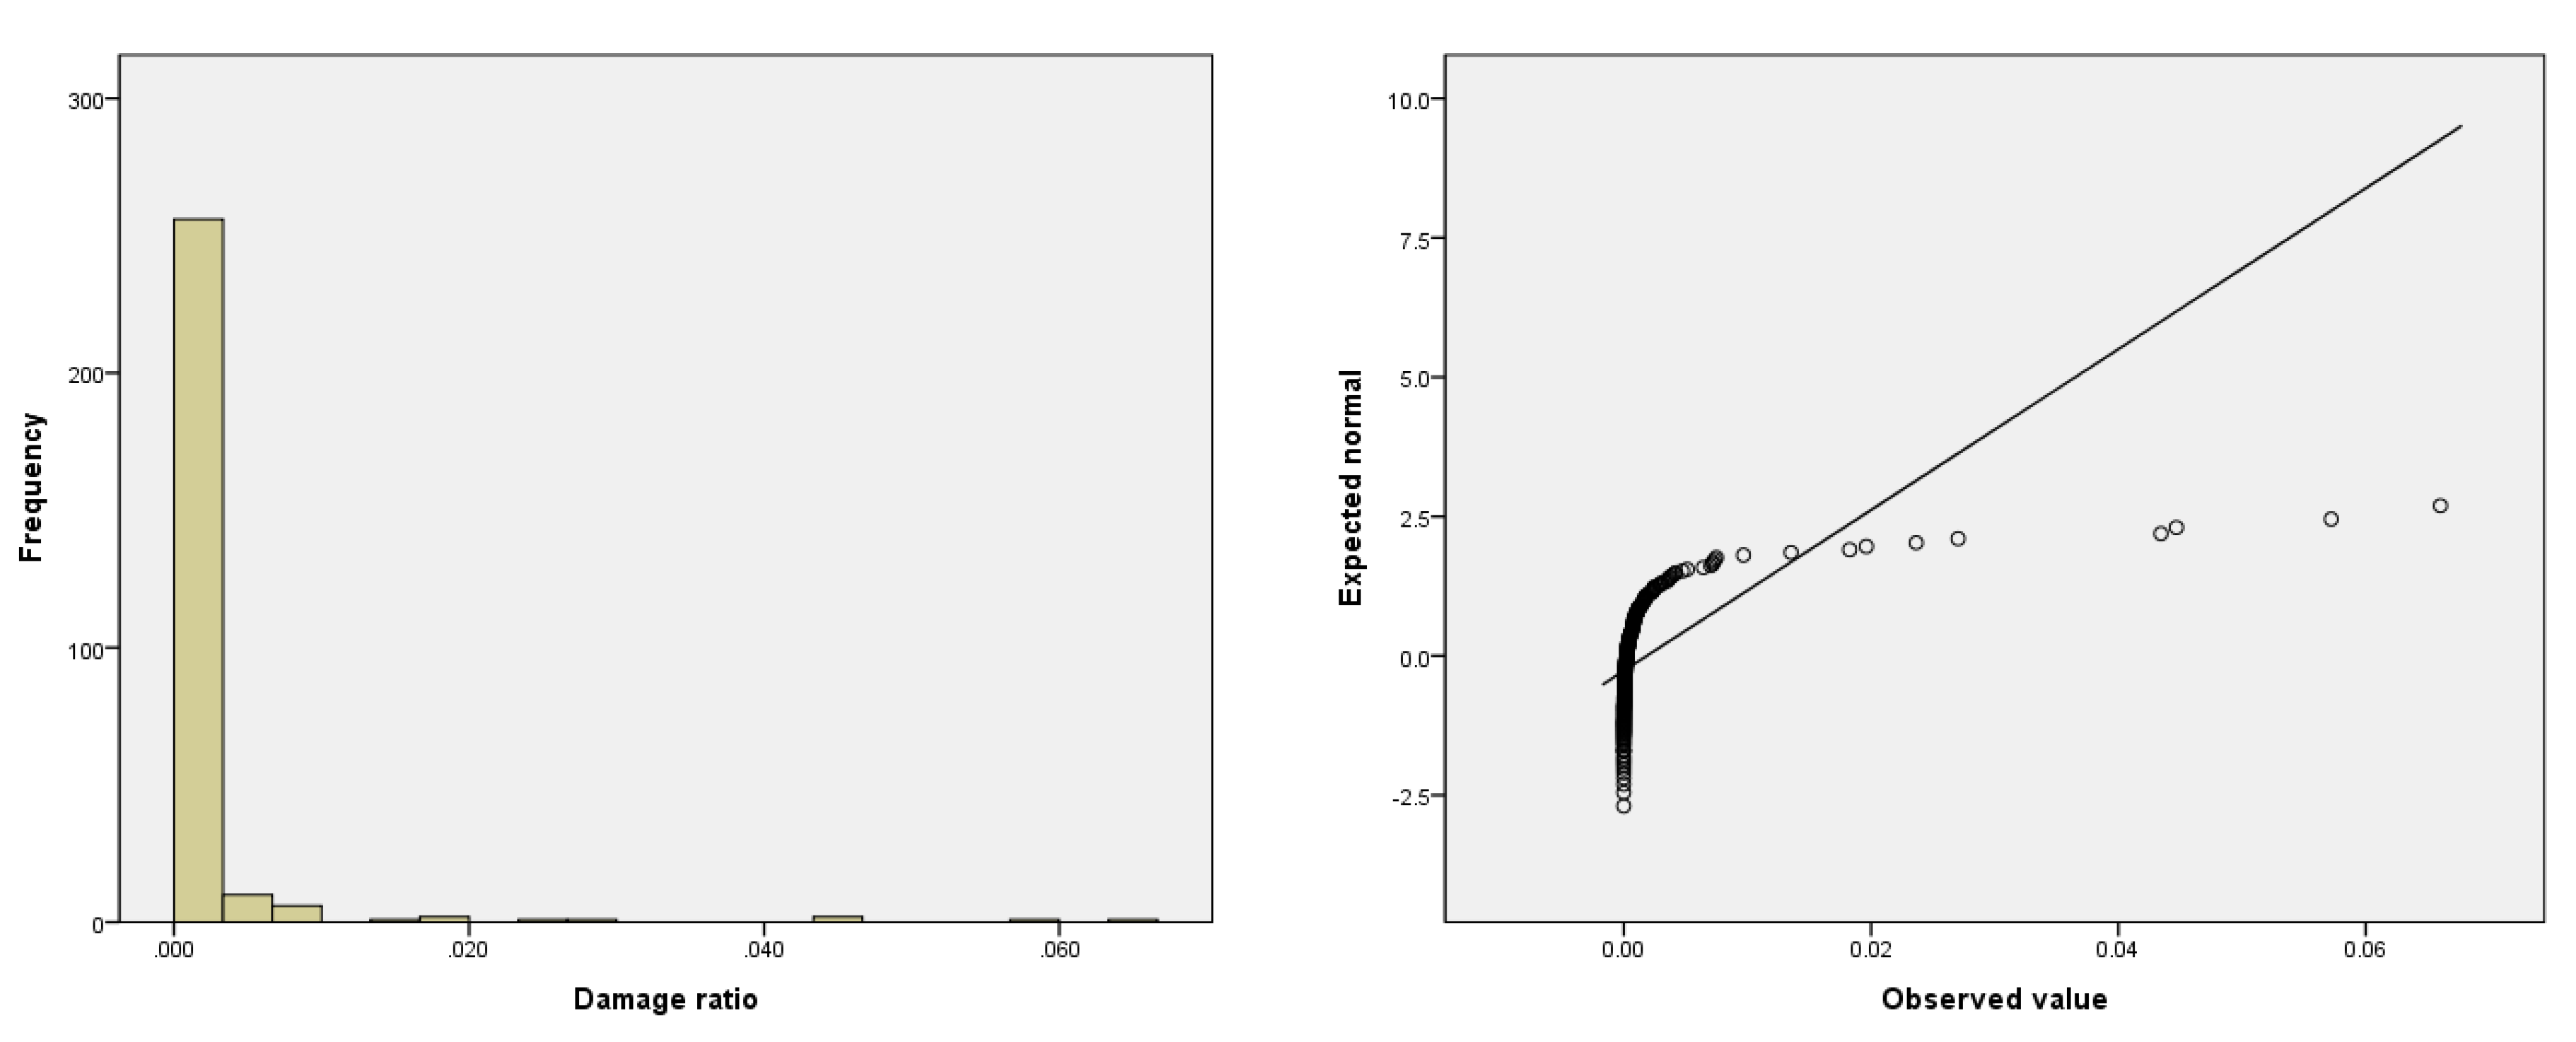
| Initial Damage Ratio | 0.259 | 281 | 0.000 |
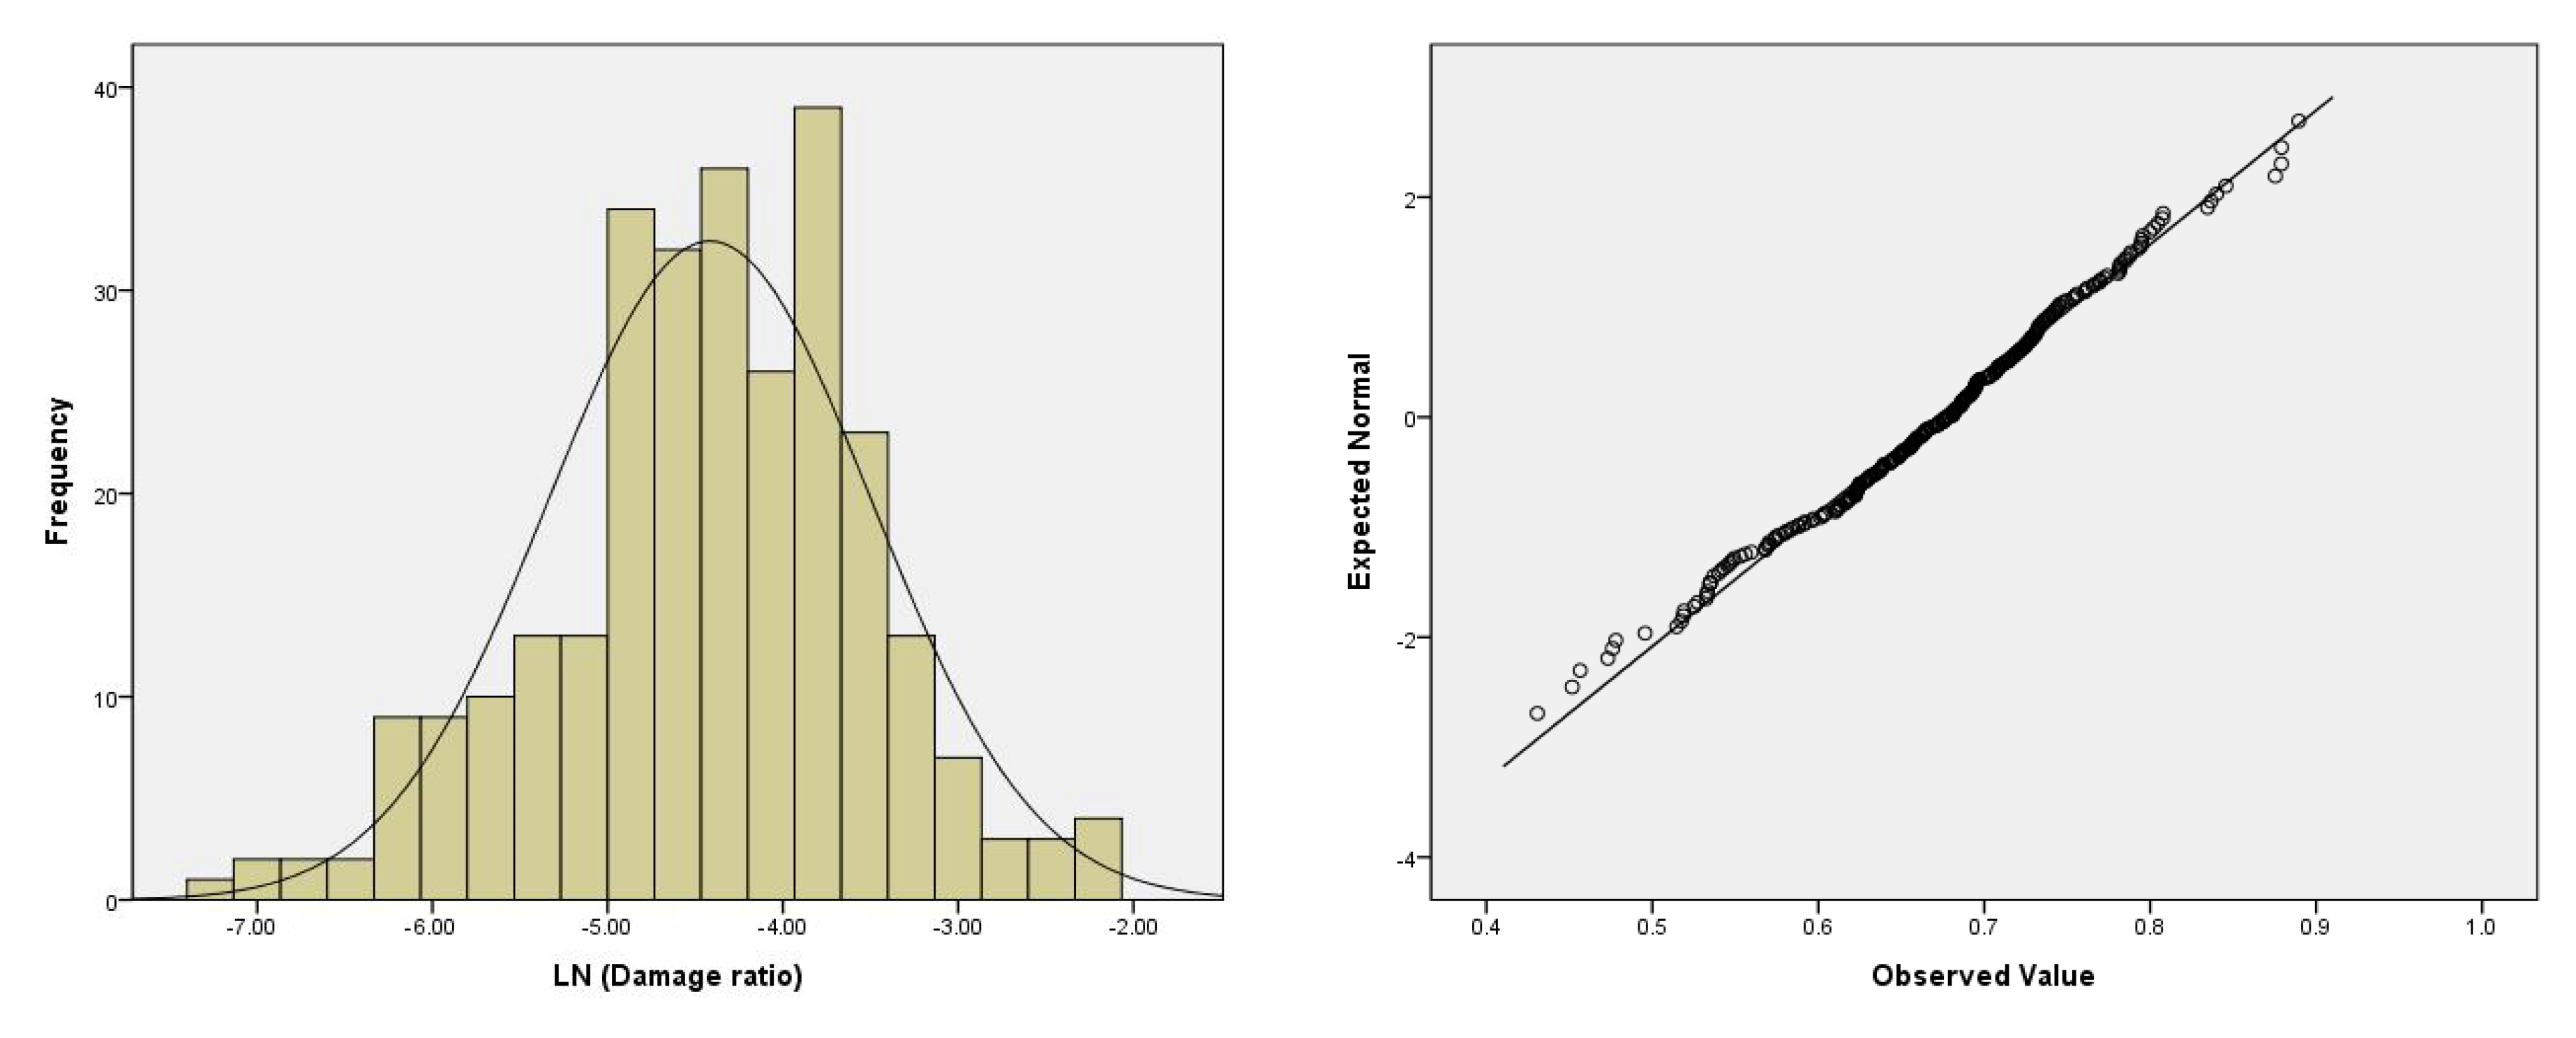
| Natural Log-transformed Damage Ratio | 0.989 | 241 | 0.256 |
| Category | N | Mean | SD |
|---|---|---|---|
| Dependent Variable | |||
| Damage ratio | 277 | 0.002 | 0.007 |
| Independent Variables | |||
| High winds | 277 | 4.769 | 0.549 |
| Flooding | 277 | 1.487 | 0.501 |
| Rainfall | 277 | 1.935 | 1.092 |
| Sum of Squares | df | Mean Square | F | Sig. | ||
|---|---|---|---|---|---|---|
| Regression | 364.69 | 4 | 92.673 | 31.366 | 0.007 | 0.317 |
| Residual | 790.63 | 272 | 2.907 | |||
| Total | 1150.32 | 276 | ||||
| Variable | Non-Standardized Coefficient | Standardized Coefficient | Significance Probability (p-Value) | Collinearity (VIF) |
|---|---|---|---|---|
| High winds | 0.649 | 0.163 | 0.007 * | 1.017 |
| Rainfall | 0.180 | 0.505 | 0.309 | 1.010 |
| Flooding | 0.094 | 0.051 | 0.292 | 1.011 |
© 2020 by the authors. Licensee MDPI, Basel, Switzerland. This article is an open access article distributed under the terms and conditions of the Creative Commons Attribution (CC BY) license (http://creativecommons.org/licenses/by/4.0/).
Share and Cite
Yum, S.-G.; Ahn, S.; Bae, J.; Kim, J.-M. Assessing the Risk of Natural Disaster-Induced Losses to Tunnel-Construction Projects Using Empirical Financial-Loss Data from South Korea. Sustainability 2020, 12, 8026. https://doi.org/10.3390/su12198026
Yum S-G, Ahn S, Bae J, Kim J-M. Assessing the Risk of Natural Disaster-Induced Losses to Tunnel-Construction Projects Using Empirical Financial-Loss Data from South Korea. Sustainability. 2020; 12(19):8026. https://doi.org/10.3390/su12198026
Chicago/Turabian StyleYum, Sang-Guk, Sungjin Ahn, Junseo Bae, and Ji-Myong Kim. 2020. "Assessing the Risk of Natural Disaster-Induced Losses to Tunnel-Construction Projects Using Empirical Financial-Loss Data from South Korea" Sustainability 12, no. 19: 8026. https://doi.org/10.3390/su12198026
APA StyleYum, S.-G., Ahn, S., Bae, J., & Kim, J.-M. (2020). Assessing the Risk of Natural Disaster-Induced Losses to Tunnel-Construction Projects Using Empirical Financial-Loss Data from South Korea. Sustainability, 12(19), 8026. https://doi.org/10.3390/su12198026