Abstract
An important condition for the performance sustainability of organizations, in the public and state sector, is the maintenance and improvement of the employee motivation policy model. Motivation for work has a significant impact on the success of modern organizations; the impact is multidimensional and complex, and it has been confirmed empirically. Motivation is influenced by numerous factors, of different influence and hierarchy, which depend on socio-economic conditions and cultural determinants, but also on the characteristics of employees, and it is necessary to constantly monitor them. The paper presents a sustainable model of employee motivation in public administration and the results of research on the hierarchy and the impact of motivation factors on employees of different demographic characteristics. The research was conducted by an anonymous survey of 2128 respondents (1576 employees in the state administration and 552 persons employed in the Republic of Serbia outside the state administration), in the period March–June 2020. The questionnaire developed for this research has 16 questions on motivating factors with a scale with a high level of internal consistency. Using one-factor analysis of variance (ANOVA), tests of subsequent comparisons, and t-test, statistically significant differences are determined for the influence of motivational factors on respondents of different levels of education, age, role in organization, gender, and family status—also, the magnitude of influence ranges from small to large. The influence of motivational factors is greater for older people, for people with a higher level of education, for managers in relation to workers, for women in relation to men, as well as for persons in marriage in relation to persons out of wedlock. By applying multi-criteria analysis, the factors are ranked: the amount of salary and good interpersonal relations are at the top, while criticism and information about work are in the last positions. As a factor that negatively affects motivation, low wages stands out. The difference in the motivation of state administration members was determined by comparing the results of motivational factors’ influence with the appropriate sample of employees outside the state administration. Differences were registered for 15 out of 16 factors (only for the factor high wages, there is no difference), and the magnitude of the impact is medium and small.
1. Introduction
Motivation and cognition of motivated behavior are extremely complex because people’s behavior is not always consistent or rational and the level of motivation varies not only between individuals but also within one individual at different times. Motivation is one of the most frequently researched topics of people’s behavior in organizations [1]. Individuals differ not only by the level of motivation—how motivated they are—but also by the orientation of that motivation, what motivates them [2]. Interest in motivation and the factors that guide it is as old as the human race and arises from three reasons: improving productivity, efficiency, and creativity; improving the quality of working life in organizations; and strengthening competitiveness and success [3]. In addition, motivation management creates corporate resources that cannot be copied and help develop a sustainable competitive advantage. Both extrinsic and intrinsic motivation are necessary for this development, and in a knowledge-based society, the focus will be on tasks that require employees to identify with and enjoy their work [4] (p. 284). Motivation for work can be managed, according to Mihailović [5]; it can be challenged and encouraged and the model of managing motivated behavior can be established in the organization. Knowledge of motivational factors is the key to building a system for managing motivated behavior.
The aim of this paper is to determine the hierarchy of motivational factors and formulate a sustainable model of employee motivation policy in public administration, based on the assumptions of the theory of needs and the theory of expectations. The sustainable model assumes that the formulation and changes of motivation policy are based on the results of continuous research, whereby both the research and the instruments that will be applied will be variable, adapt to environmental conditions, and register significant changes in motivation research results. Significant changes in employee motivation will be monitored in relation to the results of previous research and changes in the environment through the application of appropriate analytical techniques and procedures (SWOT, PEST, etc.). The paper will also present the differences in the hierarchy of motivational factors for employees of different demographic characteristics, as well as differences in the impact of certain factors on employees of different characteristics, which is a condition for applying an individual approach to employee motivation and adjustment to needs, interests, and preferences.
Given that virtually all motivational theories have been developed in the USA or Western Europe, where numerous studies have been conducted, and that there are pronounced cultural differences, there is a need to determine the influence of motivational factors in their own cultural environment, current time frame, and specific organizational environment—public administration. Bearing in mind that extensive research on the motivation of public administration employees has not been conducted in Serbia, there was a need to conduct the research and compare the results with previous research and assumed results, which can provide a basis for formulating a sustainable motivation policy.
The paper is organized as follows: after the introduction, the second part presents a literature review, the third part presents the model and procedure of the study, the fourth part presents the results, the fifth part offers a discussion and comparison of the results with previous research, and the sixth part lists the most significant findings and contributions of the study.
2. Literature Review
Numerous authors from the fields of organizational behavior, management, and psychology have defined the concept of motivation, and a brief and concise definition was given by Pinder. According to him, motivation for work is a set of forces inside and outside the personality that initiate work and determine its form, direction, intensity, and duration [6] (p. 11). The three key elements of motivation that are observed are intensity, direction, and persistence. Intensity refers to the effort invested, but high intensity will lead to favorable work results only if the efforts are channeled in a direction that benefits the organization, the persistence dimension measures how long a person can sustain the effort because motivated individuals work long enough to achieve the goal [1].
Due to the importance of motivation, a large number of researchers have tried to unveil the secrets of motivation and numerous theories have been developed. Still, there is no universally accepted way of presenting motivational theories. According to Armstrong [7], three main areas of motivational theories are instrumentality, content, and process. Bahtijarević-Šiber and Mihailović classify the most important theories of motivation into two groups: theories of needs and theories of processes [3,8], while Robbins [1] classifies motivational theories in to need theory, self-determination theory and cognitive evaluation theory, goal settings theory, reinforcement theory, equity theory (theory of organizational justice), and expectancy theory. Pinder, on the other hand [9], considers motivation through a motivational framework by analyzing needs, traits, values, context, person–context fit, cognition, and affect/emotion.
Continuous and long-term interest in motivation by a wide range of researchers is completely understandable because discovering motivational mechanisms and knowledge about factors and mechanisms that are getting employees to work has numerous benefits (reduced fluctuation and absenteeism, positive impact on job satisfaction, positive impact on employees’ health). The significance of this research is primarily reflected in the impact of motivation on work performance. Kovach [10] believes that organizations that know what motivates their employees to work are in a better position to stimulate them to work better and improve organizational performance, while Spitzer [11] states that different people respond to different incentives and advises that before investing in reward and recognition systems, organizations should survey their employees and allow employees to choose the specific reward that suits them best. The research that was initiated and realized on the assumptions based on need theories focused on the question “what motivates the worker” and tried to determine the hierarchy of motivational factors (needs). Mihailović [5] (p. 48) defines motivational factors as a hypothetical relationship between many individual, social, and organizational aspects of work and workers with manifestations of motivated behavior.
In addition to the hierarchy of factors, in his research, Kovach analyzed the responses of employees of different characteristics and found differences in the influence of factors depending on gender, age, income level, type of work, and organizational level [10] (p. 60). Additionally, Kovach determined significant differences in the ranking of factors by workers and managers (managers answered the question of what motivates workers). Similar studies have been conducted several times in the United States [12], China [13], Russia [14], Malaysia [15,16], Greece [17,18], Pakistan [19], and the Nordic countries [20]. Motivation in Serbia and surrounding countries has been investigated several times in extensive research conducted by Jezernik in 1960 and 1962, Možina in 1969, Jušić in 1971, and Mihailović in 1988 [5] (pp. 50–52). Moreover, a certain amount of research was realized on appropriate samples, of which the characteristic research of Kujović in 1989 and Mijačika in 1989 stand out [21,22], as well as recent smaller research in Serbia [23] and in Montenegro [24].
The question of the attitude towards money, that is to say, the dilemma of whether money is a motivating factor or not, or under what conditions it can be used as a motivator, is very important in the development of motivational policies. Despite the fact that people are different and have different needs and work values [13], it is noticed that the amount of salary stands out as the most important motivating factor in more research in different time periods and cultures [12,13,17,18,19,25,26,27,28,29,30,31,32], also in Serbia and in the surrounding countries of Croatia, Slovenia, Bosnia and Herzegovina, and Montenegro [5,21,22,23,24]. However, some authors critically consider the impact of money and consider money only as a “hygienic” factor, i.e., that money is not a motivator or not the most important one [33,34,35,36,37,38,39]. It provides motivation only under the right conditions, i.e., a poorly designed or applied system of monetary compensation demotivates [7]; in other words, money for workers who are on the edge of existence is only a stimulus, but not a motivation [40]. A significant number of studies show that money reduces intrinsic motivation [4,34,35,41,42,43], that its influence depends on the type of employees [4], or that it will positively affect the materialist-oriented type of person (“income maximizers”). In addition, monetary rewards decrease performance in executing complex tasks in order to reach difficult goals [44] (p. 264). Furthermore, it is noticed that when people are paid for work, they feel that they want to work less; that is, they work only because they have an obligation [1] (p. 210).
The importance of motivation is also reflected in the influence on performance sustainability. The impact of motivation on performance and sustainability of performance (performance sustainability implies a model of continuous changes and improvements in motivational policies and procedures to preserve or improve the level of employee motivation that ensures maintenance or improvement of existing performance levels) was identified in several studies presented below.
The positive influence on performance by motivation was found in some models of motivation [45,46] such as the social identity model for work motivation and performance [47], as well as in the self-determination theory model, according to which autonomous motivation affects performance [48]. In addition, Lord, in his study [49], concludes that the successful application of motivators improves job satisfaction, which results in increased productivity. Mani finds that the inability to encourage skilled workers leads to undermining the system’s effectiveness [50]. The influence of motivation on performance has been found both in previous research [51,52,53,54,55] and in several experimental studies in the last 10 years. Significant impact was found for feedback [56] as well as changes in the payment scheme, when the fixed fee was changed for a fee per piece, the effect increased and vice versa—when the payment per piece was changed for a fixed fee, the effect decreased [57,58]. The studies also found a positive impact of involvement as well as autonomy on efficiency. Workers who had more autonomy at work achieved higher performance compared to workers with less autonomy [59], and involvement (measured through empowerment, teamwork, and development capacity) also led to a higher level of organizational effectiveness [60]. Zhang, in a study conducted in China [61], in addition to finding that motivation has a positive effect on performance, also finds well-internalized extrinsic motivation was more important than intrinsic motivation in predicting work performance and that even small increases in external regulation could lead to an increase in work performance. There are also findings that intrinsic motivation has a positive impact on performance when leadership is socially oriented, which gives us options to improve performance without monetary incentives [62].This is especially interesting for sectors where salary changes are not always under the direct responsibility of management—as is the case in public (state) administration. Igalens [63], in France, finds that under certain conditions “exempt” employees (employees who are not paid for overtime: professionals, administrators, and executives) can be motivated by individualized compensation schemes, and that motivation affects their efforts. Jenkins meta-analyzes 39 studies [64] and underscores that there is a positive link between financial incentives and performance, and that there is no evidence that they destroy intrinsic motivation.
Research around the world over the last 10 years has confirmed the existence of a direct link and a positive impact of motivation on performance in Australia [65], Pakistan [66], Denmark [67], Italy [68], Ghana [69], and Indonesia [70]. In Greece, Manolopoulos [18] finds that there is a positive influence of intrinsic motivation factors of public sector employees on performance. Hong, in Taiwan, finds that benefits have a significant impact on motivation and performance [54]. Wright [71] finds that motivation affects performance but also it has a moderating role in influencing the situation and ability to perform. The influence of motivation on performance was also determined by Mihailović [5] in Serbia, while Armstrong states that motivational strategies aim to create a work environment and develop policies and practices that will ensure a higher level of employee performance [7] (p. 180).
The assumption, in the setting of the motivation policy model, that there are differences that depend on the characteristics of the respondents for the influence of motivational factors is based both on experience and on the results of previous research [5,10,12,16,18,19,20,22,72,73,74,75].
Additionally, Maslow [76] (p. 82) believes that people are much more similar than it seems at first glance and that their goals are much more universal than the paths leading to those goals, because the paths to achieving goals are strongly influenced by society. Hofstede [77] (p. 16) also believes that human characteristics are universal, that all societies have the same problems, but also different solutions. Bahtijarević-Šiber [3] (p. 709) recommends that an individual approach should be developed in motivating employees and that the motivation strategy should be adjusted to the needs, interests, and preferences of employees. One should not disregard the development, changing needs, complexity, and dynamism of motivation. The premise of effective influence on motivation is to constantly analyze and monitor the needs, aspirations, and preferences of employees.
The specificity of public administration as a working environment is noticeable, and the specificity in the hierarchy of motivational factors of civil servants is confirmed by the results of several studies which found differences in motivation and job satisfaction of public and private sector employees in different times and cultural frameworks in Estonia [78], Greece [18], Australia [79], Italy [80], the Czech Republic [81], Taiwan [54], Denmark [72], the USA [28], and Croatia [82]. The results of the research indicate that there are differences among employees in the public and private sectors in their level of motivation [18,72], the motivational potential of jobs [79], and job satisfaction [78,80,81,82], as well as the hierarchy of motivators [28,54,72,78]. On the other hand, Jurgensen [83] in his extensive longitudinal analysis (for the period from 1949 to 1975) finds no significant differences in job satisfaction, while Wright [71] believes that there is not enough evidence to conclude that the differences in the working environment in the private and public sector are such that they have a great influence on motivation—he finds that the basic problem is to create a valid sample.
Different countries have different backgrounds and contextual influences, so environmental and contextual influences of Serbia may influence the results and they may be different from other countries. According to Hofstede [84], the environment and national culture of the Republic of Serbia have the following characteristics: high power distance, high avoidance of uncertainty, high degree of collectivism, dominant female values, and, in terms of long-term-short-term orientation, Serbia is in the middle of surveyed countries (Appendix Table A1).
As stated by Janićijević, in relation to the dominant cultural patterns in the world, Serbian national culture is closest in its characteristics to Latin American countries (Chile, Mexico, Venezuela, Colombia) and, to a lesser extent, Latin European countries (France, Italy, Spain). With Latin European and Latin American countries Serbian culture shares a high power distance and uncertainty avoidance but, unlike Latin European individualistic cultures, Serbian national culture is a collectivist one. Serbian culture has female values in opposition to Latin American cultures which value masculinity more. In terms of female values, Serbian culture is similar to Scandinavia, but differs in all other dimensions. Serbian culture shares a high uncertainty avoidance with German national cultures, but differs in a high power distance and collectivism. Ultimately, Serbian culture differs from Anglo-Saxon culture in all dimensions [85] (p. 54).
A section from the literature review used to identify and set aside motivational factors for the list of motivational factors that were used in our research is shown in Table 1.

Table 1.
Motivation factors in different research.
The list of factors is adjusted to the environment and time, whereby factors with ideological connotation (self-management), those that are not current in the current time frame (housing), and factors that are not in widespread use in Serbia, especially in government services and the public sector (profit sharing and various types of benefits) were excluded.
Based on the analyzed literature, we set three hypotheses:
Hypothesis 1.
There are significant differences in the influence of motivational factors on employees of different demographic characteristics (gender, age, education, marital status, position).
Hypothesis 2.
Money is not an important motivational factor for persons employed in public administration.
Hypothesis 3.
There are significant differences in the influence of motivational factors on employees in the state administration in relation to other employees in the Republic of Serbia.
3. Materials and Methods
Motivation research was realized in five steps and it was designed as a sustainable, continuous model. The model is shown in Figure 1.
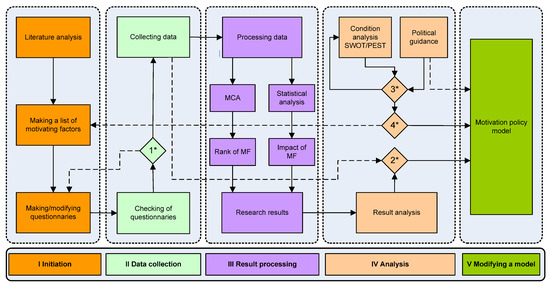
Figure 1.
The concept of developing a framework for motivation research.
3.1. Initiation
The initiation stage involved the analysis of literature and conducted research in order to make a list of important motivating factors while adapting to cultural and socio-economic conditions. In this step, the relevant literature was analyzed—realized research in the world [10,12,13,16,17,18,26,27,28,29,32,37,39,73,75,86,87,88,89] and also previous research in Serbia and surrounding and neighboring countries [5,21,22,90]. The research questionnaire was made by entering the mentioned 16 factors whose influence on motivation the respondents evaluated using a five-point Likert scale (offered answers about the degree of influence: no influence, little, moderately, considerably, greatly). The questionnaire also has a section related to the ranking of motivational factors (after assessing the impact of 16 factors on motivation, respondents ranked only five factors that have the highest impact on motivation, assigning them ranks from 1 to 5) and factors that negatively affect motivation. There is also the part that collects data on the characteristics of the respondents.
3.2. Data Collection
Data collection was realized in two steps, by conducting a preliminary study on a suitable sample (135 respondents), and then by collecting data on a suitable sample of 2128 persons (1576 employees in the security sector of state administration and a control sample of 552 respondents—employees in the Republic of Serbia; detailed sample structure is shown in Table 2). Based on the pre-research, the obtained results (step 1*: if α < 0.8 or response rate <90%; then data collection; else refinement of the questionnaire) and usability of the questionnaire (internal reliability of the scale, number/percentage of unusable/incomplete questionnaires, observed uncertainties that respondents had) were assessed and, if necessary, the instruments were refined, and then the research was realized.
Table 2.
Demographic variables of the respondents.
3.3. Result Processing
Procedures and techniques of statistical processing and multicriteria analysis were applied. Statistical processing of the collected data was performed by using the IBM SPSS Statistic 23 program (descriptive statistics, analysis of variance, normality tests, t-test, and scale reliability). Significance of differences in attitudes about the influence of motivational factors on motivation was determined by analysis of variance and subsequent tests (post hoc tests—Tukey HSD) for multiple comparisons (for categorical variables with three or more subpopulations) and the application of two-tailed t-test, for independent samples (for categorical variables with two subpopulations).
To estimate the effect size, we used the eta square (η2) using Equation (1). Eta square represents the proportion of variance in the variable explained by the independent variable and ranges between 0 and 1, with the influence being small (η2 = 0.01), medium (η2 = 0.06), and large (η2 = 0.138) [91] (p. 24),
N1 and N2 are the sizes of groups, and t is the value of two-tailed t-test.
The ranking of motivational factors was realized with the method of arithmetic averaging [92] by applying the Equations (2) and (3), then by normalizing the sum of the ranks and with conversion to aggregated weights,
3.4. Analysis
Analysis of results and determination of differences in subpopulations and analysis of changes in the environment was done with SWOT/PEST analysis.
Based on the research results (step 2*), policy changes can be formulated in the motivation model. In the following research, if there were no significant differences in relation to the results of the previous research, no corrections of the motivation model would be made and the research would be realized again in the next period of motivation monitoring from step II. In case of significant differences, the necessary changes in motivation policies should be formulated in order to adjust the model.
If there were no significant changes in the results (step 3*) of the environment analysis or conditions that affect the functioning of the organization by using appropriate analytical techniques—SWOT, PEST, etc. (for more on how to implement SWOT/PEST analysis, see references [93,94,95,96,97,98])—the analysis would be evaluated in the next assessment period, and if there were changes, the next step would be taken (step 4*). Political guidelines in case of rapid changes have a direct impact on changes in motivation models, and in case of regular situations and minor changes, they are taken into account in step 3* and have an impact on the analysis of the situation on changes in the motivation model or on changes in the list of factors for examining motivation.
Significant and pronounced changes (if they exist in step 4*) require direct changes in the motivation model (also in the instruments) and changes of smaller scopes and significance require changes in the data collection instruments (forming new lists of factors).
3.5. Modifying a Model
Based on the previous steps and the obtained results, changes can be realized and the motivation model upgraded by changes and improvements in motivation policies (changes in the amount and type of incentives, changes in the organization of work, changes in the structure of the organization, etc.).
4. Results
The study was conducted in the period 2018–2020. A list of 16 factors was made by analyzing the literature: amount of responsibility, prizes and awards, working time, good working conditions, quality of supervision and leadership, feeling of being involved or in on things, criticism, interesting work, promotion, possibility of development and improvement, job security, good interpersonal relationships, high wages, challenging job and sense of achievement, decision-making influence, and work/job recognition (Table 1, Table A7).
The pre-research which checked the scale-questionnaire in which the mentioned factors were entered was realized in October 2018 on a suitable sample of 135 employees in the state administration. It was determined that the questionnaire is clear to all respondents, and the internal consistency (Cronbach’s alpha) is at the required level, α = 0.877.
The research was realized during 2020 on a suitable sample of 1576 employees in the state administration. The sample included 7% of all employees in the security sector of state administration. In relation to the structure of employees, the sample has minimal deviations, also in relation to age categories. Deviation in relation to gender is5% (the number of female respondents in the sample is higher than their representation in the population). The research was conducted in 8 cities, in 20 different locations, and in 27 different organizational units. The survey at all locations was conducted by the same researcher, thus excluding the negative impact or approach of the interviewers on the survey results. The detailed structure by gender, age category, education, marital status, and role in the organization is shown in Table 2 (N1). The survey of a control sample with 552 people was conducted through the internet platform soscisurvey.de; respondents accessed the platform via a link which was distributed by the “snowball” method (Table 2, N2).
After processing the data, the values of descriptive statistics for the sample were determined (Table 3), as well as the rank for 16 factors. The metric characteristics of the scale—internal consistency (Cronbach’s alpha)—were checked and are at a high level, αN1 = 0.838 (αN2 = 0.895 for respondents who filled out the survey via the internet platform), which is fully within the recommendations, since Nunnally recommends a minimum level of 0.8 and 0.9 as excellent for basic and applied research [99].
Table 3.
Descriptive statistics and rank motivators.
Using one-way analysis of variance in the SPSS program (one-way ANOVA procedure), the results of independent categorical variables with three or more subpopulations were compared: age and education. Significant differences in arithmetic mean values in subpopulations were determined, after which tests of subsequent comparisons were applied (post hoc—Tukey HSD).
Tests confirm statistically significant differences for different age groups in the assessment of the impact on motivation for nine factors, with seven factors having a greater impact on older people, and, as expected, two developmental factors have a greater impact on younger employees (promotion, possibility of development and improvement). The most significant differences were found between groups younger than 25 years old and older than 45 years old for amount of responsibility (η2 = 0.041) and decision-making influence (η2 = 0.050) and between groups from 26 to 35 years old and older than 45 years old for amount of responsibility (η2 = 0.047) (Table 4).
Table 4.
Age—multiple comparisons.
Numerous differences have been identified in relation to the education level. As the level of education increases, the influence of motivational factors grows (Table 5). Differences in the influence of motivational factors on respondents of different levels of education were found for all analyzed factors except for criticism. The greater the difference in the education level, the greater the difference in the influence of motivational factors. Differences for the group of respondents whose highest level of education was primary school (E) are not shown because the group has only six respondents. Compared to persons with secondary education (high school diploma—H), higher impact on motivation has nine factors on persons with a bachelor’s degree (college diploma—C) and with a master’s degree (MA), while 12 factors have higher impact son persons with a doctoral degree (PhD). There were also differences in the motivation factors’ impacts on persons with a university degree (C) in relation to persons with a master’s degree (MA) for three factors and in relation to persons with a doctorate (PhD) for 12 factors. Differences in the impact on persons with a master’s degree and a doctorate were determined for four factors. The effect sizes for the identified differences (η2) range from small to large. The most significant differences were found between the groups with high school (H) and PhD (PhD) educations for the factors quality of supervision and leadership (η2 = 0.110), decision-making influence (η2 = 0.134), and promotion (η2 = 0.108). The group with a bachelor’s(C) vs. a doctorate (PhD) differed for the factors quality of supervision and leadership (η2 = 0.114) and decision-making influence (η2 = 0.118), as well as the groups with master’s degree (MA) and doctorate (PhD) for the factors decision-making influence (η2 = 0.108) and feeling of being involved or in on things (η2 = 0.104).
Table 5.
Education level—multiple comparisons.
Differences in relation to the variable position were determined for 12 factors, with a greater impact on the manager than on the non-manager positions, and the differences in the impact are small. For the factor decision-making influence, the magnitude of the impact (η2 = 0.033) is close to middle levels (Table 6).
Table 6.
Position (t-test).
Statistically significant differences in relation to the variable gender were found for six factors, to men, the more important factor was good interpersonal relationships while women found feeling of being involved or in on things, good working condition, job security, possibility of development and improvement, and prizes and awards significantly more important. Differences in impact are minimal (Table 7).
Table 7.
Gender (t-test).
Differences in relation to the variable marital status were determined for eight factors. Married people had greater influence from interesting work, quality of supervision and leadership, amount of responsibility, decision-making influence, job security, and high wages. Out-of-wedlock people were more influenced by factors related to development and promotion (promotion, possibility of development and improvement), and the differences in influence are small (Table 8).
Table 8.
Marital status (t-test).
Applying Equations (2) and (3) based on the ranking of factors (respondents after assessing the impact of 16 factors on motivation ranked only 5 factors that have the highest impact on motivation), the rank of factors was obtained and shown by subpopulations (Table A2), also normalized values are shown (Table A3 and Figure A1).
The ranking results show that the motivating factor with the greatest influence is high wages (rank 1; 0.139);in the second position is the factor good interpersonal relationships (0.128).The difference between them and other factors is pronounced (job security, rank 3—0.087; working time, rank 4—0.082; and quality of supervision and leadership, rank 5—0.079). It is evident that the differences in values for other motivational factors ranked from 6–14 positions are not large (in the range 0.068 to 0.030), and that, in the end, there are feeling of being involved or in on things (rank 15; 0.017) and criticism (rank 15; 0.011) whose values stand out as significantly lower than other motivational factors.
The most pronounced deviations from the established ranks are for job security (3), which is ranked by women in the 1st position (0.119) and men in5th (0.082). Managers rank this factor in the 8th position (0.067), and non-managers in the 3rd (0.094). The importance of this factor decreases with the growth of education, so persons with a master’s degree ranked it in the 9th position (0.058), and persons with a doctorate in the 12th position (0.035). Quality of supervision and leadership are ranked lower by unmarried people and people under 25 than by married and people from older age groups. The possibility of development and improvement is much more important for younger people (0.091 for people under 25) than for older people (0.026—older than 45). There is also a difference in the significance of achievement (for persons with a high school degree 0.049 and for PhD −0.103).
The rank of the factors that negatively affect motivation was also determined by applying Equations (2) and (3) based on the ranking of the offered five factors (respondents ranked the negative influence on the motivation of five factors). The ranking results confirm the importance of salary because the respondents ranked low wages as the most significant demotivating factor (the most significant factor in 12 out of 15 subpopulations). The biggest differences were found in the group of managers and non-managers. The ranking of factors that negatively affect motivation is shown in tables and graphs by subpopulations (Table A4 and Table A5 and Figure A2).
The existence of specificity in the influence of motivational factors of employees in the state administration organizational unit from the security sector, in relation to the general population control sample, was determined by t-test of aggregate independent samples (Table 9). Differences in the influences of motivational factors were determined for 15 factors (for all examined factors except high wages), and the effect sizes of the influences range from small to medium. The most significant differences were found for the factors interesting work (η2 = 0.035), feeling of being involved or in on things (η2 = 0.054), and good working conditions (η2 = 0.040).
Table 9.
Differences in the influences of motivational factors on the sample and the control sample (t-test).
It was found that the factors interesting work (η2 = 0.055) and good working condition (η2 = 0.030) were more significant to women in the control sample than to women employed in the surveyed state administration organization, and there were differences in influence in relation to the education level in the manner that feeling of being involved or in on things (η2 = 0.067) and good working condition (η2 = 0.061) had a greater influence on persons in the control sample with a university degree. Interesting work (η2 = 0.052) also had a greater influence on persons with a master’s degree in the control sample. The most significant differences were found for persons of PhD level—for the factors quality of supervision and leadership (η2 = 0.182) and decision-making influence (η2 = 0.115) and the impact was greater on persons employed in public administration (Table A6).
5. Discussions
The research determined the hierarchy of motivational factors for the work of employees in the security sector of state administration (Table 3, Table A2, Table A3, Figure A1), and established the existence of differences in the influence of motivational factors on different subpopulations of the sample.
The obtained results indicate the importance of money and that employees’ incomes are not at the required level and are not in line with the basic principles of the motivational theory of the hierarchy of needs [76], according to which needs are hierarchically organized, and unmet needs of lower levels dominate influencing motivation. On the other hand, the high rank of good interpersonal relationships indicates that this factor is internalized at the level of autonomous motivation—in accordance with the theory of self-determination [48,100,101].
The following had greater impacts on older employees: interesting work, quality of supervision and leadership, amount of responsibility, decision-making influence, feeling of being involved or in on things, job security, and challenging job and sense of achievement. On younger employees, higher influence was exerted by the factors related to promotion and development: promotion and possibility of development and improvement. The effect size of the determined differences is mostly small and ranges up to the limits of the middle level (η2 = 0.008 to 0.050). Research in the United States had similar results [10], where the importance of interesting work increases with age, and the importance of advancement and personal development decreases with age. In the Scandinavian countries, motivation and intrinsic motivation increase with age [20], and the results of research in several countries [73] find that younger people are more motivated with the possibility for personal development and improvement. In Russia, the opportunity for the development of abilities and skills and advancement is more important for younger people, while for older people, job security and colleagues’ respect are more important [29]. In Japan, job security has also been found to be more important to older workers [88]. In Greece, as the manager’s age increases, so does his motivation [17].
The influence of motivational factors grows with the increase of education level for all factors, and the magnitude of the influence of the determined differences is the greatest for factors decision-making influence and quality of supervision and leadership. As the level of education increases, the influence of motivational factors also increases, nine factors (interesting work, quality of supervision and leadership, amount of responsibility, decision-making influence, challenging job and sense of achievement, promotion, possibility of development and improvement, work/job recognition, working time) have a greater impact on persons with a university degree and master’s degree (C and MA) compared to persons with high school only (H). Moreover, 12 factors (interesting work, quality of supervision and leadership, amount of responsibility, decision-making influence, feeling of being involved or in on things, good working condition, challenging job and sense of achievement, promotion, possibility of development and improvement, prices and awards, high wages, work/job recognition) have a greater impact on doctors of science (PhD) in relation to respondents with a bachelor’s degree (C). Furthermore, there are also differences between the respondents with PhD degrees and Master of Science degrees, where four factors (quality of supervision and leadership, decision-making influence, feeling of being involved or in on things, challenging job and sense of achievement) have a greater influence on PhDs. The effect size is in the range from small to large (η2 = 0.007 to 0.134). Similar results have been found in China [13], as well as in the Scandinavian countries [20] and Greece [18], where people with a higher level of education are more intrinsically motivated. In Russia, as well, college-educated employees value praise and recognition more than employees with high school only [102]. In Malaysia, also, working conditions are more important for people with a doctoral degree than for people with a university degree and a master’s degree [75], as well as in Bosnia and Herzegovina [22], where people with a higher level of training are more influenced by a good managerial attitude.
The role in the organization (position) influence is different for 12 factors; managers are more motivated than non-managers by all 12 factors (interesting work, quality of supervision and leadership, good interpersonal relationship, decision-making influence, good working condition, challenging job and sense of achievement, promotion, possibility of development and improvement, high wages, work/job recognition, working time), and the size of the influence is the greatest for decision-making influence, and it is bigger for the managers in relation to the non-managers—the size of the influence is small (η2 = 0.006 to 0.033). Differences in the influence of motivation factors for different levels have been found in several studies [10,14,73,75,103]. Additionally, non-managers in the public sector value the sense of control over work less [28], and employees in managerial positions are significantly more satisfied than other employees and have a higher level of intrinsic motivation than other employees [20].
The influence of motivational factors in relation to gender is different for six factors. Men are more motivated by good interpersonal relationships, while women were more motivated by all six factors (feeling of being involved or in on things, good working condition, job security, possibility of development and improvement, and prizes and awards). The differences in influence are very small (η2 = 0.003 to 0.005). Similar results have been found in Denmark, where job security is more important for women in the public sector [72]. Recognition and good working conditions have also been found to be more important for women in the United States [12].
Differences in the influence of motivational factors were determined for eight factors in relation to family status. Married people show greater influence from interesting work, quality of supervision and leadership, amount of responsibility, decision-making influence, job security, and high wages, while single people are more motivated by factors related to development and advancement: promotion and possibility of development and improvement. The differences in impact are small (η2 = 0.002 to 0.011). In Greece, in the public sector, married people have a higher level of extrinsic motivation, and unmarried people have a higher level of intrinsic motivation [18].
After the analysis of research results, the role of salary amount can be viewed in two ways, as a hygienic factor whose absence creates dissatisfaction [34] (low salary is the most important demotivating factor), but also as a significant extrinsic motivating factor (salary is in fourth place in relation to the influence on motivation).
The specifics of motivation for employees in the security sector of state administration and the justification for the development of a sustainable model of motivation policy for a specific organization was confirmed by establishing differences in the influence of motivational factors for members of the security sector and the control sample of random employees in the Republic of Serbia. The differences were determined for 15 factors (for all factors except high wages), and the magnitude of the impact is in the range of small to medium. Differences were also found in the subpopulations of the two samples, so that the factors interesting work and good working condition are more important to women in the Republic of Serbia than to women employed in the surveyed organization of state administration (security sector). Moreover, the feeling of being involved or in on things and good working condition have greater influence on people with a college education. Interesting work also has a greater impact on persons with a master’s degree. The most significant differences were found for persons at the PhD level, for the factors quality of supervision and leadership and decision-making influence, and the impact is greater on persons employed in public administration. Differences in the size of the impact by subpopulations range from small to large (η2 = 0.002 to 0.182). Similar results were obtained in Taiwan where employees in private corporations had greater needs for benefits than their counterparts in public organizations [54]. In the Czech Republic, employees working in public/governmental organizations are the least satisfied, and significant differences have been found for all aspects of work, except for the nature of work and communications [81]. In Italy, civil servants differ from private-sector employees in the way they assess the following factors: satisfaction with job security, peer relationships, safety, and health characteristics. Differences between civil servants and private sector employees in Italy do not exist in their assessment of the level of the factors of effort needed for the job and interesting job [80]. In the USA, information about their work is more important to workers in the private sector, but in contrast to our results, public sector workers are more interested in interesting work, while private-sector workers are more interested in their salaries [28].
Hypotheses 1 and 3 are supported by findings (significant differences in the influence of motivational factors were found depending on the demographic characteristics of the respondents, as well as significant differences in the influence of motivational factors on public administration employees and other employees in the Republic of Serbia). Contrary to expectations and hypothesis 2—money is not a significant motivating factor for public administration employees—findings are not supported by the data used in this study (high wages ranked in the first position, and low wages as a demotivator are also in the first position, which indicates that money in public administration of the Republic of Serbia is a significant motivating factor).
6. Conclusions
The paper presents the results of research conducted in order to develop a sustainable model of motivation for the work of employees in the security sector of public (state) administration. The research identified a hierarchy of 16 factors that have an impact on work motivation: good interpersonal relationships, challenging job and sense of achievement, amount of responsibility, high wages, quality of supervision and leadership, working time, job security, interesting work, good working condition, decision-making influence, feeling of being involved or in on things, promotion, prizes and awards, possibility of development and improvement, work/job recognition, and criticism. The resulting order indicates that good relationships, nature of the profession, and the essence of the work have immense impacts on work motivation (1. Good interpersonal relationships, 2. Challenging job and sense of achievement, 3. Amount of responsibility, 8. Interesting work), as well as the characteristics of leaders (5. Quality of supervision and leadership). The smallest influences on work motivation were work/job recognition (15th) and criticism (16th). The pronounced impact of money as a motivator for work, which can be noticed experientially is not fully confirmed by the resulting hierarchy (4. High wages), however, the importance of the salary for the respondents came up during the ranking of demotivating factors, where the small salary was ranked as the most important demotivating factor.
The existence of differences in the influence of motivational factors for work of the analyzed sample in relation to the control sample was confirmed, as well as differences depending on the characteristics of employees: age, level of training, gender, role in organization, and marital status.
Specificity of the examined sample is reflected in the difference from the general population of employees in 15 factors, and the most significant differences were found for interesting work, feeling of being involved or in on things, and good working condition. Similar differences were found in research in Italy, the Czech Republic, and Taiwan, while, on the other hand, in the USA, different results were obtained in relation to an interesting job which is more important for public sector employees and the level of salaries which is more important for private-sector employees.
We also emphasize the results of ranking, which was realized simultaneously with the assessment of the influence of motivational factors, whereby the ranking method more precisely determines the differences in the hierarchy of motivational factors. It led us to the conclusion that in the security sector of public (state) administration, money is the most influential motivating factor for the employees, because high wages are in the first position ahead of good interpersonal relations.
The obtained results met the goal of the research; they provide a good basis for further research and methodological and practical improvements of data collection instruments. We believe that the results can be applied in improving motivation and developing a sustainable model of motivation policy in public administration, which should be based on increasing salaries, maintaining and developing good interpersonal relationships, and an adequate attitude of managers toward executors, as well as job enrichment.
We also believe that the presented model and organization of motivation research can have a wider use value; it can be applied in other countries and their public companies and state bodies, especially because the research was conducted on a large sample of employees who expressed their views based on perceptions and experience in specific jobs. Bear in mind that the use of results has minor limitations because the sample was not stratified by all attributes of the respondents, which partially reduces the prospects of generalization. Additionally, the influence of a limited number of factors was investigated.
We believe that the following research can be further improved by working on a stratified sample by all attributes and randomization of the order of factors, as well as by using an appropriate computer platform.
Author Contributions
Conceptualization, M.K. and S.B.; methodology, S.B.; validation, M.K., S.B., and B.K.; formal analysis, M.K.; investigation, M.K.; writing—original draft preparation, M.K.; writing—review and editing, S.B. and B.K.; project administration, B.K. All authors have read and agreed to the published version of the manuscript.
Funding
This research received no external funding.
Conflicts of Interest
The authors declare no conflict of interest.
Appendix A
Table A1.
Dimensions of national cultures in the world in relation to Serbia.
Table A1.
Dimensions of national cultures in the world in relation to Serbia.
| Culture (State) | N | Min–Max | Serbia | Anglo-Saxon | German | Scandinavian | Latin European | Latin American | ||||||
|---|---|---|---|---|---|---|---|---|---|---|---|---|---|---|
| Dimension | Index | Rank | GBR | USA | DEU | AUT | SWE | NOR | ITA | FRA | MEX | VEN | ||
| Power distance | 76 | 11–104 | 86 | 8 | 35 | 40 | 35 | 11 | 31 | 31 | 50 | 68 | 81 | 81 |
| Individualism | 76 | 6–91 | 25 | 55–56 | 89 | 91 | 67 | 55 | 71 | 69 | 76 | 71 | 30 | 12 |
| Masculinity | 76 | 5–110 | 43 | 47–50 | 66 | 62 | 66 | 79 | 5 | 8 | 70 | 43 | 69 | 73 |
| Uncertainty avoidance | 76 | 8–112 | 92 | 11–13 | 35 | 46 | 65 | 70 | 29 | 50 | 75 | 86 | 82 | 76 |
| Long-term orientation | 93 | 0–100 | 52 | 38–39 | 51 | 26 | 83 | 60 | 53 | 35 | 61 | 63 | 24 | 16 |
| Indulgence versus restraint | 93 | 0–100 | 28 | 70–72 | 69 | 68 | 40 | 63 | 78 | 55 | 30 | 48 | 97 | 100 |
Note: GBR—Great Britain, DE—Germany, AU—Austria, SW—Sweden, NO—Norway, IT—Italy, FR—France, ME—Mexico, VE—Venezuela. Source: Adapted from Hofstede, G. (2010).

Figure A1.
Normalized values of motivating factors—ranking result.

Figure A2.
Rank of demotivators.
Table A2.
Rank of motivators.
Table A2.
Rank of motivators.
| Motivators | Rank | Gender | Position | Age | Education Level Mar. Stat. | ||||||||||
|---|---|---|---|---|---|---|---|---|---|---|---|---|---|---|---|
| M | F | Man | Nom | <25 | 26-3536-45 | >45H | C | MA | PhD Mar | Sin | |||||
| High wages | 1 | 1 | 2 | 2 | 1 | 2 | 1 | 1 | 2 | 1 | 1 | 2 | 5 | 1 | 1 |
| Good interpersonal relationships | 2 | 2 | 3 | 1 | 2 | 1 | 2 | 2 | 1 | 2 | 2 | 1 | 1 | 2 | 2 |
| Job security | 3 | 5 | 1 | 8 | 3 | 3 | 4 | 5 | 3 | 3 | 4 | 9 | 12 | 4 | 3 |
| Working time | 4 | 3 | 4 | 4 | 4 | 7 | 3 | 3 | 7 | 4 | 3 | 3 | 8 | 5 | 4 |
| Quality of supervision and leadership | 5 | 4 | 9 | 3 | 5 | 11 | 7 | 4 | 4 | 5 | 5 | 5 | 2 | 3 | 11 |
| Interesting work | 6 | 6 | 6 | 5 | 7 | 9 | 6 | 7 | 6 | 9 | 6 | 6 | 4 | 7 | 7 |
| Amount of responsibility | 7 | 7 | 10 | 9 | 6 | 8 | 10 | 8 | 5 | 6 | 9 | 10 | 7 | 6 | 10 |
| Promotion | 8 | 8 | 5 | 6 | 8 | 6 | 5 | 6 | 10 | 7 | 8 | 7 | 6 | 8 | 6 |
| Challenging job and sense of achievement | 9 | 9 | 7 | 7 | 9 | 5 | 8 | 10 | 8 | 10 | 7 | 4 | 3 | 9 | 5 |
| Good working condition | 10 | 10 | 11 | 11 | 10 | 12 | 11 | 9 | 9 | 8 | 11 | 12 | 10 | 10 | 9 |
| Possibility of development and improvement | 11 | 11 | 8 | 10 | 11 | 4 | 9 | 11 | 14 | 12 | 10 | 8 | 10 | 11 | 8 |
| Prizes and awards | 12 | 12 | 12 | 14 | 12 | 10 | 12 | 12 | 13 | 11 | 14 | 15 | 15 | 12 | 12 |
| Decision-making influence | 13 | 13 | 14 | 13 | 13 | 14 | 14 | 14 | 11 | 14 | 13 | 13 | 9 | 13 | 14 |
| Work/job recognition | 14 | 14 | 13 | 12 | 14 | 13 | 13 | 13 | 12 | 13 | 12 | 11 | 13 | 14 | 13 |
| Feeling of being involved or in on things | 15 | 15 | 15 | 15 | 15 | 16 | 15 | 15 | 15 | 15 | 15 | 14 | 14 | 15 | 15 |
| Criticism | 16 | 16 | 16 | 16 | 16 | 15 | 16 | 16 | 16 | 16 | 16 | 16 | 16 | 16 | 16 |
Note: N = 1576, M—male, F—female, Man—manager, Nom—Non-manager, H—High school, C—College, MA—master degree, PhD—doctor of social or technical sciences, Mar. stat.—Marital status, Mar—Married, Sin—Single.
Table A3.
Rank of motivators, normalized value.
Table A3.
Rank of motivators, normalized value.
| Motivators | ∑ | Gender | Position | Age | Education Level Mar. Stat | ||||||||||
|---|---|---|---|---|---|---|---|---|---|---|---|---|---|---|---|
| M | F | Man | Nom | <25 | 26–35 | 36–45 | >45 | H | C | MA | PhD | Mar | Sin | ||
| High wages | 0.139 | 0.145 | 0.117 | 0.135 | 0.142 | 0.111 | 0.148 | 0.154 | 0.125 | 0.150 | 0.139 | 0.119 | 0.079 | 0.144 | 0.133 |
| Good interpersonal relationships | 0.128 | 0.131 | 0.112 | 145 | 0.122 | 0.123 | 0.114 | 0.126 | 0.143 | 0.119 | 0.132 | 0.142 | 0.184 | 0.129 | 0.124 |
| Job security | 0.087 | 0.082 | 0.119 | 0.067 | 0.094 | 0.092 | 0.088 | 0.082 | 0.093 | 0.100 | 0.082 | 0.058 | 0.035 | 0.088 | 0.089 |
| Working time | 0.082 | 0.084 | 0.075 | 0.090 | 0.080 | 0.071 | 0.091 | 0.088 | 0.071 | 0.080 | 0.087 | 0.102 | 0.052 | 0.083 | 0.082 |
| Quality of supervision and leadership | 0.079 | 0.082 | 0.062 | 0.094 | 0.074 | 0.049 | 0.068 | 0.085 | 0.089 | 0.069 | 0.080 | 0.091 | 0.162 | 0.088 | 0.057 |
| Interesting work | 0.068 | 0.067 | 0.070 | 0.073 | 0.066 | 0.052 | 0.069 | 0.064 | 0.075 | 0.060 | 0.077 | 0.082 | 0.086 | 0.068 | 0.067 |
| Amount of responsibility | 0.066 | 0.067 | 0.058 | 0.055 | 0.068 | 0.055 | 0.051 | 0.060 | 0.088 | 0.068 | 0.062 | 0.056 | 0.061 | 0.069 | 0.057 |
| Promotion | 0.065 | 0.064 | 0.073 | 0.071 | 0.064 | 0.085 | 0.079 | 0.070 | 0.042 | 0.065 | 0.065 | 0.070 | 0.071 | 0.064 | 0.069 |
| Challenging job and sense of achievement | 0.063 | 0.062 | 0.066 | 0.069 | 0.061 | 0.086 | 0.062 | 0.052 | 0.070 | 0.049 | 0.076 | 0.094 | 0.103 | 0.059 | 0.073 |
| Good working condition | 0.053 | 0.053 | 0.052 | 0.041 | 0.056 | 0.047 | 0.048 | 0.056 | 0.055 | 0.064 | 0.038 | 0.029 | 0.038 | 0.050 | 0.058 |
| Possibility of development and improve. | 0.045 | 0.042 | 0.064 | 0.050 | 0.045 | 0.091 | 0.061 | 0.038 | 0.026 | 0.038 | 0.057 | 0.066 | 0.038 | 0.037 | 0.064 |
| Prizes and awards | 0.036 | 0.035 | 0.041 | 0.024 | 0.040 | 0.050 | 0.038 | 0.037 | 0.029 | 0.047 | 0.024 | 0.013 | 0.007 | 0.034 | 0.041 |
| Decision-making influence | 0.031 | 0.030 | 0.030 | 0.033 | 0.029 | 0.027 | 0.028 | 0.028 | 0.036 | 0.029 | 0.031 | 0.023 | 0.051 | 0.032 | 0.025 |
| Work/job recognition | 0.030 | 0.030 | 0.035 | 0.038 | 0.028 | 0.035 | 0.029 | 0.031 | 0.030 | 0.029 | 0.033 | 0.034 | 0.021 | 0.028 | 0.035 |
| Feeling of being involved or in on things | 0.017 | 0.016 | 0.018 | 0.009 | 0.018 | 0.011 | 0.014 | 0.017 | 0.019 | 0.018 | 0.014 | 0.015 | 0.013 | 0.016 | 0.015 |
| Criticism | 0.011 | 0.011 | 0.009 | 0.007 | 0.012 | 0.014 | 0.012 | 0.011 | 0.008 | 0.015 | 0.005 | 0.006 | 0.000 | 0.010 | 0.012 |
Note: N = 1576, M—male, F—female, Man—manager, Nom—Non-manager, H—High school, C—College, MA—master degree, PhD—doctor of social or technical sciences, Mar.stat.—Marital status, Mar—Married, Sin—Single.
Table A4.
Rank of demotivators, normalized value.
Table A4.
Rank of demotivators, normalized value.
| Motivators | ∑ | Gender | Position | Age | Education Level Mar. Stat. | ||||||||||
|---|---|---|---|---|---|---|---|---|---|---|---|---|---|---|---|
| M | F | Man | Nom | <25 | 26–35 | 36–45 | >45 | H | C | MA | PhD | Mar | Sin | ||
| Bad working condition | 0.164 | 0.164 | 0.164 | 0.152 | 0.168 | 0.185 | 0.168 | 0.158 | 0.161 | 0.174 | 0.151 | 0.145 | 0.149 | 0.162 | 0.170 |
| Low quality of supervision and leaders | 0.209 | 0.209 | 0.206 | 0.233 | 0.201 | 0.189 | 0.204 | 0.209 | 0.217 | 0.195 | 0.218 | 0.248 | 0.253 | 0.212 | 0.200 |
| Low possibility of promotion | 0.193 | 0.193 | 0.195 | 0.176 | 0.198 | 0.196 | 0.198 | 0.198 | 0.182 | 0.198 | 0.195 | 0.172 | 0.160 | 0.191 | 0.198 |
| Worse interpersonal relationships | 0.200 | 0.209 | 0.206 | 0.223 | 0.193 | 0.201 | 0.190 | 0.196 | 0.212 | 0.186 | 0.210 | 0.229 | 0.254 | 0.200 | 0.197 |
| Low wages | 0.234 | 0.238 | 0.221 | 0.216 | 0.240 | 0.229 | 0.239 | 0.237 | 0.228 | 0.247 | 0.225 | 0.206 | 0.185 | 0.235 | 0.235 |
Note: N = 1576, M—male, F—female, Man—manager, Nom—Non-manager, H—High school, C—College, MA—master degree, PhD—doctor of social or technical sciences, Mar. stat.—Marital status, Mar—Married, Sin—Single.
Table A5.
Rank of demotivators.
Table A5.
Rank of demotivators.
| Motivators | Rank | Gender | Position | Age | Education Level Mar. Stat. | ||||||||||
|---|---|---|---|---|---|---|---|---|---|---|---|---|---|---|---|
| M | F | Man | Nom | <25 | 26–35 | 36–45 | >45 | H | C | MA | PhD | Mar | Sin | ||
| Bad working condition | 5 | 5 | 5 | 5 | 5 | 5 | 5 | 5 | 5 | 5 | 5 | 5 | 5 | 5 | 5 |
| Low quality of supervision and leadership | 2 | 2 | 3 | 2 | 2 | 4 | 2 | 2 | 2 | 3 | 2 | 1 | 2 | 2 | 2 |
| Low possibility of promotion | 4 | 4 | 4 | 4 | 3 | 3 | 3 | 3 | 4 | 2 | 4 | 4 | 4 | 4 | 4 |
| Bad interpersonal relationships | 3 | 3 | 2 | 2 | 4 | 2 | 4 | 4 | 3 | 4 | 3 | 2 | 1 | 3 | 3 |
| Low wages | 1 | 1 | 1 | 3 | 1 | 1 | 1 | 1 | 1 | 1 | 1 | 3 | 3 | 1 | 1 |
Note: N = 1576, M—male, F—female, Man—manager, Nom—Non-manager, H—High school, C—College, MA—master degree, PhD—doctor of social or technical sciences, Mar. stat.—Marital status, Mar—Married, Sin—Single.
Table A6.
Differences in motivational factors’ impacts between analyzed sample—group and control sample-group (t-test).
Table A6.
Differences in motivational factors’ impacts between analyzed sample—group and control sample-group (t-test).
| Motivators | N2/Respondents | N1/Respondents | t | df | Mean Diff. | Sig | µ2 | ||||
|---|---|---|---|---|---|---|---|---|---|---|---|
| M | SD | N | M | SD | N | ||||||
| Interesting work | 4.08 | 0.919 | 335 female | 3.64 | 0.887 | 267 female | 5.927 | 600 | 0.44 | 0.000 | 0.055 |
| 4.06 | 0.957 | 128 male | 3.67 | 0.919 | 1308 male | 5.412 | 1494 | 0.39 | 0.000 | 0.019 | |
| 3.71 | 1.038 | 125 H | 3.53 | 0.912 | 940 H | 2.038 | 1063 | 0.18 | 0.042 | 0.004 | |
| 4.06 | 0.912 | 226 C | 3.75 | 0.915 | 417 C | 4.106 | 641 | 0.31 | 0.000 | 0.026 | |
| 4.35 | 0.742 | 150 MA | 3.99 | 0.799 | 142 MA | 3.992 | 290 | 0.36 | 0.000 | 0.052 | |
| Quality of supervision and leadership | 4.01 | 0.985 | 335 female | 3.82 | 0.845 | 267 female | 2.502 | 600 | 0.190 | 0.013 | 0.010 |
| 3.72 | 1.127 | 18 PhD | 4.62 | 0.663 | 71 PhD | 4.396 | 87 | 0.900 | 0.000 | 0.182 | |
| Good working condition | 4.08 | 0.915 | 335 female | 3.74 | 1.011 | 267 female | 4.323 | 600 | 0.340 | 0.000 | 0.030 |
| 4.03 | 0.973 | 128 male | 3.59 | 1.043 | 1308 male | 5.453 | 1494 | 0.440 | 0.000 | 0.020 | |
| 3.90 | 0.987 | 125 H | 3.54 | 1.082 | 940 H | 3.530 | 1063 | 0.360 | 0.000 | 0.012 | |
| 4.17 | 0.880 | 226 C | 3.66 | 0.995 | 417 C | 6.457 | 641 | 0.510 | 0.000 | 0.061 | |
| Promotion | 3.63 | 1.133 | 125 H | 3.28 | 1.327 | 940 H | 2.815 | 1063 | 0.350 | 0.005 | 0.007 |
| 3.80 | 1.112 | 335 female | 3.54 | 1.236 | 267 female | 2.721 | 600 | 0.260 | 0.007 | 0.012 | |
| 3.90 | 1.124 | 128 male | 3.47 | 1.296 | 1308 male | 4.321 | 1494 | 0.430 | 0.000 | 0.012 | |
| Good interpersonal relationships | 4.29 | 0.878 | 125 H | 4.06 | .941 | 940 H | 2.587 | 1063 | 0.270 | 0.010 | 0.006 |
| 4.28 | 0.848 | 335 female | 4.03 | 1.024 | 267 female | 3.276 | 600 | 0.250 | 0.001 | 0.018 | |
| 4.33 | 0.767 | 18 PhD | 4.69 | 0.523 | 71 PhD | −2.357 | 87 | 0.360 | 0.021 | 0.060 | |
| Decision-making influence | 3.61 | 0.983 | 125 H | 3.34 | 0.961 | 940 H | 2.943 | 1063 | 0.270 | 0.003 | 0.008 |
| 3.67 | 0.767 | 18 PhD | 4.24 | 0.547 | 71 PhD | −3.367 | 87 | 0.530 | 0.001 | 0.115 | |
| Feeling of being involved or in on things | 3.83 | 0.940 | 125 H | 3.43 | 0.936 | 940 H | 3.940 | 1063 | 0.400 | 0.000 | 0.014 |
| 3.96 | 0.821 | 226 C | 3.47 | 0.904 | 417 C | 6.774 | 641 | 0.490 | 0.000 | 0.067 | |
| Challenging job and sense of achievement | 4.41 | 0.813 | 150 MA | 4.14 | 0.912 | 142 MA | 2.673 | 290 | 0.270 | 0.008 | 0.024 |
| Job security | 4.09 | 1.088 | 226 C | 3.74 | 1.137 | 417 C | 3.783 | 641 | 0.350 | 0.000 | 0.022 |
Table A7.
Motivation factors—meaning.
Table A7.
Motivation factors—meaning.
| 1 | Interesting work | An interesting job, good work organization, well-designed job according to skills or education, a job you love, stimulating job, amusing job, etc. |
| 2 | Quality of supervision and leadership | Satisfaction with the leading style, loyalty of the leader, attitude of the leader, correct leadership with respect for subordinates. |
| 3 | Amount of responsibility | Independence in work, independence in performing tasks, a sense of “one’s own” control over work, that no one “stands over worker’s head” while working. |
| 4 | Good interpersonal relationships | Good friends at work, healthy work environment without quarrels and conflicts, socializing with colleagues, reputation with colleagues, good associates. |
| 5 | Decision-making influence | Participation in decision-making, respect for suggestions and opinions of workers, seeking and respecting the views of workers. |
| 6 | Feeling of being involved or in on things | Employees are familiar with the goals/business/realization of tasks, information isnot hidden, and employees are involved and up to date with processes. |
| 7 | Good working condition | Safety at work, good working conditions, good organization of work, good microclimatic conditions (temperature, humidity, cleanliness). |
| 8 | Challenging job and sense of achievement | Self-actualization—to achieve and be what you can be, your own satisfaction in doing work, the ability to excel in work, respect for the work done, achievement, success in work. |
| 9 | Promotion | Possibility of promotion, appointment to a higher position or advances in the profession. |
| 10 | Job security | No fear of losing a job, that the job is safe/secure. |
| 11 | Possibility of development and improvement | Possibility of professional development, availability of courses, possibility of career development. |
| 12 | Prizes and awards | Awards and recognitions for finished jobs/tasks/hard work. |
| 13 | High wages | The amount of salary in general—that is, the money received for work—does not refer to satisfaction or dissatisfaction with the current salary, but to the importance of the amount of salary and money received for work. |
| 14 | Criticism | Criticism of the mistake made and fear of punishment or consequences. |
| 15 | Work/job recognition | Job significance/status, status expert in that field, business contacts that job provides. |
| 16 | Working time | That working hours correspond to the needs, that workers can be absent from work if necessary, that vacations are used according to the plan and needs, that workers do not work often overtime. |
References
- Robbins, S.; Judge, T. Organizational Behavior, 15th ed.; Prentice Hall: Upper Saddle River, NJ, USA, 2013. [Google Scholar]
- Ryan, R.; Deci, E. Intrinsic and Extrinsic Motivations: Classic Definitions and New Directions. Contemp. Educ. Psychol. 2000, 25, 54–67. [Google Scholar] [CrossRef] [PubMed]
- Bahtijarevic-Šiber, F. Human Resource Management; Golden Marketing: Zagreb, Croatia, 1999. [Google Scholar]
- Frey, B.S.; Osterloh, M. Successful Management by Motivation, Balancing Intrinsic and Extrinsic Incentives; Springer: Berlin, Germany, 2002. [Google Scholar]
- Mihailovic, D. Structure of Motivation for Work; Centar: Belgrade, Serbia, 1988. [Google Scholar]
- Pinder, C.C. Work Motivation in Organizational Behavior, 2nd ed.; Psychology Press: New York, NY, USA, 2014. [Google Scholar]
- Armstrong, M.; Taylor, S. Handbook of Human Resource Management Practices, 13th ed.; Kogan Page Publishers Inc.: London, UK, 2014. [Google Scholar]
- Mihailovic, D. Organizational Behavior; Faculty of Organizational Sciences: Belgrade, Serbia, 2009. [Google Scholar]
- Latham, G.P.; Pinder, C.C. Work Motivation Theory and Research at the Dawn of the Twenty-First Century. Ann. Rev. Psychol. 2005, 56, 485–516. [Google Scholar] [CrossRef]
- Kovach, K. What motivates employees? Workers and supervisors give different answers. Bus. Horiz. 1987, 30, 58–65. [Google Scholar] [CrossRef]
- Spitzer, D. Power rewards: Rewards that really motivate. Manag. Rev. 1996, 85, 45–50. [Google Scholar]
- Wiley, C. What motivates employees according to over 40 years of motivation survey. Int. J. Manpow. 1997, 18, 263–280. [Google Scholar] [CrossRef]
- Yang, F. Work, motivation and personal characteristics: And in-depth study of six organizations in Ningbo. Chin. Manag. Stud. 2011, 5, 272–297. [Google Scholar] [CrossRef]
- Katsva, M.; Condrey, S.E. Motivating personnel at Russian nuclear power plants: A case study of motivation theory application. Public Pers. Manag. 2005, 34, 343–356. [Google Scholar] [CrossRef]
- Islam, R.; Burhem, B. Employee motivation: A Comparasion between Malaysia and UAE. Malays. Manag. Rev. 2007, 42, 101–122. [Google Scholar]
- Ismail, A.Z.; Ahmed, S. Employee perceptions on reward/recognition and motivating factors: A comparison between Malaysia and UAE. Am. J. Econ. 2015, 5, 200–207. [Google Scholar]
- Chitiris, L. Who are the work-motivated managers in the hotel industry—An exploratory study. Int. J. Hosp. Manag. 1990, 9, 293–304. [Google Scholar] [CrossRef]
- Manolopoulos, D. An evaluation of employee motivation in the extended public sector in Greece. Empl. Relat. 2007, 30, 63–85. [Google Scholar] [CrossRef]
- Qayyum, A.S. An Empirical Analysis of Employee Motivation and Role of Demographics: The Banking Industry of Pakistan. Glob. Bus. Manag. Res. Int. J. 2012, 1, 1–14. [Google Scholar]
- Eskildsen, J.K.; Kristensen, K.; Westlund, A.H. Work motivation and job satisfaction in the Nordic countries. Empl. Relat. 2004, 26, 122–136. [Google Scholar] [CrossRef]
- Kujović, B. Motivation for the Work of Members of the Police. Master’s Thesis, University of Belgrade, Belgrade, Serbia, 1989. [Google Scholar]
- Mijcika, N. Labour motivation and survey of some of its aspects. J. Sociol. 1989, 20, 151–164. [Google Scholar]
- Dinić, D.; Miltojević, V. Motivational factors for dedication at work—Case study. Facta Univ. Ser. Work. Living Environ. Prot. 2017, 14, 207–224. [Google Scholar] [CrossRef]
- Rakić, T.; Živković, S.; Veljković, M. Hierarchy of Work Motives and Motivators With the Aim of Forming More Efficient Working Environment. Facta Univ. Ser. Work. Living Environ. Prot. 2017, 14, 87–98. [Google Scholar]
- Uddin, R.; Hogue, N.; Ibrahim, M.; Mamun, A. Work Motivation: A Study on Regular and Part-time Employees of Bangladesh. Int. J. Manag. Bus. Res. 2014, 4, 235–245. [Google Scholar]
- Charles, K.R.; Marshall, L.H. Motivational Preferences of Caribbean Hotel Workers: An Exploratory Study. Int. J. Contemp. Hosp. Manag. 1992, 4, 25–29. [Google Scholar] [CrossRef]
- Huddleston, P.; Good, L.K. Job motivators in Russian and Polish retail firms. Int. J. Retail. Distrib. Manag. 1999, 27, 383–393. [Google Scholar] [CrossRef]
- Karl, K.A.; Sutton, C.L. Job Values in Today’s Workforce: A Comparison of Public and Private Sector Employees. Public Pers. Manag. 1998, 27, 515–527. [Google Scholar] [CrossRef]
- Linc, S. Motivating Russian workers: Analysis of age and gender differences. J. Socio-Econ. 2004, 33, 261–289. [Google Scholar]
- Chiu, R.K.; Tang, T.L.; Luk, V.W. Retaining and motivating employees: Compensation preferences in Hong Kong and China. Pers. Rev. 2002, 31, 402–431. [Google Scholar] [CrossRef]
- Giannikis, S.; Mihail, D. Motivation of working women in the Greek retail sector: An empirical analysis. Int. J. Manpow. 2010, 31, 4–20. [Google Scholar] [CrossRef]
- Fisher, C.; Yuan, A. What motivates employees? A comparison of US and Chinese responses. Int. J. Hum. Resour. Manag. 1998, 9, 516–528. [Google Scholar] [CrossRef]
- Cameron, J.; Pierce, W.D. Reinforcement, Reward, and Intrinsic Motivation: A Meta-Analysis. Rev. Educ. Res. 1994, 64, 363–423. [Google Scholar] [CrossRef]
- Herzberg, F. One More Time: How Do You Motivate Employees? Harvard Business Review Boston: Boston, MA, USA, 1968; pp. 53–62. [Google Scholar]
- Kohn, A. Challenging Behaviorist Dogma: Myths about Money and Motivation. Compens. Benefits Rev. 1998, 30, 27–37. [Google Scholar] [CrossRef]
- Pfeffer, J. Six dangerous myths about pay. Harv. Bus. Rev. 1998, 76, 108–119. [Google Scholar]
- Elizur, D.; Borg, I.; Hunt, R.; Beck, I.M. The structure of work values: Across cultural comparison. J. Organ. Behav. 1991, 12, 21–38. [Google Scholar] [CrossRef]
- Savery, L.K.; Wingham, D.L. Coping with the Career Plateau: Motivators for Directors of Child-care Centres. Leadersh. Organ. Dev. J. 1991, 12, 17–19. [Google Scholar] [CrossRef]
- Silverthorne, C.P. Work Motivation in the United States, Russia, and the Republic of China (Taiwan): A Comparison. J. Appl. Soc. Psychol. 1992, 22, 1631–1639. [Google Scholar] [CrossRef]
- Ilić, J. Work Motivation; Draganić: Belgrade, Serbia, 1995. [Google Scholar]
- Deci, E.L. Effects of externally mediated rewards on intrinsic motivation. J. Personal. Soc. Psychol. 1971, 18, 105–115. [Google Scholar] [CrossRef]
- Amabile, T.M. How to kill creativity. Harv. Bus. Rev. 1998, 76, 77–87. [Google Scholar]
- Kerr, S. On the folly of rewarding A, while hoping for B. Acad. Manag. J. 1975, 18, 769–783. [Google Scholar]
- Erez, M.; Gopher, D.; Arzi, N. Effects of goal difficulty, self-set goals, and monetary rewards on dual task performance. Organ. Behav. Hum. Decis. Process. 1990, 47, 247–269. [Google Scholar] [CrossRef]
- Lawler, E.E.; Porter, L.W. The Effect of Performance on Job Satisfaction. Ind. Relat. 1967, 7, 20–28. [Google Scholar] [CrossRef]
- Vroom, V.H. Work and Motivation; Wiley: New York, NY, USA, 1964. [Google Scholar]
- Van Knippenberg, D. Work Motivation and Performance: A Social Identity Perspective. Appl. Psychol. 2000, 49, 357–371. [Google Scholar] [CrossRef]
- Gagne, M.; Deci, E.L. Self-determination theory and work motivation. J. Organ. Behav. 2005, 26, 331–362. [Google Scholar] [CrossRef]
- Lord, R.L. Traditional Motivation Theories and Older Engineers. Eng. Manag. J. 2002, 14, 3–7. [Google Scholar] [CrossRef]
- Mani, B.G. Performance Appraisal Systems, Productivity, and Motivation: A Case Study. Public Per. Manag. 2002, 31, 141–159. [Google Scholar] [CrossRef]
- Pritchard, R.D.; Leonard, D.W.; Von Bergen, C.W.; Kirk, R.J. The effects of varying schedules of reinforcement on human task performance. Organ. Behav. Hum. Perform. 1976, 16, 205–230. [Google Scholar] [CrossRef]
- Terborg, J.R.; Miller, H.E. Motivation, behavior, and performance: A closer examination of goal setting and monetary incentives. J. Appl. Psychol. 1978, 63, 29–39. [Google Scholar] [CrossRef]
- Vallerand, R.J.; Bissonnette, R. Intrinsic, Extrinsic, and A motivational Styles as Predictors of Behavior: A Prospective Study. J. Personal. 1992, 60, 599–620. [Google Scholar] [CrossRef]
- Hong, J.C.; Yang, S.D.; Wang, L.J.; Chiou, E.F.; Su, F.Y.; Huang, S.L. Impact of employee benefits on work motivation and productivity. Int. J. Career Manag. 1995, 7, 10–14. [Google Scholar] [CrossRef]
- Bono, J.; Judge, T. Self-concordance at work: Toward understanding the motivational effects of transformational leaders. Acad. Manag. J. 2003, 46, 554–571. [Google Scholar]
- Kuhnen, C.M.; Tymula, A. Feedback, Self-Esteem, and Performance in Organizations. Manag. Sci. 2012, 58, 94–113. [Google Scholar] [CrossRef]
- Masclet, D.; Peterle, E.; Larribeau, S. Gender differences in tournament and flat-wages chemes: An experimental study. J. Econ. Psychol. 2015, 47, 103–115. [Google Scholar] [CrossRef]
- Benndorf, V.; Rau, H.; Sölch, C. Gender differences in motivational crowding out of work performance. Econ. Inq. 2018, 57, 1–21. [Google Scholar] [CrossRef]
- Kassim, Z.; Yusoff, I.Y.; Fong, N.L. Job Empowerment and Customer Orientation of Bank Employees in Kuching, Malaysia. Contemp. Manag. Res. 2012, 8, 131–140. [Google Scholar] [CrossRef][Green Version]
- Edminah, A.; Ahiazu, A. Employee Involvement and Organizational Effectiveness. J. Manag. 2013, 32, 661–674. [Google Scholar]
- Zhang, J.; Zhang, Y.; Song, Y.; Gong, Z. The different relations of extrinsic, introjected, identified, regulation and intrinsic motivation on employees’ performance: Empirical studies following self-determination theory. Manag. Decis. 2016, 54, 1–27. [Google Scholar] [CrossRef]
- Buch, R.; Kuvaas, B.; Dysvik, A.; Schyns, B. If and when social and economical leader member exchange relationships predict follower work effort. Leadersh. Organ. Dev. J. 2014, 35, 725–739. [Google Scholar] [CrossRef]
- Igalens, J.; Roussel, P. A Study of the relationship between Compensation package, Work motivation and Job satisfaction. J. Organ. 1999, 20, 1003–1025. [Google Scholar] [CrossRef]
- Jenkins, D.G., Jr.; Mitra, A.; Gupta, N.; Shaw, J.D. Are financial incentives related to performance? A meta-analytic review of empirical research. J. Appl. Psychol. 1998, 83, 777–787. [Google Scholar] [CrossRef]
- Taylor, J. Organizational Influences, Public Service Motivation and Work Outcomes: An Australian Study. Int. Public Manag. J. 2008, 11, 67–88. [Google Scholar] [CrossRef]
- Manzoor, Q.-A. Impact of Employees Motivation on Organizational Effectiveness. Bus. Manag. Strategy 2011, 3, 1–12. [Google Scholar] [CrossRef]
- Andersen, L.B.; Heinesen, E.; Pedersen, L.H. How Does Public Service Motivation Among Teachers Affect Student Performance in Schools? J. Public Adm. Res. Theory 2014, 24, 651–671. [Google Scholar] [CrossRef]
- Palma, R. Public service motivation and employee outcomes in the Italian public sector: Testing the mediating effect of person-organization fit. J. Appl. Quant. Methods 2016, 11, 1–16. [Google Scholar]
- Kuranchie-Mensah, B.; Amponsah-Tawiah, K. Employee Motivation and Work Performance: A Comparative Study of Mining Companies in Ghana. J. Ind. Eng. Manag. 2016, 9, 255–309. [Google Scholar] [CrossRef]
- Al-Musadieq, M.; Raharjo, K.; Solimun, S.; Fernandes, A. The mediating effect of work motivation on the influence of job design and organizational culture against HR performance. J. Manag. Dev. 2018, 37, 452–469. [Google Scholar] [CrossRef]
- Wright, B.E. Public-Sector Work Motivation: A Review of the Current Literature and a Revised Conceptual Model. J. Public Adm. Res. Theory 2001, 11, 559–586. [Google Scholar] [CrossRef]
- Cleal, B.; Sell, L. Job Satisfaction, Work Environment, and Rewards: Motivational Theory Revisited. Labour 2011, 25, 1–23. [Google Scholar]
- Harpaz, I. The Importance Of Work Goals: An International Perspective. J. Int. Bus. Stud. 1990, 21, 75–93. [Google Scholar] [CrossRef]
- Heyns, M.M.; Kerr, M.D. Generational differences in work place motivation. SA J. Hum. Resour. Manag. 2018, 16, 1–10. [Google Scholar] [CrossRef]
- Islam, R. Employee motivation: A Malaysian perspective. Int. J. Commer. Manag. 2008, 18, 344–362. [Google Scholar] [CrossRef]
- Maslow, A. Motivation and Personality; NOLIT: Beograd, Serbia, 1982. [Google Scholar]
- Hofstede, G.; Bond, M.H. The Confucius connection: From cultural roots to economic growth. Organ. Dyn. 1988, 16, 5–21. [Google Scholar] [CrossRef]
- Kamdron, T. Work motivation and job satisfaction of Estonian higher officials. J. Public Adm. 2005, 28, 1211–1240. [Google Scholar] [CrossRef]
- Lee-Ross, D. An exploratory study of work motivation among private and public sector hospital chefs in Australia. J. Manag. Dev. 2002, 21, 576–588. [Google Scholar] [CrossRef]
- Ghinetti, P. The Public-Private Job Satisfaction Differential in Italy. Labour 2007, 21, 361–388. [Google Scholar] [CrossRef]
- Franěk, M.; Večeřa, J. Personal characteristics and job satisfaction. Ekon. Manag. 2008, 4, 63–76. [Google Scholar]
- Sindik, J. Research of the motivation consequences at employees with a different education level. Econ. Though 2011, 1, 101–119. [Google Scholar]
- Jurgensen, C.E. Job preferences (What makes a job good or bad?). J. Appl. Psychol. 1978, 63, 267–276. [Google Scholar] [CrossRef]
- Hofstede, G. Cultures and Organizations: Software of the Mind, 3rd ed.; McGraw-Hill: London, UK, 2010. [Google Scholar]
- Janićijević, N. The influence of national culture on organizational structure of the company in Serbia. Econ. Ann. 2003, 156, 45–66. [Google Scholar]
- Brislin, R.W.; MacNab, B.; Worthley, R.; Kabigting, F.; Zukis, B. Evolving Perceptions of Japanese Workplace Motivation. Int. J. Cross Cult. Manag. 2005, 5, 87–104. [Google Scholar] [CrossRef]
- Herzberg, F.; Mausner, B.; Snyderman, B. The Motivation to Work; John Wiley: New York, NY, USA, 1959. [Google Scholar]
- Worthley, R.; MacNab, B.; Brislin, R.; Ito, K.; Rose, L.E. Workforce motivation in Japan: An examination of gender differences and management perceptions. Int. J. Hum. Resour. Manag. 2009, 20, 1503–1520. [Google Scholar] [CrossRef]
- Wright, B.E.; Kim, S. Participation’s influence on job satisfaction: The importance of job satisfaction: The importance of job characteristics. Rev. Public Pers. Adm. 2004, 24, 18–40. [Google Scholar] [CrossRef]
- Čukić, V. Motivational potential and organizational balance of employees at the beginning of the economic crisis in Serbia. Bus. Trends 2013, 2, 1–10. [Google Scholar] [CrossRef]
- Cohen, J.W. Statistical Power Analysis for the Behavioral Sciences, 2nd ed.; Lawrence Erlbaum Associates: Hillsdale, NJ, USA, 1988. [Google Scholar]
- Milićević, M.; Župac, G. Subjective approach to the determination of criteria weights. Mil. Tech. Cour. 2012, 2, 48–70. [Google Scholar] [CrossRef]
- Biswas, S.; Bandyopadhyay, G.; Guha, B.; Bhattacharjee, M. An ensemble approach for portfolio selection in a multi-criteria decision making frame work. Decis. Mak. Appl. Manag. Eng. 2019, 2, 138–158. [Google Scholar]
- Tanackov, I.; Jevtić, Ž.; Stojić, G.; Sinani, F.; Ercegovac, P. Rare Events Queueing System—REQS. Oper. Res. Eng. Sci. Theory Appl. 2019, 2, 1–11. [Google Scholar] [CrossRef]
- Pickton, D.W.; Wright, S. What’s SWOT in strategic analysis? Strateg. Chang. 1998, 7, 101–109. [Google Scholar] [CrossRef]
- Helms, M.; Nixon, J. Exploring SWOT analysis—Where are we now? Are view of academic research from the last decade. J. Strategy Manag. 2010, 3, 215–251. [Google Scholar] [CrossRef]
- Kim-Keung, H.J. Formulation of a Systemic PEST Analysis for Strategic Analysis. Eur. Acad. Res. 2014, 2, 6478–6492. [Google Scholar]
- Sammut-Bonnici, T.; Galea, D. PEST analysis. In Wiley Encyclopedia of Management; Cooper, C., Ed.; John Wiley & Sons, Ltd.: New York, NY, USA, 2015; Volume 12, pp. 1–7. [Google Scholar]
- Nunnally, J.C. Psychometric Theory, 2nd ed.; McGraw-Hill: New York, NY, USA, 1978. [Google Scholar]
- Ryan, R.; Deci, E. Self-determination theory and the facilitation of intrinsic motivation, social development, and well-being. Am. Psychol. 2000, 55, 68–78. [Google Scholar] [CrossRef] [PubMed]
- Deci, E.; Ryan, R. Facilitating optimal motivation and psychological well-being across life’s domains. Can. Psychol. 2008, 49, 14–23. [Google Scholar] [CrossRef]
- Huddleston, P.; Good, L.; Frazier, B. The influence of firm characteristics and demographic variable son Russian workers’ work motivation and job attitudes. Int. Rev. Retail. Distrib. Consum. Res. 2002, 12, 395–421. [Google Scholar]
- Takahashi, K. Effects of wage and promotion incentives on the motivation levels of Japanese employees. Career Dev. Int. 2006, 11, 193–203. [Google Scholar] [CrossRef]
© 2020 by the authors. Licensee MDPI, Basel, Switzerland. This article is an open access article distributed under the terms and conditions of the Creative Commons Attribution (CC BY) license (http://creativecommons.org/licenses/by/4.0/).