Article

Ecosystem Health Assessment of Shennongjia National Park, China

1
School of Earth Sciences and Surveying and Mapping Engineering, China University of Mining and Technology (Beijing), Beijing 100083, China
2
Satellite Environment Application Center, Ministry of Ecology and Environment, Beijing 100094, China
*
Authors to whom correspondence should be addressed.
Sustainability 2020, 12(18), 7672; https://doi.org/10.3390/su12187672
Submission received: 7 June 2020 / Revised: 20 August 2020 / Accepted: 4 September 2020 / Published: 17 September 2020
(This article belongs to the Special Issue National Parks: Theories and Practices)

Abstract

:
Ecosystem health assessment is an important part of improving the management of national parks. In this paper, Shennongjia National Park is taken as the study region. By using satellite remote sensing data from 2000 to 2018, based on the Vitality Organization Resilience (VOR) model, an ecosystem health assessment is created and its spatiotemporal characteristics are analyzed. In the whole region, the ecosystem’s health level has gradually improved; the rate of improvement of the ecosystem’s health level from 2016 to 2018 has been 2.5-times that of the overall rate and the trend of improvement has been obvious. The rate of improvement of the ecosystem’s health level of non-nature protection areas has improved two-fold; the same is true of nature protection areas, and the stability change trend of the two areas has basically been the same. The establishment of national parks has played a significant role in promoting the health of the regional ecosystem. In future planning, relevant departments should pay attention to the ecological protection and restoration of the area and optimize the traditional area layout of Shennongjia National Park.

1. Introduction

Nature reserves play an important role in the maintenance of national ecological security. In recent years, there has been an increased focus on assessing the effectiveness of the protection of nature reserves. The findings of studies in this area have been diverse. Mukul et al. [1] found that the increased capacity of land use and land cover in Bangladesh’s Satchari National Park was associated with the increased provision of ecosystem services. In addition, Sohel et al. [2] studied the ability of different land use–land cover (LULC) types to support ecological integrity and supply ecosystem services in Bangladesh’s Lawachara National Park. Shao et al. [3] evaluated the ecological effects of the first phase of the ecological protection and construction project in the Three Rivers Source Region in China based on the ecosystem’s structure, quality, and services. Hou et al. [4] quantitatively analyzed the spatial distribution of different types of nature reserves in China and suggested that there was a lack of space based on an assessment of ecosystem services. Huang et al. [5] analyzed dynamic changes in the organization, quality, and core services of different types of key ecological function areas in China from 2000 to 2010. Hou et al. [6] evaluated the changes and the effectiveness of the protection of ecosystems in terms of ecosystem patterns, vegetation growth, and service functions in key ecological function areas of tropical rainforests in the central mountainous area of Hainan Island, China. Based on the contribution of ecological space and ecosystem services, the effectiveness of ecological protection red lines has been assessed through the expansion of spatial and temporal scales [7].
In the late 1980s, the concept of “ecosystem health” was proposed as a tool for ecosystem management based on the idea of sustainable development [8]. Our current understanding of this concept can be accurately represented by the following quote: “ecosystem health refers to the stability and sustainability of an ecosystem; that is, the ecosystem has the ability to maintain its organizational structure, self-regulate and recover from stress in time” [9]. There are two main methods for evaluating ecosystem health: the indicator species method [10,11] and the index method [12]. Many index system framework models have been established, such as Vitality Organization Resilience (VOR) [13], Pressure State Response (PSR) [14], Driving Force State Response (DSR) [15], and Driving Force Pressure State Impact Response (DPSIR) [16], and these models have been used to assess ecosystem health [17]. Pantus et al. [18] established a comprehensive index to quantitatively assess ecosystem health and used it to evaluate the ecosystem health of Moreton Bay in Australia. In 1989, Rapport et al. [19] explored the meaning of ecosystem health for the first time and stated that a healthy ecosystem should be characterized by vitality, resilience, and organization. In 1992, Costanza [20] proposed a system health formula that used ecosystem vitality, organization, and resilience to provide a comprehensive framework for assessing ecosystem health. The VOR model is a classic ecosystem health assessment framework that has been used to assess the health of regional ecosystems in China, such as the Guangzhou [21] and Gaofeidian [22] ecosystems.
National parks represent a new approach to protecting and managing regional ecosystems in China that promises to enrich China’s nature reserve system [4]. Shennongjia National Park was established in 2016 [23] and preserves the most intact evergreen deciduous broad-leaved mixed forest in the Northern Hemisphere [24]. There is a need to conduct an assessment of the ecosystem’s health in Shennongjia National Park and use this assessment to make management recommendations. Here, we assessed ecosystem health in Shennongjia National Park using satellite remote sensing data from 2000 to 2018 based on the VOR model and the “Comprehensive Status-Change Trend” model [25]. Additionally, we used these data to analyze spatiotemporal characteristics from 2000 to 2018.

2. Materials and Methods
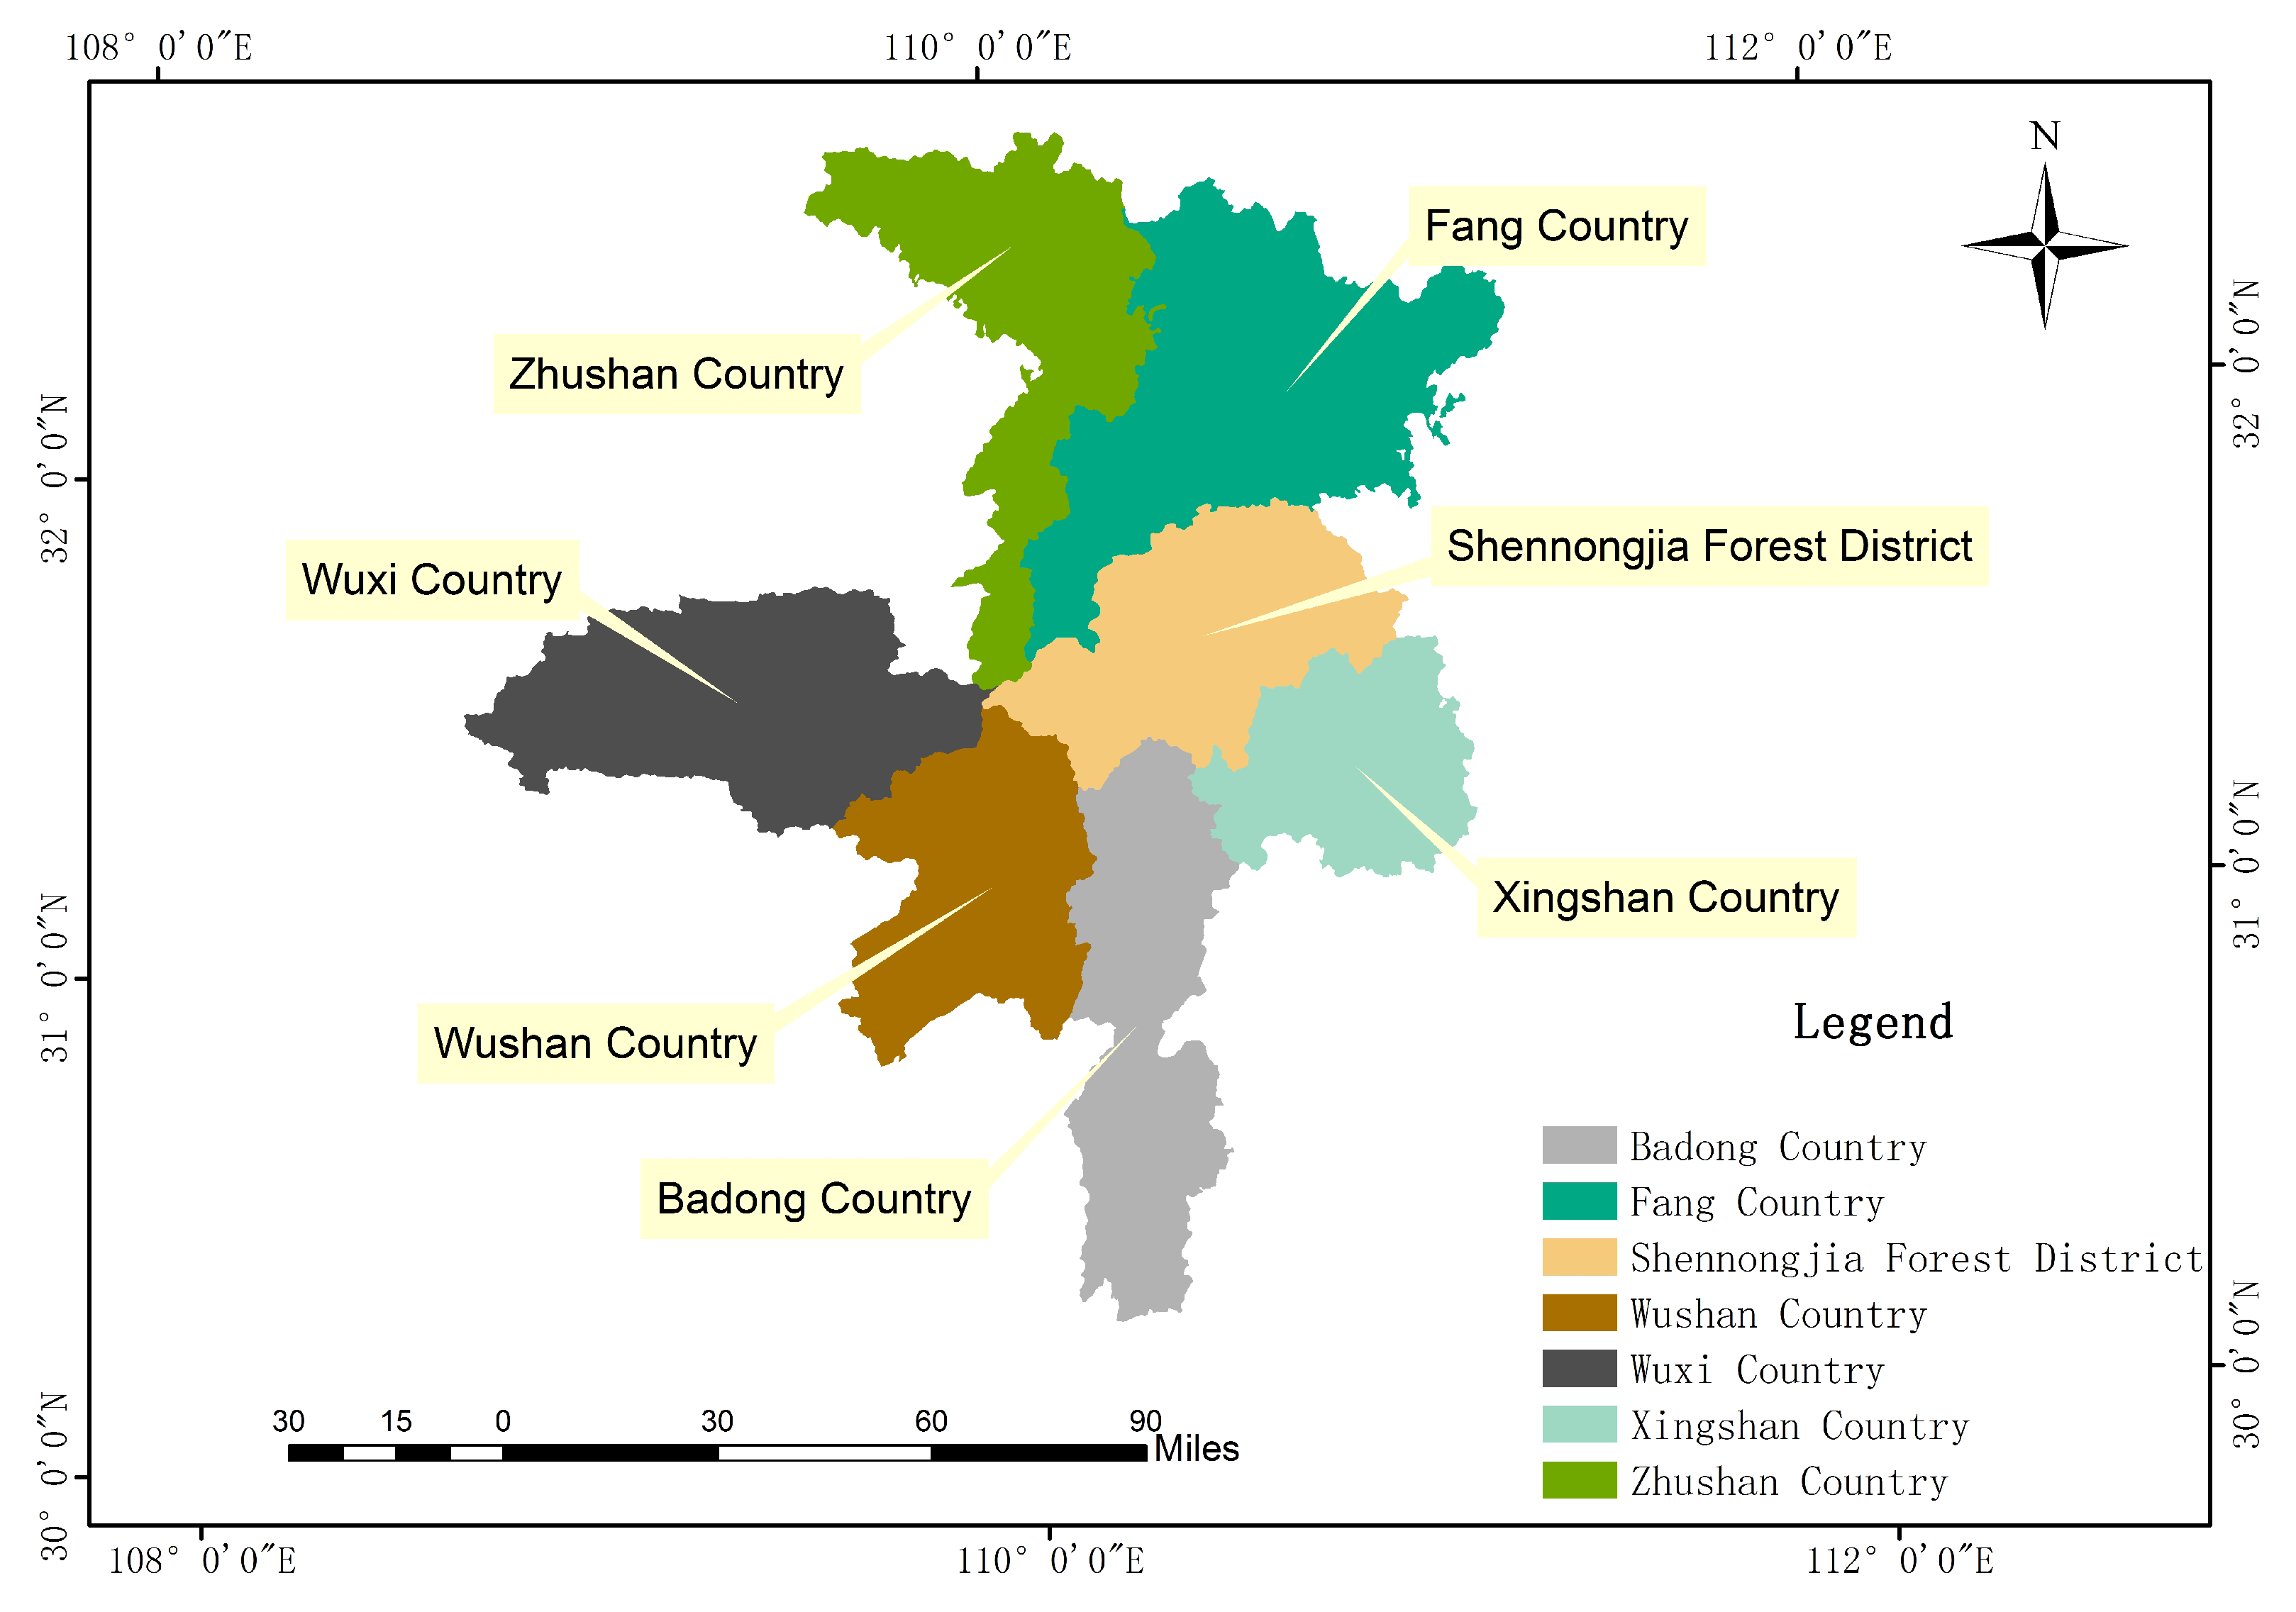
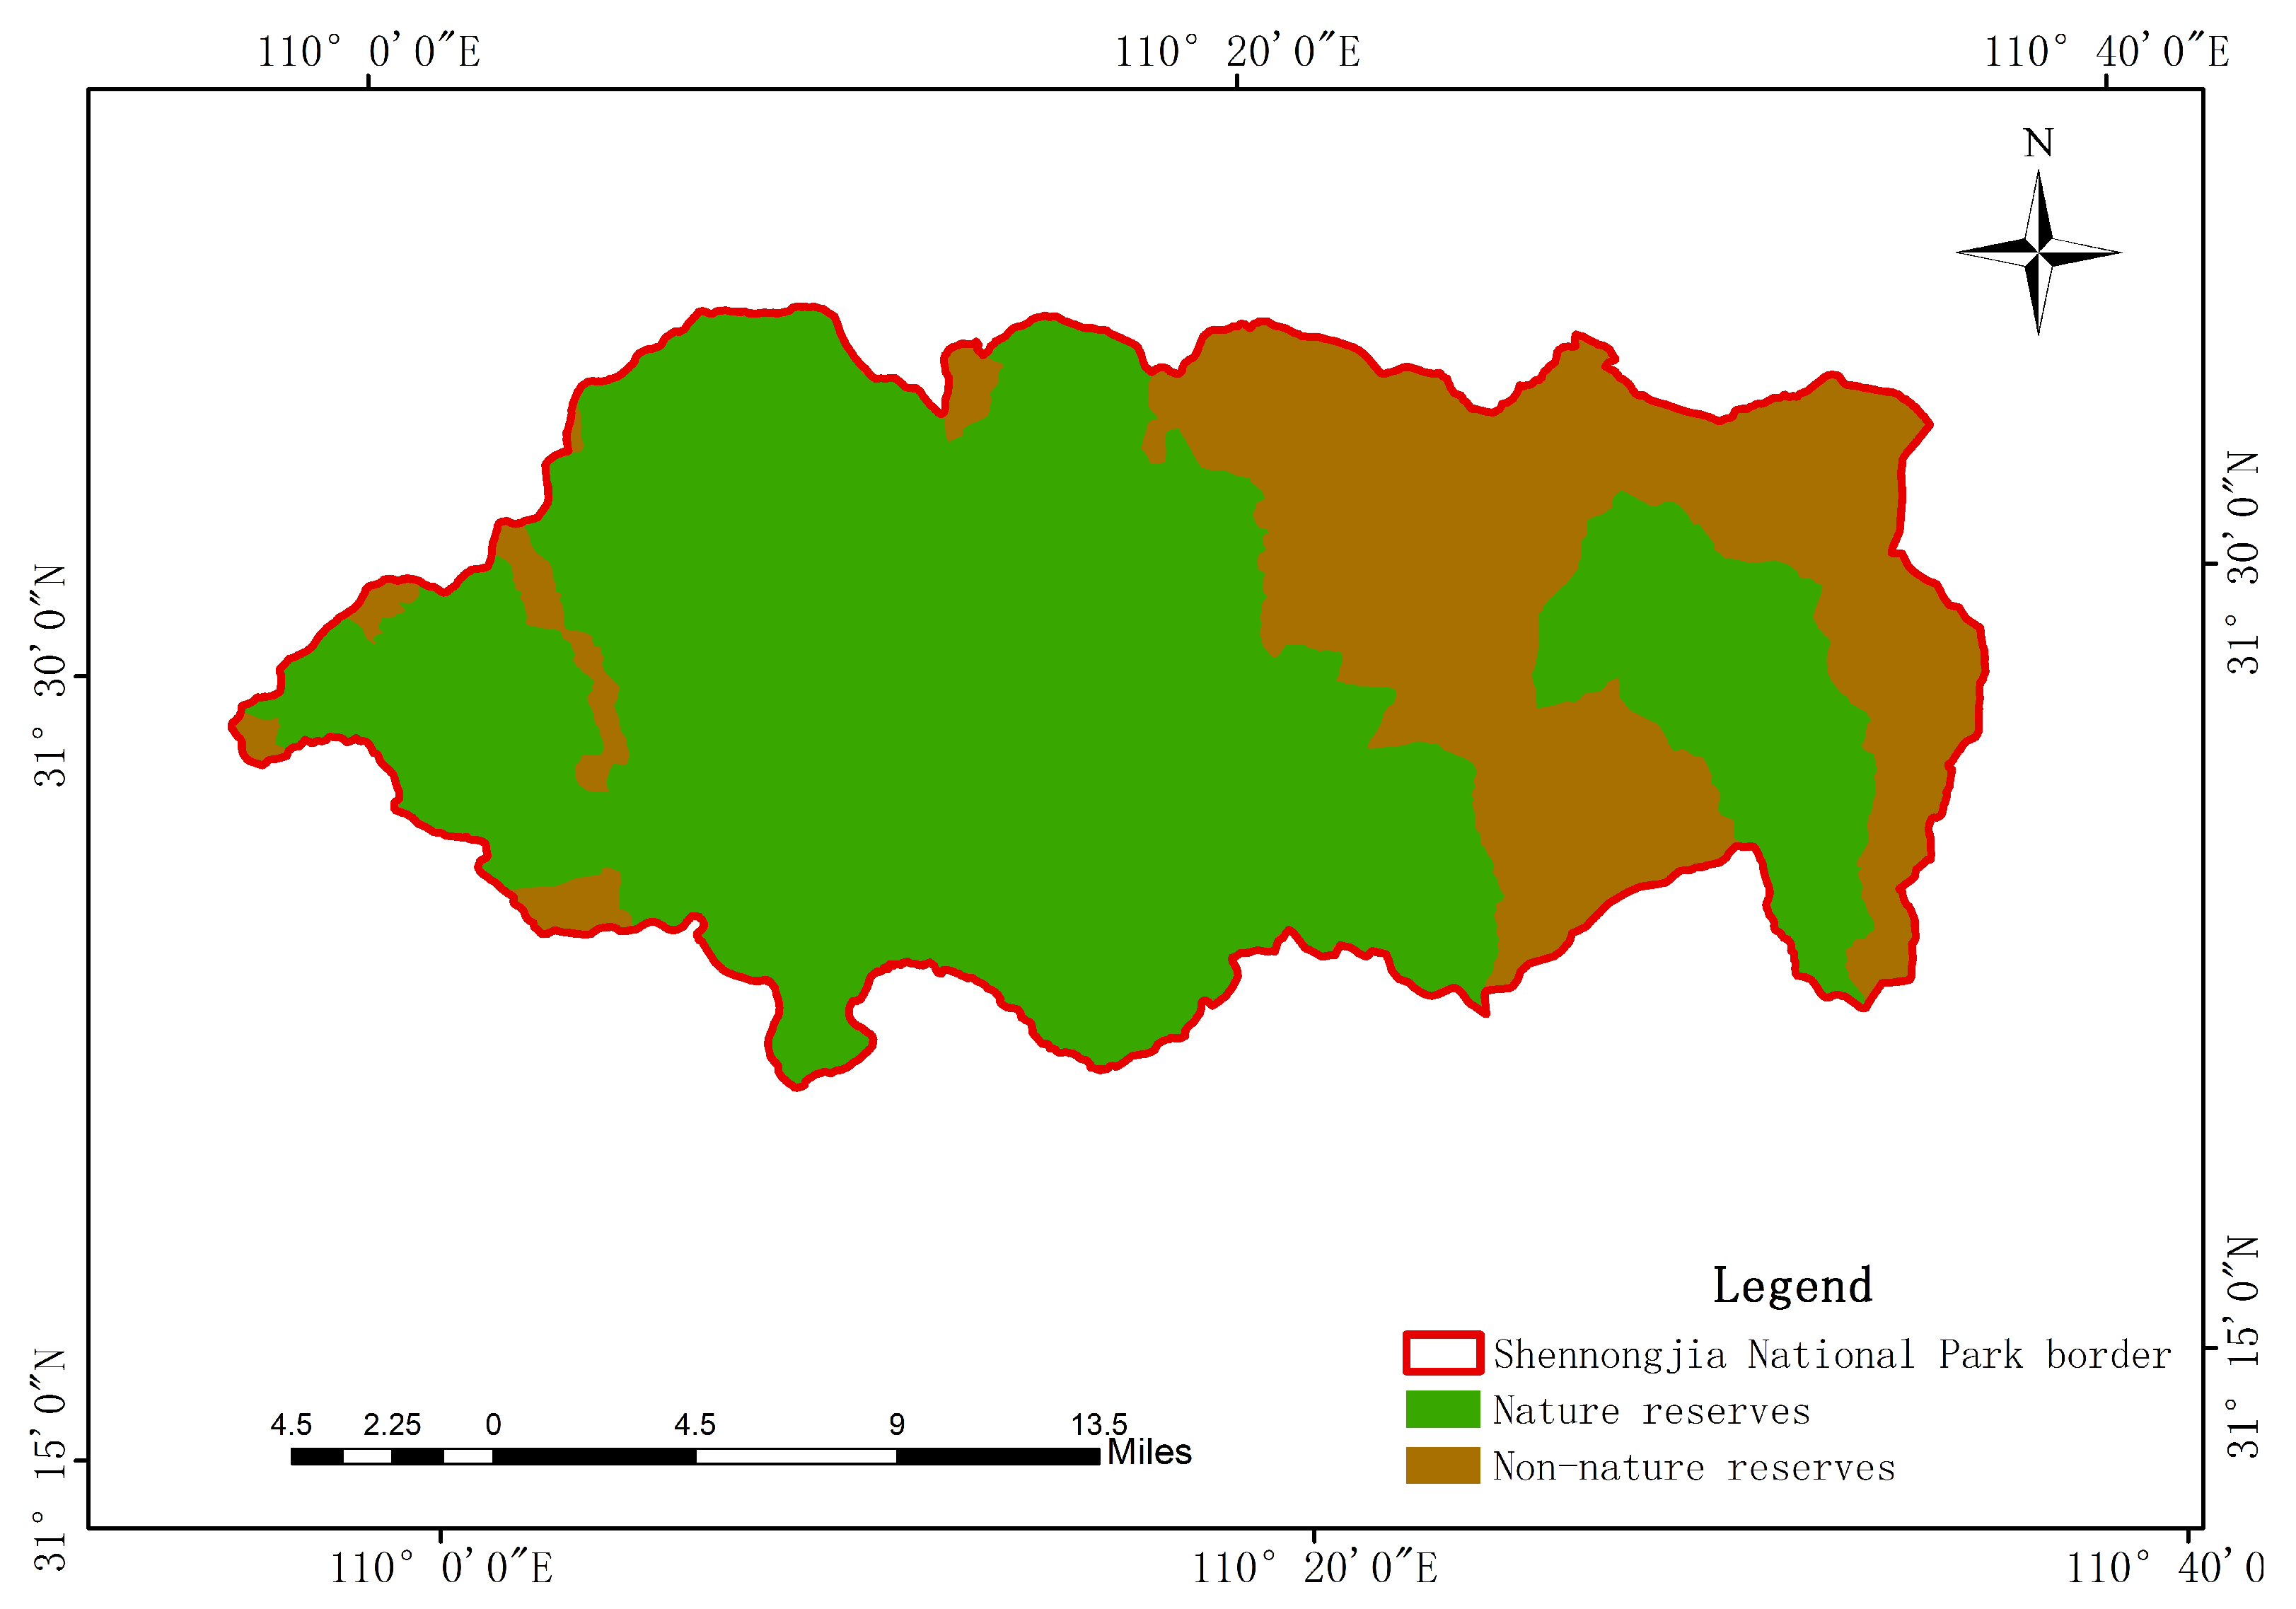
2.1. Study Area

Shennongjia National Park is located in northwestern Hubei Province in China, on the eastern end of the Qinba Mountains; the highest altitude is approximately 3105.4 m [26] (Figure 1). The east–west length of the study region is approximately 63.9 km, and the north–south width is approximately 27.8 km [27]; the total area is approximately 1170 km2 [23]. Shennongjia experiences a north subtropical monsoon climate and has four distinct seasons [28]. Shennongjia National Park also has more than 30 key national protected wild plants, such as Davidia involucrata and yew, and thus, has global significance for the protection of biodiversity. It also provides suitable habitats for several rare animal and plant species [29]. Within Shennongjia National Park, there is a National Nature Reserve, National Geological Park, Dajiuhu National Wetland Park, National Forest Park, World Natural Heritage Site, and Dajiuhu Provincial Nature Reserve. The overall integration of these areas reduces the gaps between these original protected areas [30]. Shennongjia National Park can be divided into four subareas based on its ecosystem services: strict protection areas, ecological conservation areas, recreational display areas, and traditional utilization areas [31].

2.2. Datasets

Many types of geographical and remote sensing data were used in this study. Geographical data primarily included boundary and subarea data of Shennongjia National Park and boundary data of the types of nature reserves within Shennongjia National Park.
Remote sensing data primarily included the Normalized Difference Vegetation Index (NDVI) and land use data. Original NDVI data from 2000 to 2018 were provided by the Institute of Geographic Sciences and Natural Resources Research, Chinese Academy of Sciences. Ground-measured data of the Leaf Area Index (LAI) were from measurements taken by a previous study (Wang Lihui 2013 [32]). Land use was divided into seven types: forestland, grassland, wetland, farmland, residential land, industrial and mining transportation land, and bare land. Land use data from 2000 and 2010 were provided by the Satellite Environment Application Center, Ministry of Ecology and Environment of the People’s Republic of China. With the 2010 image and 2017 16-m and 2-m resolution GF-1 satellite images, the 2017 land use data were generated by interpreting the land use change area, extracting the area where the land use had not changed, and using spatial overlay analysis. According to the ratio of the area of six ecosystem types, classification accuracy tests were conducted by stratified random sampling. A total of 500 sampling points were used and the overall accuracy was approximately 91.6% (Table 1).

2.3. Analysis Methods

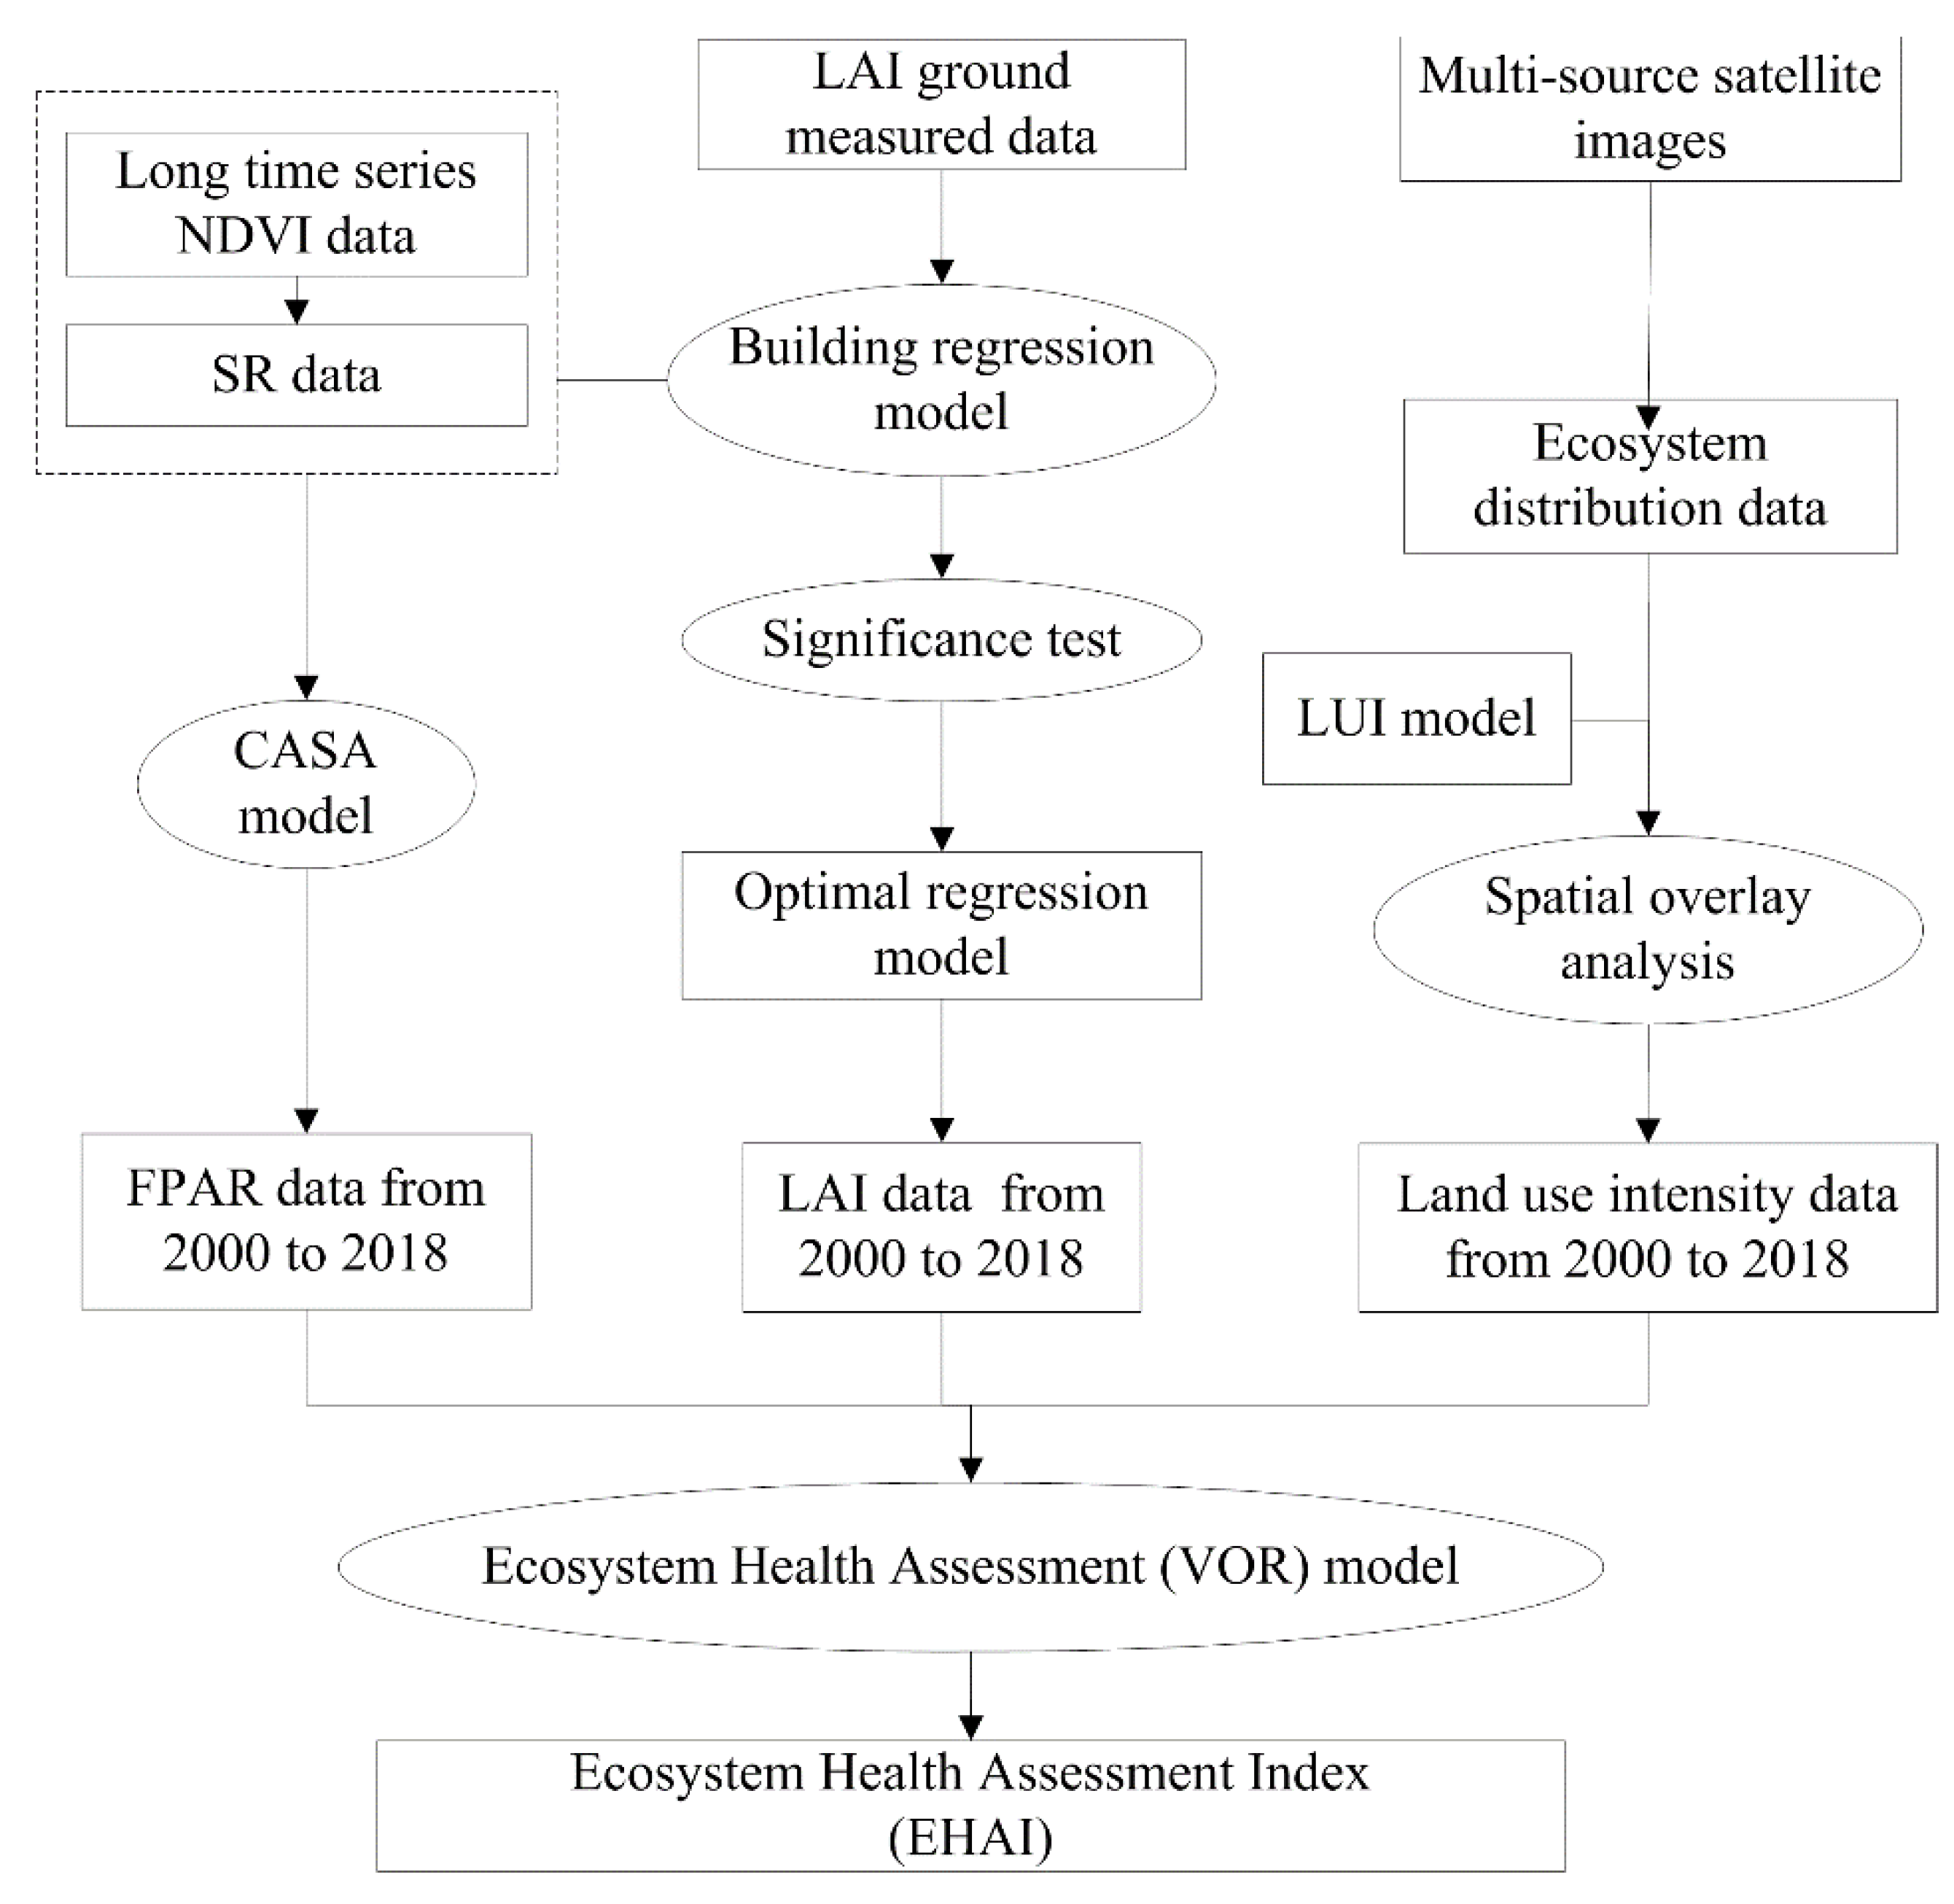
2.3.1. Ecosystem Health Assessment Model

The Ecosystem Health Assessment Index (EHAI) was established to assess the Shennongjia National Park ecosystem, which was based on the VOR model and considered the ecological significance and the availability of parameter data. The EHAI model of ecosystem health assessment was as follows:
EHAI = FPAR × LAI × 1 LUI
where FPAR is the fraction of photosynthetic active radiation of the ecosystem and represents the vitality of the ecosystem; LAI is the leaf area index and represents the organization of the ecosystem. Thus, FPAR and LAI are positive indicators. LUI is land use intensity and represents the resilience of the ecosystem. Thus, LUI is a negative indicator: greater values of LUI correspond to weaker ecosystem resilience.
Several statistical parameters, including the average, standard deviation, and the reciprocal of the coefficient of variation, were used to evaluate differences between the overall area, different functional areas of Shennongjia National Park, and the effectiveness of the protection of nature reserves from 2000 to 2018. For calculations of long-term patterns in the EHAI data, land use data from 2000 were used to represent the period from 2000 to 2006, data from 2010 were used to represent the period from 2007 to 2012, and data from 2017 were used to represent the period from 2013 to 2018. The goal of this analysis was to elucidate spatiotemporal changes in the health of the Shennongjia National Park ecosystem and understand the factors affecting these changes. The specific technical process is shown in Figure 2.

2.3.2. Evaluation Parameters

FPAR is an important parameter of the biogeochemical model, net primary productivity model, and crop growth model [33], and is a measure of ecosystem activity, metabolism, or primary productivity [34]. We used the Carnegie-Ames-Stanford approach (CASA) model, along with the NDVI and SR vegetation indices, to estimate photosynthetic effective radiance [35].
LAI is an important physiological parameter that describes vegetation canopy structure [36]. It has a significant impact on light distribution, light energy utilization, and the yield of the community, and is closely related to vegetation coverage [37]. Therefore, this parameter was used in this study to characterize ecosystem organization. This study primarily used the method of NDVI, SR, and LAI to measure point data to establish the best statistical model for the inverse of the LAI of the long-term series. Based on a comparative evaluation with ground-measured data in 2011, the power function regression model established between NDVI and LAI had the strongest correlation. The statistical model for LAI was the following:
LAI = 11.105 × x 5.733
An accuracy test was conducted by setting the LAI measured values of the verification points and the predicted values of the best statistical model. The linear equation between the model predicted value and the measured value was high: R2 was 0.998, and the P-value was 0.021, indicating that the accuracy of the model was high. Therefore, this best statistical model was used to take the inverse of the LAI of the study area from 2000 to 2018.
LUI is a quantitative expression of the degree of human activities that interfere with the landscape and reflects the impact of human activities on the natural ecosystem [38]; we thus used LUI to represent the resilience of the ecosystem. We used a previously described comprehensive analysis method of grading, assigning, modeling, and quantifying to calculate LUI [39,40]; land use intensity was classified according to land use type. In landscape ecology, sampling areas are ideally made to be at least 2- to 5-times the average patch area of the study area [41]; based on the number of patches of land use for many years, the sampling area was set to 0.6 × 0.6 km. Integrated land use data of 2000, 2010, and 2017 and grid data of the sampling area through spatial overlay analysis were used to generate 2000, 2010, and 2017 land use intensity data using the land use intensity calculation model.

3. Results

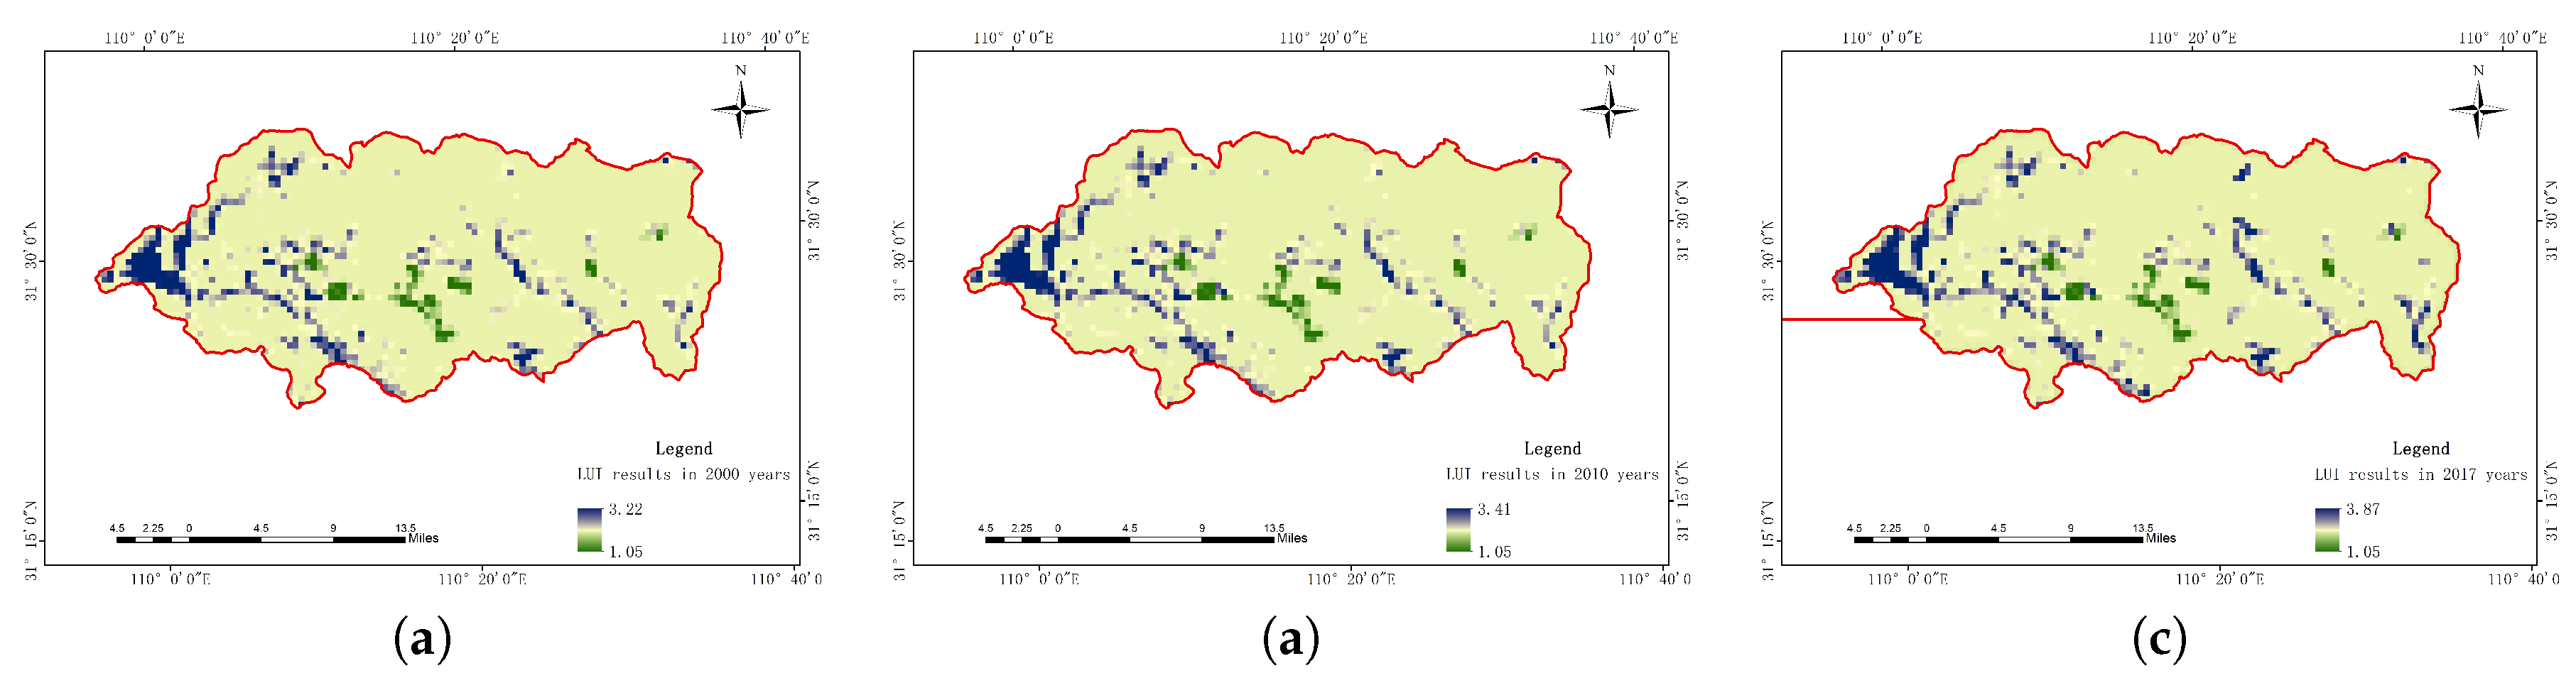
3.1. Overall Change in Shennongjia National Park

3.1.1. Characteristics of Ecosystem Health Changes

The EHAI statistics from 2000 to 2018 are shown in Figure 3. The EHAI average of Shennongjia National Park ranged from 0.92 to 1.40; the overall fluctuation range was small and the linear rate of change was 0.02, indicating that the health of the ecosystem has gradually improved. From 2016 to 2018, the linear rate of change was 0.05, which is 2.5-times the overall linear rate of change. The overall linear rate of change was 0.02 for the standard deviation of EHAI, indicating that the stability of ecosystem health has weakened. From 2000 to 2012, the linear rate of change was −0.003, indicating that the stability of ecosystem health slightly increased during this period. The linear rate of change from 2012–2013 to 2013–2018 of the standard deviation of EHAI changed from 0.34 to −0.04, indicating that the stability of ecosystem health from 2012 to 2018 gradually improved during this period. The reciprocal of the coefficient of variation of EHAI fluctuated within a certain range from 2000 to 2011 and showed a linear rate of change of 0.08, indicating that ecosystem health slightly increased during this period. The linear rate of change between 2011 and 2014 was −0.90, indicating that the improvement in ecosystem health was reduced during this period. The linear rate of change between 2014 and 2018 was 0.17, an increase of 112.5% compared with 2000–2011, indicating that the health of the ecosystem increased during this period.
The EHAI statistics for the three periods of 2000–2006, 2007–2012, and 2013–2018 are shown in Figure 4. The linear rate of change of the overall EHAI average was 0.12, and the overall health of the ecosystem increased. From the first (2000–2006) to second (2007–2012) period and from the second (2007–2012) to third (2013–2018) period, the linear rate of change of the EHAI standard deviation changed from −0.008 to 0.19, indicating that the stability of ecosystem health was initially stable but then decreased. The linear rate of change of the reciprocal of the coefficient of variation of EHAI in the three periods changed from 0.28 to −1.27, indicating that ecosystem health initially increased and then later decreased.

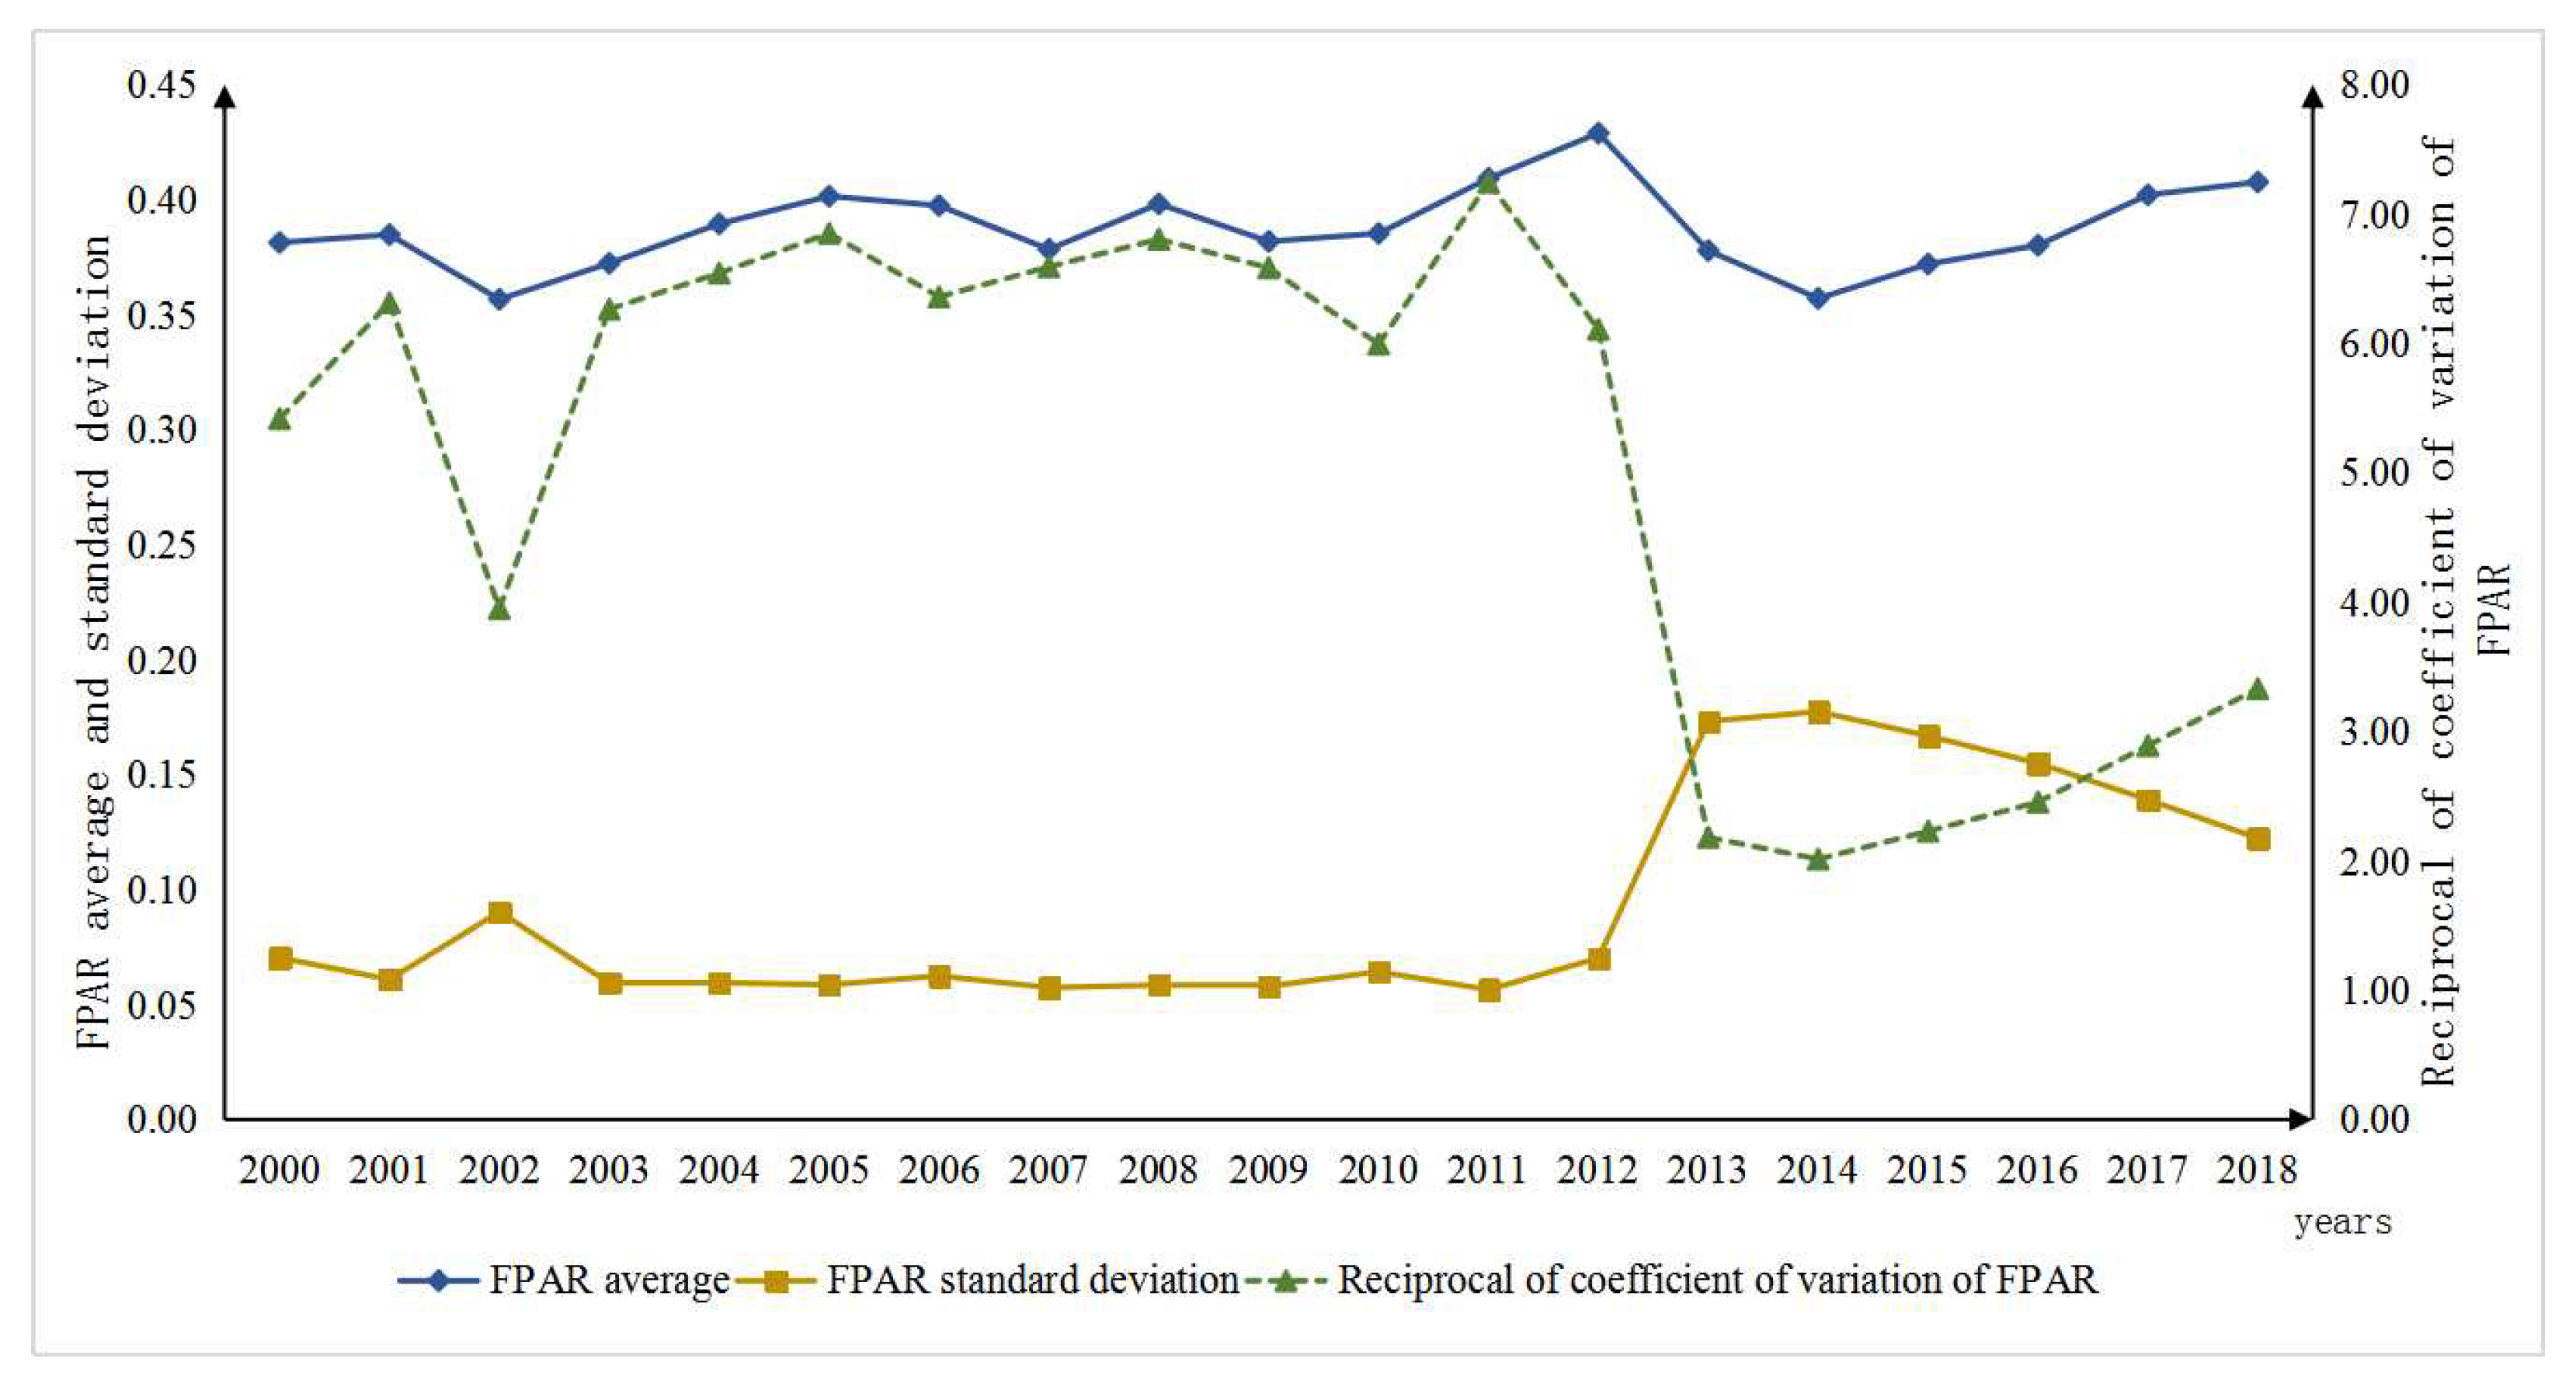
3.1.2. Changes in Ecosystem Vitality

The FPAR statistics from 2000 to 2018 are shown in Figure 5. The FPAR average changed from 0.35 to 0.41, and the linear rate of change was 0.0007; ecosystem vitality remained basically unchanged. The linear rate of change of FPAR standard deviation from 2000 to 2012 was −0.0007; in other words, the stability of ecosystem activities remained basically unchanged. From 2012–2013 to 2013–2018, its linear rate of change changed from 0.1 to −0.01, indicating that the stability of ecosystem vitality from 2012 to 2018 gradually improved. The overall fluctuation from 2000 to 2012 in the reciprocal of the coefficient of variation of FPAR was small (except in 2002), and the linear rate of change was 0.1, indicating that the apparent change in the improvement of ecosystem vitality slightly increased. The linear rate of change from 2012 to 2014 was −2.05. The linear rate of change from 2014 to 2018 was 0.33, an increase 2.3-times higher relative to the linear rate of change for the period from 2000 to 2012, indicating that the rate of increase had grown. From 2012 to 2018, the apparent degree of improvement of ecosystem vitality gradually changed from weak to strong.

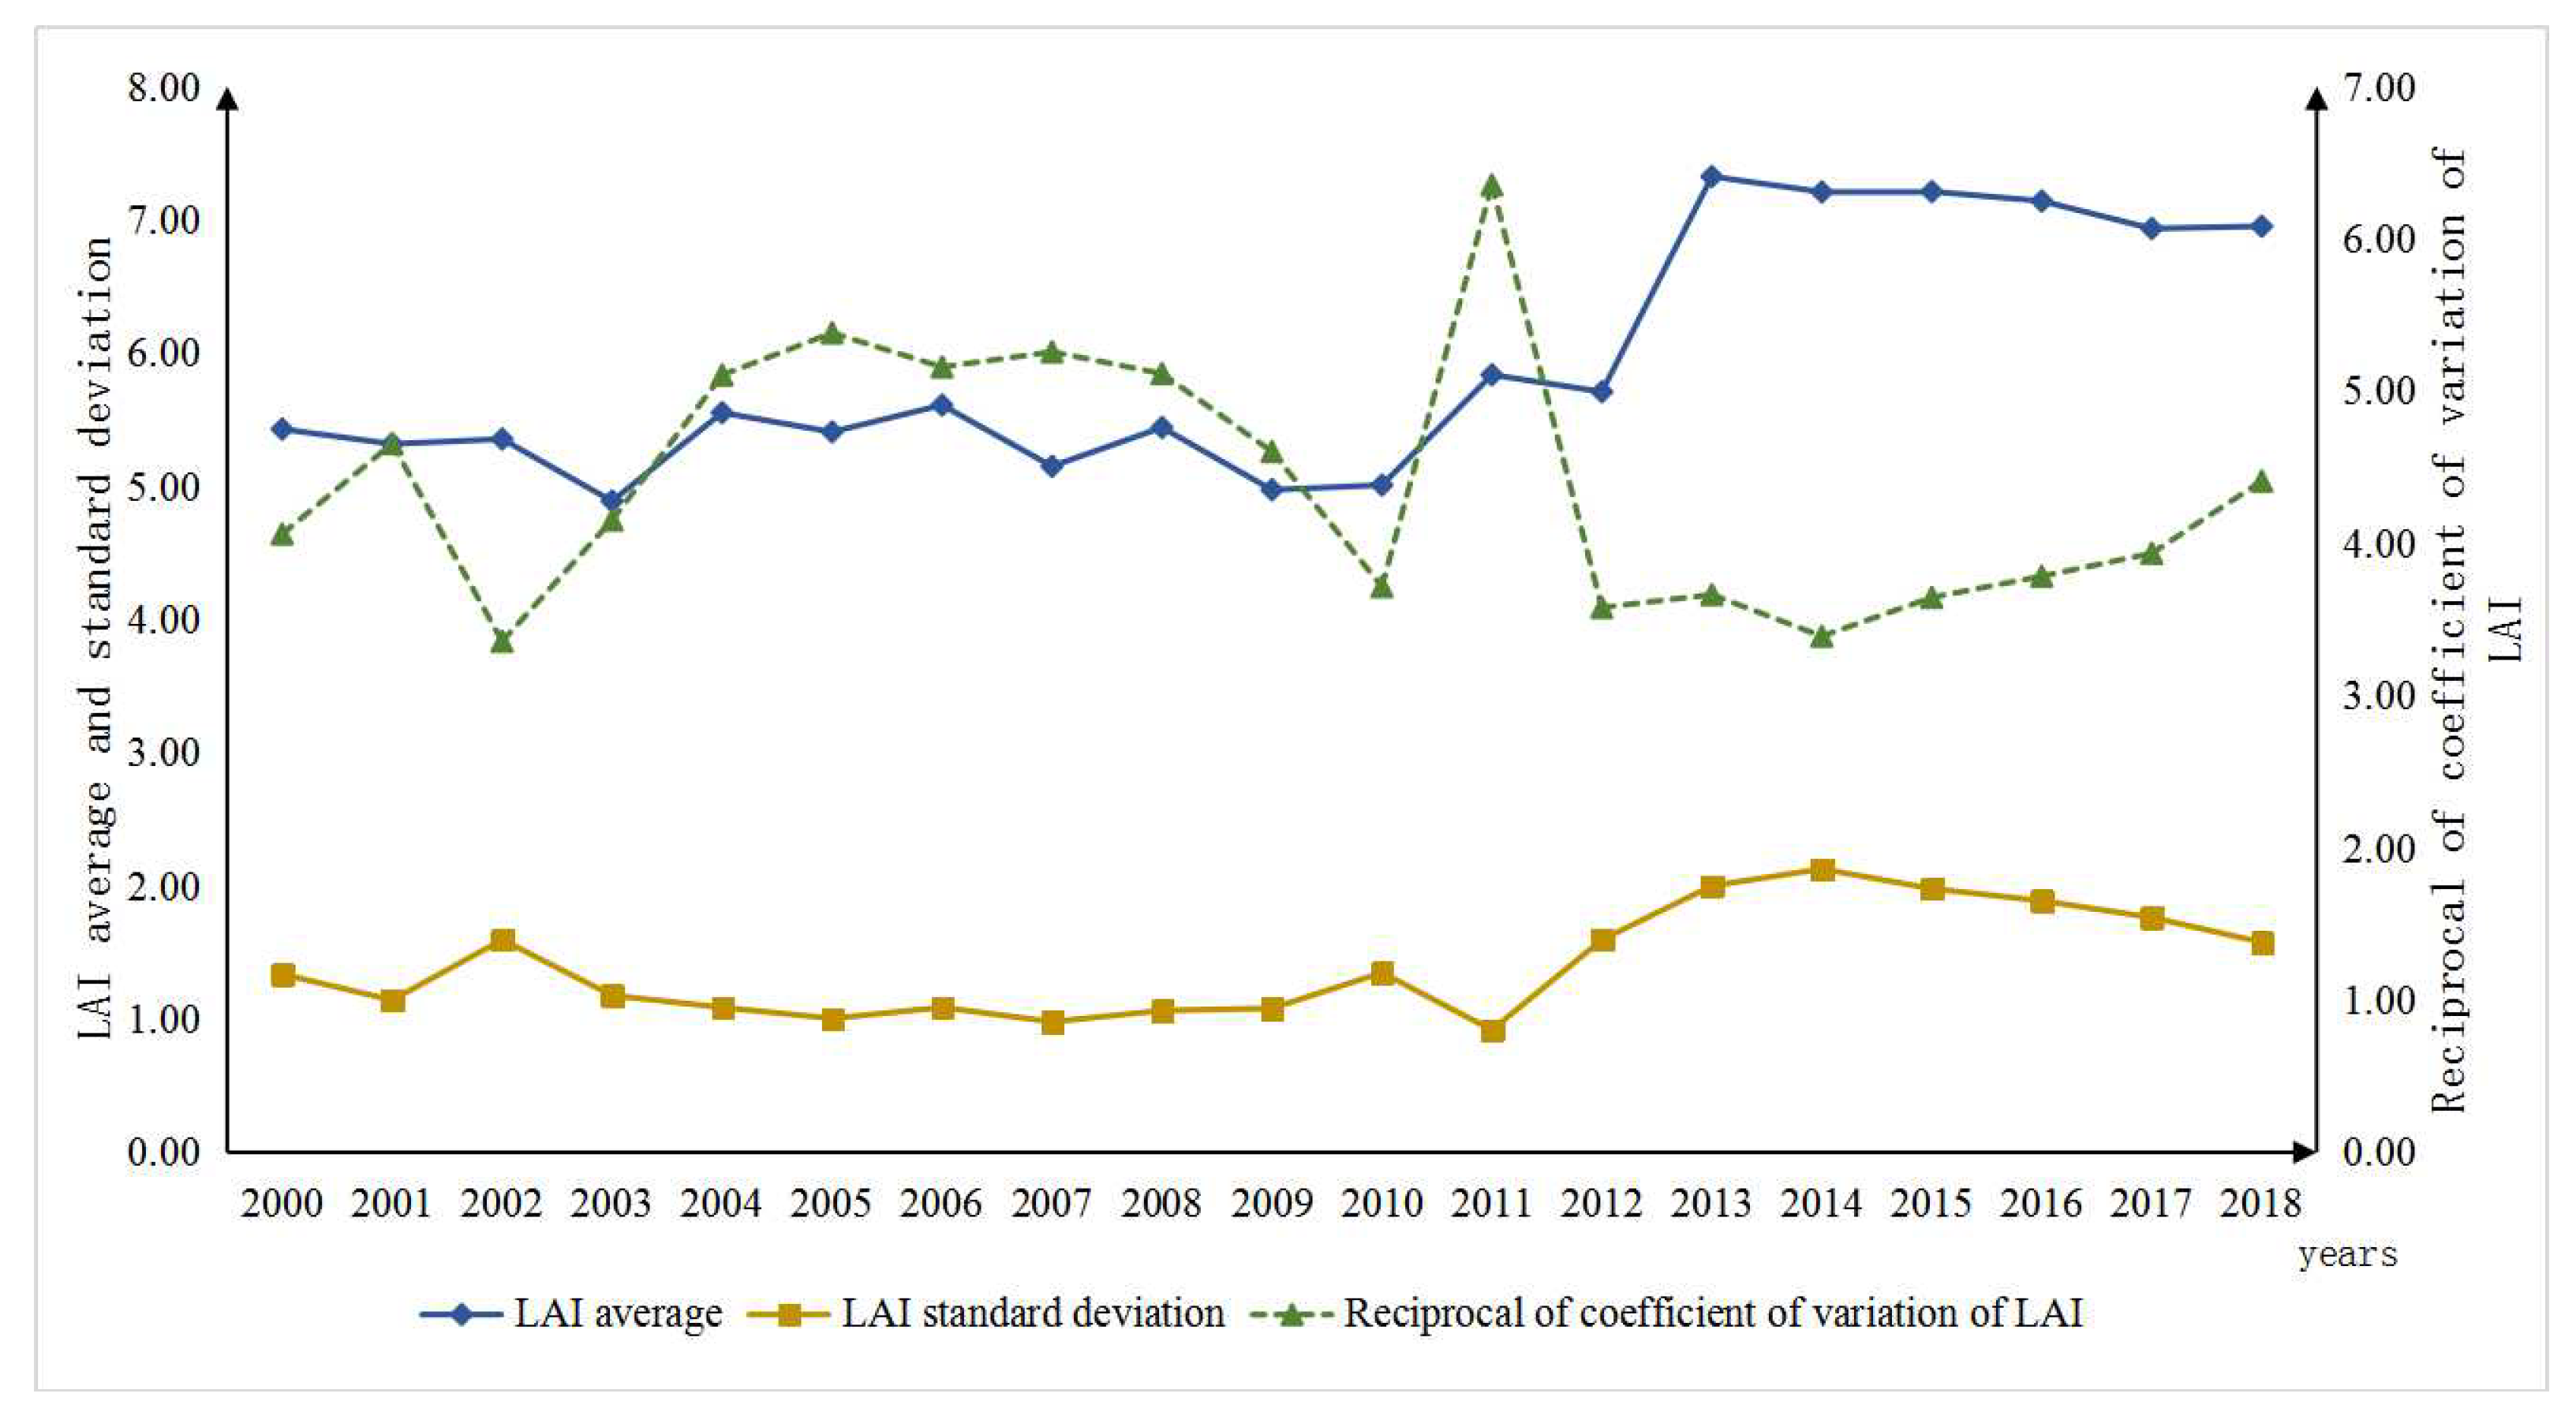
3.1.3. Changes in Ecosystem Organization

The LAI statistics from 2000 to 2018 are shown in Figure 6. The average LAI fluctuated between 4.97 and 7.33, and its linear rate of change was 0.12, indicating that ecosystem organization gradually improved. The standard deviation of LAI revealed that ecosystem organization gradually weakened, and the rate at which it weakened was 0.04. The linear rate of change from 2000 to 2011 was −0.03, and the stability of the ecosystem’s organization was enhanced. The linear rate of change from 2011 to 2014 was 0.40, and the rate of stability weakening was 1.33-times the overall rate. From 2014 to 2018, the linear rate of change was −0.13, and the stability of the ecosystem’s organization gradually improved. The linear rate of change for the reciprocal of the coefficient of variation of LAI from 2000 to 2010 was 0.05, and ecosystem organization improved significantly. From 2011 to 2012, the linear rate of change was −2.77, and the degree of improvement initially increased and then decreased. The linear rate of change from 2012 to 2018 was 0.12, and the increase in the improvement of ecosystem organization strengthened.

3.1.4. Changes in Ecosystem Resilience

LUI statistics of 2000, 2010, and 2017 are shown in Figure 7. From 2000 to 2017, the change in regional LUI was relatively small. LUI in the western region of Shennongjia National Park was relatively high, indicating that ecosystem resilience was relatively low. LUI in the central region was relatively small, indicating that ecosystem resilience was relatively high. The time-varying characteristics of the evaluation statistics revealed that the linear rate of change of the LUI average was 0.002, and the ecosystem resilience level improved slightly. The linear rate of change for the standard deviation of LUI was 0.006, and the stability level increased slightly. The linear rate of change for the reciprocal of the coefficient of variation of LUI was −0.56, and the degree of recovery of the ecosystem weakened.

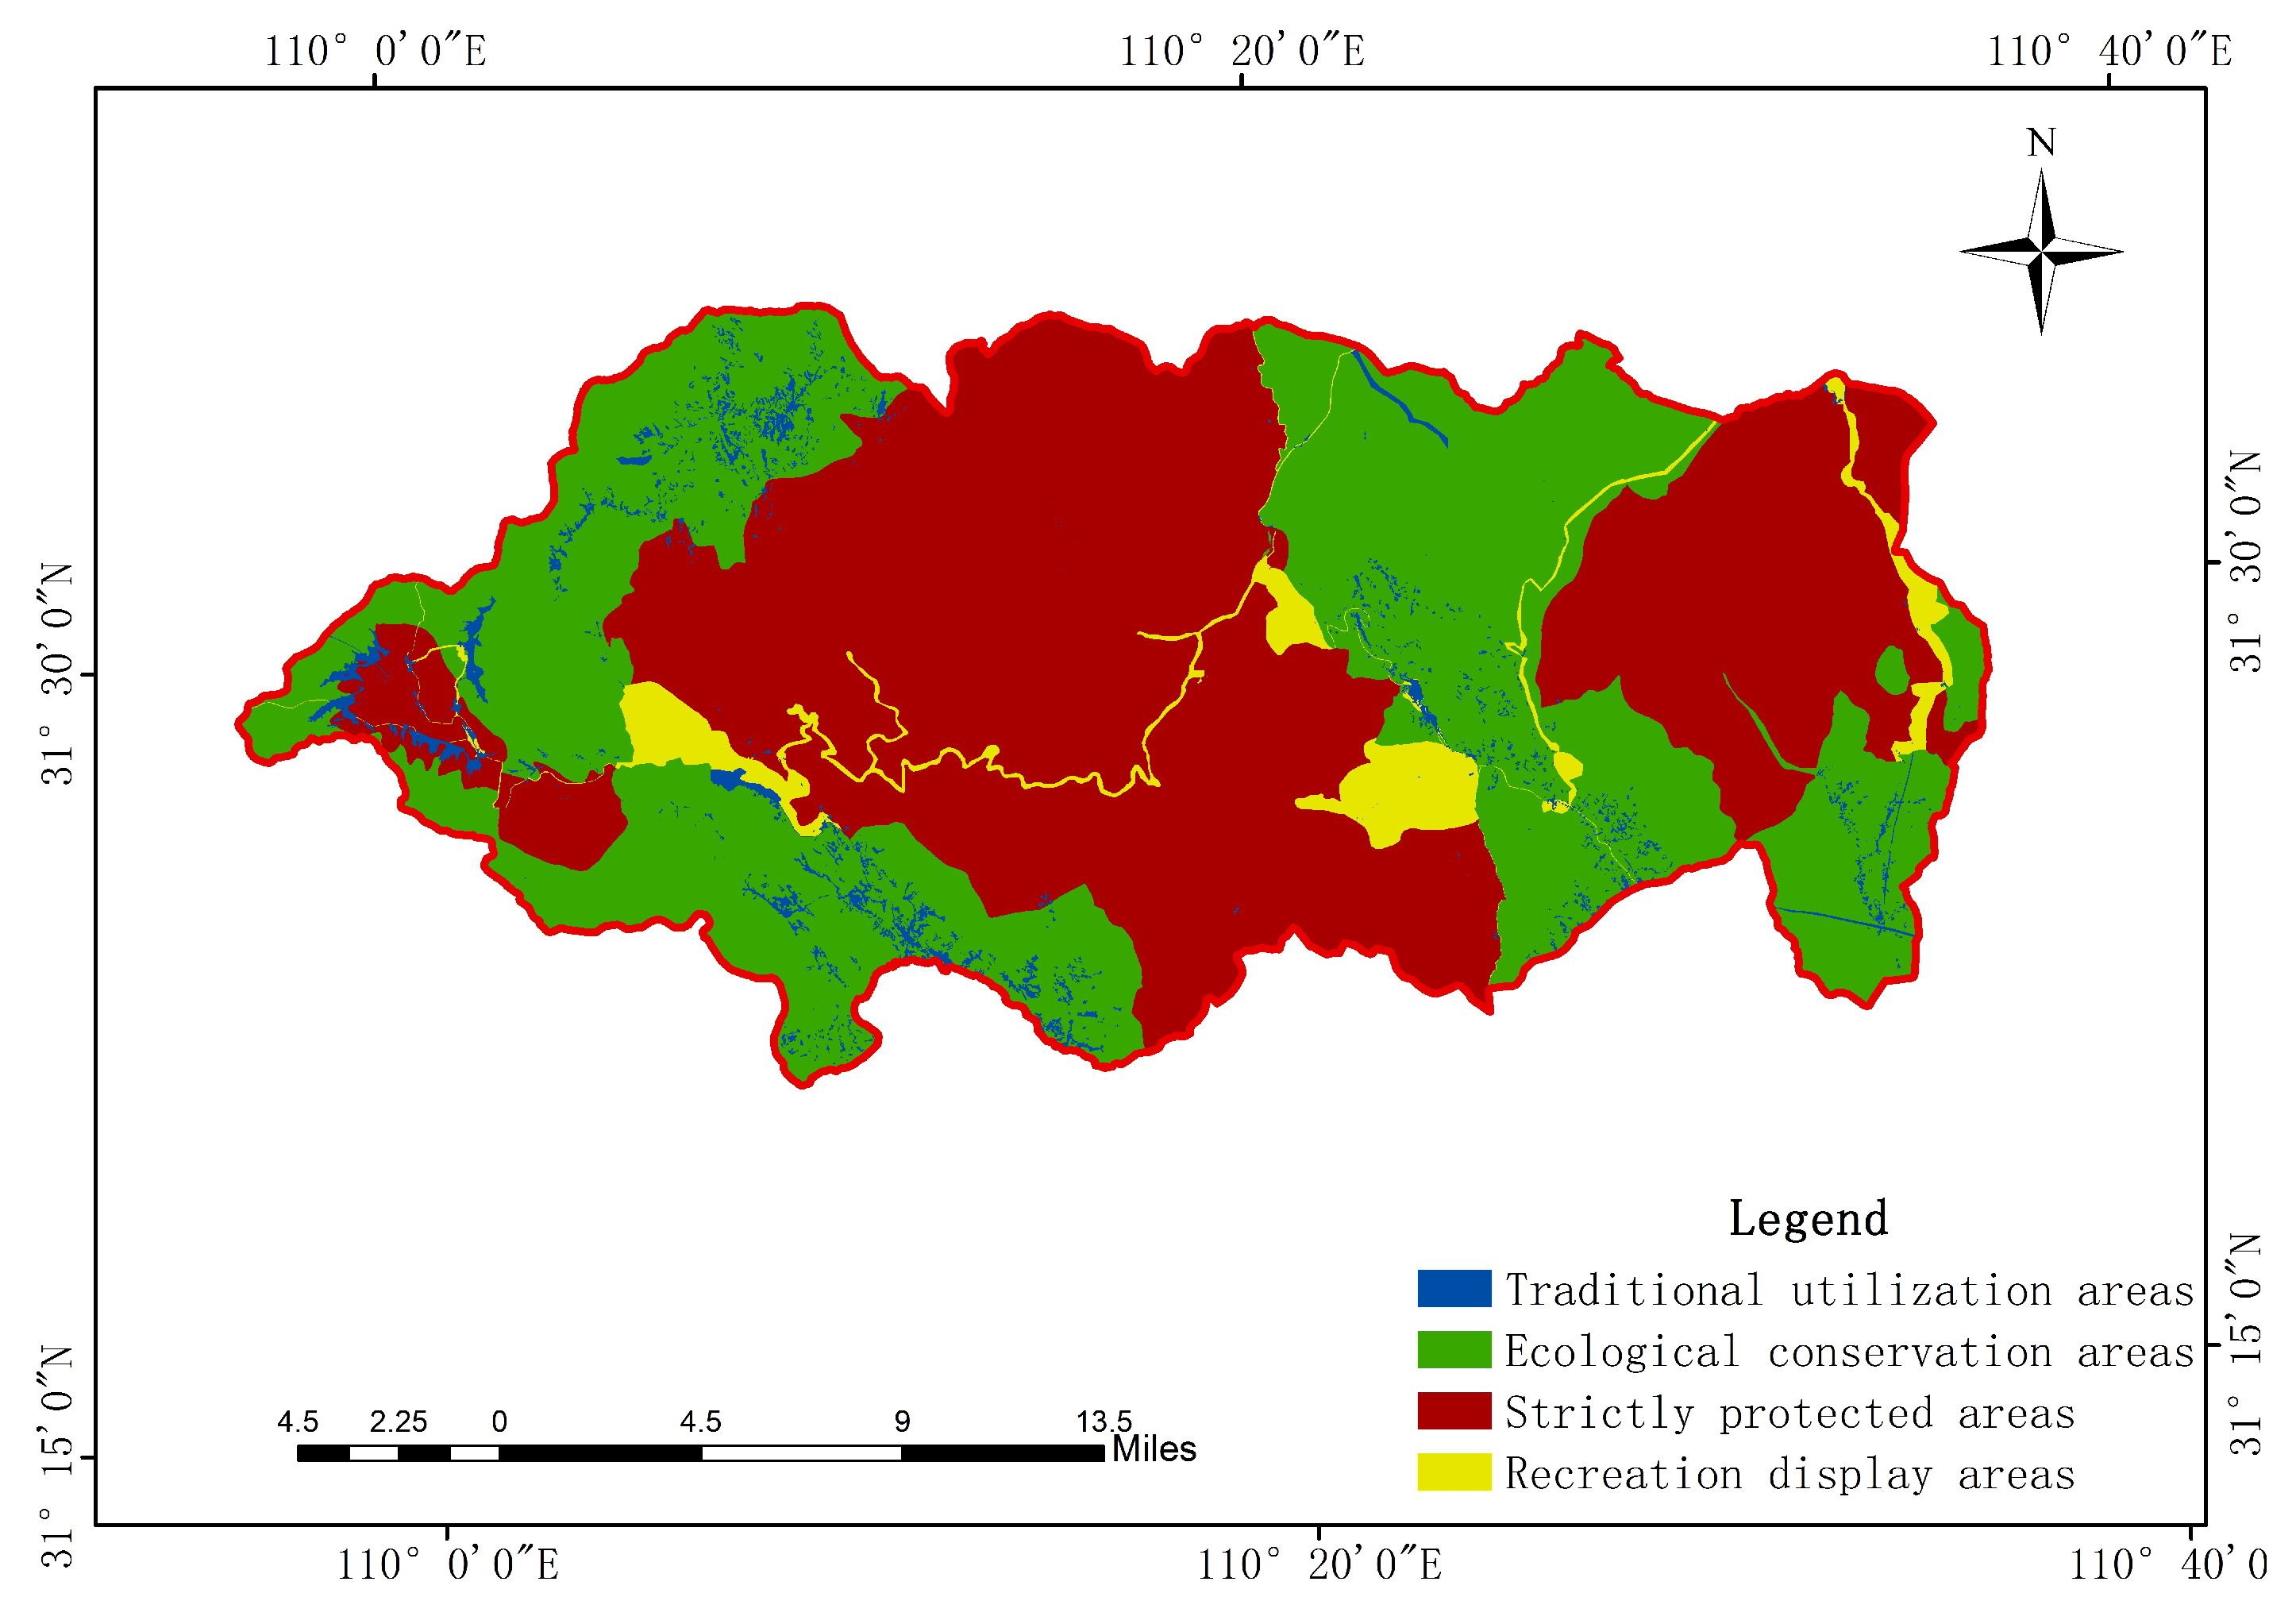
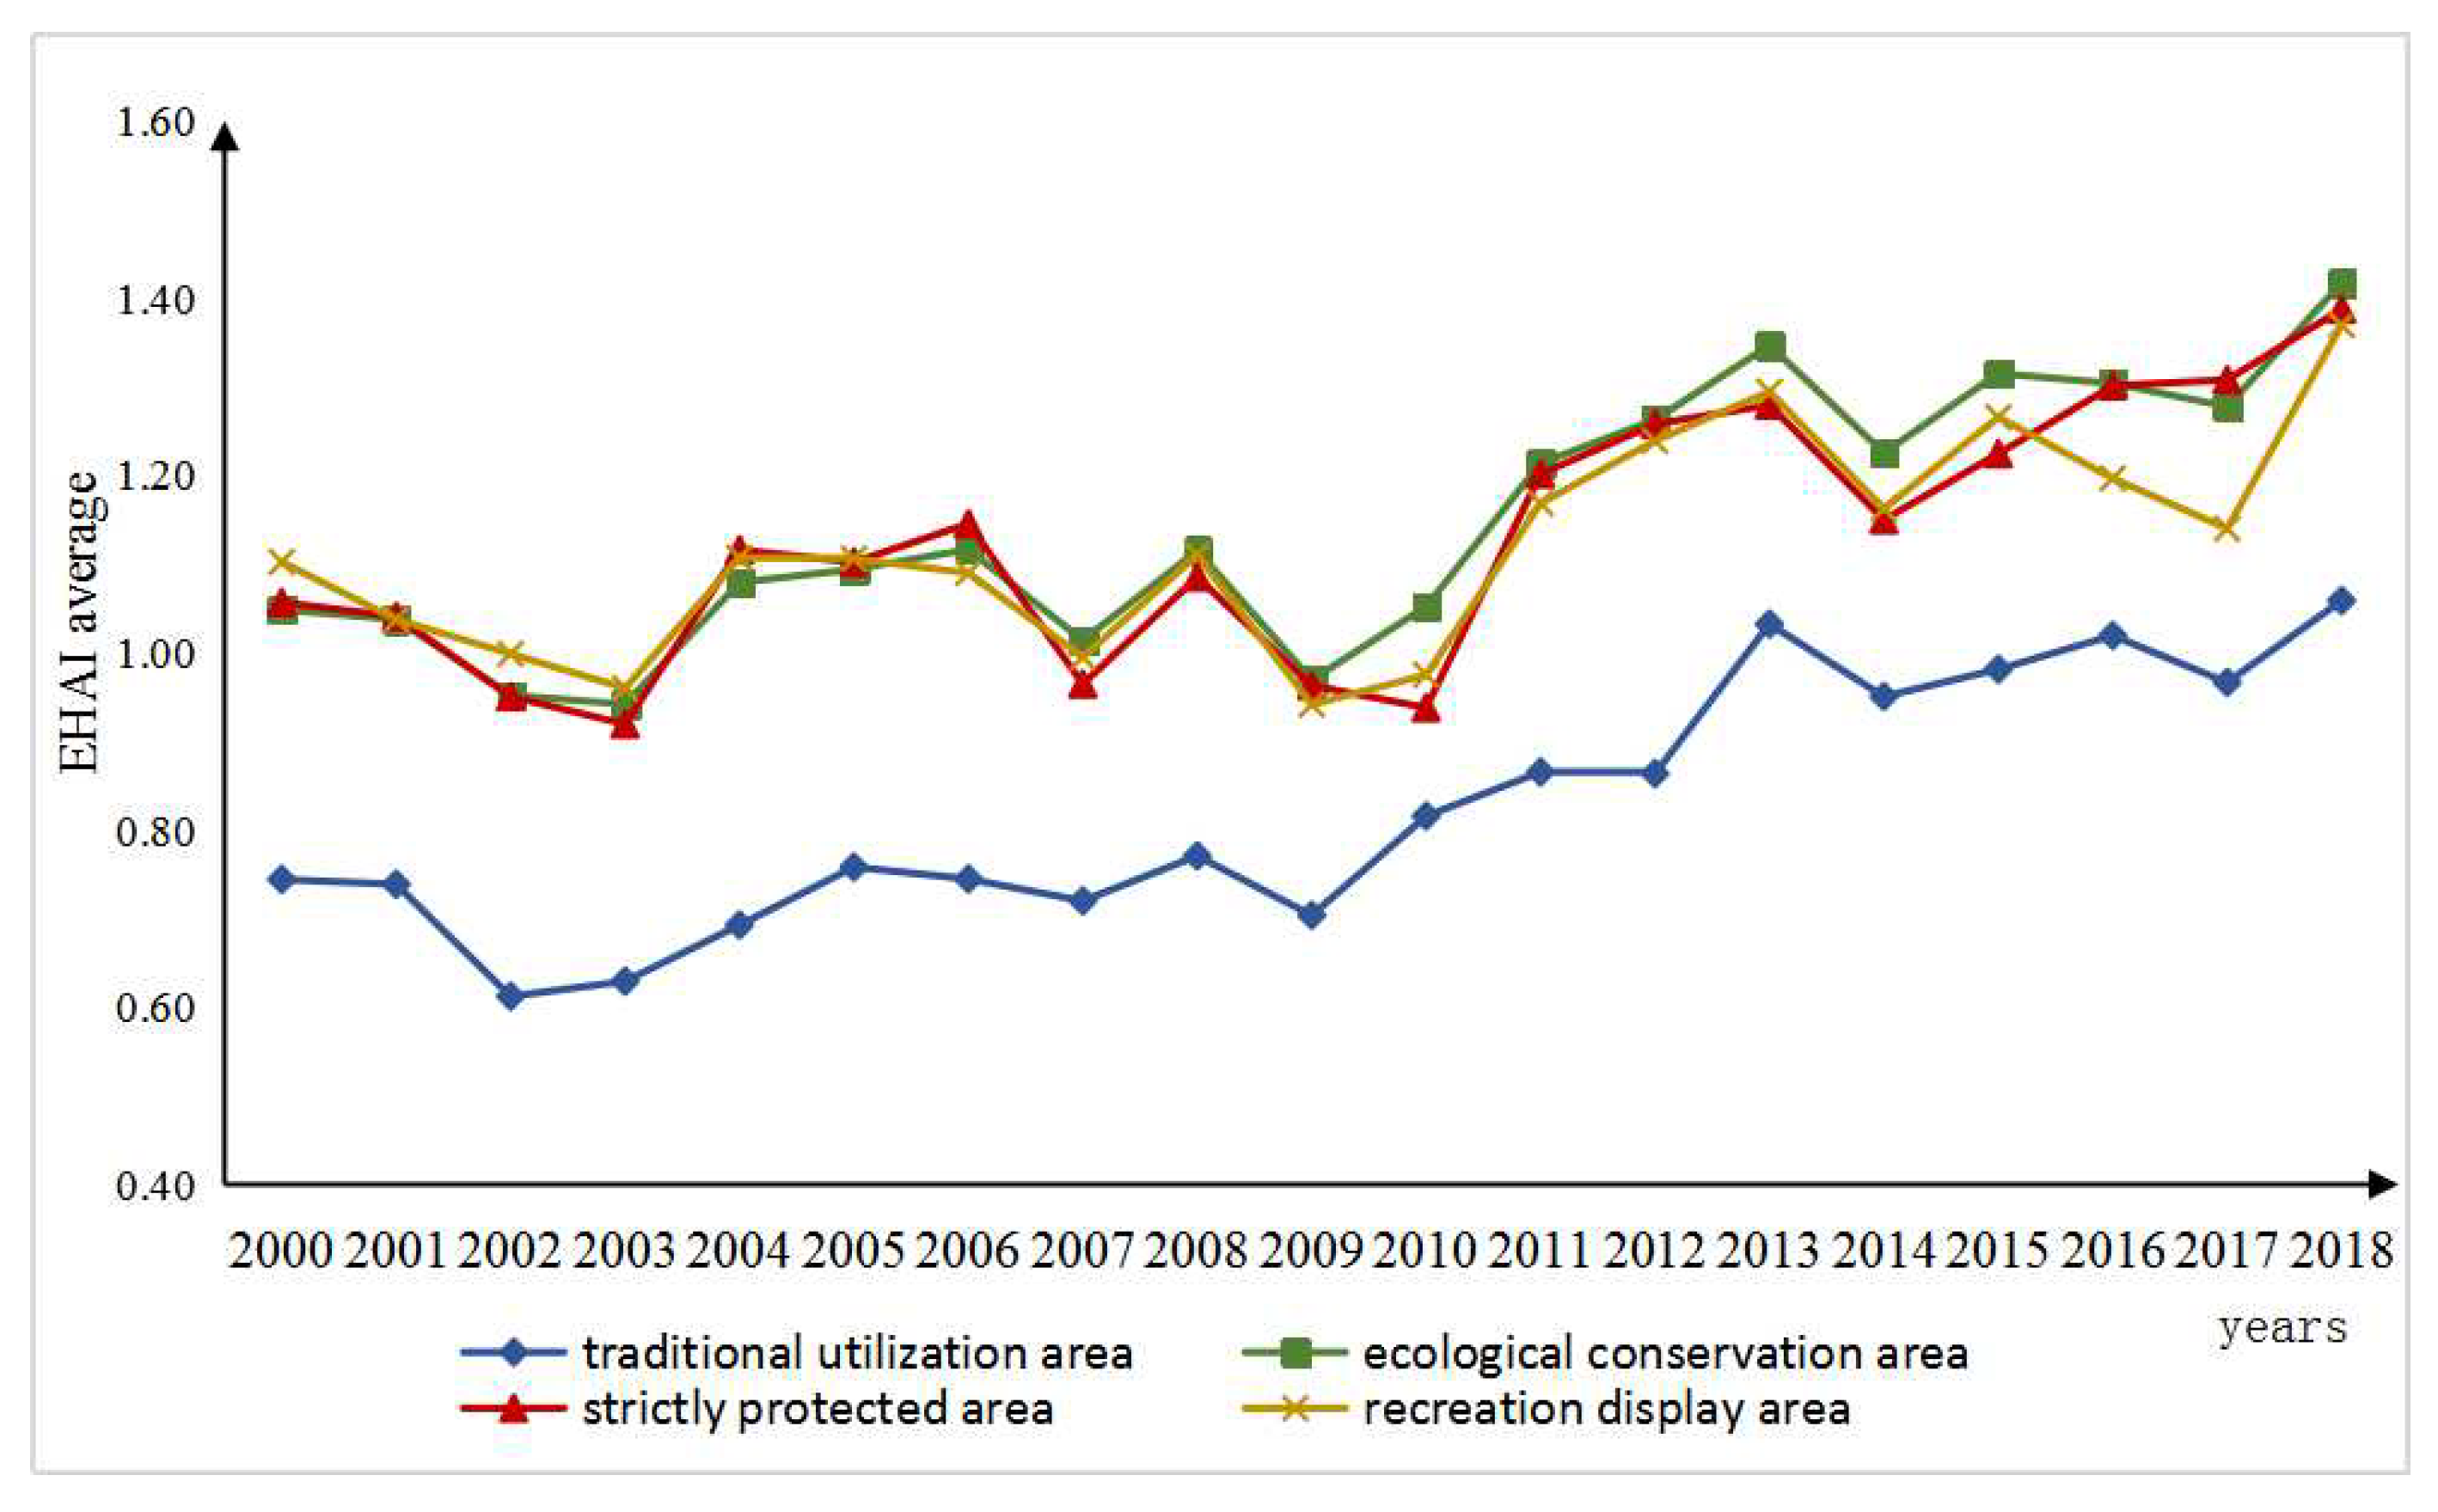
3.2. Changes in Different Functional Areas of Shennongjia National Park

According to the divisions of the different functional areas of Shennongjia National Park (Figure 8), the EHAI average of each functional area in Shennongjia National Park from 2000 to 2018 is shown in Figure 9. From 2000 to 2018, the linear rates of change of the EHAI average of traditional utilization areas, ecological conservation areas, strict protection areas, and recreation display areas were 0.022, 0.022, 0.019, and 0.014, respectively. Thus, the overall level of ecosystem health in the functional areas gradually improved. The EHAI average in the traditional utilization area was lower than that of the other three functional areas. The levels of ecosystem health in the ecological conservation areas, strictly protected areas, and recreational display areas were equivalent, and the rate of improvement increased by 57.14%, 57.14%, and 35.71%, respectively, compared with traditional utilization areas. Thus, the overall level and rate of improvement in ecosystem health in the traditional utilization areas decreased.

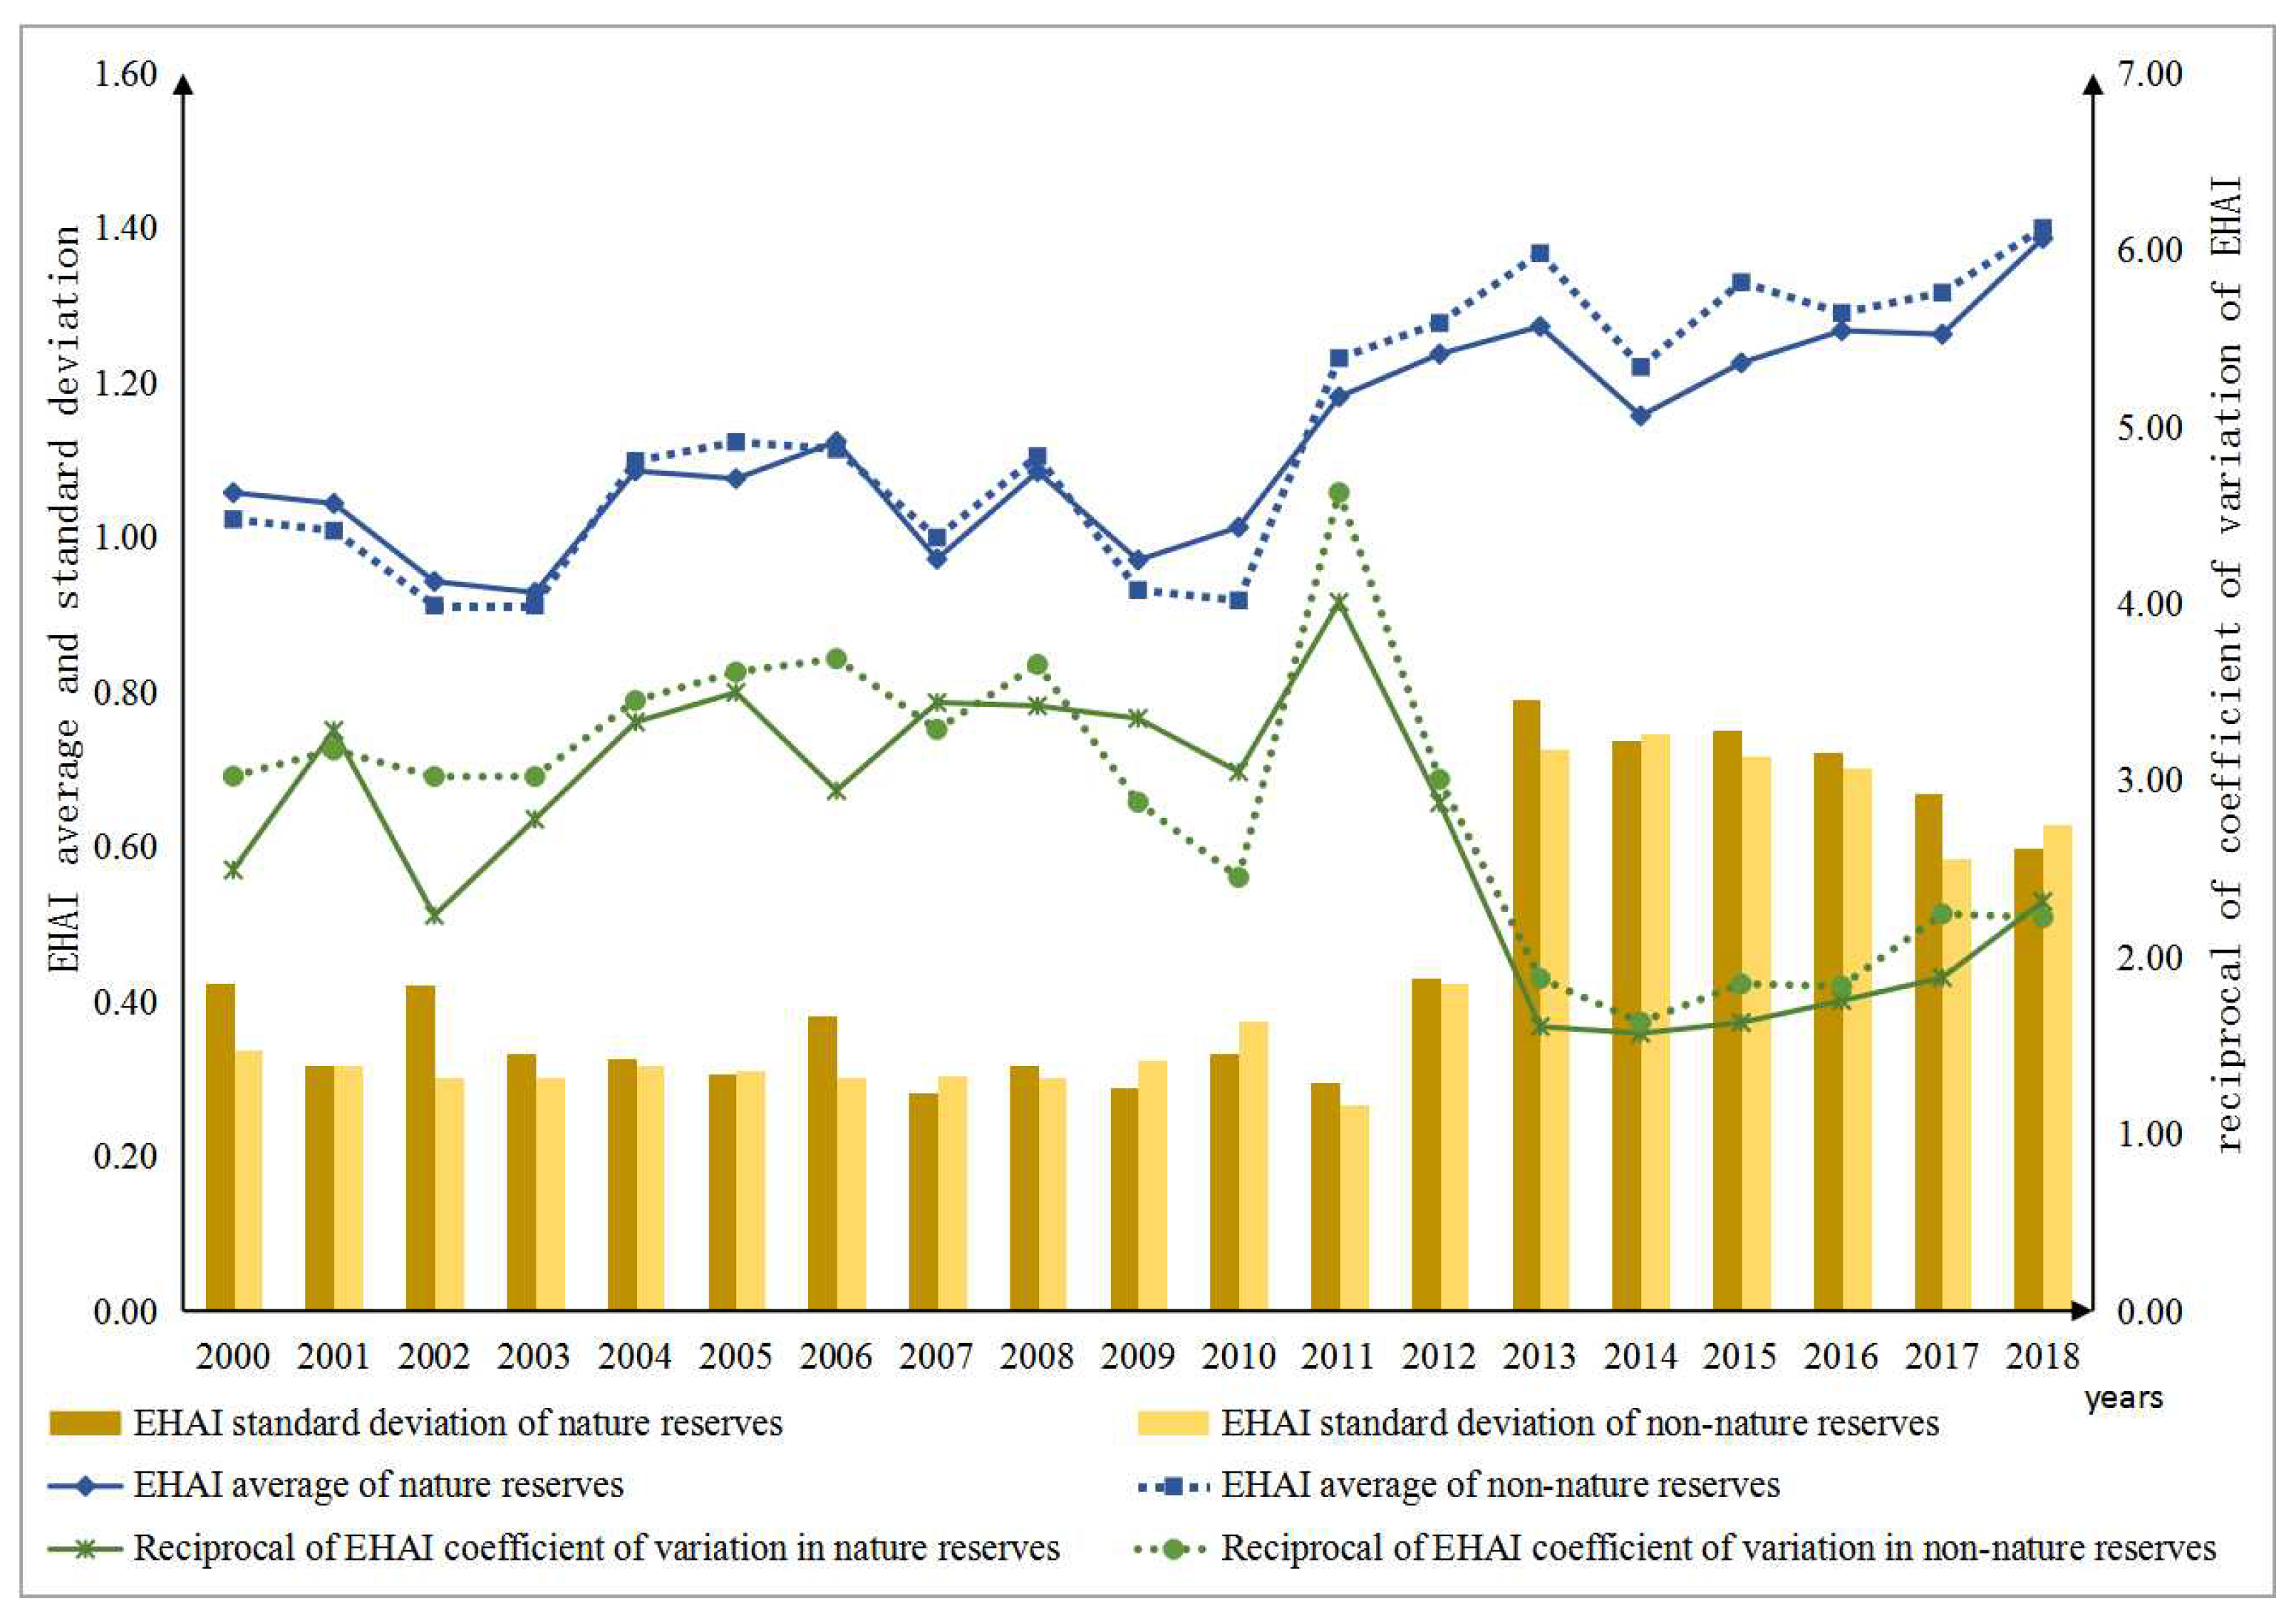
3.3. Protection Effectiveness of Nature Reserves of Shennongjia National Park

The EHAI statistics of two areas in Shennongjia National Park from 2000 to 2018 are shown in Figure 10, based on the zoning vector data of nature and non-nature reserves in Shennongjia National Park (Figure 11). We detail several notable findings below.
(1)
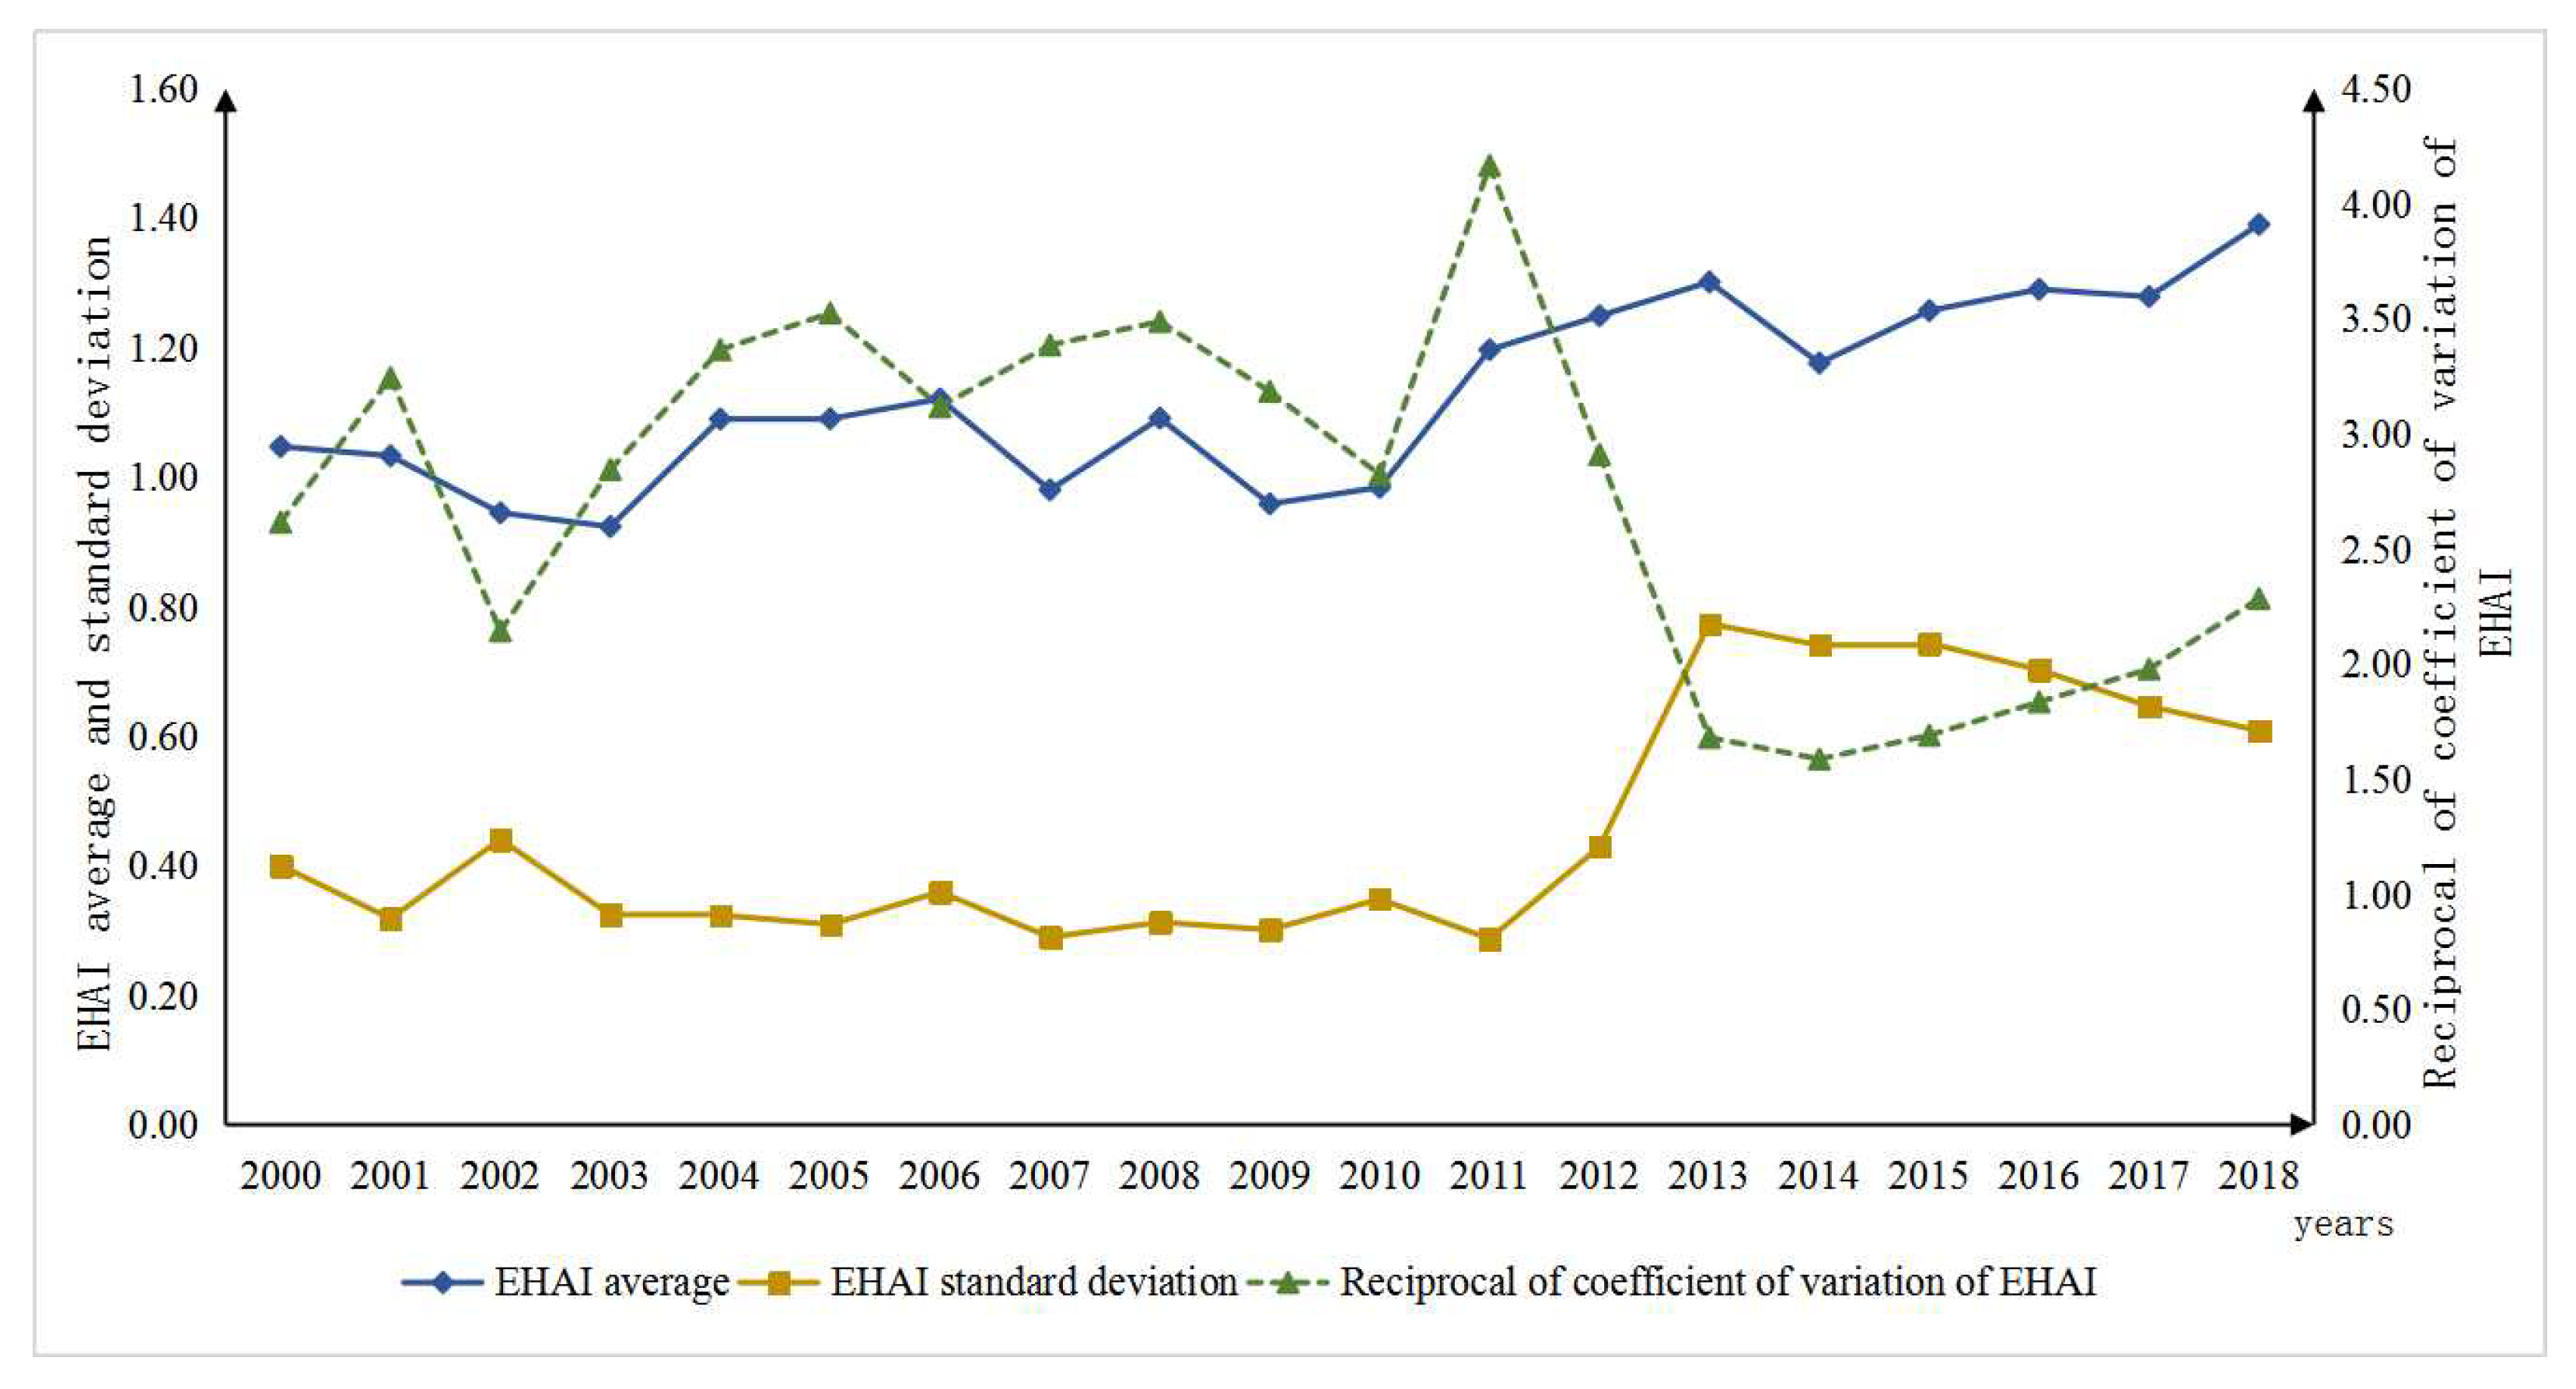
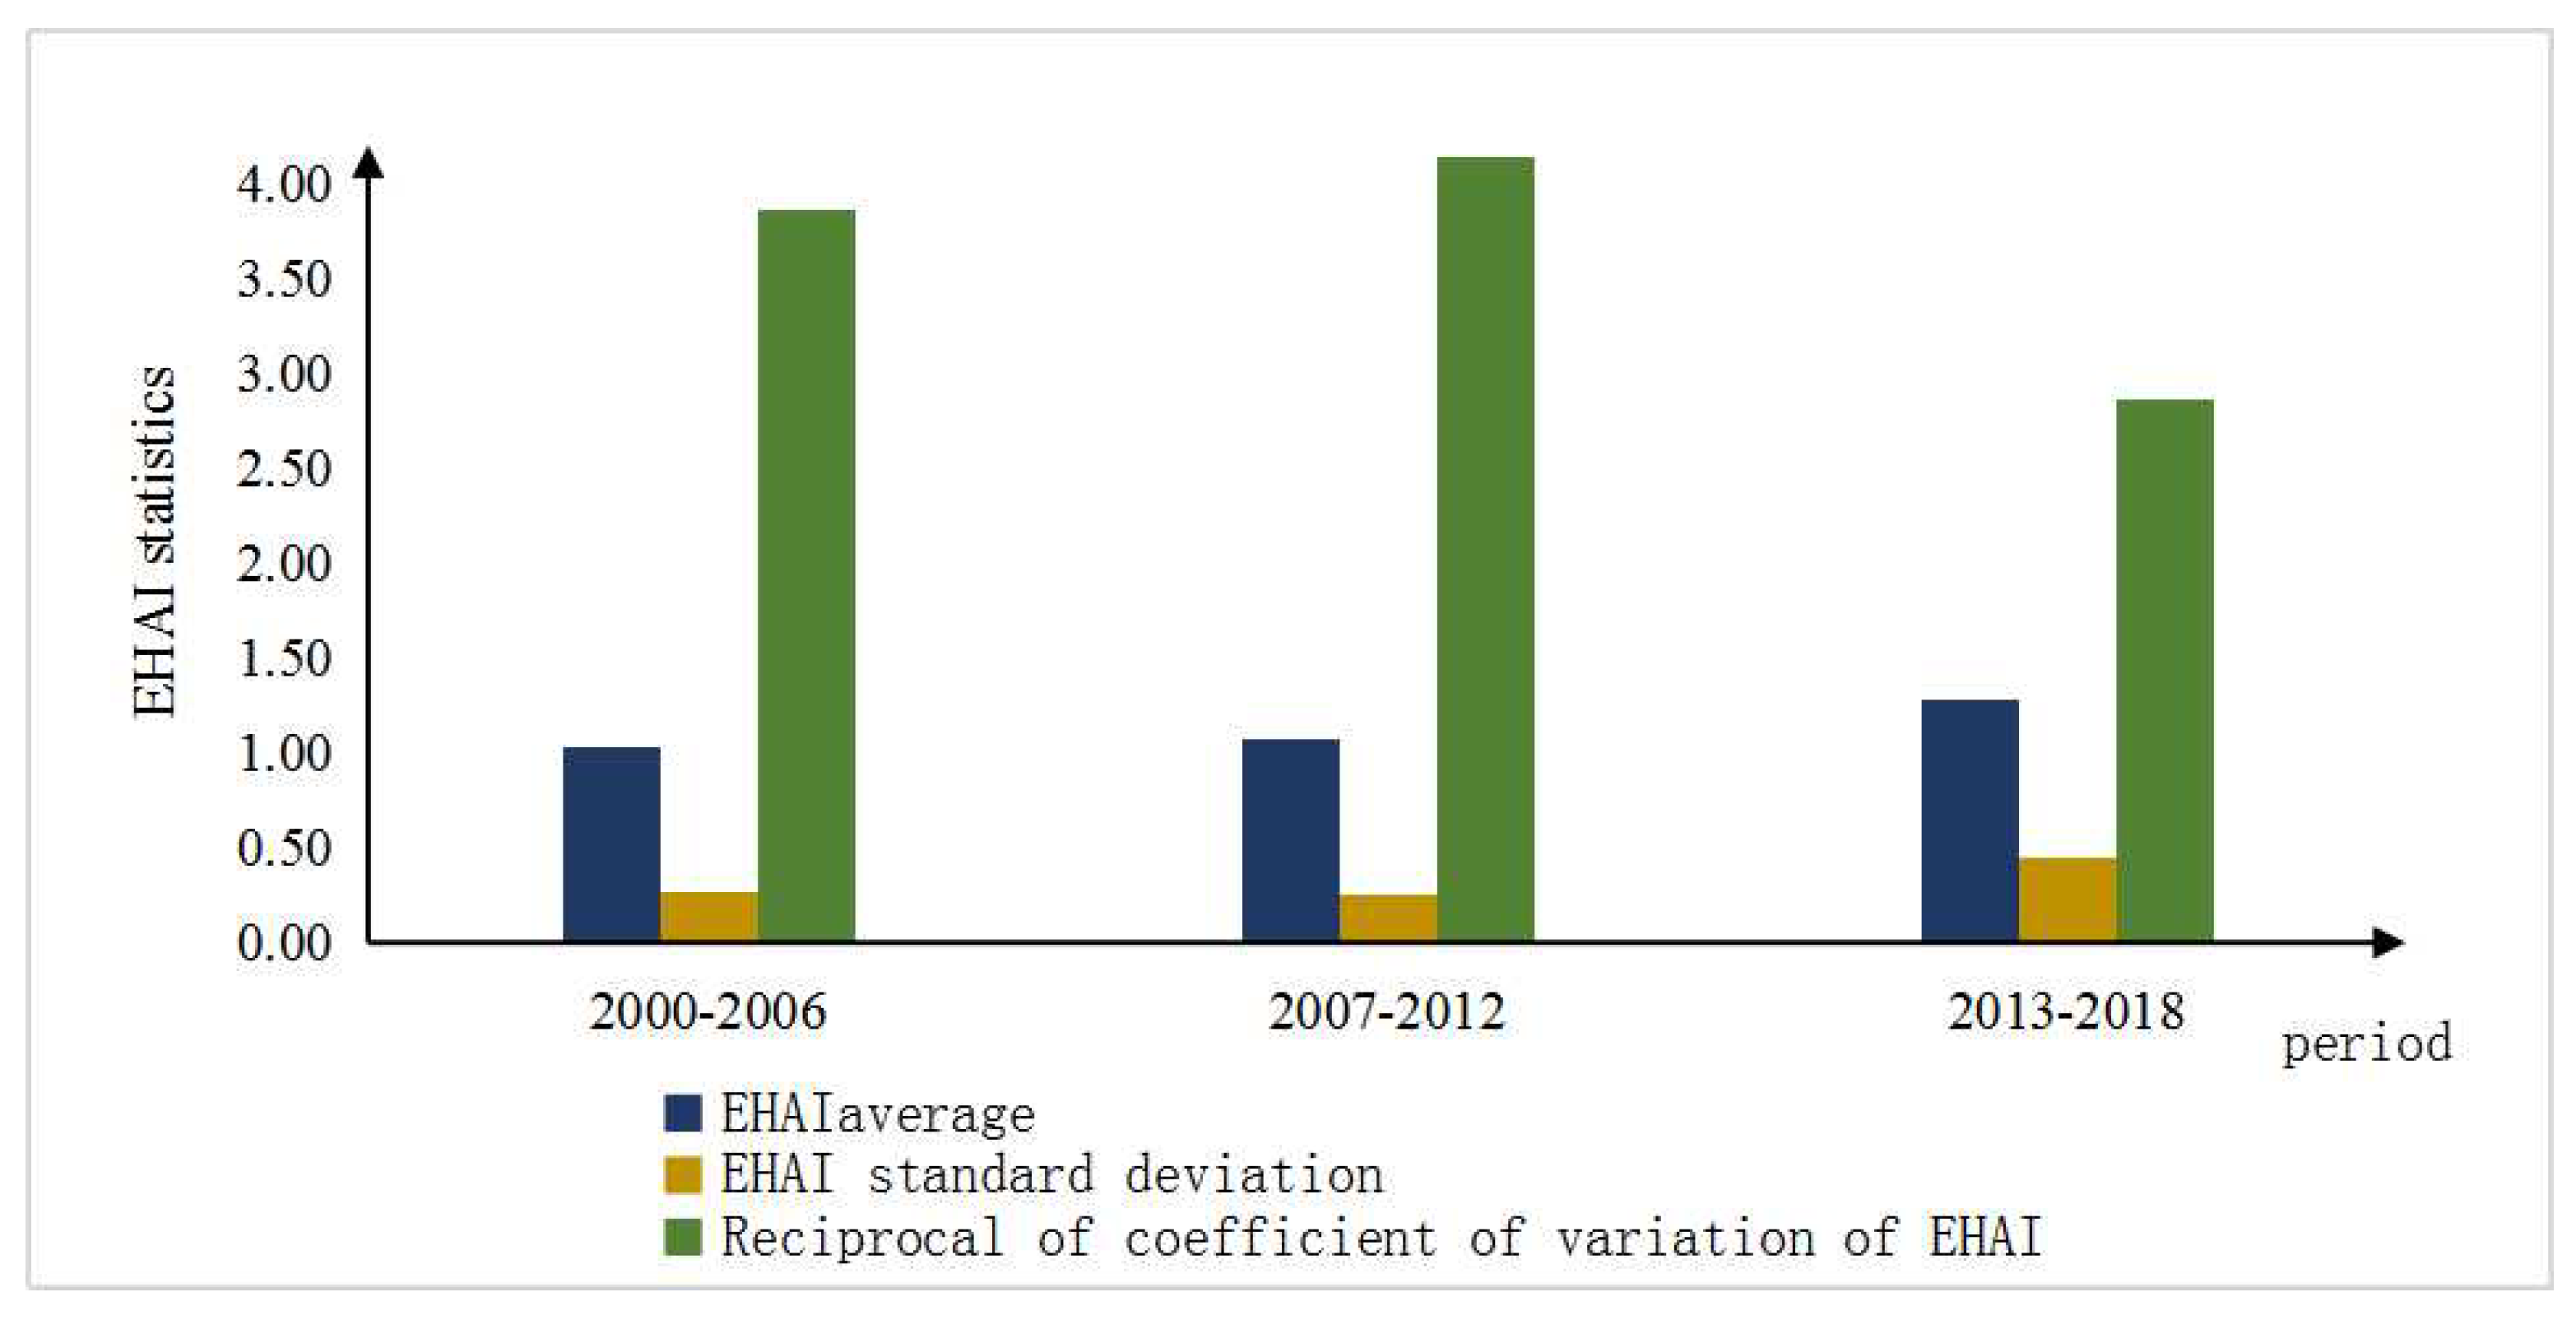
The EHAI average of nature reserves was higher than that of non-nature reserves between 2000–2003 and 2009–2010, indicating that the ecosystem health of nature reserves was superior to that of non-nature reserves. The values of the two regions were basically the same from 2004 to 2008, indicating that their overall health was essentially the same. The ecosystem health of the non-nature reserves was superior to that of the nature reserves in 2011. The EHAI average of non-nature reserves in 2011–2018 was higher than that of nature reserves, indicating that the ecosystem health of non-nature reserves was superior to that of nature reserves during this period. Overall, the rates of change of the EHAI average of nature reserves and non-nature reserves were 0.01 and 0.02 from 2000 to 2018, respectively. The overall level of the two regions gradually improved, and the rate of improvement in the ecosystem health of non-nature reserves was double that of nature reserves.
(2)
Changes in the stability of the nature reserves and non-nature reserves based on the standard deviation of EHAI were basically the same. The differences in the values between 2000 and 2012 were small (the rate of change of both was 0.003), and the stability of ecosystem health remained basically unchanged. The value of 2012–2013 was increased, and the stability of ecosystem health decreased. The rates of change of the values in the nature reserves and non-nature reserves from 2013 to 2018 were −0.034 and −0.028, respectively, indicating that the stability of ecosystem health increased and that the rate of stability enhancement in nature reserves was 1.21-times higher than that of non-nature reserves.
(3)
The rates of change of the reciprocal of the EHAI coefficient of variation in nature reserves and non-nature reserves from 2000 to 2010 were 0.01 and 0.08, respectively, and the values of non-nature reserves were slightly higher than those of nature reserves. Thus, the rate of improvement of non-nature reserves was 8-times that of nature reserves, and the rate of improvement of non-nature reserves was slightly higher than that of nature reserves. From 2010 to 2011, the rates of change of nature reserves and non-nature reserves were 0.96 and 2.18, respectively. The rate of improvement in non-nature reserves was thus 2.27-times higher than that of nature reserves. The value of non-nature reserves was slightly higher than that of nature reserves from 2011 to 2018, indicating that the improvement of non-nature reserves was greater than that of nature reserves during this period. In addition, the values of the two regions both showed a trend of an initial decrease followed by an increase. From 2011–2013 to 2013–2018, the rate of change of nature reserves changed from −1.2 to −0.13, the rate of change of non-nature reserves changed from −1.37 to 0.1, and the decrease in the improvement of non-nature reserves from 2011 to 2013 was greater than that of nature reserves. From 2013 to 2018, the obvious rate of enhancement of nature protection areas was 0.3-times higher than that of non-nature protection areas. From 2011 to 2018, improvement in both regions was initially weak and later increased.

4. Conclusions

After the establishment of Shennongjia National Park in 2016, the overall improvement in ecosystem health has increased, stability has gradually improved, and the degree of improvement has increased. Thus, the establishment of national parks has played an important role in improving the health of regional ecosystems. This improvement may also be related to China’s implementation of the Shennongjia National Park ecological restoration project since 2017. In the future, relevant departments may consider continuing to promote the construction of ecological projects, such as natural forest protection and converting farmland to forests.
The ecosystem health level in traditional utilization areas is poorer than that in other functional areas, and the stability of ecosystem health decreased from 2017 to 2018. In the future, relevant departments should consider the ecological protection and restoration of the area, improve the health and stability of the ecosystem, and optimize the layout of the traditional use area of Shennongjia National Park.
The ecosystem health level of non-nature protection areas was superior to that of nature reserves from 2016 to 2018. Thus, relevant departments may gradually strengthen the ecological governance of non-nature reserves after pilot areas are established. Although managers should consider the construction of non-nature reserves, relevant departments should still consider the ecological restoration of nature reserves to speed up the overall optimization and development of the ecological conditions of Shennongjia National Park.

5. Discussion

We used the VOR model to evaluate ecosystem health in Shennongjia National Park. Some researchers in China have also evaluated ecosystem health of other national parks. For example, Su [42] used the PSR model to evaluate the ecosystem health of Sanjiangyuan National Park in 2005, 2010, and 2015. The time scale analyzed in this study was larger than that used by previous studies. The VOR model was considered from the level of the ecosystem, while the PSR model was considered more from the perspective of the human impact on the ecosystem. Because an ecosystem is an open and complex system composed of many factors, it is very difficult to comprehensively assess ecosystems. Therefore, many studies are based on a certain goal or aspect. At the ecosystem level, land cover change is used as the main evaluation indicator in national parks [43]. Parisa et al. [44] used regression analysis in comparison with artificial intelligence to assess roads’ impact on plants diversity in national parks. Cao et al. [45] evaluated the spatiotemporal variation characteristics of ecological services and identified the important distribution areas of ecological services. Peng et al. [46] analyzed the vegetation coverage change of Sanjiangyuan National Park and revealed the driving force of human activities and climate change on vegetation by residual analysis method effects. At the species level, the research cases of national parks are the most extensive. Darras et al. [47] investigated the birds of primary and secondary forest and shrub habitats in the peat swamp of Berbak National Park, Sumatra. Figueiró and others [48] conducted research on the spatial and temporal distribution of blackflies (Diptera: Simuliidae) in Itatiaia National Park, Brazil. It is well known that national parks play an important role in the protection of ecosystems and species, and they are inseparable. An ecosystem provides an important habitat for the survival and reproduction of species, and the species are an organic components of the ecosystem and promote ecosystem balance and succession.However, due to the scale effect of ecological assessment, how to realize the fine assessment of an ecosystem and species and to provide comprehensive support for the management decision-making of national parks will be the focus in future research.

Author Contributions

This paper was written by H.W. in collaboration with all co-authors. The general idea of this thesis was determined by P.H., H.W., and J.J. Main data were collected by P.H. The first drafts were written by H.W.; final manuscript was finished by P.H. and H.W.; R.X., J.Z., Z.F., and J.H. took part in the discussion and revision of the paper. All authors have read and agreed to the published version of the manuscript.

Funding

This research was funded by “Monitoring and Evaluation of Ecological Benefits of Key Nature Reserves” (2017YFC0506506), “Design and Evaluation Technology of Biodiversity Conservation Targets“ (2018YFC0507200), and “Regional Biodiversity and Ecological Protection Red Line Area Effectiveness Evaluation Application Demonstration” (2016YFC0500206).

Conflicts of Interest

The authors declare no conflict of interest.

References

  1. Mukul, S.A.; Sohel, M.S.I.; Herbohn, J.; Inostroza, L.; König, H. Integrating ecosystem services supply potential from future land-use in protected area management: A bangladesh case study. Ecosyst. Serv. 2017, 26, 355–364. [Google Scholar] [CrossRef]
  2. Sohel, M.S.I.; Mukul, S.A.; Burkhard, B. Landscape’s capacities to supply ecosystem services in bangladesh: A mapping assessment for lawachara national park. Ecosyst. Serv. 2015, 12, 128–135. [Google Scholar]
  3. Shao, Q.Q.; Fan, J.W.; Liu, J.Y.; Huang, L.; Cao, W.; Xu, X.L.; Ge, J.S.; Wu, D.; Li, Z.Q.; Gong, G.L.; et al. Evaluation of ecological effect of the first phase of ecological protection and construction of the three river sources. J. Geogr. 2016, 71, 3–20. [Google Scholar]
  4. Hou, P.; Yang, M.; Zhai, J.; Liu, X.M.; Wan, H.W.; Li, J.; Cai, M.Y.; Liu, H.M. On the construction of nature reserves and national ecological security pattern. Geogr. Res. 2017, 36, 420–428. [Google Scholar]
  5. Huang, L.; Cao, W.; Wu, D.; Gong, G.L.; Zhao, G.S. Ecosystem changes in china’s key ecological function zones from 2000 to 2010. Chin. J. Appl. Ecol. 2015, 26, 2758–2766. [Google Scholar]
  6. Hou, P.; Zhai, J.; Cao, W.; Yang, M.; Cai, M.Y.; Li, J. Evaluation of ecological status changes and protection effectiveness of national key ecological functional areas: A case study of national key ecological functional areas in the central mountain area of hainan island. Acta Geogr. Sin. 2018, 73, 429–441. [Google Scholar]
  7. Hou, P.; Wang, Q.; Yang, M.; Li, J.; Zhai, J.; Cai, M.Y. Effective evaluation framework and index method of ecological protection red line. Geogr. Res. 2018, 37, 1927–1937. [Google Scholar]
  8. Zhao, G.Q. Chongming Dongtan Wetland Ecosystem Health Assessment and Comparative Studies on Photosynthetic Physiology of the Invasion of Phragmites Communis and Spartina Alterniflora. Ph.D. Thesis, East China Normal University, Shanghai, China, 2005. [Google Scholar]
  9. Ma, K.M.; Kong, H.M.; Guan, W.B.; Fu, B.J. Ecosystem health assessment: Methods and directions. Ecology 2001, 12, 2106–2116. [Google Scholar]
  10. Zhang, H.Y.; Ou, X.H. A Preliminary study on monitoring and evaluating forest ecosystem health with insects as indicator species. World For. Res. 2006, 4, 22–25. [Google Scholar]
  11. Bian, S.W.; Jiang, W.; Mei, P.W.; Wang, Q.L. Research progress on lake ecosystem health assessment based on benthic animal index method. Environ. Prot. Circ. Econ. 2016, 36, 49–52. [Google Scholar]
  12. Kong, H.M.; Zhao, J.Z.; Ma, K.M.; Zhang, P.; Ji, L.Z.; Deng, H.B.; Lu, Z.H. Preliminary Study on the Evaluation Method of Ecosystem Health. J. Appl. Ecol. 2002, 4, 486–490. [Google Scholar]
  13. Liu, H.; Pan, Z.H.; Zhou, M.M.; Zhang, L.Y.; An, P.L.; Pan, X.B.; Tuo, D.B.; Zhao, P.Y. Impact of different ways of returning farmland to ecological health in the ecotone between agriculture and animal husbandry in Northern China—Taking Wuchuan County as an example. Agric. Res. Arid Areas 2010, 28, 175–179, 192. [Google Scholar]
  14. Rombouts, I.; Beaugrand, G.; Artigas, L.F.; Dauvin, J.-C.; Gevaert, F.; Goberville, E.; Kopp, D.; Lefebvre, S.; Luczak, C.; Spilmont, N.; et al. Evaluating marine ecosystem health: Case studies of indicators using direct observations and modelling methods. Ecol. Indic. 2013, 24, 353–365. [Google Scholar] [CrossRef]
  15. Li, Y.N. Comprehensive Assessment of Lake And Reservoir Ecological Safety. Master’s Thesis, Zhejiang University, Zhejiang, China, 2014. [Google Scholar]
  16. Ma, Z.Y. Research on Island Ecosystem Health Evaluation Under the Pressure of Urbanization; Third Institute of Oceanography, State Oceanic Administration: Beijing, China, 2008. [Google Scholar]
  17. Wang, B.; Guo, H.; Wang, Y.; Ma, X.Q.; Li, S.N.; Chen, T.; Chang, W.M. Research progress on forest ecosystem health assessment. J. Chin. Soil. Wat. Conserv. 2007, 3, 114–121. [Google Scholar]
  18. Pantus, F.J.; Dennison, W.C. Quantifying and evaluating ecosystem health: A case study from Moreton Bay, Australia. Environ. Manag. 2005, 36, 757–771. [Google Scholar] [CrossRef]
  19. Rapport, D.J. What constitutes ecosystem health? Perspect. Biol. Med. 1989, 33, 120–132. [Google Scholar] [CrossRef]
  20. Costanza, R.; Norton, B.G.; Haskell, B.D. Ecosystem Health: New Goals for Environmental Management; Island Press: Washington, DC, USA, 1992; pp. 239–256. [Google Scholar]
  21. Yuan, M.N.; Liu, Y.X.; Wang, M.; Tian, L.; Peng, J. Ecosystem health assessment in guangzhou based on the framework of “vitality-organization-resilience-contribution”. Chin. J. Ecol. 2019, 38, 1249–1257. [Google Scholar]
  22. Wang, X.P. Ecosystem Health Assessment and Spatial Characterization of the Caofeidian Coastal Zone. Master’s Thesis, Hebei Normal University, Hebei, China, 2015. [Google Scholar]
  23. Huang, D.L.; Li, M.Q.; Li, Q.H.; Liu, F.L. SWOT analysis and development strategy of ecotourism in shennongjia national park. Saf. Environ. Eng. 2019, 26, 50–55. [Google Scholar]
  24. Chen, Y.; Guo, Y.; Liu, Y.; Chen, X.G.; Shao, C.Y. Detection and Analysis of Land Cover Changes in Shennongjia National Park from 1990 to 2016. For. Sci. Technol. News. 2018, 1, 19–23. [Google Scholar]
  25. Hou, P.; Wang, Q.; Shen, W.M.; Zhai, J.; Liu, H.M.; Yang, M. Research progress on integrated ecosystem assessment: Connotation, framework and challenges. Geogr. Res. 2015, 34, 1809–1823. [Google Scholar]
  26. Cheng, S.W.; Zhang, X.M.; Hu, J. Study on tourism perception and tourism participation intention of community residents in Shennongjia National Park. Chin. Gard. 2018, 34, 103–107. [Google Scholar]
  27. Xie, X.R.; Li, T.T.; Wang, Z.X.; Xie, Q.J.; Lin, L.Q. Suitability evaluation and application research of traditional parks in national parks based on GIS and MAXENT model analysis: A case study of Shennongjia National Park. J. Hubei Univ. Nat. Sci. Ed. 2017, 39, 437–443, 450. [Google Scholar]
  28. Sheng, Y.Y.; Cong, J.; Lu, H.; Yang, K.H.; Yang, L.S.; Wang, M.; Zhang, Y.G. Diversity of soil fungi in the forest line transition zone of Shennongjia National Park. Acta Ecol. Sin. 2018, 38, 5322–5330. [Google Scholar]
  29. Tie, J. Plant Composition and Evaluation of Food-Eating Plants in the Habitat of Rhinopithecus Roxellana in Shennongjia River. Ph.D. Thesis, Beijing Forestry University, Beijing, China, 2009. [Google Scholar]
  30. Yang, Q.C.; Li, T.T.; Wang, Z.X.; Lin, L.Q.; Peng, Q.Q.; Lin, B.J.; Zheng, C.L. Comprehensive evaluation of ecological sensitivity of Shennongjia National Park. J. Hubei Univ. Nat. Sci. Ed. 2017, 39, 455–461. [Google Scholar]
  31. Hubei Daily. Regulations on the protection of Shennongjia National Park. Hubei Daily, 30 November 2017; p. 010. [Google Scholar]
  32. Wang, L. Re-Quantitative Inversion of Forest Leaf Area Index and Canopy Closure in Shennongjia Sample Area. Ph.D. Thesis, University of Chinese Academy of Sciences, Beijing, China, 2013. [Google Scholar]
  33. Wang, B.L.; Wang, J.J.; Yang, Y.; Chang, S.J.; Chen, X.M.; Liu, A.J. Improvement of the absorption component of photosynthetically active radiation and the algorithm of maximum light energy utilization rate. Acta Prac. 2013, 22, 220–228. [Google Scholar]
  34. Gu, J.C.; Lu, G.Q.; Bai, S.J.; Wu, B.; Yu, X.X.; Wu, H.X. Evaluation index and application of forest health. J. Hebei Agric. Univ. 2006, 2, 68–71. [Google Scholar]
  35. Geng, J.; Ruan, H.H.; Tu, L.L.; Wu, G.X. Estimation of net primary productivity of vegetation in Wawushan Forest Farm based on CASA Model. For. Sci. Technol. Dev. 2012, 26, 90–96. [Google Scholar]
  36. Fan, J.X. Research on Health Evaluation of Forest Ecosystem in Beichuan County Nature Reserve. Master’s Thesis, Sichuan Agricultural University, Sichuan, China, 2013. [Google Scholar]
  37. Yang, F.; Li, Z.W.; Bao, Y.H.; Li, X.Y.; Zhang, B.H.; Xin, X.P. Application comparison of remote sensing products with different leaf area index in Hulunbeier meadow grassland. J. Agric. Eng. 2016, 32, 153–160. [Google Scholar]
  38. Du, Z.C.; Yang, Z.G.; Cui, X.Y. comparative study on leaf area index of five kinds of plant clusters in typical steppe region of Inner Mongolia. China Grassl. 2001, 23, 13–18. [Google Scholar]
  39. Zhuang, D.F.; Liu, J.Y. Research on regional differentiation model of land use in China. J. Nat. Resour. 1997, 2, 10–16. [Google Scholar]
  40. Wang, S.Y.; Liu, J.Y.; Zhang, Z.X.; Zhou, Q.B.; Zhao, X.L. Spatial-temporal characteristics of land use in China. Acta Geog. Sin. 2001, 6, 631–639. [Google Scholar]
  41. Su, H.M.; He, A.X. Fuzhou city land use analysis based on rs and geostatistics. J. Nat. Resour. 2010, 25, 91–99. [Google Scholar]
  42. Su, X.Y. Evaluation of ecological health of Sanjiangyuan National Park. Master’ Thesis, Qinghai Normal University, Qinghai, China, 2019. [Google Scholar]
  43. Young, J.E.; Sánchez-Azofeifa, G.A.; Hannon, S.J.; Chapman, R. Trends in land cover change and isolation of protected areas at the interface of the southern boreal mixedwood and aspen parkland in Alberta, Canada. For. Ecol. Manag. 2006, 230, 151–161. [Google Scholar]
  44. Parisa, P.; Ali, J.; Mohamad, A.C.; Hamid, G.M. Road impact assessment modelling on plants diversity in national parks using regression analysis in comparison with artificial intelligence. Modeling Earth Syst. Environ. 2020, 1281–1292. [Google Scholar]
  45. Cao, W.; Liu, L.L.; Wu, D.; Huang, L. Spatial and temporal variations and the importance of hierarchy of ecosystem functions in the Three-river-source National Park. Acta Ecol. Sin. 2019, 39, 1361–1374. [Google Scholar]
  46. Peng, K.F.; Jiang, W.G.; Hou, P.; Sun, C.H.X.; Zhao, X.; Xiao, R.L. Spatiotemporal variation of vegetation coverage and its impacting factors in the Three-river-source National Park. Chin. J. Ecol. 2020. [Google Scholar] [CrossRef]
  47. Darras, K.; Rahman, D.; Sugito, W.; Mulyani, Y.; Prawiradilaga, D.; Rozali, A.; Fitriawan, I.; Tscharntke, T. Birds of primary and secondary forest and shrub habitats in the peat swamp of Berbak National Park, Sumatra. F1000 Res. 2018, 229. [Google Scholar]
  48. Figueiró, R.; Araújo-Coutinho, C.; Azevedo, L.; Nascimento, E.; Monteiro, R. Spatial and temporal distribution of blackflies (Diptera: Simuliidae) in the Itatiaia National Park, Brazil. Neotrop. Entomol. 2006, 542–550. [Google Scholar]
Figure 1. Map of Shennongjia National Park (Hubei Province, China).
Sustainability 12 07672 g001
Figure 2. Technical flow chart of ecosystem health assessment of Shennongjia National Park.
Sustainability 12 07672 g002
Figure 3. Changes in the EHAI statistics of Shennongjia National Park each year.
Sustainability 12 07672 g003
Figure 4. Changes in the EHAI statistics of Shennongjia National Park during different periods.
Sustainability 12 07672 g004
Figure 5. Changes in the FPAR statistics of Shennongjia National Park each year.
Sustainability 12 07672 g005
Figure 6. Changes in the LAI statistics of Shennongjia National Park each year.
Sustainability 12 07672 g006
Figure 7. LUI results for Shennongjia National Park in different years. (a) 2000; (b) 2010; (c) 2017.
Sustainability 12 07672 g007
Figure 8. Functional division map of Shennongjia National Park.
Sustainability 12 07672 g008
Figure 9. Changes in the EHAI average in different functional areas of Shennongjia National Park.
Sustainability 12 07672 g009
Figure 10. Changes in EHAI statistics of nature reserves and non-nature reserves in Shennongjia National Park by year.
Sustainability 12 07672 g010
Figure 11. Zoning map of nature reserves and non-nature reserves in Shennongjia National Park.
Sustainability 12 07672 g011
Table 1. Classification accuracy of the Shennongjia ecosystem in 2017.
EcosystemSample NumberAccuracy (%)
Forestland45097.9
Grassland1566.7
Wetland580.0
Farmland2070.0
Construction land560.0
Bare ground510.0
Total50091.6

