Article

Reducing Road Transport Emissions in Europe: Investigating A Demand Side Driven Approach

1
European Commission, Directorate General for Climate Action, 1040 Brussels, Belgium
2
Energy Economics, Nuertingen Geislingen University, Technische Universität Darmstadt, 73312 Geislingen, Germany
*
Author to whom correspondence should be addressed.
The findings, interpretations and conclusions expressed in this text are those of the authors and cannot be taken to reflect the views of the European Commission.
Sustainability 2020, 12(18), 7594; https://doi.org/10.3390/su12187594
Submission received: 30 July 2020 / Revised: 25 August 2020 / Accepted: 1 September 2020 / Published: 15 September 2020
(This article belongs to the Special Issue Sustainable Automobilities in the Mobile Risk Society)

Abstract

:
The European Union aims at net-zero emissions by 2050. A key sector to achieve this goal is road transport, where emissions show no signs of reducing but continue to grow. A review of policies undertaken by EU member states and the G20 to reduce transport emissions reveals that both present and planned policies focus on binding supply-side measures, but offer only weak demand-side incentives. To address this imbalance, we developed a downstream, demand-side policy prototype through an expert interview design process. We call the prototype “cap-and-surrender” because it caps road emissions, and then allocates tradable emission allowances to individual vehicles that drivers surrender at each fill-up. Allowance pricing, both by the state and in the secondary market, is designed to incentivize decarbonization of the sector. Though the system would require significant investment, its revenue potential to the state should exceed this investment by several multiples. We discuss the potential economic, environmental and social impacts of the policy, as assessed by European transport experts. We find that the approach can deliver significant transport emission reductions in an effective and economically efficient manner. Through the appropriate design of national allocation rules and a gradual phasing in of cap and surrender, potential negative social consequences can be mitigated, and public acceptance of the policy promoted.

1. Introduction

The European Union aims at net-zero emissions by 2050. As laid down in the European Green Deal [1], the EU’s commitment to the Paris Agreement [2] and the 2050 long-term Climate Strategy [3], this requires a comprehensive lowering of greenhouse gas (GHG) emissions across all sectors of the economy to the point where offsetting remaining GHG emissions can occur through natural and technological processes. Almost all sectors have shown progress toward this goal, with transport being the notable exception. While overall GHG emissions declined in Europe by 22.5% from 1990 to 2018, total transport emissions increased by more than 23%.
Road transport emissions played the leading role in this increase, growing almost 27% over the period and accounting for almost 95% of all transport emissions by 2018. The share of road transport in overall emissions rose from less than 13% in 1990 to almost 21% in 2018 [4]. The principal contributors to these emissions are passenger cars and light-duty vehicles, together responsible for almost 70% of transport emissions in 2018 and 15.1% of total GHG emissions in the EU. These vehicles are thus recognized as the main drivers for the significant growth of overall transport emissions in the EU [4,5].
Given the importance of curbing road transport emissions, all EU member states have put comprehensive policies in place, drawing from those in other countries and regions that face the same challenges, notably the US, China and the G20. These policies principally target supply-side actors—namely, car manufacturers and fuel suppliers. The rationale behind this approach rests on strong arguments for regulatory capacity [6,7] or economic efficiency [6,8,9], with a limited number of suppliers being thought easier to regulate than the considerably larger number of demand-side actors in their cars and light-duty vehicles.
Though the rationale for a supply-side focus may be strong, there is the risk of artificially limiting policy options. A case in point is the debate over including road transport in the European emission trading scheme (EU ETS). The issue has been addressed by many studies and papers (see, for example, [6,8,9,10,11,12,13,14,15]), with some dismissing the idea as inferior to the standards-based approach [9,16] and others concluding that, while the idea might be feasible, immediate reductions in road transport emissions are not likely [8,9] for two key reasons. First, there is the low price elasticity of demand in transport [15]. Second, the carbon price signal is obscured by overall fuel costs and thus has only a marginal effect on CO2 emissions [10,17].
This begs the question of whether it might be possible to design a policy that makes the carbon costs more visible to car and truck owners and encourages these demand-side actors to participate more directly in reducing road transport emissions. A search of the literature yields few studies that follow this approach, which prompted us to consider how such a policy might be designed. This led to the three research questions that motivate this paper:
RQ1
Can elements for an alternative cap-and-trade model be found in the national policy toolboxes of key road transport countries—namely the US, China and G20 and the EU Member States? Do the latter report any such models in their National Energy and Climate Plans?
RQ2
Which elements could be prototyped into a demand-side “cap-and-surrender” scheme addressing road transport emissions?
RQ3
How do European transport experts assess the environmental, social and economic impacts of this prototype, and what mitigating measures could be used to limit its potential negative impacts?
The remainder of the paper is structured as follows: Section 2 presents our methodology, comprising both qualitative and quantitative methods. Our first research question is taken up in Section 3, which then serves as the basis in Section 4 for developing our policy prototype (RQ2) and the subsequent impact assessment (RQ3). We discuss the validity of our results in Section 5 and draw conclusions in Section 6.
In this paper, we use the road transport sector to comprise passenger cars and light-duty vehicles as defined by European Parliament 2007 and applied in Regulation (EU) 2019/631 [18,19]. We make no distinction between passenger cars and light duty vehicles (LDV) in our model, which further considers only CO2 emissions. Our geographical reference is the European Union (EU) or, if indicated, its member states. The term country-wide refers to a single or a group of EU member states.

2. Methodology

Building on the transport policy analyses put forward by [15,20,21,22,23,24,25,26,27,28,29], we applied a three-step mixed-method approach to develop and validate an alternative cap-and-trade model. In step one, a qualitative review was conducted to identify policy gaps; in step two, the review was used to develop a prototype policy instrument. In step three, a quantitative review was done to analyze the impacts and implications of such an instrument.

2.1. Qualitative Review

In our qualitative review, we sought to characterize the status quo of road transport policies in the EU. Through a computer-aided screening of relevant peer-reviewed and grey literature, we conducted a comprehensive review of transport policies and measures in the EU, as well as in the US and China. We used Science Direct, EconLit and the Genios databases to retrieve suitable peer-reviewed material—the latter also to identify press and internet reviews.
We further screened document repositories of the European Commission (DG Climate Action, DG MOVE and DG Energy), the Cordis database (Community Research and Development Information Service), the EU Joint Research Centre’s Publication Repository and the publications of the European Environment Agency. The Legislative Observatory (OEUIL) of the European Parliament allowed us to track the latest information on transport sector regulation. The reports and databases of the International Energy Agency (IEA), the Organization for Economic Cooperation and Development (OECD) and national sources in the US and China provided additional raw materials for our policy review.
The material retained for analysis consisted largely of primary sources, such as legislative texts, impact assessments, research studies and policy reports. In total, our combined literature pool held 132 documents that together represent the status quo of road transport policies in the EU. However, with the exception of GHG reductions, contributions of member states to EU policy objectives are not laid down at the EU level. Rather, the EU Governance Regulation asks member states to outline their policies in their National Energy and Climate Plans (NECPs), which were due at the Commission March 2020. Hence, to complete our qualitative review, we also went through the available NECPs to gain insight into additional intended transport measures.

2.2. Prototype Development

Our qualitative review revealed an ongoing scientific and political discussion on the limitations of existing policy instruments. This led us to prototype an alternative approach to tackle road transport emissions, which we name “cap and surrender”. The prototyping followed the methodology of “design thinking” as laid out in [30,31]. Using a panel of 21 experts drawn from masterclass mobility students and specialized transport experts, we went through several rounds of Delphi interviews, each round leading to a more refined version of the concept. Delphi interviews are commonly used to retrieve qualitative feedback on a broad variety of scientific topics [32,33,34,35]. As they are, by definition, subjective, we sought to reduce subjectivity by running the prototyping process in various rounds and with different expert groups. Once we had a prototype concept worthy of systematic investigation, we subjected it to ratings on key performance metrics by a panel of transport experts, ratings we could then analyze quantitatively.

2.3. Quantitative Analysis

In this third step, we used feedback from earlier transport workshops and EU stakeholder consultations to identify 105 transport experts to analyze the prototype concept. These included experts from specialized think tanks and industry, as well as policy makers at EU and member state levels. The experts received a presentation of the concept (Annex I) and a subsequent link to an online questionnaire. Links were emailed out on 21 April 2020, and the survey closed on 7 June 2020. In total, 52 responses (49.5%) were received. However, 22 had to be discarded as invalid because of random response patterns (e.g., straight or diagonal lines in filling out the Likert scales of the survey). A set of 30 valid replies could be further processed, representing 28.5% of the sampled population.

2.3.1. Survey Design

The survey followed a semi-structured design that allowed for comparing results to existing reviews of transport policy instruments. In line with the impact assessment guidelines of the European Commission [36], we distinguished between environmental, economic and social consequences, as well as a criterion of practicability. The survey contained five parts:
(1)
Assessment of (environmental) policy effectiveness;
(2)
Feedback on economic aspects;
(3)
Assessment on social impacts of the scheme;
(4)
Feedback on (political) feasibility aspects;
(5)
Mitigating measures to increase political acceptance.
The survey comprised 37 questions and took from 15 to 20 min to complete. A mix of Likert scales, closed ranking and open questions were used. The Likert scales used an even number of items to allow for clear conclusions and avoid a statistical “average choice bias” [37]. Even scales ranged from one to six, with items transcribed into verbal cues (e.g., one—“do not agree at all” to six—“fully agree”). This was done to avoid confusion with some national school grading systems, where one denotes the highest level of performance. Interviewees were asked to reply based on their personal situation and experience.

2.3.2. Analysis of Data

We used IBM’s SPSS Data Analysis Software on the questionnaire data. For each assessment of impacts, descriptive and inferential statistics were calculated per response item to: (1) examine views on environmental effectiveness of the scheme; (2) assess economic consequences, as perceived by stakeholders; (3) assess perceived social impacts; (4) gain insights on practicability and acceptance issues.
Results were subjected to cluster analyses. Our first clustering was by professional group, using four categories: NGO, public sector, think tank, and business or other. Our second clustering was by experience in policy evaluation and design, using a Boolean yes or no. The impact items were analyzed both intra- and intergroup, applying the following methods:
  • Intra-class correlation coefficient (ICC) tests to check consistency among surveyed experts from the same city.
  • Summarization of open-ended questions to identify strengths and weaknesses of the concept.
  • Intergroup-comparison based on Kruskal–Wallis; Kruskal–Wallis allows us to detect differences between the stakeholder groups as we expect the assessment of policy impacts to differ between stakeholders.
  • Mann–Whitney U-Test to compare the averages of the two independent groups per item, in the case of statistically significant differences between two groups.
  • Correlation analysis of the impact items against each other at aggregate and detailed levels using Kendall’s tau rank, preferred over Spearman’s rank for small sample sizes [38].
  • For the read-out of the data, we report median, SD as well as percentile values and skewness. In addition, we present the Kolmogorov–Smirnov D test statistic and its related p-values.

2.3.3. Validation of Results and Cross-Examination

To corroborate our findings and investigate open points, we hosted a workshop on transport governance under the aegis of the Friedrich-Ebert-Foundation. The workshop was hosted online on 18 June 2020 and included six EU transport experts representing industry, NGOs and civil society. Following a presentation of both the policy prototype and survey results, we solicited feedback through two rounds of semi-structured discussions.

2.4. Summary of Methodology

Table 1 summarizes the process of developing and assessing the “cap-and-surrender” policy prototype.

3. Current and Planned Transport Policies

Reducing greenhouse gases in transport policies is a topic which is researched from many perspectives, spanning from transport efficiency [39,40], transport costs and emissions factors [41,42], transport modes in the EU [43,44] and more recently the use of big data [45,46] for designing mobility policies as well as technology transfer and innovation [47]. A clear gap in literature is the analysis of alternative policy instruments that focus on demand-side policies.
Our first research question was whether elements for an alternative cap-and-trade model could be found in the national policy toolboxes of key road transport countries. To investigate, we performed a comprehensive qualitative review of the transport policies in those jurisdictions that might inspire EU policies, namely instruments at the G20 level, as well as national regulations in the US and China.

3.1. Policy Instruments

All instruments have in common that they seek “to change behavior in order to produce desired outcomes” [48], which in the case we are studying means reducing emissions from the road transport sector. Instruments are applied as either a “push” or “pull” strategy. “Push” measures are generally more restrictive and shrink behavior options [49,50]. Consequently, they imply enforcement and possibly sanctions or penalties for compliance failure. “Pull” measures on the other hand enlarge behavior options by offering new opportunities and incentives, but do not entail any sanctions or penalties should these be declined.
Instruments can further be distinguished by the different points of regulation. Supply-side policy aims to change the behavior of car manufacturers and upstream actors in the oil and gas industry. Demand-side policy aims to change the behavior of the consumer side of the sector—i.e., car holders and drivers.

3.2. Policies in G20 Economies

Table 2 shows the number of policy measures our qualitative review found, classified by type of strategy and point of regulation.

3.2.1. Supply-Side Policies

On the supply side, push measures outnumber pull by about 30%. Regulatory push measures target car manufacturers and fuel suppliers and include emission standards for light (14) and heavy-duty vehicles (7) as well as measures that aim at promoting biofuels through mandatory targets for fuel suppliers (17). Examples of the latter are the application of a quota for biofuels in China [52,53,54], and actions that support the transition to zero-emission vehicles (ZEV) [15,22] through biofuel use [55]. Mandatory vehicle labelling is also common (16), but only China (1) has established mandatory electric vehicle quotas.
Overall, fuel efficiency standards in combination with ZEV promotion policies and biofuel targets represent the main elements of the prevailing strategy in the G20 jurisdictions to cope with CO2 emissions from the road transport sector [56,57,58]. All economies use standards as core regulation policy embedded in a broader policy mix that differs from country to country.
The standards commonly enforced apply to emission levels and fuel efficiency [10,12,19,23,55,59,60,61,62,63]. This pattern exists in all economies, including the EU [18,29,64,65,66,67,68], the US [13,60,69,70,71] and China [23,52,53,55,72]. Standards serve to frame further regulatory actions. Testing procedures provide the basis for standards [26,73], define how technical compliance is assessed, allow for assessing the effectiveness of standards in reaching emission reduction targets [74], and provide for potential increases in target stringency [21].

3.2.2. Demand-Side Policies

On the demand side, pull measures are almost three times as common as push measures. They include national programs to support the shift to public transport (19); support for zero or low carbon vehicles (23); support for non-motorized transport (12); the provision of information such as labelling (16). Often, measures addressing the demand side, such as fiscal treatment of company cars, road and parking charges, as well as subsidies, are considered as complementary measures to supply-side fuel efficiency standards [14], while awareness-raising and eco-driving represent clear examples of demand-side “pull” measures [75].
Push measures on the demand side exist exclusively in the form of road charges (13) and taxes (13). They are widely applied—many contain CO2 elements (CO2 tax, circulation or registration tax, bonus-malus with and without CO2 elements), but demonstrate only limited effects in cutting CO2 emissions [17]. Schmitz [76] demonstrates that taxes and road charges are usually too weak and “fall grossly short of achieving the carbon dioxide reductions which scientists consider necessary or desirable”. The societal and political challenges of raising tax rates are cited as the main obstacles to tax levels that might achieve the desired reductions. Still, non-financial considerations cast further doubt on the effectiveness of higher tax rates [49].

3.3. Policies in the EU

In the EU, transport policies are, on the whole, designed at the national level to best adapt to national circumstances. Policy measures are communicated to the European Commission where they are recorded in the European Environmental Agency’s database on policies and measures [77]. We performed a multi-criteria search on the database (as of 3 June 2020) and systemized the existing policies and measures along the more finely grained policy categories established by environmental economics [78,79,80], namely:
  • Command-and-control (standards).
  • Market-based (economic incentives such as subsidies; fiscal measures such as taxation).
  • Quantity-based (quotas, tradable quotas).
  • Information and planning measures.
Table 3 presents the result.
In sum, the 27 EU member states use almost 700 measures to address road transport emissions. The overall picture in terms of push and pull measures mirrors that of the G20: Push measures, notably standards, are more likely to be applied at the supply side, whereas pull measures address the demand side. No cap-based policies are presently applied to the demand side.
Are any cap-based policies anticipated for demand-side actors? To answer this, we screened the National Energy and Climate Plans (NECPs) that the EU member states had to submit by 31 March 2020 to the European Commission [81,82]. These plans represent the national polices intended to support the overall EU decarbonization strategy. As member states were late in submitting their NECPs, only a sub-section could be analyzed and is presented in Table 4. In all cases, the plans report the intention of national governments to step up policy measures addressing road transport emissions to meet 2030 targets; yet, none of the NECPs foresees a cap-based option operating downstream, highlighting a clear gap in road emissions policy.

3.4. The Status Quo

In answer to our first research question, we found few if any elements for a demand-side cap-and-trade model in the national policy toolboxes reviewed.
Current policies designed to reduce CO2 emissions rely mainly on standards and fuel efficiency. They often act in combination with quotas for renewable energies (biofuels) and measures to promote zero or low emission vehicles. Practicable implementation of these policies is left to supply-side actors: car manufacturers, fuel suppliers or refineries.
Demand-side measures require neither compliance nor enforcement. They rather represent offers, which may or may not be taken up by consumers. Exceptions to this are the road charges found in some jurisdictions, but in most cases these do not aim at reducing CO2 emissions from road transport but are collected for other reasons.
The status quo in EU transport policy overlooks incentives for demand-side actors (vehicle owners) to exploit their autonomous CO2-saving potential or to more effectively respond to pull measures put in place. Effective push measures for drivers could complement current policies and increase their overall effectiveness. Given the success of cap-and-trade systems, it is reasonable to ask if the ideas might work as well on the demand side of the road transport sector.
To date, an approach for cap and tradable permits operating on the demand side of road transport is neither in place at the European level, nor do member states intend to install such a system. So, we set about developing a prototype for just such a model to address road transport emissions, one we call “cap-and-surrender”.

4. Policy Prototype and Assessment

Having found that current and planned EU transport policies neglect the possibility that market-based strategies (e.g., cap-and-trade) might also succeed on the demand side of the road transport sector, we sought to design a technically feasible prototype that could, by analogy, leverage economic self-interest into desired environmental behavior. We then assessed the impacts of the prototype and considered mitigating measures that might reduce the potential shock of such an instrument on the European transport markets.

4.1. Cap-and-Surrender

The policy model we label “cap-and-surrender” (C&S) was developed by prototyping versions using the methodology of “design thinking” [30,31]. Each version of the prototype was assessed and validated by different groups of experts and in different assessment formats. The aim was to carve out technical and non-technical specifications for a demand-based cap approach that was operationally feasible. The following presents the concept and explains salient design choices. Further technical details can be found in Annex I in the Supplemental Materials.

4.1.1. Concept

Our policy concept borrows elements from the EU emissions trading system (EU ETS), but represents a stand-alone system adapted to the specific requirements and features of the road transport sector. It targets passenger cars and light-duty vehicles (LDV) up to 3.5 tons. This design choice was retained through prototyping because cars and LDVs are the leading source of transport emissions in the EU, accounting for almost 70% of transport emissions in 2018. Our policy prototype further takes as its point of regulation the individual vehicle with an internal combustion engine, and its emissions, accounting not at the end of a fiscal calendar, but every time a driver fills the tank.
Figure 1 shows the prototype infrastructure. In the system, overall road transport emissions are capped, and then distributed to vehicle owners in the form of tradable emission allowances we call road transport allowances (RTAs). The cap ensures that overall climate targets can be met, while the RTAs serve to distribute responsibility both for emissions production and reduction in individual vehicle owners.
Like the EU ETS, cap-and-surrender introduces the need for market actors to hold CO2 emission permits, which here take the form of RTAs. They serve the same purpose as emissions allowances in the EU ETS, both incentivizing high-carbon users to reduce emissions and rewarding low-carbon users for contributing to decarbonizing, in this case, the road transport sector. The trading of allowances or their parts offers great flexibility for a gradual and socially acceptable transition to less and, finally, zero emissions from road transport.
The prototype envisions RTAs being allocated to vehicle owners on an annual basis, based on pre-defined allocation criteria, and initially given for free to drivers. For simplicity, think of one RTA as representing a permit to emit one ton of CO2. The electronic RTA accounts shown in Figure 1 are then stored on a credit-card-like device, which we call an electronic allowance card or EAC. These cards are coded to their respective cars as key fobs are, so an EAC only works for the vehicle it is assigned to. At the same time, multiple EACs can be issued for the same vehicle, as is done with credit cards, but in this case to allow for different drivers of the same car.
When a driver buys fuel at a filling station, both money and emission allowances are “surrendered”. The dotted arrow in Figure 1 depicts the flow of allowances into a CO2-surrendering device installed at the filling station, the allowance surrendering terminal (AST). Once a vehicle’s free RTA allocation has been exhausted, drivers have the option to buy RTAs on the secondary market through an RTA Terminal, as shown in Figure 1. The block labelled “EAF” in this figure represents an environmental adjustment factor used to scale the price of the RTAs.
Just as in cap-and-trade on the supply side, the key idea in cap-and-surrender is to present producers of CO2 with a strong incentive to emit less. In practical terms, this implies that owners of high-emission vehicles pay higher costs for buying an RTA than owners of low-emission vehicles. This thinking led to the EAF mechanism.
The mechanism is designed to exponentially increase the costs of purchasing RTAs if the fuel consumption per 100 km of the buyer exceeds a reference value (say, the average fuel consumption of the national territory). The larger the deviation from the reference value, the greater the pricing effect. An aggressive policy might use a cubic scaling function, causing prices to escalate exponentially per liter of consumption above the reference. A vehicle consuming seven liters more per 100 km than the reference would incur a 73—i.e., EUR 343 (7 × 7 × 7)—surcharge over the current RTA market price. Thus, if the market price were EUR 10 per RTA, the carbon-greedy buyer would be charged EUR 353 for an RTA. On the other side, consumers with consumption below the average would be rewarded, perhaps receiving discounts on the price of CO2 or possibly even the fuel. The details of this mechanism are presented in Annex I.
With a decreasing cap and annual allocations, this policy provides a means to cap overall transport sector emissions from passenger cars and LDVs. At the same time, it provides strong incentives to vehicle owners and those purchasing new vehicles to contribute to the decarbonizing of the transport sector. Figure 2 illustrates the three incentives that flow through this policy—to drive less frequently, more efficiently, and more cleanly. These three incentives will likely remain effective over time, as drivers will be reminded of the need to minimize fuel consumption/emissions every time they fill up. The economic incentives created by cap, allocation rules and the EAF constitute a strong push strategy toward low-carbon or non-emitting vehicles, or toward extended use of public transport, cycling or walking.
The policy is also flexible enough to accommodate the diverse features of each EU member state. Since there is no competition between individual car drivers (competition or state aid rules do not apply), it entails the possibility of developing largely national regulation. Allocation allowances can be adjusted to provide for long commuting distances, differing stages of public transport development and other societal needs. RTAs can be granted to accommodate rural areas with limited alternative transport modes, or to meet the needs of low-income members of the population. The distinct policy objectives of each member state can be fully taken into account in the design of national allocation rules.

4.1.2. Phase In

Figure 2 also illustrates a transition period during which the market can adapt to the new policy. A period of one to three years was suggested during prototyping before full implementation. This would allow vehicle owners not only to get familiar with the system, but also to develop concrete awareness that driving a vehicle with a petrol-powered engine produces CO2 emissions that come at an environmental cost. The transition would also give drivers time to record fuel consumption and mileage over a representative period.
During the transition, vehicle owners would be equipped with EACs and would submit emissions data through ASTs at a filling station. Owners would receive a carbon status report that would include, at a minimum, the CO2 emitted since the last filling, the distance covered, and the CO2 content of the fuel just put into the tank. During the transition period, there would be no restrictions on CO2 emissions. The data collected would, however, serve during implementation to determine the individual CO2 budget of each driver to be applied in the implementation phase of the system.
The recommendation emerging through prototyping regarding the allocation of allowances was that, during the transition period, there would be no cap. In transitioning to the full implementation with an operational payment system, our expert assessors suggested not more than 90% of the RTAs be allocated for free and not less than 10% be acquired through purchase. Over the longer term, the pool of RTAs given away freely should approach, or reach, zero.

4.1.3. Effectiveness

The complexity shown in Figure 1 arose during prototyping in response to concerns about safeguarding the policy’s environmental effectiveness. In the current design, effectiveness is realized by (i) reducing the overall cap, (ii) designing suitable national allocation rules and (iii) individualizing the costs of mobility to reflect each driver’s unique situation and mobility behavior. Please note that a reduced cap will not reduce mobility services, but rather the car-related CO2 emissions. Clean transport services—those that do not emit CO2—are not restricted.
Figure 1 also shows two member states, one implementing and one not implementing the policy. For a cap system to be effective, performance against the cap must be accurately measured. Measurements need to consider cross-border transit, holiday travel, or cars from outside the EU. While solving these issues boils down to installing adequate technical solutions, multiple infrastructure components do have to work together. Table 5 explains the functionality of the individual components.

4.2. Expert Assessment of Impacts

Having used multiple rounds of design thinking to evolve a demand-side cap-and-trade policy that withheld critical assessment to deliver technical feasibility, we asked 105 transport experts to assess the environmental, economic and social impacts of the concept through a semi-structured questionnaire covering a range of impact items. We received 30 valid replies, which form the basis of the impact assessments that follow below.

4.2.1. Group Homogeneity

Our research design clustered stakeholders into (i) four professional groups and (ii) two groups of experts based on their experience with policy design and evaluation. Twenty-three experts had experience in policy design, while seven did not. Businesses and other stakeholders formed our largest subgroup “business and others”, with nearly half (14; 46%) of the valid responses, followed by “think tanks” (11; 37%), NGOs (3; 10%) and finally public sector officials (2; 6.7%). This population mirrors the heterogeneous structure of transport policy experts in the EU, both in terms of professional background and experience in policy design and evaluation.
Using intra-class correlation to test group homogeneity, all group formations were based on classifications and showed significantly high levels of homogeneity, both for overall impact assessment and the individual impact classes that we report in the following. Table 6 reports the relevant statistics for the overall assessment, according to stakeholder groups.
Splitting stakeholders into different groups was based on the hypothesis that different groups would have different assessments of the policy prototype. Interestingly enough, the survey results refuted this in large part. Applying the Kruskal–Wallis test showed that, for every single impact item, the null hypothesis had to be retained. Against our earlier hypothesis that the stakeholder groups would hold different opinions, this implies that no statistically significant differences between group ratings existed. Two exceptions were found and followed up by testing the U-value, but they were each part of a larger category of items and did not show significant results. We conclude that the surveyed stakeholders form a relatively homogeneous group that largely agree in terms of assessing the following sets of impacts.

4.2.2. Policy Effectiveness

The effectiveness of the cap-and-surrender prototype was assessed based on 10 items covering: two environmental impacts (reduce greenhouse gas emissions, reduce local air pollutants); three energy-related impacts (motivate a fuel switch, influence the choice of driving modes, reduce fuel consumption); five sustainable mobility aspects (reduce traffic congestion, increase demand for e-vehicles, boost car sharing and pooling, stimulate mobility as a service-model concept, and encourage a switch in transport mode).
Respondents were asked to rate the items on a six-point Likert scale, ranging from 1= not effective at all to 6 = extremely effective. Figure 3 and Table 7 show the distribution of expert ratings for each type of sub-item in the policy effectiveness group. For example, the last line represents the assessed effectiveness of the policy in reducing greenhouse gas emissions. It shows that 78% of the respondents rated the ability of cap-and-surrender to reduce greenhouse gas emissions as “effective”, “very effective”, or “extremely effective”, representing in shades of green the Likert values 4, 5, and 6. The median (MD) rating was 5.0 with standard deviation (SD) of 1.02.
A majority of the polled experts (69%) assessed the scheme as effective to extremely effective in reducing local air pollutants (MD =4.0 or “effective”, SD = 1.23). A similarly high assessment was given to the scheme’s effectiveness in increasing demand for e-vehicles (MD = 4.0, SD = 1.37). Experts were more reserved about the effectiveness of the policy in reducing traffic congestion, boosting car sharing, or stimulating “mobility as a service” concepts, rating each as only “rather effective” (MD = 3.0; SD around 1.2).

4.2.3. Economic Assessment

The category of economic assessment indicators centers on the issue of delivering GHG reductions at least cost (policy efficiency), but also covers a range of potentially negative impacts associated with cap-and-trade schemes. These include upfront costs for installation of the system, transaction and MRV (monitoring, reporting, verification) costs [83,84,85] as well as competitive aspects [86,87,88,89,90]. Again, we asked experts to rate the likelihood of causing these economic consequences on a scale from 1—very low to 6—very high (Figure 4 and Table 8).
In this case, however, we investigated costs rather than benefits, so “very low” represents a positive and “very high” represents a negative impact. Hence, we reversed the color coding in Figure 4 with dark red denoting a rating of 6.0 or “very high” in terms of expected costs.
Of the respondents, 65% assessed the capability of the system to deliver least-cost GHG reductions between “rather high” and “very high” (MD = 4.0 or “high”, SD = 1.31). In turn, 70% saw only a modest impact from economic distortions compared to non-EU-car manufacturers (MD = 2.0 or “low”, SD = 1.37). A majority (65%) rated the emergence of economic distortions caused by buying or selling RTAs between “very low” and “rather low” (MD = 3.0 or “rather low”, SD = 1.28).
In contrast, 79% of respondents rated the set-up costs for the system as high (MD = 4.0, SD = 1.19); 67% also rated user transaction costs as high (MD = 4.0, SD = 1.44) as did 79% on the monitoring costs for the government (MD = 4.0, SD = 1.11).

4.2.4. Social Impacts

Continuing our assessment of the cap-and-surrender scheme along the assessment criteria of the European Commission’s Impact Assessment Guidelines, we surveyed the expected social concerns. Figure 5 and Table 9 show that the stakeholders were rather split in their assessments. Here, the scale was 1 = “very poorly”, 2 = “poorly”, 3 = “rather poorly”, 4 = “rather well”, 5 = “well” and 6 = “very well”. The lower scores are colored red to indicate their negative impact.
A slight majority (52%) of respondents saw the demand for individual mobility only “very poorly” to “rather poorly” addressed (MD = 3.5 or “rather poorly”, SD = 1.19), while 59% raised concerns over mobility for low income groups (MD = 3.0 or “rather poorly”, SD = 1.2). Regarding, the need for basic mobility to generate income, respondents showed a clear split, with 50% rating the item “very poorly” to “rather poorly” addressed, whereas the other 50% saw the item “rather well” or “well” addressed (MD = 4.0 or “rather well”, SD = 1.21).
Note that this rather critical assessment again mirrors concerns raised in the literature in the early days of installing the European emission trading scheme (see, for example, [91,92]), which operates on cap-and-trade as our policy prototype. Still, this category is rated the most negatively of all impact domains, suggesting mitigating measures need to be devised to safeguard political acceptance of the prototype concept.

4.2.5. Feasibility

Under the heading of feasibility, we surveyed stakeholders’ assessments of the complexity of the system and its key component, the environmental adjustment factor. We also surveyed their views on support by important stakeholder groups relevant to the political process of setting up a cap-and-surrender system. Figure 6 and Table 10 show the distribution of expert ratings for each feasibility item. Here, lower numbers signify more negative ratings.
In assessing the complexity of the overall system, raters were split, with 50% rating this issue “well” addressed or higher (MD = 3.5, SD = 1.17); slightly more than half (56%) saw the EAF as “well addressed” (MD = 4.0, SD = 1.31). Regarding support, stakeholders predicted good support from both environmental and other stakeholder groups (MD = 4.0, SD around 1.0 for both groups). In turn, they expected lower support from the car industry (MD = 3.0, SD = 1.03).
When asked at which level such a system should be introduced (multiple replies were possible), stakeholders mentioned the European level 11 times (70% of valid replies), the national level 10 times (65% of valid replies), and the regional level 3 times (11%). The possibility of a local introduction was not considered.

5. Discussion

Through a Delphi expert interview prototyping process, we developed an innovative demand-side policy instrument to reduce passenger car and light-duty vehicle greenhouse gas (GHG) emissions. We then subjected the instrument to assessment by a representative group of EU transport experts. We call the prototype instrument “cap-and-surrender” (C&S) as a nod to the cap-and-trade strategy that has been effective in reducing GHG emissions in the EU. Our instrument sets an overall cap on emissions, which are then allocated to individual vehicles through a system of tradable emissions allowances, here called road transport allowances (RTAs). An especially innovative aspect of our prototype is the use of an environmental adjustment factor (EAF) to effect progressive pricing of RTAs based on the relative carbon performance of a vehicle. The EAF creates a strong economic incentive to switch to zero-emission vehicles in the mid and longer term.

5.1. Environmental Impacts

An overwhelming majority (78%) of transport experts evaluated the prototype as effective in reducing GHG emissions, and a significant majority (69%) expected the policy to be equally effective against local air pollutants. This mirrors the overall assessment in the literature, which attributes to cap-and-trade systems a high level of environmental integrity [70,93,94], owing to the alignment between policy goals and outcomes. When the reduction of emissions is affected by the cap, together with electronic monitoring and reporting of emissions, policy objectives can be translated directly into measurable pollution targets. This came up in the workshop we hosted to discuss our model, with experts largely confirming environmental integrity as a core feature of C&S. One expert underscored the potential of the system to “personalize” environmental integrity by means of the EAF. As individual choices are reflected in the EAF, it serves to individualize costs and mobility choices, including the choice to switch to a low or zero carbon car type or to switch away from individual transport entirely.
While experts were generally positive in rating the system’s effectiveness in bringing about transport mode switches and increasing demand for e-vehicles, they were less so in rating the impacts on car sharing and pooling or in promoting “mobility as a service” concepts. When the issue was raised with experts, they interestingly did not see this as a major issue. As one expert put it: “There are no silver bullets in transport policies. We have to acknowledge that we need a policy mix to address all aspects of mobility policies. This instrument would be one building block and the main focus should lie on bringing down greenhouse gas emissions” (expert 3). Along this line, three points deserve special emphasis.
First, EU emission performance standards are defined on the level of type approval “tank to wheel” (TTW) CO2 emissions in g/km [10]. Today, there is broad consensus that a widening gap exists between this type-approved measurement and real world emissions, to the point where the difference has been estimated at 40% [5,12,19,20,36,58,61]. EU regulations [18] require the Worldwide Harmonised Light Vehicle Test Procedure (WLTP) to be used to measure CO2 emissions as from 2021, but it is understood that this change in testing will not eliminate the gap, but only shrink it 15–20% [66]. For this reason, the EU is now asking for on-board measuring instruments to be built into cars starting with the 2021 models [18,28].
Through the reliable monitoring and reporting of both fuel consumption and CO2 emissions, our system will accurately measure the actual consumption by a vehicle. The CO2 content of the different fuels (petrol and diesel of different grades) available at filling stations is known and so can be calculated precisely during both the transition and implementation period of the policy. Surrendering the amount of CO2 that is put in the tank at each fill-up guarantees a robust accounting of CO2 emissions from the road transport sector. The unavoidable gap created by using type approval procedures to determine the fuel consumption or fuel efficiency of cars is avoided and an undistorted view of the actual fuel consumption by each car can emerge.
The second point that bears emphasis concerns the use of expiration dates on RTAs—prototyping suggested 18 months after the date of issuance. We consider this a key design feature to safeguard environmental effectiveness. The limited period during which an allowance can be used creates a strong incentive not to stockpile RTAs but to sell unused allowances on the secondary market. This is important because a reasonably liquid secondary market for RTAs is needed to accommodate changes in individual situations, such as relocating, changing jobs, or purchasing a new vehicle. RTA incentives should also lead to the more effective use of pull measures, such as subsidies for EV purchase, using public transport or modal switches.
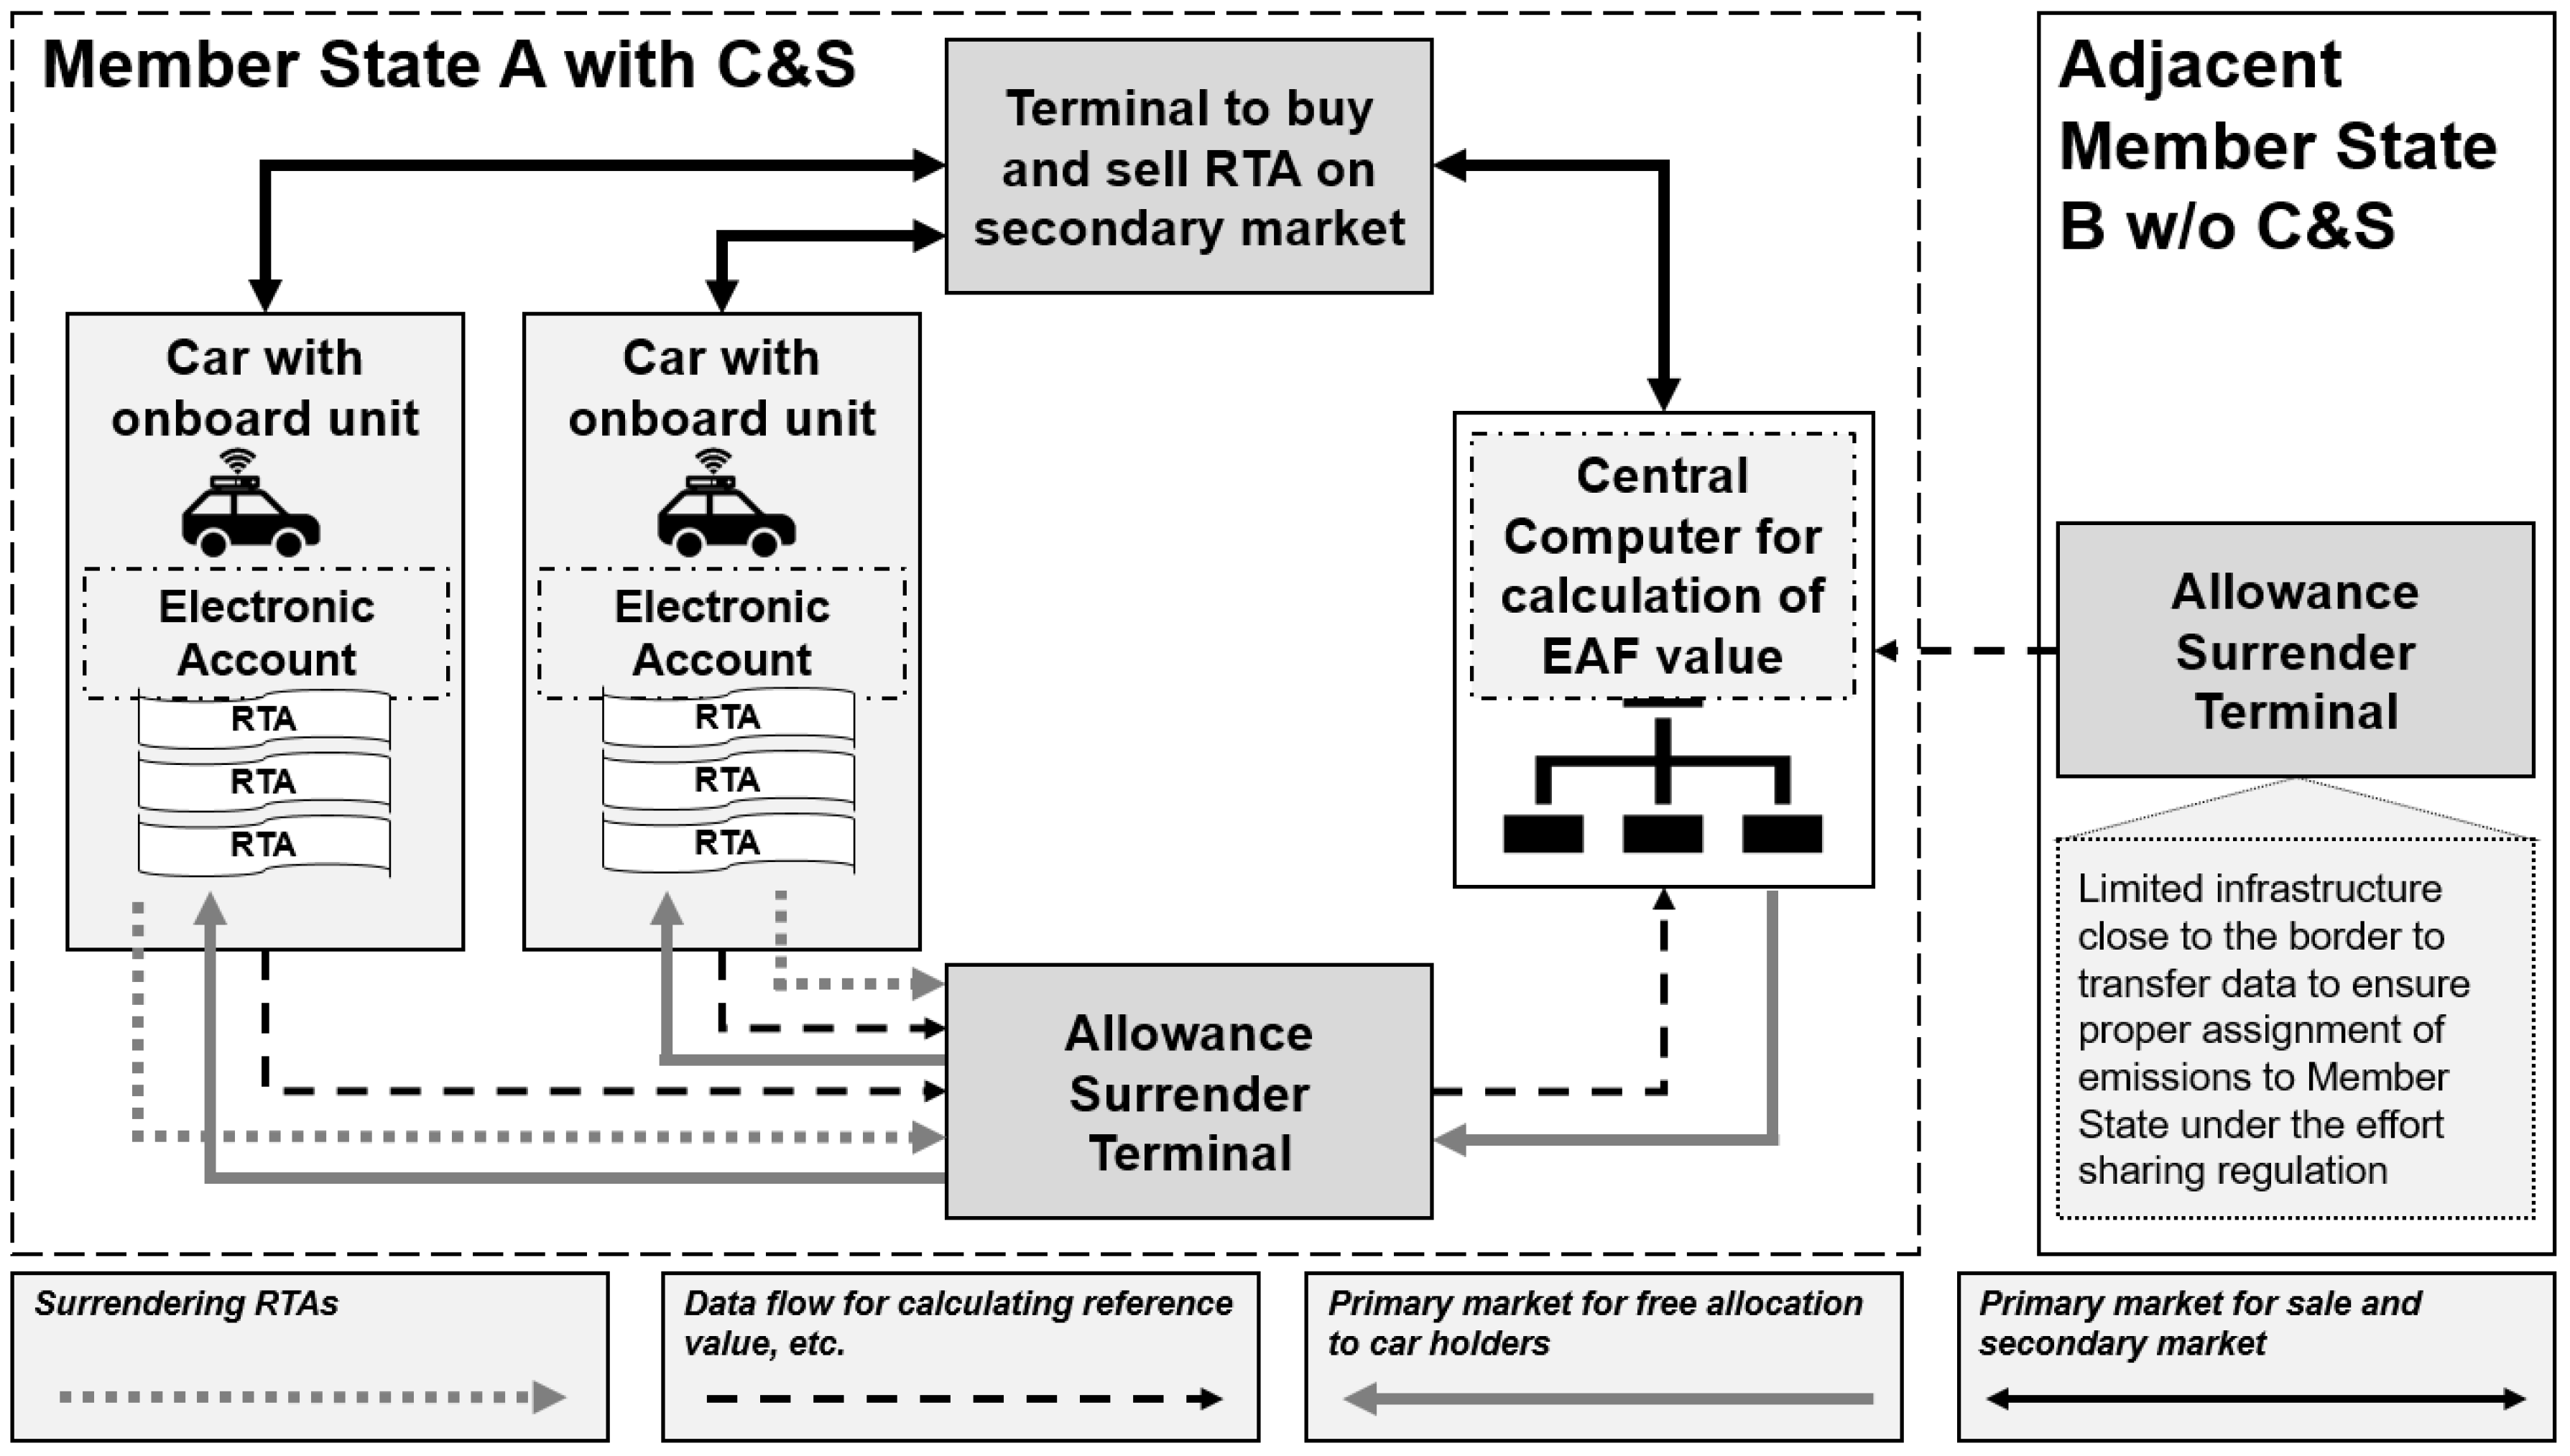
Third, it is clear the environmental integrity would best be assured through an EU-wide application of the system, a view shared by the majority of our experts. However, they also pointed out that integrity might be compromised by tank tourism and leakage if the system is not applied in all member states. One state might implement the system, but a second neighboring state may not. Putting aside the issue of EU borders to third countries, leakage could be expected if drivers from the first state cross the border to fill up in the second. However, this would only occur if the second state were to ignore its own interests and book the emissions from the fuel provided against its own obligations under the Effort Sharing Regulation (ESR) of the EU.
It is more likely that, when the first state installed a C&S system, adjacent states would provide the necessary level of infrastructure at filling stations to allow accounting for fuel emissions by the origin of the consumers. Such infrastructure would need to include facilities to surrender and account for CO2 as well as network connections to pass on relevant information to the corresponding entities of the state fully implementing C&S. This way, the CO2 contained in the fuel supplied by the adjacent state would be applied to the personal budget of the driver from the first state and consequently be booked under that state’s ESR account.

5.2. Economic Impacts

The survey’s assessment of economic impacts centered on the question of delivering GHG reductions at the least cost (policy efficiency), but also on the economic costs for installing and running such a system. Experts were asked to assess competitive impacts of the policy prototype and upfront costs for installation of the system components and further transaction costs.
As for the prototype’s impact on competitive position, experts considered the risk of economic distortions caused by buying or selling RTAs with respect to non-EU manufacturers rather low. However, as a result of the EAF, drivers of CO2 intensive vehicles with fuel consumption well above average or reference value will have to pay significantly more, while those consuming less will pay less. This represents a difference from the current, standards-based approach in the EU that aims to avoid influencing the competitive position of different vehicles in the market [18,20] by the amount of CO2 they emit.
Under C&S, a strict application of the polluter-pays principle requires all drivers to account for the CO2 they emit in a proportional manner, meaning costs rise with increasing emissions. As a result, vehicles that pollute more will see higher operating costs and hence higher life cycle costs than those that pollute less. This approach does not fully result in internalization of external costs but may represent a first step [28]. Strong differentiation of costs in accordance with the polluter-pays principle seems to convey the right signals to consumers and does so in a direct way. As the costs of CO2 emissions are estimated to range from 60 €/tCO2 in the short term to 498 €/tCO2 in the long term [28], pricing emissions performance into RTAs should reduce economic distortions associated with declining CO2 emissions.
Regarding upfront investment or infrastructure costs, a clear majority (79%) of respondents rate these costs as “rather high” to “very high”. Our validation workshop confirmed experts’ concerns and the potential need for a detailed cost-benefit analysis. All experts broadly agreed on the overall installation features of the system (allowance surrender terminals, possibly devices to identify cars and ensure that the correct CO2 account is used for surrendering, RTA terminals for the secondary market) as well as the necessary network and computing capacity to calculate the reference value. Likewise, they identified one-off transaction costs that a vehicle owner would incur. With further design details, these costs could become clearer.
It is, however, important to bear in mind that both infrastructure and transactions costs will be greatly exceeded by the revenues accruing from selling RTAs on the primary market. The concrete number of allowances put up for sale would be determined by each member state, but those revenues should be considerable and are likely to exceed the investment and transaction costs by several multiples. Note that acquiring RTAs on the primary market would mean paying the market price for the RTA plus the surcharge assessed by the individual EAF. Depending on the level of free allocation and sales of RTAs on the primary market, member states could gain several billion Euros that should be used to promote and expand public transport facilities, shift transport modalities, or subsidize the purchase of ZEVs. Such measures may meet enhanced public acceptance as incentives to drive less, drive more efficiently and cleanly accrue from C&S. The economic impacts, albeit not quantified, may therefore help to bolster the decarbonization of the road transport sector, a point that experts highlighted during the workshop.
As several studies have shown [26,75], there is a considerable potential accruing from eco-driving that, on average, may amount to 10% of total fuel consumption [75]. This points to a significant potential for absolute emission reductions that can be bought at low cost by introducing the incentives from C&S. Adding another 10 to 18% that might accrue from modal shifts to public transport [6] and cycling, almost 30% of road transport emissions could be reduced under a C&S cap at relatively low costs. In this sense, the policy prototype would support similar policy measures already in place (Table 3) or in planning (Table 4).

5.3. Social Impacts and Concerns

Our experts raised concerns about the social impacts of a C&S system. These concerns group broadly into three categories: fairness, mobility needs, and impact on low-income groups.

5.3.1. Policy Fairness

It is important to underline that C&S fully aligns with the polluter-pays principle, where those who pollute more pay more. Emitting more CO2 than one’s fair share and, for this reason, paying more for emission rights (RTAs), even if the costs rise exponentially, can be considered fair under polluter-pays.
Another aspect of fairness that comes up in the debate over “climate justice” relates to the fact that the climate crisis is caused mainly by CO2 emissions [95], yet it affects emitters and non-emitters alike. In other words, everyone suffers under climate change, even those not contributing directly to the causes, which in our case means those who do not drive. Furthermore, accounting for the costs of damage caused by CO2 emissions is hampered by the considerable uncertainty involved in quantifying the risks introduced by climate change [28]. Against this background, a system that makes drivers pay for the CO2 they emit and creates revenues for the state, seems to be fair provided the state uses these revenues to alleviate the damaging consequences of CO2 emissions from road transport in a manner that benefits all.
Lastly, it is important to recognize that the consequence of a declining emissions cap will be the same for all: first, non-essential rides may need to be offset by alternative modes of transport, until switching to ZEVs becomes a cost-effective option. Perverse incentives in the transition period (expanded driving to determine a more generous individual CO2 budget) cannot be excluded. Such incentives will, however, briefly be compensated for by a declining cap and could be addressed by national allocation rules to control the free share of allocations.

5.3.2. Mobility Needs

Our panel of experts raised concerns about the policy’s impact on individual mobility needs, including basic mobility to generate income by commuting between work and home. However, through the determination of individual caps or CO2 budgets during the transition period, the policy should be able to adapt to individual needs. Prior to the full implementation of C&S, information will be collected to determine the individual CO2 budget of each vehicle and its driver. This calibration period allows the different mobility needs of consumers in urban and rural areas to be taken into account in setting individual CO2 budgets, which are meant to reflect individual needs. Table 11 details five example cases.
The mobility needs of people living in rural areas or those in urban areas with long commuting distances are not neglected by our policy. In fact, by making suitable choices, drivers can end up driving more and paying less. This is shown in Table 12, depicting five example drivers. Driver #4 logs twice as many kilometers per year as driver #1 but does so in a vehicle with twice the fuel efficiency. Column L shows the overall cost paid by each—driver #4 pays 81.55 € less than driver #1. The comparison of driver #3 to driver #5 is more dramatic—the gas-guzzler (#3) pays 734.84 € more to drive a quarter of the mileage of the gas-frugal driver (#5).

5.3.3. Impact on Low-Income Groups

It is important to note that C&S is not a system to overcome social inequalities created by other policies or failure of welfare distribution. It does not interfere with mobility patterns that exist due to current income distribution. It is in line with the Tinbergen rule [96], meant to reduce CO2 emissions from the road transport sector in an effective, efficient and socially acceptable manner. However, this does not prevent the design of certain elements [97], such as the national allocation rules, to address specific hardship cases—e.g., low income people living in rural areas without public transport but with long commuting needs served by an old, relatively inefficient fuel consuming car. Allocation allowance policies can further be shaped to provide a level playing field for poorer and wealthier segments of the population.

5.4. Mitigating Measures

To mitigate negative social impacts and boost the acceptability of a C&S system, we developed the concept of a “designated RTA”, or dRTA. Table 13 illustrates the idea. The annual mileage (column (col) A) of five cars with different average fuel consumption (col B) results in the total annual emissions shown in column E, taking into account the CO2 content (col D) of the respective fuel (col C), either diesel or petrol. The number in column E sets the individual CO2 budget. Column F represents the effect of a reduction in the overall cap—and hence the individual CO2 budget or cap—of 10%. Multiplying column E by the cap effect gives the number of allowances available for allocation (col G). In the example shown, 80% are to be allocated for free (col H), yielding a free allowance (col I) together with the allowances that need to be bought on the primary market (col J), namely the market run by the state.
Column K shows the idea of “designated” RTAs. A set of allowances that would have been sold on the primary market (grey shading in rows 1–3) are designated for sale on the secondary market (rows 4–5), where individual drivers buy and sell RTAs. In accordance with relevant national rules, these designated RTAs are given to vehicle owners over and above their individual CO2 budgets (see row 4 and 5), but only for sale on the secondary market. There are no additional costs for the buyers (those in row 1–3), but revenues that would have gone to the state from the primary market instead go to the recipients of the dRTAs. These recipients are only permitted to sell dRTAs, so designated RTAs cannot be used for surrendering, and the dRTAs would have to be sold within 18 months. As dRTAs originate from the CO2 budgets of individual vehicles, national policy may elect to designate RTAs on the basis of EAF thresholds to create a Robin Hood effect. This could be used to alleviate social hardships, offset costs accruing from a decreasing cap or in general to increase the social acceptance of the system by helping to reduce economic inequalities.
Experts in the survey and at the workshop also mentioned the treatment of early movers (buyers of ZEV during transition period) and new entrants, of changes in life situations after the determination of individual CO2 budgets or the perverse incentives that may occur in the transition period. All of these issues can be addressed through national allocation rules, but only at the expense of simplicity, or in other words, by adding complexity to the system.
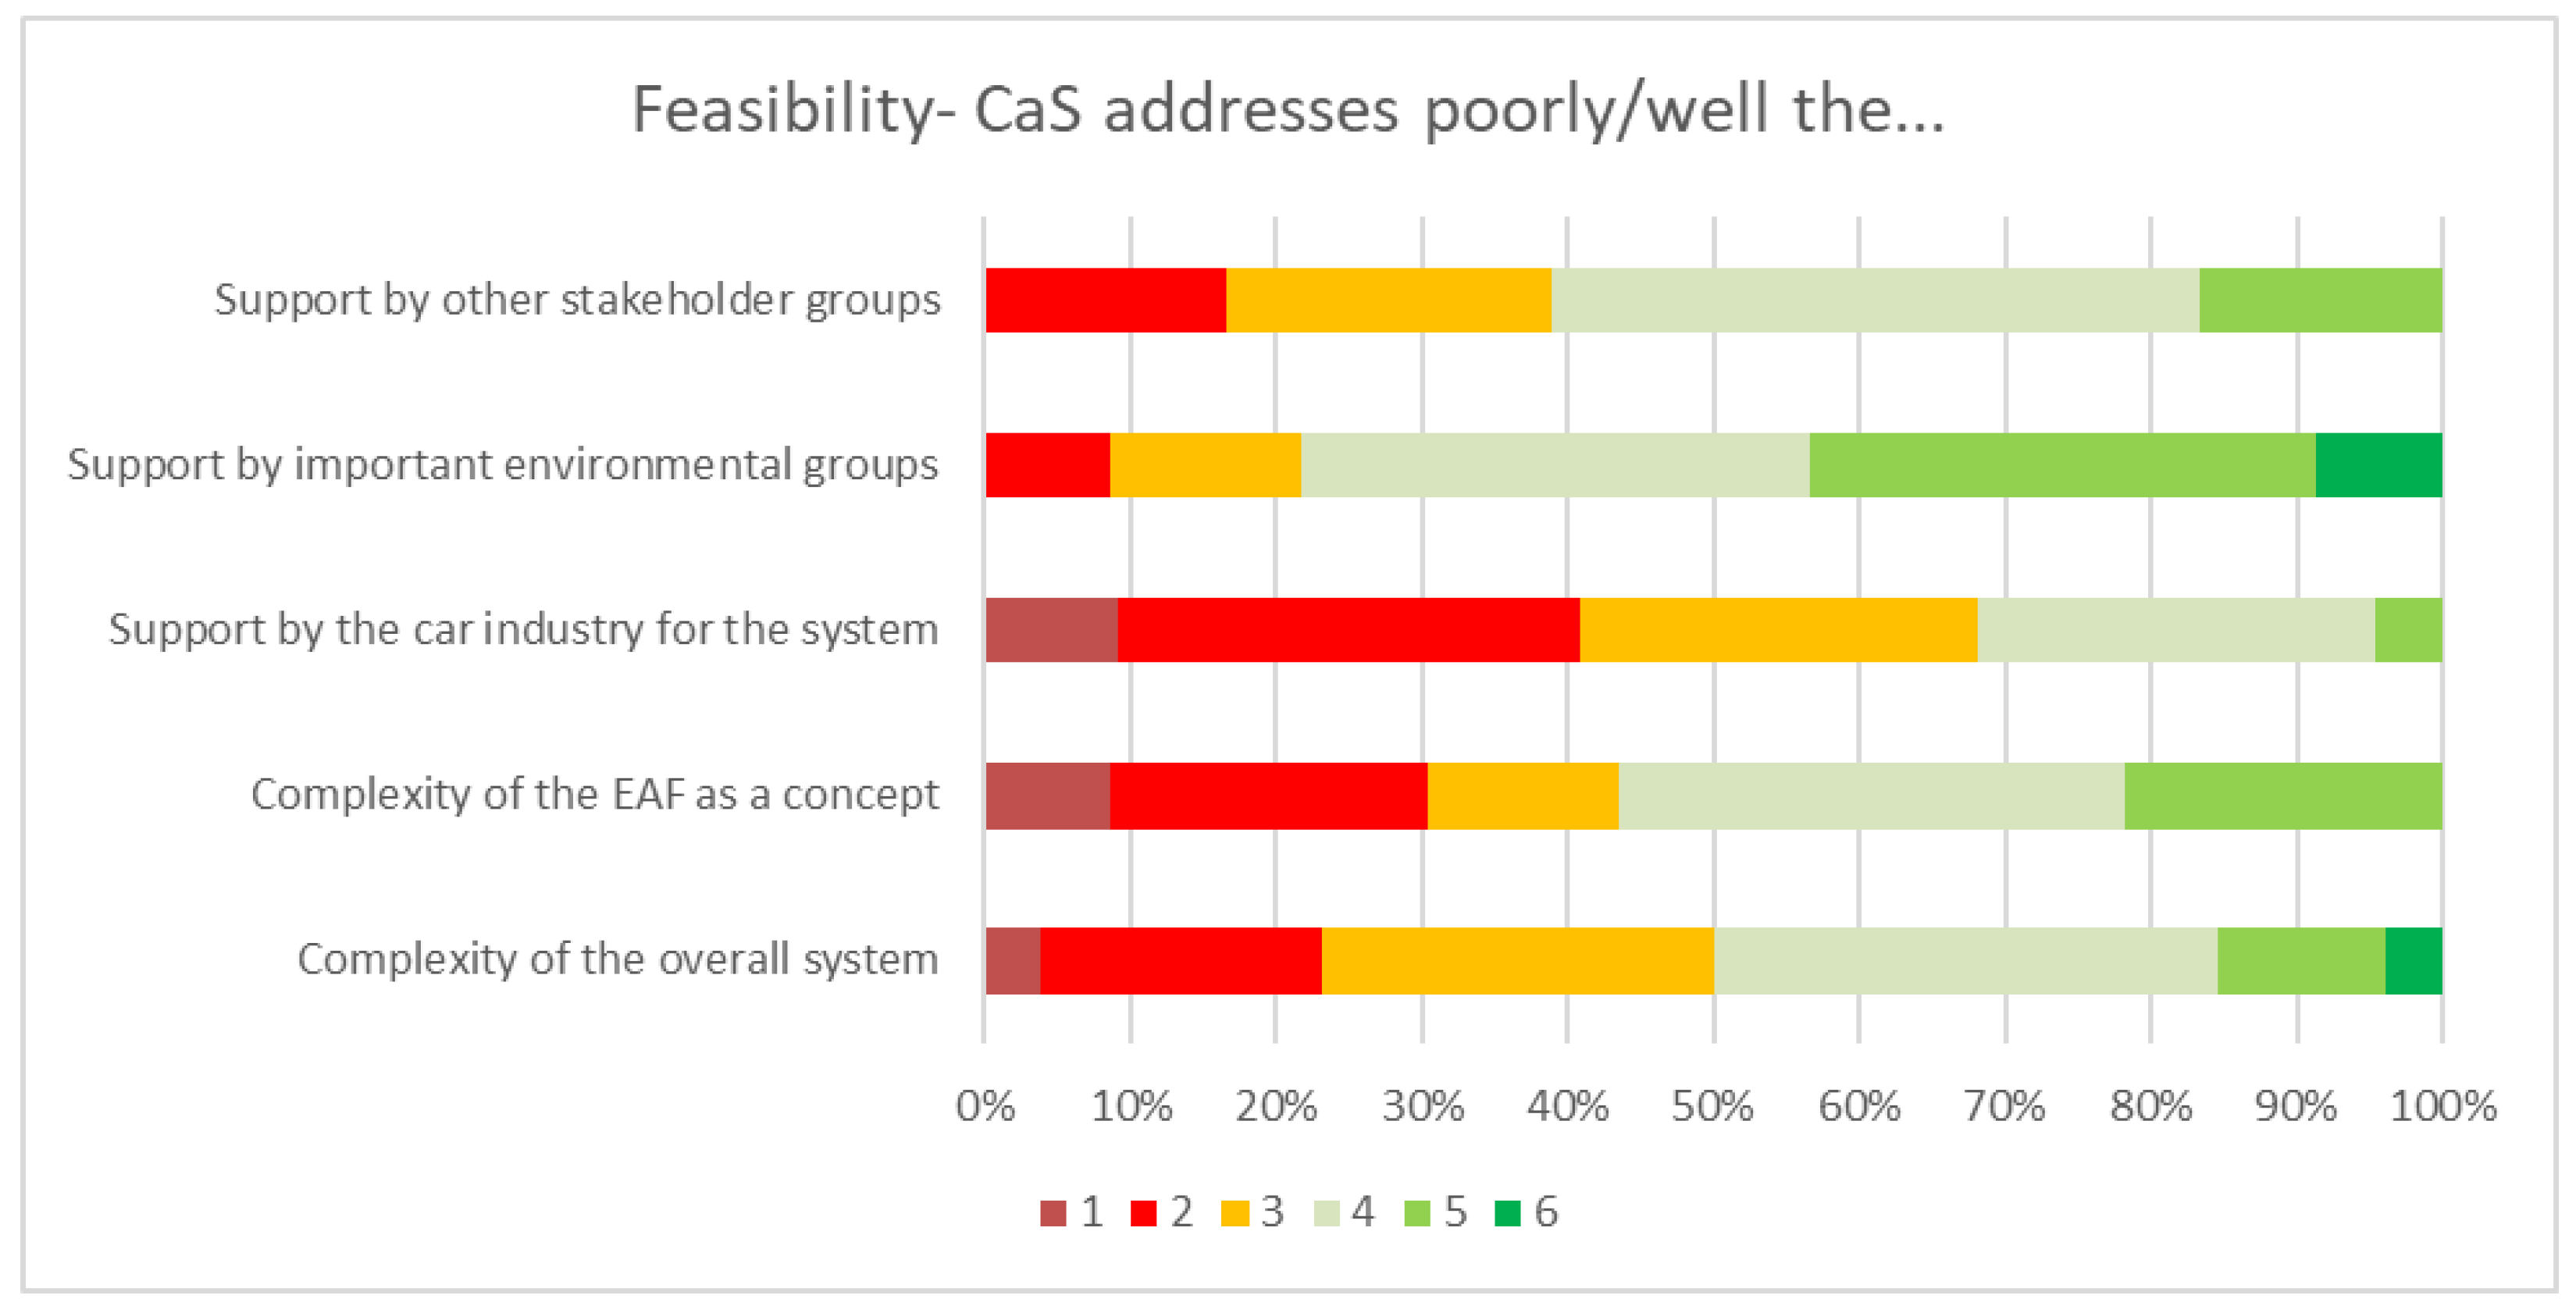
Many experts, however, advocated keeping the system simple to facilitate overall acceptance. However, simplicity comes at a price. The simplest and most transparent implementation that preserves the inherent incentives is to have all the RTAs sold by the state, meaning none would be given out for free. Such a design, however, does not allow for social considerations, the mitigation of which may be indispensable for public acceptance. Hence, we see the main challenge posed by a C&S system to be striking the right balance between the complexity needed to meet social concerns and the simplicity needed for operational feasibility.
In this context, it might be worth recalling that the system does not necessarily bring more complexity to consumers, if the national allocation rules are designed to address the specific features of the member state concerned. Surrendering CO2 is, to the consumer, like paying for fuel, regardless of the administrative complexity the competent authorities have to cope with. Taking the current complexity accruing from determining standards, including the testing of cars, the definition of the slope, the necessary monitoring and reporting to establish and enforce compliance [5,19,20,25,26,58,98,99,100,101], specific rules on pooling and credits [25,58,102,103] as a benchmark for what competent authorities could successfully cope with, it is hard to see why national allocation rules could not effectively address social hardships and specific circumstances prevailing in a given member state. The benefits of constantly decreasing emissions eventually resulting in the decarbonization of the road transport sector—an indispensable requirement if net zero GHG emissions are to be met by 2050—may well justify certain administrative efforts.

5.5. Limitations of This Study and Need for Further Research

As with all stated-preference studies, self-report and selection biases are potential weaknesses of our study instrument. The questionnaire, however, was constructed to mitigate these biases. First, it used neutral language from historical decisions and experiences rather than focusing on options as such. Second, the topics clearly susceptible to bias, especially in the assessment of impacts, were verified and reliability was validated by applying open-ended questions in different sections to allow for a test–retest approach. Third, the questions were carefully ordered to avoid bias.
A further limitation is the small number of interviews that limits drawing far-reaching statistical conclusions. This, however, needs to be considered in light of the fact that the population of EU road transport policy experts is small. We also took steps to avoid hierarchical bias in the interviews. Reliability could be enhanced by enlarging sample sizes and investigating the reasoning behind each investigated category, as well as by extending the study to cover other transport modes. Design and governance choices could be evaluated against framework conditions to derive potential complementarity or disruptiveness of applying a cap-and-surrender approach in the individual EU member states. This would, however, require a harmonized reporting of policy measures and impacts, which has not yet been established, but which might emerge in the subsequent round of NECPs. Until such an objective comparison framework is available, expert assessments can serve as a good proxy to track the workability of a demand-based policy instrument to curb GHG emissions in the road transport sector.
On the other hand, both surveys and workshops clearly underlined the need for more research. Most important in this respect is more insight into the potential savings of CO2 that could be made available in the short term (i.e., without switching to zero emission vehicles) through an incentive-induced gradual change in behavior. Well-founded findings in this respect might justify the costs of building the infrastructure of a C&S system, including costs to equip existing vehicles. The actual infrastructure design, in particular of the necessary equipment for vehicles and filling stations, represents another question that has to be addressed before a thorough assessment of costs and benefits can be assigned to a C&S system. It is clear that introducing a system, such as our prototype, would necessitate long-term planning.
With such a view in mind, it might be promising to follow suggestions from experts to consider capturing other pollutants from road transport. Emitting less CO2 will also affect road transport emissions of different hydrocarbons, volatile organic compounds (VOC), carbon monoxide (CO), particulate matter (PM) and nitrogen oxides (NOx). While it can, to some extent, be expected that these pollutants would also decline with reduced CO2 emissions—the optimization of combustion in an internal combustion engine may result in less CO2, but more NOx. Furthermore, abrasive emissions from tires, brakes and clutches are not a result of combustion, even if they may decline as a consequence of less transport services performed with CO2 emissions or in individual cars [5]. In any case, it might be worth seeking to cover these emissions too, as it would certainly increase the cost–benefit ratio of the whole approach.
Data protection was mentioned as an issue that would merit further research, too. This applies to both the protection of consumer data (personal data) and the protection of the data system against attacks and/or manipulation from outside.
Experts did not mention the possibility of fraud—i.e., providing fuel from clandestine sources, which may sniff out new “business opportunities”. While fraud is not likely to be fully prevented, it is unlikely to seriously undermine the system. The probability of its occurrence may depend on the range of exemptions which are likely, as fuel for military purposes and possibly some other segments (e.g., police, ambulance) are obvious candidates in this respect. Subject to further investigations, the potential “leakage” does, however, not appear to reach a scale that could outweigh the benefits in terms of absolute emission reductions.

6. Conclusions

This paper sought to enhance the toolbox of road transport emission policies by designing and assessing a downstream, demand-side approach that we label “cap and surrender” (C&S). Following an assessment of existing road transport policies, we assembled a policy prototype based on the design-thinking methodology. In a subsequent step, we asked European transport experts to assess the concept in terms of economic, environmental and social impacts.
A review of existing scientific literature and studies shows that analyzing demand-side policies closes a gap in existing literature, which has not been discussed so far. We find that a system such as C&S could fill a gap in current policies. Yet the time required to set up such a system, as well as the political circumstances, may make this an inopportune time to embark on an implementation immediately. In the longer term, however, and bearing in mind 2050 targets and beyond, it might be promising to supplement existing actions and to increase the overall acceptance of pull measures taken to convince consumers of the need for more sustainable transport patterns.
Regarding the assessment of the policy prototype’s impacts, experts were overwhelmingly positive on environmental effectiveness, but more cautious in terms of some economic and social impacts. According to the European Commission, Europe should achieve the net-zero emissions target by 2050. It is safe to say that this is going to require a significant change in behavior across all European societies and states. Therefore, confronting people with the need to change behavior by discussing a push measure, such as C&S, may appear a promising option. Employing such a system in the longer term is likely to provide a high level of awareness that paves the way for further and possibly more radical measures and actions to arrive at net-zero in the time that remains.
While C&S represents a stand-alone system, it is not a stand-alone policy. It allows for the full decarbonization of the road transport sector within a pre-defined time; however, it will only be successful if embedded in an overall policy strategy that ranges from energy policies to spatial and urban planning and affects not only the organization of work, but the organization of civil life in a low carbon economy under democratic conditions. The European Green Deal may be the first step in this direction. Achieving net-zero emission is complicated objective to reach. It will necessitate complex actions that inevitably affect ordinary people. The awareness raising effects of a C&S system, interacting with a broad share of the society, may help to prepare the ground.

Supplementary Materials

Supplementary materials can be found at https://www.mdpi.com/2071-1050/12/18/7594/s1.

Author Contributions

Conceptualization, J.E. and M.R.; Formal analysis, M.R.; Investigation, J.E.; Methodology, J.E. and M.R.; Project administration, J.E.; Writing—original draft, J.E. and M.R. All authors have read and agreed to the published version of the manuscript.

Funding

The article processing charge was funded by the Baden-Württemberg Ministry of Science, Research and Culture and HfWU in the funding programme Open Access Publishing.

Acknowledgments

The authors are grateful to three anonymous reviewers for their constructive and helpful comments and suggestions. We would like to thank Friedrich Ebert Stiftung Brussels and 20 anonymous transport experts for their support of this research. We are grateful to Felix Kreis and Jens Wiederspohn for their assistance in our analyses.

Conflicts of Interest

The authors declare no conflict of interest.

References

  1. European Commission. Communication from the Commission to the European Parliament, the European Council, the Council, the European Economic and Social Committee and the Committee of the Regions: The European Green Deal, COM (2019) 640 Final, Brussels 11.12. 2019. Available online: https://eur-lex.europa.eu/resource.html?uri=cellar:b828d165–1c22–11ea-8c1f-01aa75ed71a1.0002.02/DOC_1&format=PDF (accessed on 20 February 2020).
  2. Council. Council Decision (EU) 2016/1841 of 5 October 2016 on the Conclusion, on Behalf of the European Union, of the Paris Agreement Adopted under the United Nations Framework Convention on Climate Change. Available online: http://data.europa.eu/eli/dec/2016/1841/oj (accessed on 20 February 2020).
  3. European Commission. A Clean Planet for All—A European Long-Term Strategic Vision for a Prosperous, Modern, Competitive and Climate Neutral Economy. Available online: https://ec.europa.eu/knowledge4policy/node/33097_de (accessed on 20 February 2020).
  4. EEA. Monitoring CO2 Emissions from Passenger Cars and Vans in 2018; European Environment Agency: Copenhagen, Denmark, 2020; ISBN 9789294802224. [Google Scholar]
  5. EEA. Explaining Road Transport Emissions. A Non-Technical Guide; Publications Office of the European Union: Luxembourg, 2016; ISBN 9292137220. [Google Scholar]
  6. CE Delft. Emission Trading for Transport and the Build Environment. Available online: https://www.google.com/url?sa=t&rct=j&q=&esrc=s&source=web&cd=&ved=2ahUKEwj37Ji8kN7rAhUP_aQKHbcGD7EQFjAAegQIARAB&url=https%3A%2F%2Fwww.cedelft.eu%2Fen%2Fpublications%2Fdownload%2F619&usg=AOvVaw1gedtv-njsmScz7gxa8aBR (accessed on 20 May 2020).
  7. Bang, G.; Victor, D.G.; Andresen, S. California’s Cap-and-Trade System: Diffusion and Lessons. Glob. Environ. Politics 2017, 17, 12–30. [Google Scholar] [CrossRef]
  8. Mock, P. EU CO2 Emission Standards for Passenger Cars and Light-Commercial Vehicles: Policy Update. Available online: https://theicct.org/sites/default/files/publications/ICCTupdate_EU-95gram_jan2014.pdf (accessed on 20 February 2020).
  9. Cambridge Econometrics. The Impact of Including the Road Transport Sector in the EU ETS: A Report for the European Climate Foundation. Available online: https://www.ebb-eu.org/EBBpressreleases/Cambridge_ETS_transport_Study.pdf (accessed on 20 February 2020).
  10. Smokers, R.; Verbeek, M.; Obdejin, C.; Hill, N.; Norris, J.; van Essen, H.; Kampman, B.; Wrigley, S.; O’Brien, S.; Trompeteler, P. Consideration of Alternative Approaches to Regulating CO2 Emissions from Light Duty Road Vehicles for the Period after 2020. Available online: https://pdfs.semanticscholar.org/b494/3dac33898a0baa380f58147f52c6f0ab82ce.pdf (accessed on 20 February 2020).
  11. Ellerman, A.D.; Jacoby, H.D.; Zimmerman, M.B. Bringing Transportation into a Cap-and-Trade Regime: MIT Joint Program on the Science and Policy of Global Change. Available online: https://www.google.com/url?sa=t&rct=j&q=&esrc=s&source=web&cd=2&ved=2ahUKEwihvommvuDnAhUdQRUIHc-6D4oQFjABegQIChAB&url=https%3A%2F%2Fwww.chicagofed.org%2F~%2Fmedia%2Fothers%2Fevents%2F2007%2Fcost-effective-carbon-restrictions%2Fmitjpspgc-rpt136-pdf.pdf&usg=AOvVaw3HNpujLHspR6lMgosQg_QO (accessed on 20 February 2020).
  12. Kasten, P.; Schumacher, K.; Zimmer, W. Policy Mix in the Transport Sector: What Role Can the EU ETS Play for Road Transport? Available online: https://www.oeko.de/oekodoc/2221/2015-006-en.pdf (accessed on 20 February 2020).
  13. IFP Energies Nouvelles. Greenhouse Gas Emissions in the Road Transport Sector: Moving towards Inclusion in the European System of CO2 Allowances? Available online: https://www.ifpenergiesnouvelles.com/sites/ifpen.fr/files/inline-images/NEWSROOM/Regards%20%C3%A9conomiques/Etudes%20%C3%A9conomiques/Panorama%202015/VA%20Panorama%202015/4-Panorama-2015-VA_GreenhouseGasEmissionsRoadTransport.pdf (accessed on 20 February 2020).
  14. Van Essen, H.; Blom, M.; Nielsen, D.; Kampman, B. Economic Instruments (Paper 7): EU Transport GHG: Routes to 2050. Available online: https://www.tepr.uk/wp-content/uploads/2019/08/EU-Transport-GHG-2050-Paper-7-Economic-Instruments.pdf (accessed on 20 February 2020).
  15. European Commission. A European Strategy for Low-Emission Mobility. Available online: https://eur-lex.europa.eu/resource.html?uri=cellar:e44d3c21-531e-11e6-89bd-01aa75ed71a1.0002.02/DOC_1&format=PDF (accessed on 20 February 2020).
  16. Transport & Environment. Impact of Vehicle CO2 Standards on National Transport Emissions: Why Ambitious Targets Are Essential to Deliver Climate Goals. Briefing. Available online: https://www.transportenvironment.org/sites/te/files/publications/Council%20briefing%20-%20Impact%20of%20vehicle%20standards%20on%20national%20transport%20emissions-output.pdf (accessed on 20 February 2020).
  17. Cambridge Econometrics. The Effectiveness of CO2-Based ‘Feebate’ Systems in the European Passenger Vehicle Market Context: An Analysis of the Netherlands and the UK. A Report for the International Council on Clean Transportation. Available online: https://theicct.org/sites/default/files/publications/CambridgeEconometrics_ICCT_feebate_rpt_Nov2013.pdf (accessed on 20 February 2020).
  18. European Parliament. Regulation (EU) 2019/631 of the European Parliament and of the Council of 17 April 2019 Setting CO2 Emission Performance Standards for New Passenger Cars and for New Light Commercial Vehicles, and Repealing Regulations (EC) No 443/2009 and (EU) No 510/2011. Available online: https://eur-lex.europa.eu/legal-content/EN/TXT/?uri=CELEX%3A32019R0631 (accessed on 20 February 2020).
  19. Yang, Z.; Bandivadekar, A. Light Duty Vehicle Greenhouse Gas and Fuel Economy Standards: 2017 Global Update. Available online: https://theicct.org/sites/default/files/publications/2017-Global-LDV-Standards-Update_ICCT-Report_23062017_vF.pdf (accessed on 20 February 2020).
  20. European Commission. Commission Staff Working Document: Impact Assessment: Proposal for a Regulation of the European Parliament and of the Council Setting Emission Performance Standards for New Passenger Cars and for New Light Commercial Vehicles as Part of the Union’s Integrated Approach to Reduce CO2 Emissions from Lightduty Vehicles and Amending Regulation (EC) No 715/2007 (Recast). Available online: https://eur-lex.europa.eu/legal-content/DE/ALL/?uri=CELEX%3A52017SC0650 (accessed on 20 February 2020).
  21. Skinner, I.; van Essen, H.; Smokers, R.; Hill, N. Towards the Decarbonization of the EU’s Transport Sector by 2050. Available online: https://www.eutransportghg2050.eu/cms/assets/EU-Transport-GHG-2050-Final-Report-22-06-10.pdf (accessed on 20 February 2020).
  22. Slowik, P.; Hall, D.; Lutsey, N.; Nicholas, M.; Wappelhorst, S. Funding the Transition to All Zero-Emission Vehicles: White Paper. Available online: https://theicct.org/sites/default/files/publications/Funding_transition_ZEV_20191014.pdf (accessed on 20 February 2020).
  23. Tagliapietra, S.; Zachmann, G. Addressing Europe’s Failure to Clean up the Transport Sector. Available online: https://www.bruegel.org/wp-content/uploads/2018/04/PB-2018_02.pdf (accessed on 20 February 2020).
  24. Zhou, H.; Yang, Z. The New Passenger Car Fleet in China, 2014: Technology Assessment and Comparison, 2014 Versus 2010: White Paper. Available online: https://theicct.org/sites/default/files/publications/2014China_PV_Database_WhitePaper_20180430.pdf (accessed on 20 February 2020).
  25. Lutsey, N. Modernizing Vehicle Regulations for Electrification: Briefing. Available online: https://theicct.org/sites/default/files/publications/ZEV_Regulation_Briefing_20181017.pdf (accessed on 20 February 2020).
  26. Tietge, U.; Díaz, S.; Yang, Z.; Mock, P. From Laboratory to Road International: A Comparison of Official and Real-World Fuel Consumption and CO2 Values for Passenger Cars in Europe, the United States, China, and Japan: White Paper. Available online: https://theicct.org/sites/default/files/publications/Lab-to-road-intl_ICCT-white-paper_06112017_vF.pdf (accessed on 20 February 2020).
  27. Kemp, M.; Ballesteros, M.; O’Brien, S. Phasing-Out Sales of Internal Combustion Engine Vehicles. Available online: https://www.transportenvironment.org/sites/te/files/publications/2020_03_ICE_phase-out_legal_feasibility_study.pdf (accessed on 20 February 2020).
  28. European Commission. Handbook on the External Costs of Transport. Available online: https://ec.europa.eu/transport/sites/transport/files/studies/internalisation-handbook-isbn-978-92-79-96917-1.pdf (accessed on 20 February 2020).
  29. Bergk, F.; Knörr, W.; Lambrecht, U. Klimaschutz im Verkehr: Neuer Handlungsbedarf nach dem Pariser Klimaschutzabkommen: Teilbericht des Projekts “Klimaschutzbeitrag desVerkehrs 2050”. Available online: https://www.umweltbundesamt.de/sites/default/files/medien/1410/publikationen/2017-07-18_texte_45-2017_paris-papier-verkehr_v2.pdf (accessed on 20 February 2020).
  30. Hynes, W.; Lees, M.; Müller, J.M. Systemic Thinking for Policy Making; OECD: Paris, France, 2020; ISBN 9789264585621. [Google Scholar]
  31. Plattner, H. Design Thinking Research. Making Design Thinking Foundational; Springer: Cham, Switzerland, 2016; ISBN 9783319196411. [Google Scholar]
  32. Alonso-Almeida, M.-d.-M.; Rocafort, A.; Borrajo, F. Shedding Light on Eco-Innovation in Tourism: A Critical Analysis. Sustainability 2016, 8, 1262. [Google Scholar] [CrossRef] [Green Version]
  33. Bernal, R.; San-Jose, L.; Retolaza, J.L. Improvement Actions for a More Social and Sustainable Public Procurement: A Delphi Analysis. Sustainability 2019, 11, 4069. [Google Scholar] [CrossRef] [Green Version]
  34. Chen, L.; Ng, E.; Huang, S.-C.; Fang, W.-T. A Self-Evaluation System of Quality Planning for Tourist Attractions in Taiwan: An Integrated AHP-Delphi Approach from Career Professionals. Sustainability 2017, 9, 1751. [Google Scholar] [CrossRef] [Green Version]
  35. Yoo, S.-K.; Kim, B.-Y. A Decision-Making Model for Adopting a Cloud Computing System. Sustainability 2018, 10, 2952. [Google Scholar] [CrossRef] [Green Version]
  36. European Commission. Commission Staff Working Document: Better Regulation Guidelines. Available online: https://ec.europa.eu/info/sites/info/files/better-regulation-guidelines.pdf (accessed on 20 February 2020).
  37. Scholl, A. Die Befragung; UVK Verlagsgesellschaft mbH: Munich, Germany, 2015; ISBN 9783825240806. [Google Scholar]
  38. Field, A. Discovering Statistics Using IBM SPSS Statistics, 5th ed.; Sage: Los Angeles, CA, USA, 2018. [Google Scholar]
  39. Akbar, U.; Popp, J.; Khan, H.; Khan, M.A.; Oláh, J. Energy Efficiency in Transportation along with the Belt and Road Countries. Energies 2020, 13, 2607. [Google Scholar] [CrossRef]
  40. Saisirirat, P.; Chollacoop, N. A Scenario Analysis of Road Transport Sector: The Impacts of Recent Energy Efficiency Policies. Energy Procedia 2017, 138, 1004–1010. [Google Scholar] [CrossRef]
  41. Dente, S.M.R.; Tavasszy, L. Policy oriented emission factors for road freight transport. Transp. Res. Part D Transp. Environ. 2018, 61, 33–41. [Google Scholar] [CrossRef]
  42. Persyn, D.; Díaz-Lanchas, J.; Barbero, J. Estimating road transport costs between and within European Union regions. Transp. Policy 2020. [Google Scholar] [CrossRef]
  43. Nowakowska-Grunt, J.; Strzelczyk, M. The current situation and the directions of changes in road freight transport in the European Union. Transp. Res. Procedia 2019, 39, 350–359. [Google Scholar] [CrossRef]
  44. Wangsness, P.B.; Proost, S.; Rødseth, K.L. Vehicle choices and urban transport externalities. Are Norwegian policy makers getting it right? Transp. Res. Part D Transp. Environ. 2020, 86, 102384. [Google Scholar] [CrossRef]
  45. Paffumi, E.; de Gennaro, M.; Martini, G. European-wide study on big data for supporting road transport policy. Case Stud. Transp. Policy 2018, 6, 785–802. [Google Scholar] [CrossRef]
  46. De Gennaro, M.; Paffumi, E.; Martini, G. Big Data for Supporting Low-Carbon Road Transport Policies in Europe: Applications, Challenges and Opportunities. Big Data Res. 2016, 6, 11–25. [Google Scholar] [CrossRef]
  47. Mariyakhan, K.; Mohamued, E.A.; Asif Khan, M.; Popp, J.; Oláh, J. Does the Level of Absorptive Capacity Matter for Carbon Intensity? Evidence from the USA and China. Energies 2020, 13, 407. [Google Scholar] [CrossRef] [Green Version]
  48. Coglianese, C. Measuring Regulatory Performance—Evaluating the Impact of Regulation and Regulatory Policy. Available online: https://www.oecd.org/gov/regulatory-policy/1_coglianese%20web.pdf (accessed on 20 May 2020).
  49. Steg, L. Sustainable Transportation A Psychological Perspective. IATSS Res. 2007, 31, 58–66. [Google Scholar] [CrossRef] [Green Version]
  50. Steg, L.; Schuitema, G. Behavioural Responses to Transport Pricing: A Theoretical Analysis. In Threats from Car Traffic to the Quality of Urban Life: Problems, Causes, and Solutions; Gärling, T., STEG, L., Eds.; Elsevier; Emerald Group Publishing Limited: Amsterdam, The Netherland, 2007; pp. 347–366. ISBN 9780080448534. [Google Scholar]
  51. Vieweg, M.; Bongardt, D.; Hochfeld, C.; Jung, A.; Scherer, E.; Adib, R.; Guerra, F. Towards Decarbonizing Transport 2018: A Stocktake on Sectoral Ambition in the G20. Spotlight: The Transport/Energy Nexus. Available online: https://www.agora-verkehrswende.de/fileadmin/Projekte/2017/Verkehr_und_Klima_in_den_G20_Laendern/15_G20_WEB.pdf (accessed on 20 February 2020).
  52. He, H.; Cui, H. China Announced 2019 Subsidies for New Energy Vehicles: Policy Update. Available online: https://theicct.org/sites/default/files/publications/ICCT_China_Nev_Subsidy_20190618.pdf (accessed on 22 May 2020).
  53. Cui, H.; He, H. Proposed Temporary Management Regulation for Corporate Average Fuel Consumption and New-Energy Vehicle Credits for New Passenger Cars in China: Policy Update. Available online: https://theicct.org/sites/default/files/publications/China%20CAFC%20and%20NEV%20credits_policy-update_vF_18052018_updated.pdf (accessed on 20 February 2020).
  54. He, H.; Jin, L.; Cui, H.; Zhou, H. Assessment of Electric Car Promotion Policies in Chinese Cities: White Paper. Available online: https://theicct.org/sites/default/files/publications/China_city_NEV_assessment_20181018.pdf (accessed on 20 February 2020).
  55. Damert, M.; Rudolph, F. Policy Options for a Decarbonization of Passenger Cars in the EU: Recommendations Based on a Literature Review. Available online: https://www.econstor.eu/bitstream/10419/176679/1/1015282210.pdf (accessed on 20 February 2020).
  56. Lutsey, N.; Grant, M.; Wappelhorst, S.; Zhou, H. Power Play: How Governments Are Spurring the Elictric Vehicle Industry: White Paper. Available online: https://theicct.org/sites/default/files/publications/EV_Government_WhitePaper_20180514.pdf (accessed on 20 February 2020).
  57. Yang, Z.; Muncrief, R.; Bandivadekar, A. Global Baseline Assessment of Compliance and Enforcement Programs for Vehicle Emissions and Energy Efficiency. Available online: https://theicct.org/sites/default/files/publications/PV-C&E-global-baseline-assessment_ICCT-report_14112017_vF.pdf (accessed on 20 February 2020).
  58. IEA. Global EV Outlook 2020: Entering the Decade of Electric Drive? Available online: https://www.iea.org/reports/global-ev-outlook-2020 (accessed on 20 February 2020).
  59. Bannon, E. Road to 2030: How EU Vehicle Efficiency Standards Help Member States Meet Climate Targets: Transport Emissions Reductions in the Context of the 2030 Effort Sharing Decision. Available online: https://www.transportenvironment.org/sites/te/files/2015%2006%20esd%20briefing_FINAL_June.pdf (accessed on 20 February 2020).
  60. Lutsey, N.; Isenstadt, A. How will Off-Cycle Credits Impact U.S. 2025 Efficiency Standards? White Paper. Available online: https://theicct.org/sites/default/files/publications/Off-Cycle-Credits_ICCT-White-Paper_vF_20180327.pdf (accessed on 20 February 2020).
  61. Tietge, U.; Díaz, S.; Mock, P.; Bandivadekar, A.; Dornoff, J.; Ligterink, N. From Laboratory to Road: A 2018 Update of official and “Real-World” Fuel Consumption and CO2 Values for Passenger Cars in Europe. White Paper. Available online: https://theicct.org/sites/default/files/publications/Lab_to_Road_2018_fv_20190110.pdf (accessed on 20 February 2020).
  62. Zhou, H.; Yang, Z. Comparison of Fuel-Efficiency Technology Deployment in Passenger Cars in China, Europe, and the United States: Briefing. Available online: https://theicct.org/sites/default/files/publications/PV_efficiency_China_EU_US_20180615.pdf (accessed on 20 February 2020).
  63. Erbach, G. CO2 Standards for New Cars and Vans: Briefing. EU Legislation in Progress. Available online: http://www.europarl.europa.eu/RegData/etudes/BRIE/2018/614689/EPRS_BRI(2018)614689_EN.pdf (accessed on 20 February 2020).
  64. ICCT. Reducing CO2 and Fuel Consumption: A Summary of the Technology Potential for New Cars in the EU: Briefing. Available online: https://theicct.org/sites/default/files/Briefing%20Technology%20Potential%20Short%20EN%20v2.pdf (accessed on 20 February 2020).
  65. Agora Verkehrswende. Die Fortschreibung der Pkw-CO2-Regulierung und ihre Bedeutung für das Erreichen der Klimaschutzziele im Verkehr. Available online: https://www.agora-verkehrswende.de/fileadmin/Projekte/2017/Klimaschutzszenarien/Agora_Verkehrswende_Pkw-CO2-Regulierung_web.pdf (accessed on 20 February 2020).
  66. Dornoff, J.; Miller, J.; Mock, P.; Tietge, U. The European Commission Regulatory Proposal for Post-2020 CO2 Targets for Cars and Vans: A Summary and Evaluation: ICCT Briefing. Available online: https://theicct.org/sites/default/files/publications/ICCT_EU-CO2-proposal_briefing_20180109.pdf (accessed on 20 February 2020).
  67. European Commission. Regulation (EU) No 333/2014 of the European Parliament and of the Council of 11 March 2014 Amending Regulation (EC) No 443/2009 to Define the Modalities for Reaching the 2020 target to Reduce CO2 Emissions from New Passenger Cars. Available online: http://data.europa.eu/eli/reg/2014/333/oj (accessed on 20 February 2020).
  68. European Commission. Commission Staff Working Document: Impact Assessment: A Policy Framework for Climate and Energy in the Period from 2020 up to 2030. Available online: https://eur-lex.europa.eu/legal-content/EN/ALL/?uri=CELEX%3A52014SC0015 (accessed on 20 February 2020).
  69. Ellerman, A.D.; Marcantonini, C.; Zaklan, A. The EU ETS: Eight Years and Counting. SSRN J. 2014. [Google Scholar] [CrossRef] [Green Version]
  70. ICAP. Emissions Trading in Practice: A Handbook on Design and Implementation. Available online: https://icapcarbonaction.com/en/?option=com_attach&task=download&id=364 (accessed on 20 February 2020).
  71. Carbon Pulse. Low-Carbon Fuel Standards (LCFS)—North America. Available online: https://carbon-pulse.com/50599/ (accessed on 20 February 2020).
  72. Cui, H. China’s New Energy Vehicle Mandate Policy: Policy Update. Available online: https://theicct.org/sites/default/files/publications/China_NEV_mandate_PolicyUpdate%20_20180525.pdf (accessed on 20 February 2020).
  73. Karsten, P.; Blanck, R. The Changeover from the NEDC to the WLTP and its Impact on the Effectiveness and the Post-2020 Update of the CO2 Emission Standards. Available online: https://www.oeko.de/fileadmin/oekodoc/Changeover-NEDC-to-WLTP.pdf (accessed on 20 February 2020).
  74. Hamelinck, C.; Spöttle, M.; Mark, L.; Staats, M. 2030 Transport Decarbonization Options. Available online: https://www.farm-europe.eu/wp-content/uploads/2019/06/Ecofys2019_Transport-decarbonization-2030-CEE.pdf (accessed on 20 February 2020).
  75. Brannigan, C.; Halsey, S.; Hazeldine, T.; Von Einem, J.; Schofield, D. Information to Raise Awareness and Instruments to Stimulate Innovation and Development: Paper 9. Available online: https://www.tepr.uk/wp-content/uploads/2019/08/EU-Transport-GHG-2050-Paper-9-Awareness-and-innovation.pdf (accessed on 20 February 2020).
  76. Schmitz, J.; Menzel, K.; Dittrich, F. Energy Justice: A Concept to Make the Pigouvian Tax Work. In Research Handbook on EU Energy Law and Policy; Leal-Arcas, R., Wouters, J., Eds.; Edward Elgar Publishing: Cheltenham, UK; Northampton, MA, USA, 2017; pp. 273–286. ISBN 9781786431059. [Google Scholar]
  77. EEA. EU Transport Policies and Measures Database. Available online: https://www.eea.europa.eu/themes/transport/dm#c0=10&c1=Data&c1=Graph&c1=Indicator&c1=Interactive%20data&c1=Interactive%20map&c1=Map&b_start=0 (accessed on 20 February 2020).
  78. Phaneuf, D.J.; Requate, T. A Course in Environmental Economics: Theory, Policy, and Practice; Cambridge University Press: Cambridge, UK, 2016; ISBN 978-0-521-17869-3. [Google Scholar]
  79. Binder, K.G. Grundzüge der Umweltökonomie; Vahlen: München, Germany, 1999; ISBN 3800622327. [Google Scholar]
  80. Rogall, H. Neue Umweltökonomie—Ökologische Ökonomie. Ökonomische und Ethische Grundlagen der Nachhaltigkeit, Instrumente zu ihrer Durchsetzung; VS Verlag für Sozialwissenschaften: Wiesbaden, Germany, 2002; ISBN 9783810035004. [Google Scholar]
  81. Ringel, M.; Knodt, M. The governance of the European Energy Union: Efficiency, effectiveness and acceptance of the Winter Package 2016. Energy Policy 2018, 112, 209–220. [Google Scholar] [CrossRef]
  82. Knodt, M.; Ringel, M.; Müller, R. ‘Harder’ soft governance in the European Energy Union. J. Environ. Policy Plan. 2020, 2, 1–14. [Google Scholar] [CrossRef]
  83. Frasch, F. Transaction Costs of the EU Emissions Trading Scheme in German Companies. Available online: https://pdfs.semanticscholar.org/b19c/31c513fdabee2b13cc21799c3481437189ff.pdf (accessed on 22 May 2020).
  84. Jaraite, J.; Convery, F.; Di Maria, C. Assessing the Transaction Costs of Firms in the EU ETS: Lessons from Ireland. SSRN J. 2009. [Google Scholar] [CrossRef]
  85. Heindl, P. The impact of administrative transaction costs in the EU emissions trading system. Clim. Policy 2017, 17, 314–329. [Google Scholar] [CrossRef]
  86. Reinaud, J. Trade, Competitiveness and Carbon Leakage: Challenges and Opportunities. Available online: https://www.chathamhouse.org/sites/default/files/public/Meetings/Meeting%20Transcripts/0109reinaud.pdf (accessed on 22 May 2020).
  87. Ellis, J.; Nachtigall, D.; Venmans, F. Carbon Pricing and Competitiveness: Are they at Odds? Available online: http://www.oecd.org/officialdocuments/publicdisplaydocumentpdf/?cote=ENV/WKP(2019)11&docLanguage=En (accessed on 22 May 2020).
  88. Joltreau, E.; Sommerfeld, K. Why does emissions trading under the EU Emissions Trading System (ETS) not affect firms’ competitiveness? Empirical findings from the literature. Clim. Policy 2019, 19, 453–471. [Google Scholar] [CrossRef] [Green Version]
  89. Hausotter, T.; Steuwer, S.; Tänzler, D. Competitiveness and Linking of Emission Trading Systems. Available online: http://www.uba.de/uba-info-medien-e/4051.html (accessed on 22 May 2020).
  90. Arlinghaus, J. Impacts of Carbon Prices on Indicators of Competitiveness: A Review of Empirical Findings. Working Paper. Available online: https://www.oecd-ilibrary.org/environment/impacts-of-carbon-prices-on-indicators-of-competitiveness_5js37p21grzq-en (accessed on 22 May 2020).
  91. Umweltbundesamt. Implementation of Emissions Trading in the EU: National Allocation Plans of All EU Member States; Umweltbundesamt: Dessau-Roßlau, Germany.
  92. Reinaud, J. Industrial Competitiveness under the European Union Emissions Trading Scheme. Available online: https://www.ogel.org/article.asp?key=1796 (accessed on 22 May 2020).
  93. Laing, T.; Sato, M.; Grubb, M.; Comberti, C. Assessing the Effectiveness of the EU Emissions Trading System. Available online: https://www.cccep.ac.uk/wp-content/uploads/2015/10/WP106-effectiveness-eu-emissions-trading-system.pdf (accessed on 20 February 2020).
  94. European Commission. EU ETS Handbook; European Commission: Brussels, Belgium, 2015. [Google Scholar]
  95. IPCC. Climate Change 2014 Synthesis Report—Summary for Policymakers. Available online: https://www.ipcc.ch/site/assets/uploads/2018/02/AR5_SYR_FINAL_SPM.pdf (accessed on 22 May 2020).
  96. Schaeffer, P. A Note on the Tinbergen Rule, West Virginia University. Available online: https://www.petervschaeffer.com/uploads/7/4/3/3/74334295/a_note_on_the_relevance_of_tinbergen.pdf (accessed on 22 May 2020).
  97. Del Rio, P.; Howlett, M.P. Beyond the ‘Tinbergen Rule’ in Policy Design: Matching Tools and Goals in Policy Portfolios. Lee Kuan Yew Sch. Public Policy Res. 2013. [Google Scholar] [CrossRef]
  98. European Parliament. Directicve 2007/46/EC of the European Parliament and of the Council of 5 September 2007 Establishing a Framework for the Approval of Motor Vehicles and their Trailers, and of Systems, Components and Separate Technical Units Intended for such Vehicles. Available online: https://eur-lex.europa.eu/legal-content/EN/ALL/?uri=CELEX%3A32007L0046 (accessed on 20 February 2020).
  99. EEA. Evaluating 15 Years of Transport and Environmental Policy Integration. TERM 2015: Transport Indicators Tracking Progress towards Environmental Targets in Europe; Publications Office: Luxembourg, 2015; ISBN 9789292137137. [Google Scholar]
  100. Mock, P. Evaluation of Parameter-Based Vehicle Emissions Targets in the EU: How Regulatory Design Can Help Meet the 2020 CO2 Target. White Paper Number 10. Available online: https://theicct.org/sites/default/files/publications/ICCT_EUemissionstargets_jun2011.pdf (accessed on 20 February 2020).
  101. Tietge, U.; Mock, P.; Dornoff, J. CO2 Emissions from New Passenger Cars in the European Union: Car Manufacturers’ Performance in 2018: Briefing. Available online: https://theicct.org/sites/default/files/publications/ICCT_CO2_emissions_pv_EU_2018_20190806.pdf (accessed on 20 February 2020).
  102. European Parliament. Directive 2009/30/EC of the European Parliament and of the Council of 23 April 2009 amending Directive 98/70/EC as Regards the Specification of Petrol, Diesel and Gas-Oil and Introducing a Mechanism to Monitor and Reduce Greenhouse Gas Emissions and Amending Council Directive 1999/32/EC as Regards the Specification of Fuel Used by Inland Waterway Vessels and Repealing Directive 93/12/EEC. Available online: https://eur-lex.europa.eu/legal-content/EN/TXT/?uri=celex%3A32009L0030 (accessed on 20 February 2020).
  103. European Parliament. Regulation (EC) No 443/2009 of the European Parliament and of the Council of 23 April 2009 Setting Emission Performance Standards for New Passenger Cars as Part of the Community’s Integrated Approach to Reduce CO2 Emissions from Light-Duty Vehicles. Available online: https://eur-lex.europa.eu/legal-content/EN/ALL/?uri=CELEX%3A32009R0443 (accessed on 20 February 2020).
Figure 1. Prototyped infrastructure for cap-and-surrender (C&S). Source: Authors.
Sustainability 12 07594 g001
Figure 2. Incentives produced by the C&S prototype to lower road transport emissions. Source: Authors.
Sustainability 12 07594 g002
Figure 3. Distribution of expert rating for policy effectiveness.
Sustainability 12 07594 g003
Figure 4. Distribution of ratings of economic aspects.
Sustainability 12 07594 g004
Figure 5. Assessment of social impacts.
Sustainability 12 07594 g005
Figure 6. Distribution of ratings for the aspect of feasibility.
Sustainability 12 07594 g006
Table 1. Process of establishing and validating model.
PhaseAimMethodMethod SpecificsStakeholder Participation
1Identify current and planned transport policiesQualitative
  • Literature review
  • Content analysis
  • Read-out of impact assessments and NECPs
-/-
2Develop prototype of the “cap-and-surrender” modelQualitative
  • Literature and policy study analyses
-/-
  • Delphi expert interview rounds
21
3Assess and refine the policy modelQuantitative
  • Computer-aided semi-structured questionnaires
  • SPSS analyses of data
105/30 valid
  • Workshop with validation of results and semi-structured discussion of impact assessment
6
Source: Authors.
Table 2. Number of push and pull measures on the supply and demand side of the road transport sector in G20 states.
SupplyDemand
Push5526
Pull4372
Source: Reference [51].
Table 3. Existing policies and measures to address road transport emissions in the EU.
CountryObjectivesPolicy MeasureQuota SystemInformation/Planning
FleetFuelInfra-StructureRegulatoryFiscalEconomicFixedFlexible
AT211003000
BE2531099170011
BG214106000
CR522206003
CY913134003
CZ423324000
DE520206000
DK112302000
EE814059001
ES9475222004
FI531332001
FR211577130011
GR220023000
HU9271360010
IE410203001
IT563509005
LT735216004
LU633150005
LV321221001
MT5384110014
NL410311001
PL110002000
PT7533210010
RO7221101000
SE842347000
SI10262110006
SK210201000
Source: Authors.
Table 4. Planned road transport measures in the National Energy and Climate Plans.
CountryObjectivesPolicy MeasuresQuota SystemInformation/Planning
FleetFuelInfra-StructureRegulatoryTaxationSubsidiesFixedFlexible
AT00.50.52220.501
BE
BG
CR0.50.50.5222002
CY201202000
CZ20.52222001
DE212 11002
DK100201000
EE010202001
ES
FI10.512120.501
FR222212001
GR0.50.512220.50.50
HU
IE
IT111222022
LT212212002
LU
LV
MT0.50.50202000
NL
PL
PT
RO
SE010222002
SI
SK02020.52002
Legend: 2 = more than 1 policy on issue envisaged in NECP; 1 = one policy envisaged; 0.5 = envisaged, but not clearly specified; 0 = not covered; blank = no data. Source: Authors.
Table 5. Main functions of the prototyped infrastructure components.
Infrastructure ElementPurpose
Electronic Allowance Card (EAC)Contains CO2 account, used for surrendering CO2; collects data on fuel consumption
Allowance Surrendering Terminal (AST)Mandatory device at filling station to carry out surrendering by means of EAC; amending CO2 account on EAC (free allocation on primary market); anonymous transfer of data to central computer for calculation of reference value
Electronic Identification Device (EID)Device that links the car with the corresponding EAC to prevent fraud; different technologies available, which may render EID unnecessary
Road Transport Allowance TerminalUsed for buying and selling on primary and secondary market; connected to NRTR for application of EAF in the event of RTA purchase
National Road Transport RegistryCarries out issuance of RTA on primary market to EAC through AST
Central Computer for Calculation of Reference ValuesDetermination of EAF requires reference value which is calculated in almost real time by using the actual data of all filling processes carried out within the scope of the system
Source: Authors.
Table 6. Intraclass correlation per stakeholder group (all impacts).
GroupIntra Class Correlation95% Confidence IntervalF-Test
LowerUpperValuedf1df2Sig.
NGO0.9770.8661.00042.8841230.000
Public administration0.715−0.6411.0003.5051230.074
Think tank0.9630.8530.99927.2092460.000
Business and other0.9160.7750.98611.88351150.000
Table 7. Distribution statistics of policy effectiveness.
ItemReduce Greenhouse GasesReduce Local Air PollutantsInduce Modal SwitchesMobility as a ServiceCar SharingDemand for e-VehiclesReduce Traffic Congest-ionsReduce Fuel ConsumptionEnergy-Saving Driving ModesFuel Switch to Renewable Energies
M5.004.004.003.003.004.004.005.004.004.00
SD1.0221.2351.1871.2041.2781.3651.2571.3391.4581.494
Skewness−0.585−0.699−0.266−0.1840.029−0.700−0.341−0.809−0.274−0.449
Kurtosis−0.691−0.029−1.096−0.936−0.567−0.012−0.966−0.177−1.127−0.478
25 percentile4.003.003.002.002.004.002.003.002.253.00
75 percentile5.005.005.004.004.005.004.005.005.005.00
KS-D0.320.250.210.210.170.200.220.320.210.20
p0.000.000.000.010.050.000.000.000.000.01
Table 8. Distribution statistics of economic aspects.
ItemLeast Cost GHG ReductionUpfront Investment CostsTransaction CostsMonitoring CostsEconomic DistortionsDistortions by Buying/Selling RTAs
M4.004.004.004.002.003.00
SD1.3141.2191.4391.1171.3701.283
Skewness−0.526−0.013−0.279−0.2730.7640.614
Kurtosis−0.293−0.710−0.824−0.331−0.098−0.266
25 percentile3.004.003.004.002.002.00
75 percentile5.005.755.005.004.004.00
KS-D0.210.250.190.180.260.22
p0.010.000.020.020.000.01
Table 9. Distribution statistics of social aspects.
ItemMobility to Generate IncomeMobility for Low-Income GroupsDemand for Individual Mobility
M3.503.004.00
SD1.1911.1971.213
Skewness−0.261−0.086−0.267
Kurtosis−1.118−1.2030.185
25 percentile2.002.003.00
75 percentile4.004.004.00
KS-D0.270.250.23
p0.000.000.00
Table 10. Distribution statistics feasibility.
ItemComplexity of SystemComplexity of the EAFSupport by the Car IndustrySupport by Environmental GroupsSupport by Other Stakeholder Groups
M3.504.003.004.004.00
SD1.1721.3051.0821.08530.979
Skewness0.039−0.4110.046−0.4726−0.350
Kurtosis−0.194−1.012−0.760−0.0918−0.676
25 percentile2.752.002.004.003.00
75 percentile4.004.004.005.004.00
KS-D0.190.240.200.200.27
p0.020.000.030.010.00
Table 11. Determination of individual CO2 budget.
Car Owner (Driver)Annual Mileage in Transition Period per CarAverage Liters per 100 kmFuelCO2 Emissions per Liter in t CO2Total Annual Emissions in t CO2 = Individual CO2 Budget
125,79515diesel0.0026410.215
212,55611diesel0.002643.646
341,20310petrol0.002339.600
419,5647petrol0.002333.191
599528petrol0.002331.855
total28.507
Source: Authors.
Table 12. Driving more, paying less.
[A][B][C][D][E][F][G][H][I][J][K][L]
InputInput2[A]/100 × [B]Input 3[B]–[D][E]3[C] × 0.00233Input 4[G] × ([F] + [H])input 5input 6[K] + [I]
mileage per year(km)individual liters per 100 kmannual fuel use (liters)Ref. valueDeviation from Ref. value (signed)EAF valueCO2 emissions in t CO2 in case of petrolassumed RTA market pricetotal RTA cost (with EAF)fuel price/litertotal fuel coststotal fuel costs including CO2 costs
110,0001010008282.331041.941.5015001541.94
220,000714008−1−13.261029.361.5021002129.36
310,000161600885123.73101946.021.5024004346.02
420,000510008−3−272.3310−39.611.5015001460.39
540,000624008−2−85.591011.181.5036003611.18
Source: Authors.
Table 13. Determination and allocation of dRTA.
[A][B][C][D][E][F][G][H][I][J][K]
carannual mileage in transition period per caravg. liters per 100 kmfuelCO2 emissions per liter in tCO2total annual emissions in tCO2 = individual cap or CO2 budgetcap effectavailable for allocationfree allocation sharefree allocationfor sale on primary marketdesignated RTA (for sale on secondary market)
120,00015P0.002647.9200.97.12880%5.7021.426−1.426
220,00011P0.002645.8080.95.22780%4.1821.045−1.045
320,00010D0.002334.6600.94.19480%3.3550.839−0.839
420,0009D0.002334.1940.93.77580%3.0200.7551.65492
520,0008D0.002333.7280.93.35580%2.6840.6711.65492
total100,000 total26.310 23.679 18.9434.7360.000
Source: Authors. Legend: P—petrol, D—diesel.

