Article

Accelerating Climate Service Development for Renewable Energy, Finance and Cities

by
Kirsten Halsnæs
1,
Lisa Bay
1,
Mads Lykke Dømgaard
1,
Per Skougaard Kaspersen
1,2 and
Morten Andreas Dahl Larsen
1,*
1
Department of Technology, Management and Economics, Technical University of Denmark, Produktionstorvet, Building 424, 2800 Kgs Lyngby, Denmark
2
LNH Water, Kathøjvej 3, 3080 Tikøb, Denmark
*
Author to whom correspondence should be addressed.
Sustainability 2020, 12(18), 7540; https://doi.org/10.3390/su12187540
Submission received: 31 July 2020 / Revised: 8 September 2020 / Accepted: 9 September 2020 / Published: 12 September 2020
(This article belongs to the Special Issue Sustainable Environment and Renewable Energy Studies)

Abstract

:
Wider applications of climate services within the management of climate risks face significant challenges. This paper presents a forecasting approach, to assess the development trends in climate service needs and thereby potential demand in key sectors that are essential to the green solution and will face a general growth in activity and key climate vulnerabilities towards 2050. These sectors are renewable energy, international climate finance, and cities. The geographical scope focuses on Europe, but global trends are included. We here suggest scenarios for growth in future climate services based on baseline development trends and policy scenarios reflecting future low-emission and SDG targets. Barriers and specific needs for climate service development within these sectors are discussed, and alignment of supply and demand within the climate service market is particularly emphasized. We find that several complexities influence the climate service market, including policy frameworks aimed at facilitating climate risk management as well as a lack of fit between the supply and demand sides of the market. Other barriers include uncertainties related to available climate information and socioeconomic climate risk information. Based on the forecasting, we find that substantial benefits can be seen with increased climate service development and deployment across the three sectors.

1. Introduction

An important aim of the development and application of climate services (CS) is to facilitate the implementation of climate change mitigation, and risk management in relation to climate change impacts [1,2]. In the current paper, we focus on CS in support of climate risk reduction options such as disaster risk reduction, early warning systems, and climate change adaptation options given business as usual emission scenarios and climate change mitigation scenarios. The CS could target a wide range of users and could support decision processes and business management. However, developing appropriate CS and enabling the penetration of CS at larger scales can be challenging in practice and there are currently large gaps between supply and demand at the CS markets [1,3,4,5,6,7].
The use of CS is facing several barriers in meeting the needs of the public and the private sector. Significant barriers are arising from the uncertainties and technical complexities of developing context-specific CS [8], as well as from the “hypothetical” character of the benefits associated with applications of CS implying barriers to market development [9].
Previous studies have reviewed the historical development of CS and provide recommendations for the future [10], there among through development of CS frameworks [11] and better coordination [12], albeit without the specific focus on sectors and without scenarios for how the demand for CS could develop. Additionally, it has been argued that CS are driven mainly by the supply side, whereas the demand has been largely unexplored [13,14]. The H2020 EU MARCO project included short- and long-term forecasting of climate services and based on a review of existing forecasting approaches and the methodologies applied, it was concluded, that there is need for new approaches for developing CS forecasts, which both reflect the climate risk mitigation potential of CS as well as how CS deployment in practice can depend on alternative climate policy scenarios [15]. This paper is presenting a novel approach to overcome these limitations.
The literature on CS forecasting methodologies as well as on actual forecasts is very scarce. The literature covers two main categories of studies: top down and bottom up approaches. In the top down approaches, the potential for CS has been assessed by studying climate risk mitigation needs in different regions and sectors. Bottom up approaches takes its starting point in statistics about current CS market activities. The top down based approaches are in many cases closely related to modelling studies and scenario forecasts of climate risks, while CS market studies often project future markets based on statistics or specific market surveys of commercial transactions.
An example of a top down approach reflecting climate risks includes a review study by [16]. It is here concluded that further penetration of CS depends on a clearer estimation of the economic value of using CS. A review of 139 studies was conducted with the main focus on agriculture and the energy sector, and it was concluded that the majority of reviewed studies include ex-ante predictions of the value of CS based on models developed using historical climate data [16]. The value of using CS was then assessed assuming perfect forecasting assumptions and optimal response behaviour. Very few studies are based on observations of actual changes in management occurring because of climate forecasts.
Bottom up based CS market forecasts have been based on information about current market transactions, and market forecasts are regularly supplied as commercial products. Environmental Business International (EBI) [17] provides regular CS market forecasts based on the environmental industry and thereby the supply side of the CS market. The methodology includes regular surveys with panel companies, specific contact to industry leaders, and industry datasets. The kMatrix market consultancy company is, like EBI, developing CS market forecasts based on commercial transactions related to climate change risks and adaptation. The approach is parallel to market forecasting by the company for other markets and is based on a review of various data sources, business accounts, and other commercial information. CS market forecasts based on the current market overview is established as a projection of historical growth rates for different market segments [18].
A mixed top down/bottom up approach has been introduced by [19]. Future CS needs are here addressed by comparing the state of the current commercial CS market by regions and sectors with the average GDP per country and the climate risk index as provided by Germanwatch [20]. It is concluded that there is a correlation between the scale of commercial CS transaction and GDP per capita, but not today between climate vulnerability and CS transactions. In terms of forecasting methodologies, this suggests that further market development will depend on both economic growth in the countries [21] and on their capacity to use CS in risk coping strategies.
In the literature, various approaches have been suggested as a basis for estimating the value of CS and thereby market potentials. In a review paper [22], assess how different sectoral studies have assessed the value of CS forecasts with an emphasis on seasonal forecasts. However, an examination of the actual use of CS forecasts concludes that the value of CS first at all depends on how the forecasts are made usable within the decision-making contexts in which they are applied [22]. This point to the conclusion that the potential for further development of the CS market strongly depends on a close relationship between providers and users.
Several global and regional initiatives have attempted to close the gap between expected hitherto economic efficiency gains by using CS in relation to management and decision making on climate-sensitive activities in the public and private sectors. An example of this is the EU’s H2020 programme, which has supported CS development and facilitation initiatives by funding multiple studies, innovation and demonstration projects. Furthermore, several global CS data and service portals have been established by the World Meteorological Organization (WMO), Copernicus, the Global Framework for Climate Services (GFCS) and others [9]. Challenges in the funding of CS development have been identified by Soares and Buontempo, 2019 [7] in terms of having a user-driven approach, funding security and practical operationalization. The application and usefulness of CS provided by platforms and other providers are difficult to assess, but [9,23] have provided some interesting insights in their presentation of an evaluation framework for assessing the usefulness of CS to society. The authors emphasize the importance of factors like problem identification, the decision-making context, governance and socio-economic values to successful applications of CS. They conclude that a key limitation of CS initiatives has been the weak connection between the providers and users of these services. Further, technical challenges are found in CS deployment in city adaptation efforts [24].
Acknowledging the challenges in the development and application of CS, we have developed a forecasting approach in order to assess development trends in the future potential CS demand in key climate-sensitive sectors. It is here a critical underlying assumption that large future activities in a sector could also potentially imply a large demand for CS. Furthermore, there could be an economies of scale if CS is developed with a focus on sectors with a high expected future activity level [15]. In this context, the forecasting aims at highlighting plausible development pathways for CS within our focal sectors in order to inspire the development of more user-oriented and tailored CS for potential high-demand sectors. Furthermore, the idea is that CS forecasting can provide a basis for targeted stakeholder capacity-building and can help with a stronger articulation of CS demand appropriate for climate risk management [23], and we employ novel tools to aid the process [25,26]. A key outcome of our CS potential forecasting is that more purveyors and buyers could see an advantage in entering specific sectoral markets, thus enabling the development of a stronger CS market with high-quality products with increased turnover and reduced risks [3].
Our CS forecasting is based on a case-study approach and focuses on the needs and potential benefits of specific sectors, namely the renewable energy sector, international climate finance and cities. Our CS forecasting is based on a case-study approach and focuses on the needs and potential benefits of specific sectors, namely the renewable energy sector, international climate finance and cities. We have selected these three sectors as they represent good examples of high climate risks, which are key elements in climate policies for deep decarbonisation, suggesting that there could be high benefits of developing climate services focussing on these sectors. We have selected these three sectors as they represent good examples of high climate risks and are key elements in climate policies for deep decarbonisation, suggesting that the return on the potential investments in CS development could be high. All three sectors are expected to undergo large-scale structural changes in the future and to attract investments with long lifetimes, which, in the context of emerging climate change, could make CS very relevant. The sectors include sub-activities with different climate risks such as for example biomass, hydropower, solar- and wind in the renewable energy sectors, and we will subsequently address these diversities in more detail also with regards to the differing requirements of associated CS. We recognize that CS development for other sectors with high climate risks such as e.g., agriculture, infrastructure and transportation is similarly important, and the forecasting methodology developed and applied in this paper could be equally relevant to be applied specifically for other sectors, which are however outside the scope of this study.
The potentially useful CS information will vary with the scenarios, in the case of high global warming scenarios, such as the RCP8.5 scenario, the climate risks would be different from scenarios which are more in line with the aspirations of the Paris agreement [27]. Similarly, the development trends in renewable energy penetration, climate finance, and city adaptation planning, as addressed in this study, will also be different depending on policy cases, as well as on climate policies [28], which sets very specific framework condition for CS relevant activities. In the study, alternative sectoral scenarios are developed reflecting a continuation of current policy trends versus scenarios with a higher emphasis on climate change mitigation and adaptation, as well as more general policies such as those related to the Sustainable Development Goals (SDGs), where climate actions are included specifically and where co-benefits are expected between climate risk reduction and SDGs. The scenarios are based on available quantitative international modelling results and sectoral plans. High emission scenarios could imply that e.g., the penetration of renewable energy would be relatively low, implying less importance in applying CS within this sector compared to lower RCP scenarios. Oppositely, there could be more need for climate change adaptation in cities in the case of the high RCP8.5 scenario.
The aim of the present paper is to initially present and outline a CS forecasting approach representing alternative climate policy scenarios and the state of currently available technical knowledge for the development of CS in the three sectors chosen for examination. This analysis is followed by a presentation of the methodological approach to forecasting CS needs for each of the sectors in the context of specific scenarios. Finally, the methodology is applied to sectoral studies with a specific focus on Europe supplemented with more general conclusions in a global setting.
The paper is structured as follows: Methodology including the approach in the sectorial forecasts, Results for each sector, Discussion and Conclusions.

2. Materials and Methods

2.1. Aims of Climate Service Use

In this paper, climate services are defined in line with the definition of the EU Roadmap as also proposed by scientific literature [2]. This means that CS includes the transformation of climate-related data and relevant information into customized products, such as projections, forecasts, trends, economic analysis, assessments, counselling, and the development and evaluation of solutions [3]. Climate-related CS data according to the EU definitions include a broad range of data beyond the physical climate data, aiming to represent the Human Earth System with its various connections between physical, chemical, biological, social and economic systems. The CS forecasting approach in this paper is based on the basic assumption that CS support can help to increase adaptation to climate change hazards. CS is therefore only effective to the extent that it facilitates climate change adaptation and reduces climate risks. The argument is that the damage risks of climate change are expected to increase over time, for example, due to enhanced climate change and economic growth leading to increases in the underlying value of the assets at risk. Assuming that using CS to support adaptation will reduce climate risks, the potential economic value of CS then becomes the difference between economic losses without adaptation and the economic losses from adapting society to climate change.
The CS forecasting approach is based on the basic assumption that CS support can help to improve efficient management of climate change risks, and the value of using climate services could increase over time [16,29]. The argument is that climate risks are expected to increase over time, for example, due to enhanced climate change and economic growth leading to increases in the underlying value of the assets at risk. Our assumptions accordingly are, that using CS to support effective risk management, disaster risk reduction, and adaptation could help implement cost-effective coping strategies in the public and private sector [1,30].
Our methodological approach is to base the forecasts on development trends, which are related to available modelling and official plans within our focal sectors. The technical argument for this is, that the models used represent scientifically well-documented forecasts and scenarios and that the official planning included in our scenarios constitutes a key framework condition for CS to penetrate into the market, and is important in relation to how stakeholders and decision-makers within the sector will demand to use CS [15].

2.2. Introduction to the CS Market Forecasting

The sectoral activity forecasts are based on official model-based forecasts for the renewable energy sector. There are several modelling based scenarios for renewable energy, see for example the overview of scenarios provided by [31]. The CS forecast in the paper is based on the IEA World Energy Outlook and Energy Technology Perspectives [32], which in terms of the projections of renewable energy share of total energy supply are in the low to middle range.
The forecast of future finance and investment trends are based on the plans of so-called multilateral development banks (MDBs), which are playing a major role in international climate finance [33]. Potential CS activities in cities are projected based on information on the extent and maturity of city adaptation plans, the plans are used as a basis because the adaptation policies by local governments play a major role in the actual implementation of projects and policies [23,29]. The forecasting methodology is used to provide quantitative forecasts of the trends in future climate-sensitive activities in the three focal sectors addressed here. The forecasts of development trends are developed for a baseline trend (current policies) and for scenarios, which include climate policies.
Our methodological approach is forecasting future sectoral activity trends based on a continuation of current trend scenarios and climate policy scenarios. We are providing indexes of future activity trends rather than economic CS market forecasts for the sectors. An economic market estimate would suffer from very large uncertainties both in relation to estimating the current market volume, and in relation to forecasting business perspectives of the commercial parts of the CS market, and the CS products could be more efficient in the future e.g., due to increased data availability and economics of scale, which could decrease CS provision costs with increasing market volumes [29]. The uncertainties in estimating CS market volumes i.e., are also associated with the wide range of CS purveyors including universities, meteorological offices, consultancies, international CS platforms, and dedicated service companies, and the mix of commercial services transacted as market products and services delivered in terms of open access data sources, and as part of other costumer relations [14].
Based on the CS forecast scenarios, we draw conclusions on the potential for CS development in the chosen sectors to implement climate risk management options. Finally, we discuss the potential for upscaling the forecasting results to other sectors, as well as the uncertainties involved in the development of technical climate information and in the facilitation and implementation of climate risk management options.
A more detailed description of the methods applied to forecasting CS in the three chosen sectors, the renewable energy sector, the financial sector, and cities, are provided in what follows.

2.3. Method for Forecasting CS in the Renewable Energy Sector

The transformation of the energy sector is a key element in climate change mitigation. Achieving stabilization of the currently rising global mean temperature around 2 °C and reaching 450 ppm CO2eq by 2050 [34] would require global GHG emissions to be three to four times lower than today and would require wide penetration of renewables, nuclear and fossil fuels with CCS (carbon capture and storage) [31]. The efficiency and potential of renewable energy is critically dependent on weather and climate events [35,36] in respect of the management of both integrated technical systems and energy markets, as well as the planning of new renewable energy projects [37]. The use of CS information in both medium- and long-term planning of renewable energy options is, however, very limited [4,38], which could imply efficiency losses and management challenges in relation to the security of supply.
A number of studies such as [37,39,40,41] have assessed the climate vulnerabilities of different renewable energy technologies and highlight the following climate vulnerabilities of the main renewable technologies reaching the following overall conclusions. Energy conversion is vulnerable to both gradual changes in climate, seasonal fluctuations and variability and the projected intensification of extreme weather events. The efficiency of existing and future plants may decrease with higher general outdoor air temperatures [42]. Other than the daily demand curves, the seasonality [43] and variabilities [44] in renewable forcings which may lead to low or high supply levels, the latter with storage potential, need to be accounted for in power system capability studies and associated climate risk studies and hydropower is often mentioned as a counterbalance variabilities from the wind and solar sides [45]. Biomass is also expected to play a key role in future energy scenarios for low-temperature targets [31,46] both as a low carbon source and with bio-energy capture and storage (BECS) to ensure carbon uptake from the atmosphere.
Furthermore, damage from storms and flooding can disrupt energy supplies and critical infrastructure with large consequences for the economy and for disaster management in the case of extreme weather events [47]. Frameworks for the assessment of power system resilience are therefore urged [48] along with further advances within data availability and quality to properly assess power system and hydro-climatic interlinkages [49]. Due to the general projected increasing global temperatures, also affecting the cooling water temperature, and changes in water availability, thermoelectric power plants worldwide are projected to experience a 7–12% reduction in efficiencies by 2050 affecting 81–86% of all plants [42]. The efficiency of electricity transmission lines is also very vulnerable to high temperatures [50].
For the CS scenario analysis in light of the risks outlined above, we assess the development trends in renewable energy supply and thus the potential needs for CS with a focus on the large planned penetration of renewable energy options according to climate policies both in Europe and globally.
The energy system forecasts used here are based on the IEA Energy Technology Perspectives 2017 [32], which provide the underlying energy forecast in the CS scenarios for the energy sector. The main focus is on renewable electricity generation and capacity, and two scenarios are included, n(2DS). In both scenarios, we calculate the expected index growth for the various energy sources from 2014 to 2030 using the observed generation and capacity in the year 2014 as index 100. Finally, the geographical distribution of the electricity generation mix and the share of sources are assessed based on the World Energy Outlook 2018 [32].

2.4. Method for Forecasting CS for International Climate Finance

International public climate finance is currently a significant contributor to adaptation finance and forecasts are here based on future development plans by international finance institutions, including the multilateral development banks (MDB), which in 2016 contributed about 40% of the public adaptation finance [51]. The definition used here follows [52], constituting the amounts committed to climate mitigation and adaptation, albeit not for developing countries alone. The total annual average international financial flows by the MDB’s include finance from their own accounts and from other donors managed through the MDBs. In 2015–2016, this finance was USD 58 bn, the largest contributors being bilateral and multilateral climate finance [52].
Our forecast of international climate finance is based on the assumption that CS could be an important component of project preparation for climate finance. The MDBs distinguish between climate finance for mitigation and adaptation. The mitigation area includes in particular finance of renewable energy options, and the accounting principle, until now, has been that the full investments within these projects were accounted as climate finance. Adaptation finance has been only a small proportion of the available finance and the accounting framework has focused on addressing only specific incremental cost elements in the project finance. This has in practice complicated the MDB adaptation finance and limited the investment scales, despite the large need for adaptation finance identified in studies by UNEP and the World Bank [52]. However, recent political signals from the World Bank [53] point to the increasing prioritization of adaptation in climate finance, which could imply a need to develop particular CS to support it.
Recently, a major priority of international financial mechanisms has been to pay special attention to areas like climate change. Combined with private-sector finance, this can be expected to be a major driver of the future demand for CS [52]. The MDBs have specific targets for the share of climate-related activities in their investment portfolios, implying a growing demand for CS information in relation to the climate components of finance. The integration of climate components into specific investments has to follow specific guidelines for projects.
In this paper, we compare alternative scenarios for future climate finance based on goals set by individual MDBs. The goals include a tripling of climate finance by the African Development Bank (AfDB) from 2015 to 2020, 40% of the European Bank of Reconstruction and Development annual business investments in green finance by 2020, 35% of all lending in developing countries by the EIB by 2020, and 28% of annual commitments by the WBG by 2030 [54]. Based on these 2020 targets by the MDBs for climate finance, it is clear that CS could potentially play a large role in ensuring efficient climate finance in the future. CS forecasts can help to identify large-scale application areas and specific needs, and thereby to close the gap between CS supply and demand. Accordingly, CS deployment costs can be reduced, and the services could be upscaled.
Below, we present four alternative international climate scenarios and a baseline scenario, used to identify key development trends in CS markets until 2030 in terms of the scale of finance, the sectoral focus and the geographical distribution. All scenarios are calculated as index growth in the year 2030 projected from the MDB finance of USD 35,219 million in 2017 [43] (i.e., index 100).
Baseline scenario: This scenario reflects a continuation of the current trends in the climate finance of the MDBs. It is constructed using a linear extrapolation to 2030, assuming that annual growth in MDB finance follows the same yearly growth as from 2011 to 2017.
Scenario 1: Increase in all MDB finance as planned for the EU and with a 25% share of all finance to be climate-related. This reflects an increase of € 114 billion, or 55%, from the 2014–2020 level (€ 206 billion) to the 2021–2027 level (€ 320 billion). The 55% increase is used to estimate the finance level in 2030. The share of climate change mitigation and adaptation is assumed constant here, as in the past.
Scenario 2, low and high: According to UNEP [46], the annual financial adaptation gap is estimated to be between USD 148 and 300 bn in 2030 for the low and high scenario respectively. This corresponds to an increase of 150% for the low and 311% for the high scenario compared to the 2016 level, which is used linearly to estimate future climate finance.
Scenario 3: It is assumed that climate finance will grow as required to meet the SDGs in developing countries estimated by the Organisation for Economic Co-operation and Development (OECD) [55]. The OECD concludes that in 2030 the total annual finance required by developing countries to meet the SDGs will be USD 3.9 tn. Current annual investments are USD 1.4 tn, leaving a gap of USD 2.5 tn annually, corresponding to an increase of 79% in investments.
Scenario 4, wet and dry: The World Bank [53] estimates the need for annual adaptation finance under two different climate scenarios: A wet scenario requiring an increase in investments from USD 72.9 to 89.1 bn corresponding to 22%, and a dry scenario requiring an increase from USD 56.5 to 71.3 bn corresponding to 26%.

2.5. Method for Forecasting CS in Cities

Cities are expected to grow globally, and in the EU more than 80% of the population is projected to reside in urban areas by 2050 [56]. In addition, climate risks in the form of both heat waves and flooding events threaten cities globally. To adapt to the future challenges, several international city networks are jointly working on supporting mitigation and adaptation plans (e.g., the Global Covenant of Mayors for Climate and Energy [57], the World Mayors Council on Climate Change [58], ICLEI [59], C40 [60], UNDRR [61], etc.). Today, thousands of local government bodies are members of the EU’s Covenant of Mayors for Climate and Energy, and many more belong to the other global city networks, stating a strong city interest in the development of climate policies and risk management strategies [62]. The majority of cities are only in very initial phases of climate planning and the existing plans are mostly at the initial stage measured in relation to more advanced planning stage as defined by the Covenant of Mayors [63,64,65]. It is expected that CS can play a key role in the development of climate plans for cities and that both governments and the private sector can be potential CS users [23]. Further, CS information alongside climate policies could be mainstreamed into urban development activities including infrastructure, spatial planning, operational management of services, health etc., which requires new CS products to be developed and new user needs to be met beyond official adaptation planning.
The climate adaptation service forecast for cities is based on EU data on the extension of climate change adaptation plans today [23]. Secondly, we are investigating policy scenarios, thus influencing the urban development agenda, as well as adaptation planning. The adaptation plans in cities can include contributions from several different city departments and the actual development of the plans could also involve a wide range of actors including private consultants, the local government, experts, and stakeholders, which all in practice could be users of CS. Their needs could be different, and we are in the current forecast not going into details on the specific elements and actors in the city planning. The involvement of plenty of actors could require a larger demand for CS, but it could also oppositely imply that CS is mainstreamed into sectoral activities and, thereby, not stand as a separate activity [23].
In this study, we use information about city climate plans as an indicator of ongoing and future CS demand based on the comprehensive studies of [63,64]. These authors have provided an overview of the adaptation plans of 885 European cities, their development stage and their relationship to international coordination networks. We are using these studies in combination with the Covenant of Mayors for Energy and Climate database of cities planning progress [57] and [65] as a basis for assessing the state of the art in European adaptation planning.
The forecasting of local adaptation planning by cities is based on the following two policy scenarios:
Scenario 1: Based on data from the Covenant of Mayors for Energy and Climate’s database of cities planning progress [57], we estimate the number of cities with climate action- and adaptation plans in 2030. We assume that the number of signatories to the Covenant of Mayors’ climate plans will make progress in accordance with a linear interpolation of the recently observed trend from 2009–2017. Furthermore, it is assumed that all cities that currently have climate action plans will also have adaptation plans in 2030. Since October 2015, all new signatories to the Covenant of Mayors must prepare and submit a Risk and Vulnerability Assessment along with a Sustainable Energy and Climate Action Plan, meaning that 1750 of the 6000+ signatories in 2017 include adaptation planning at least at stage 2. The number of adaptation plans is expected to grow in the scenario at least at the same rate as the climate action plans since all new signatories are committed to the preparation of the risk and vulnerability assessment as an initial stage in the development of an adaptation plan. The signatories to the Covenant of Mayors for Climate and Energy include signatories from local authorities of all sizes, from small towns to megacities.
Scenario 2: It is assumed that all 1750 cities that have signed up to the Covenant of Mayors and already have adaptation plans will move up to the most advanced planning stage by 2030 as defined by the Covenant of Mayors [57]. Assuming that moving up the various steps implies further adaptation planning activities and thereby climate adaptation services, growth in CS demand is implied.

3. Results

3.1. The Energy Sector

The IEA’s Energy Technology Perspectives for 2017 [32] is used as the underlying energy forecast in our global scenarios for CS development in the renewable energy sector. The main focus is on electricity generation and new capacities, and two scenarios are presented, namely the Reference Technology Scenario (RTS) and the 2 Degree Scenario (2DS). Finally, the geographical distribution of the electricity generation mix and share of sources is considered based on the World Energy Outlook for 2018 [32].

Electricity Conversion Scenarios

The global electricity generation forecast from [32] based on recent policy trends (RTS) assumes that the share of renewable energy such as wind and solar power will increase in the whole period, but fossil fuels like coal and gas will continue to have a very large share of electricity production until 2060, including coal with CCS. Major increases are seen in coal with CCS and solar thermal electricity (STE) after 2030, and in [32]. The 2DS policy scenario assumes that, in order to stabilize the global temperature increase at 2 °C, wind, solar energy, biofuels and waste-based electricity production would need to increase over the entire scenario period until 2060 [32] from approximately 22% to 78%. Moreover, very strong growth in coal and gas with CCS is needed after 2030.
Table 1 shows the growth in gross electricity generation and capacity in Europe in both the RTS and 2DS scenarios. The results clearly demonstrate a large difference between the expected development trends in electricity generation and in the gross electricity-generating capacity between renewable options, fossil fuels and nuclear power. The differences in development trends are most evident in the 2DS scenario. Renewable options like solar, wind, biomass, and ocean energy are expected to grow very rapidly, while coal, oil and gas are expected to have a decreasing share of electricity generation in 2030 compared with 2014 in both scenarios. This implies a strong case for Europe developing CS to support the planning of renewable electricity generation and investments, especially in the 2DS scenario.
Regionally, the IEA World Energy Outlook [66] shows that renewables will increase in all regions and that nuclear is expected to increase as well, except in Europe, the US, and Africa. There is a remarkable difference between the scenarios for future shares of renewables and fossil fuels across the different regions, despite a large increase in renewables in all regions. The shares of fossil fuels are expected to decrease only in the EU and Japan. Fossil fuels will still be important in emerging economies and in the US in both the short and longer terms. In general, new investments in renewable energy versus fossil fuels will depend largely on climate policy scenarios, and very specific CS would be required for different sources for context-specific locations and applications.
In terms of market scale, very large expansions of new generating capacity may occur in India, China and the US, and renewables can be expected to play a large part in this market growth, implying that the development and deployment of context-specific CS would be very important in these regions.

3.2. International Climate Finance
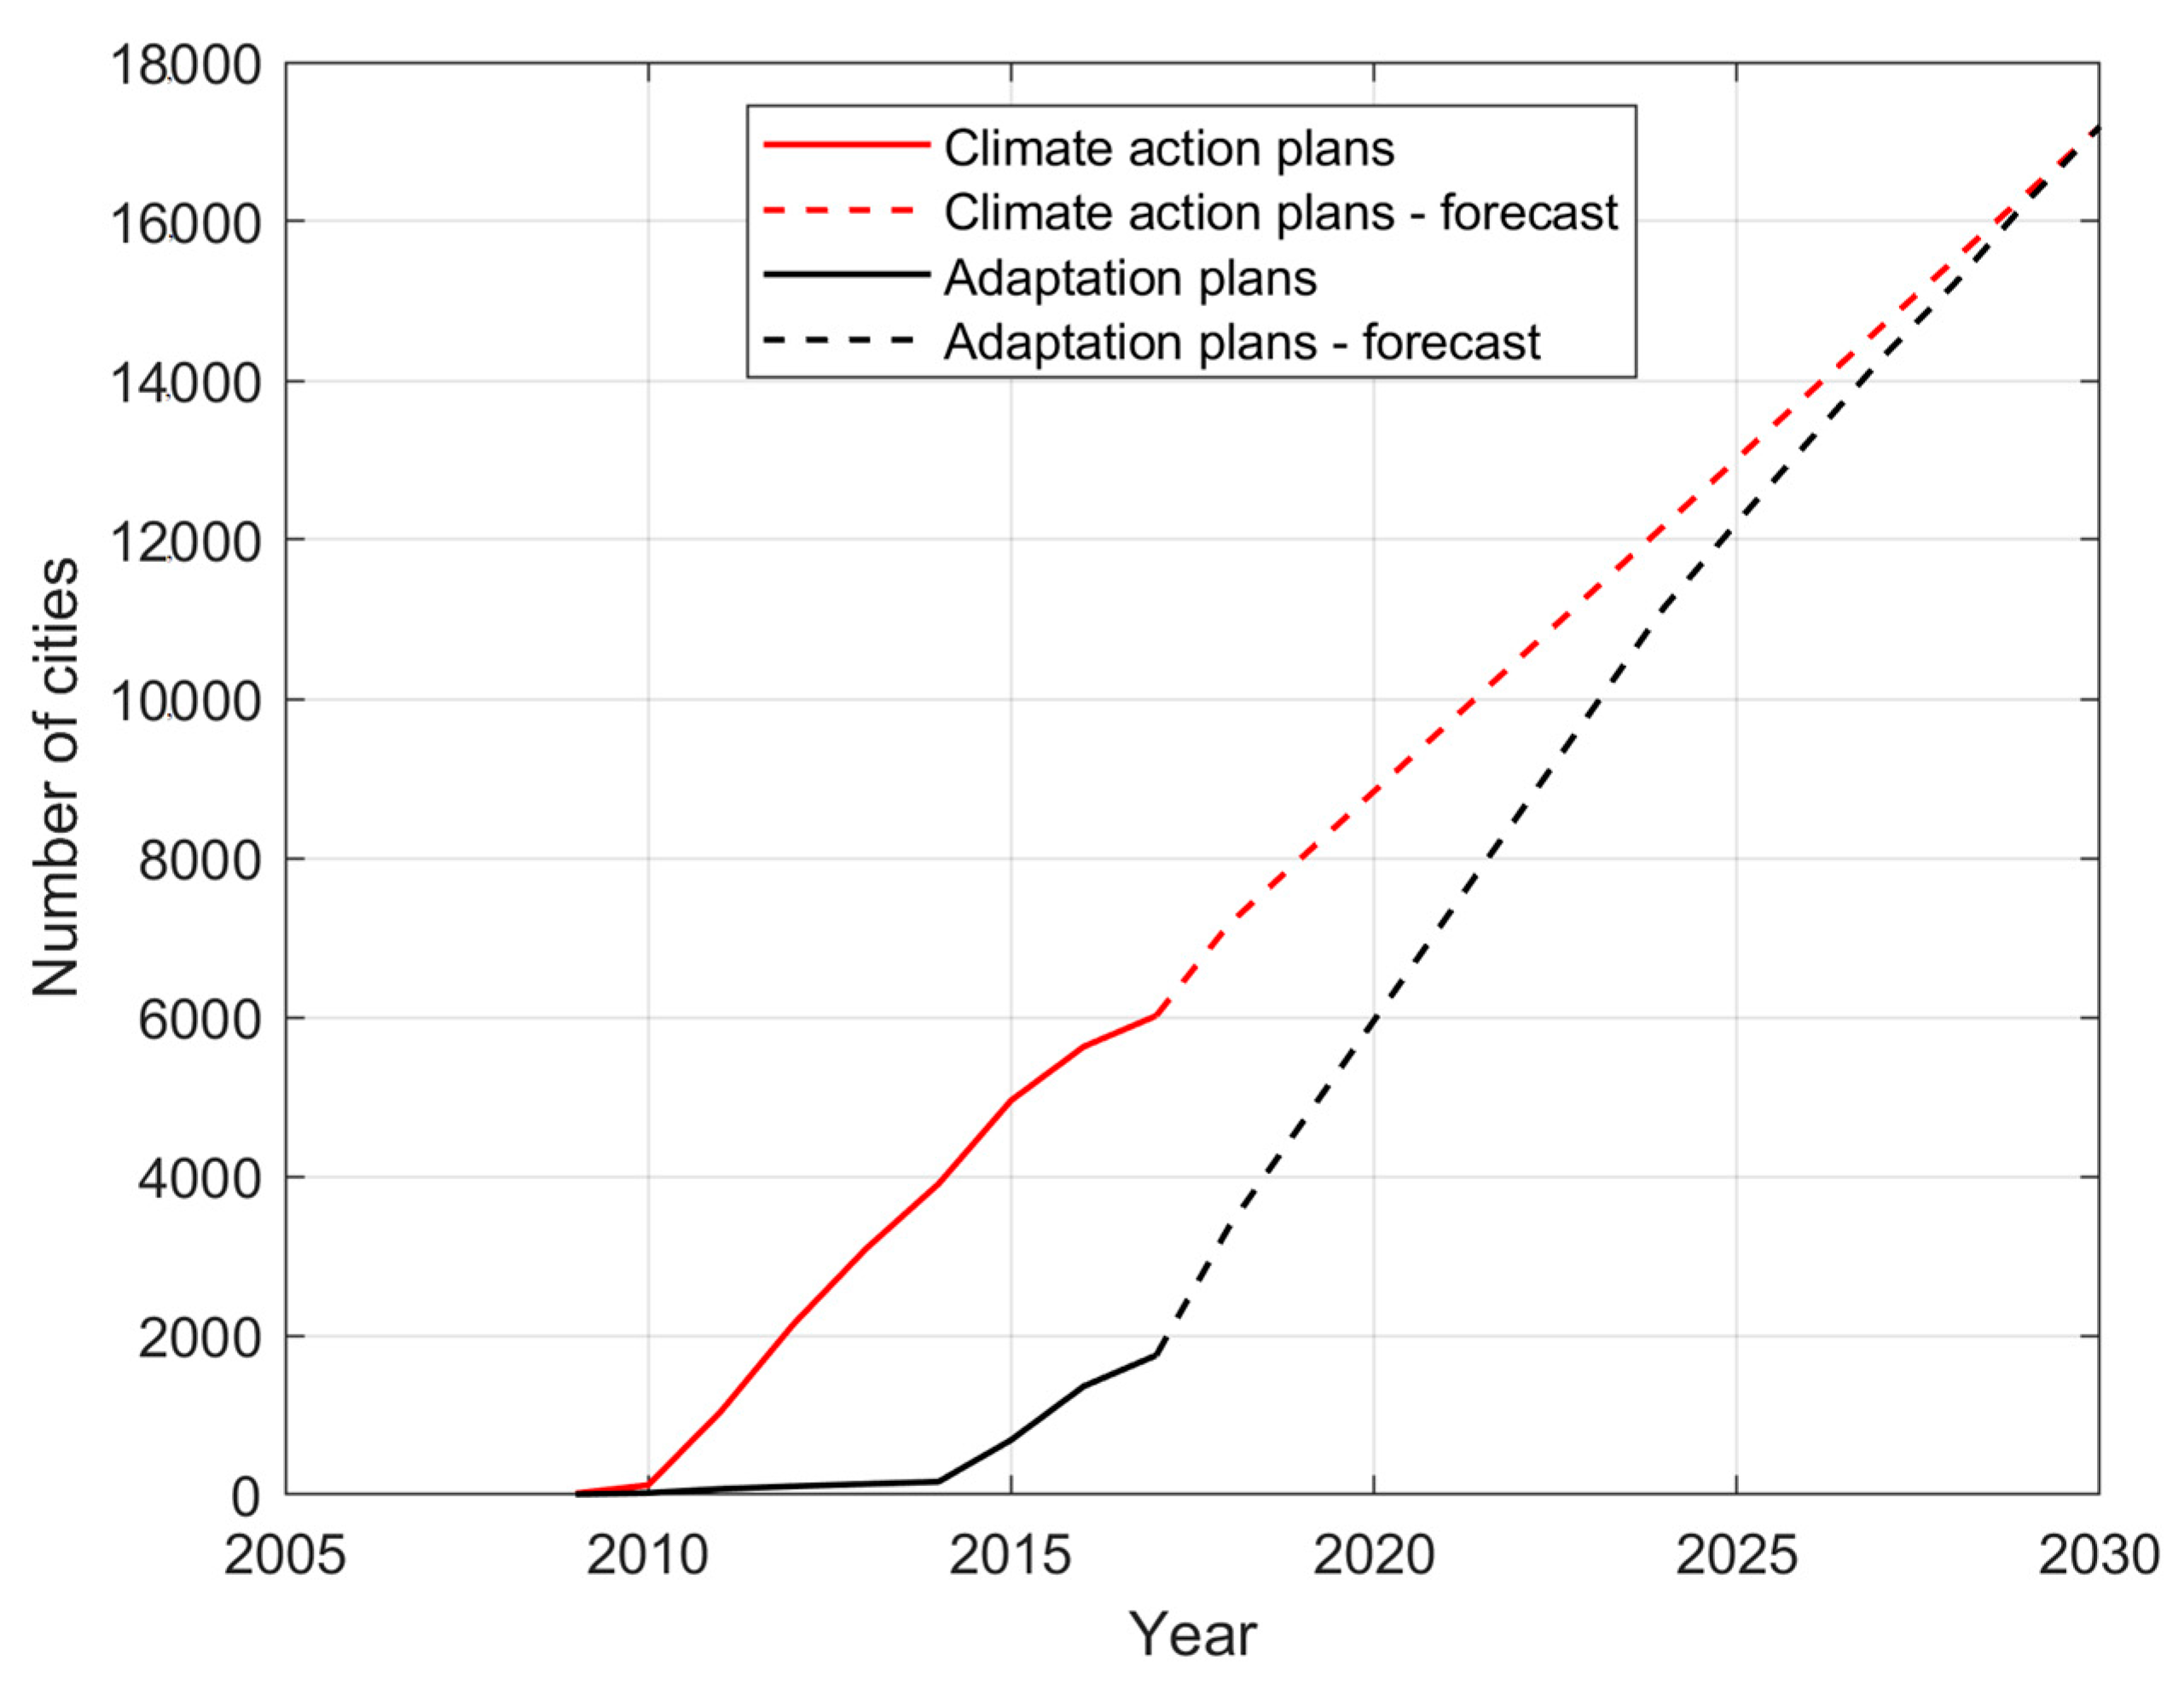
The projected growth in climate finance for the various scenarios is presented in Table 2. Growth will have to be very large if the mitigation gap estimated by UNEP [67] is going to be closed. According to UNEP, the requirement for climate finance would have to be about three times larger in 2030 compared to the baseline scenario.
The World Bank [53] includes an assessment of the geographical distribution of adaptation finance needs in developing countries under two different climate scenarios (a wet and a dry scenario). The approach is rather similar to what has been used in the UNEP Adaptation GAP report in that it assesses the total estimated adaptation costs for all sectors by region and climate scenario from 2010 to 2050. The wettest scenario has the highest total annual cost of about USD 106 bn in 2040–2049, with the largest costs being in East Asia and the Pacific. Conversely, in the driest scenario, the total annual cost is about USD 95 bn, the largest cost being in Sub-Saharan Africa.
The conclusions regarding the demand for CS from these forecasts of international climate and SDG finance are rather obvious. Based on the UNEP adaptation gap estimates, which use very similar methodologies and data as in the World Bank’s assessment [53], there is a very large projected need for CS to support adaptation as well as mitigation, as well as large regionally specific needs based on the climate scenarios. How big a share of the efforts and thus the associated CS needs will actually be realized depends strongly on policies and the availability of international finance, which, in terms of the MDBs’ projections, are a long way from the level of need estimated in the UNEP’s Adaptation Gap Report.

3.3. Cities

The results of the forecasting of Scenario 1 can be seen in Figure 1 in terms of the number of cities with adaptation and climate action plans.
The assumptions applied to our adaptation plan forecasted to 2030 result in an increase in the cities with adaptation plans by a factor of almost ten (Figure 1), indicating a large potential growth in CS for city development.
The forecast in scenario 2 assumes that the 148 signatories to the Covenant of Mayors reach the most advanced planning step 6 in their adaptation planning in 2050. This results in a tripling of cities at step 6 in 2030 and a fourfold increase by 2050, indicating a large potential need for CS.
In conclusion, large growth in adaptation plans and associated CS are expected for cities, both those that do not have adaptation plans at present and those that will move up to more advanced planning stages over the period, which will also require more advanced CS.

4. Discussion

There is a very large potential demand for CS within climate-sensitive sectoral activities addressed in the forecasts in relation to renewable electricity expansion, climate finance and city adaptation plans. However, it is important to recognize that, despite the currently large number of activities within these sectors, based on the limited literature available we will suggest the conclusions, that the CS deployment today is very limited and benefits in terms of risk mitigation could be missed. This conclusion relies on the assumption that CS as a specific service and product actually could be useful. Our sectoral forecasting approach critically relies on, that the underlying models, scenarios, and policy assumptions are valid, and that they represent the state-of-the-art knowledge within the sectors. A wider range of scenarios and models could have been used, which would have generated a wider range of CS forecasts. Based on the literature review, however, it can be concluded that the scenarios applied in our forecasts in terms of trend are in line with the expected trends by major studies. Furthermore, major sources for the scenarios are official plans, which in some cases are a part of mandatory frameworks.
A number of common conclusions, which are important for the generation of efficient CS development efforts, emerge across the sectors of renewable energy, finance and cities. Decarbonisation policies, including city and energy-sector plans, are important drivers of climate actions and associated CS, and policy scenarios reflecting this show a much larger potential CS growth than scenarios reflecting the continuation of recent trends. Renewable energy is expected to penetrate very rapidly in Europe and on a very large scale globally, as concluded above, and the efficient management of these technologies will require detailed and context-specific CS. However, the low deployment of CS in the sector today impose uncertainties about, to which degree CS actually will be used.
The limited deployment of CS today could be a consequence of the low awareness of decision-makers and the private sector about what CS could deliver and the potential benefits of using CS. Furthermore, the deployment of CS suffers from technical complexities in the development of appropriate context-specific CS [8], as has also been pointed out, for example, for the energy sector based on intensive stakeholder interviews in the EUPORIAS project [38]. A strong interaction between end-users and research has also been urged as a key criterion for proper CS development and advancement [8,68]. Other barriers for CS, include imprecision, lack of relevance, level of investment required to employ this CS and traditions/understanding of the potential added value [1,69].
Altogether, these limitations imply a very early stage towards the expected growth of CS requirements presented in the case studies on renewable energy, international climate finance and cities, let alone from the actual deployment of CS. Uncertainties in the full “value change” from the provision of technically based climate risk information to the adoption of CS are discussed below.

Uncertainties

The development of context-specific CS products and their penetration will face large uncertainties, including those associated with climate and socioeconomic information (appropriate, relevant and high-quality climate, impact and damage data), as well as the condition that a CS user community is in place with the capacity and governance to demand CS and to use it to implement adaptation options [70]. The combination of all these uncertainties amounts to a cascade of uncertainties.
The cascade of uncertainties that emerges when climate risk modelling and CS implementation are combined is illustrated by the example of climate risks in cities. Climate damages in cities from, for example, flooding from extreme precipitation, depends on projections of precipitation, with uncertainties in relation to alternative climate scenarios, as well as those within the climate models themselves. Projections of future assets and activities in cities are also uncertain and cities have been shown to diverge and have high levels of local and contextual CS needs [68,71]. Adding together flood modelling and damage cost assessments with their own uncertainties necessitates a wide range of alternative scenarios for the avoidance of damage. On top of these uncertainties, using CS in decision-making introduces further uncertainties in relation to policy-makers’ understanding of the risk information with the CS itself, the perceptions of climate risks and the appropriate management options, as well as being related to how well purveyors and users of CS can interact and exchange information. Other examples of urban climate hazards include heat waves, air pollution, sea-level rise, storms etc. [72,73]. CS deployment in relation to renewable energy also exhibits a cascade of uncertainties, when climate modelling and CS implementation are combined [74], but with different key uncertainty elements than in the case of cities. The penetration of renewable energy will critically depend on climate policy scenarios, and given stabilization scenario targets insights from international studies as e.g., those reported by the IPCC provides a range of deployment and differences in efficiencies between countries exist [75]. There are however large uncertainties related to the climate sensitivity and availability of renewable sources such as hydropower, wind, solar, and biomass. In this way, relevant and tailor-made CS products are very complex to develop.
It is to be expected that a wider range of uncertainties within the implementation of CS would imply a more difficult penetration of CS and thus difficulties in establishing a good basis for capturing the benefits of climate risk management.
Figure 2 shows how a cascade of uncertainties can emerge when combining technical information in the forecasting of climate change risks with uncertainties related to the application of CS in decision-making.
Returning to Figure 2, the interesting question is then how the cascade of uncertainties facing the penetration of CS can be reduced. First of all, the uncertainties are very context-specific in relation to climate risks and the time horizon under consideration, which can vary depending on the application and sector from immediate emergency preparedness to longer-term climate adaptation to ensure proper cost-benefit ratios in the long run [68]. One such effort in describing investment and reaction responses of a specific CS implementation to perceived climate risks and their inherent probabilities is seen in [76]. Climate models tend to be particularly uncertain for a short time horizon, while damage modelling based on economic assumptions tends to be increasingly uncertain with a long-time horizon. This means that we are facing trade-offs between different kinds of uncertainties in the climate risk-modelling domain at the top of the figure. However, climate risk management policy perspectives, such as those featured in the next level of Figure 2 can be used to reduce these uncertainties if policy-makers, for example, decide to go for a given climate scenario protection level for their action plans, thus limiting the relevant range of climate scenarios and impact estimates as in the case of renewable energy. The next level in Figure 2 addresses the CS market and the fit between supply and demand. Reducing the uncertainties associated with this component and the last CS penetration components could require assumptions to be made about how the market development could be supported by regulation, certification and other measures. In addition, the issue economics of scale comes to play where the CS demand for an increasing number of cities (e.g.,) is counterbalanced by pooling together demands in the context of local or national governments. These mechanisms are inherently challenging to predict due to complex market relationships, competition, consumer behaviour, legislation, the success of emerging technologies etc. [77], meaning that significant uncertainties remain within these areas.
In summary, the need for specific applications of CS is therefore associated with a wide range of uncertainties with regard to all three sectors examined here. This calls for further developing CS forecasting, which in context-specific detail include quantitative estimates of climate risks including probabilities of events and economic damage measures as a basis for helping stakeholders in climate risk exposed sectors to adapt efficiently and to see the economic benefits of using CS. However, despite more work needed to develop more accurate CS products, with a stronger appeal to users, we estimate, with a certain degree of confidence, a need for the rapid growth of CS for use by cities, due to the political frameworks for making climate plans that have already been established in this area. Renewable energy penetration is also expected to require a high demand for CS in the future if climate policies for stabilization at low temperatures are implemented on a wide international scale. The implementation of international finance for adaptation and the associated needs for CS also implies a large demand for CS. However, the actual use of CS will strongly depend on commitment in terms of climate policies, as well as of MDBs and other international investors prioritizing climate finance.

5. Conclusions

Further penetration of CS could be useful in supporting the implementation of adaptation options, but CS development is complex. Combining several technical disciplines and adding decision-making on the top implies the emergence of a wide range of uncertainties hindering the wider implementation of CS today.
CS forecasting for high climate-risk sectors has been used to identify specific focal areas having a potential demand for the development of CS, including the renewable energy sector, international climate finance and cities. The forecasting of CS and associated adaptation potentials for the three sectors addressed in this study has identified a large potential for the further development and penetration of context-specific services but the actual CS deployment faces major uncertainties on the technical components of CS, the values of using CS, and the climate policies constituting a strong framing condition.
The large growth in electricity production by renewable energy sources is expected, including technologies such as solar and wind energy, which require smart management of fluctuating energy production and context-specific information on resources, requiring tailor-made CS information. Similarly, investments in new power-generating technologies will include large renewable energy capacity, where efficient planning will depend critically on CS.
According to the IEA [66], emerging economies like India and China are expected to have a large growth in renewables, and a large growth in renewables will also be expected particularly in the EU and the US. This implies that CS, which addresses both fluctuating renewable energy production from new production capacity and the interactions with existing traditional fossil thermal energy, will be very relevant for future CS product developments in the energy sector.
International finance is expected to increase, and adaptation will play an increasing role here. Therefore, it will be critical to develop CS, which can help in assessing the benefits of climate adaptation, as well as the vulnerabilities of MDB investments. Policy scenarios like, for example, the UNEP Adaptation Gap Estimate [67] shows that, in order to address the vulnerabilities of developing countries, investments in climate impact assessments must increase by 200–300% by 2030. If realized, a large share of this finance would also include CS initiatives in order to plan cost-effective adaptation options.
Cities are developing very quickly both in Europe and globally, with high-value assets in the form of buildings, infrastructure, historical and cultural heritage, ecosystems and people. City adaptation plans are underway, but in Europe as well as globally the coverage is limited, and existing planning is still in its initial stages in most cities. However, initiatives such as the Covenant of Mayors, initiated by the EU, are major drivers of city adaptation planning [57]. Since the end of 2015, all new signatories to the Covenant have committed themselves to prepare risk and vulnerability assessments, which more than a thousand cities have now submitted. With more than seven thousand European cities (and even more globally) already engaging in mitigation planning, there is a large potential for CS growth as more cities plan for adaption to climate change.
The future penetration of CS is quite uncertain due to the inherent uncertainties in the underlying climate risk modelling, policy-making, CS demand and CS market performance. One way to reduce these uncertainties is to develop extremely focused CS market development in specific sectors including those addressed in the paper, thus generating more in-depth insights into how the complex CS market can be accelerated.

Author Contributions

Conceptualization, K.H., P.S.K. and M.A.D.L.; methodology, K.H., P.S.K., M.A.D.L., L.B. and M.L.D.; formal analysis, K.H., P.S.K., M.A.D.L., L.B. and M.L.D.; writing—original draft preparation, K.H., P.S.K., M.A.D.L., L.B. and M.L.D.; writing—review & editing, K.H., P.S.K. and M.A.D.L.; visualization, M.L.D.; project administration, K.H., P.S.K. and M.A.D.L.; funding acquisition, K.H., P.S.K. and M.A.D.L. All authors have read and agreed to the published version of the manuscript.

Funding

The research for this paper was supported by the MARCO project (grant agreement no. 730272) funded by the Horizon 2020 EU research programme.

Conflicts of Interest

The authors declare no conflict of interest.

References

  1. Lé, T.T.; Perrels, A.; Cortekar, J. European climate services markets—Conditions, challenges, prospects, and examples. Clim. Serv. 2020, 17, 100149. [Google Scholar] [CrossRef]
  2. Raaphorst, K.; Koers, G.; Ellen, G.J.; Oen, A.; Kalsnes, B.; van Well, L.; Koerth, J.; van der Brugge, R. Mind the Gap: Towards a Typology of Climate Service Usability Gaps. Sustainability 2020, 12, 1512. [Google Scholar] [CrossRef] [Green Version]
  3. European Union Roadmap for Climate Services. A European Research and Innovation. 2015. Available online: https://ec.europa.eu/programmes/horizon2020/en/news/european-research-and-innovation-roadmap-climate-services (accessed on 10 September 2020).
  4. Lamich, K.; Cortekar, J.; Groth, M. Case Study 6 Report: Critical Energy Infrastructures; MArket Research for a Climate Services Observatory: Berlin, Germany, 2018. [Google Scholar]
  5. Perrels, A. Quantifying the uptake of climate services at micro and macro level. Clim. Serv. 2020, 17, 100152. [Google Scholar] [CrossRef]
  6. Buontempo, C.; Hanlon, H.M.; Bruno Soares, M.; Christel, I.; Soubeyroux, J.M.; Viel, C.; Calmanti, S.; Bosi, L.; Falloon, P.; Palin, E.J.; et al. What have we learnt from EUPORIAS climate service prototypes? Clim. Serv. 2018, 9, 21–32. [Google Scholar] [CrossRef]
  7. Bruno Soares, M.; Buontempo, C. Challenges to the sustainability of climate services in Europe. Wiley Interdiscip. Rev. Clim. Chang. 2019, e587. [Google Scholar] [CrossRef] [Green Version]
  8. Street, R.B. Towards a leading role on climate services in Europe: A research and innovation roadmap. Clim. Serv. 2016, 1, 2–5. [Google Scholar] [CrossRef] [Green Version]
  9. Vaughan, C.; Dessai, S. Climate services for society: Origins, institutional arrangements, and design elements for an evaluation framework. Wiley Interdiscip. Rev. Clim. Chang. 2014, 5, 587–603. [Google Scholar] [CrossRef]
  10. Brasseur, G.P.; Gallardo, L. Climate services: Lessons learned and future prospects. Earth Future 2016, 4, 79–89. [Google Scholar] [CrossRef] [Green Version]
  11. Hewitt, C.; Mason, S.; Walland, D. The global framework for climate services. Nat. Clim. Chang. 2012, 2, 831–832. [Google Scholar] [CrossRef] [Green Version]
  12. Asrar, G.R.; Ryabinin, V.; Detemmerman, V. Climate science and services: Providing climate information for adaptation, sustainable development and risk management. Curr. Opin. Environ. Sustain. 2012, 4, 88–100. [Google Scholar] [CrossRef]
  13. Lourenço, T.C.; Swart, R.; Goosen, H.; Street, R. The rise of demand-driven climate services. Nat. Clim. Chang. 2016, 6, 13–14. [Google Scholar] [CrossRef]
  14. Cortekar, J.; Themessl, M.; Lamich, K. Systematic analysis of EU-based climate service providers. Clim. Serv. 2020, 17, 100125. [Google Scholar] [CrossRef]
  15. Bay, L.; Halsnæs, K. Report on Forecast Approaches, Robustness and Uncertainties Associated with Short and Long Term Forecast; H2020 MARCO Project: Berlin, Germany, 2018. [Google Scholar]
  16. USAID. The Value of Climate Services Across Economic and Public Sectors: A Review of Relevant Literature|Global Climate Change; USAID: Washington, DC, USA, 2013.
  17. International, E.B. Ebi Research Methodology; Environmental Business International: San Diego, CA, USA, 2020. [Google Scholar]
  18. Howard, S.; Howard, S.; Howard, S. Quantitative market analysis of the European Climate Services sector—The application of the kMatrix big data market analytical tool to provide robust market intelligence. Clim. Serv. 2020, 17, 100108. [Google Scholar] [CrossRef]
  19. Georgeson, L.; Maslin, M.; Poessinouw, M. Global disparity in the supply of commercial weather and climate information services. Sci. Adv. 2017, 3, e1602632. [Google Scholar] [CrossRef] [Green Version]
  20. Kreft, S.; Eckstein, D.; Melchior, I. Global Climate Risk Index 2017. Who Suffers Most from Extreme Weather Events? Weather-Relatred Loss Events in 2015 and 1996 to 2015; Germanwatch Nord-Süd Initiative eV: Berlin, Germany, 2017. [Google Scholar]
  21. Karnitis, G.; Karnitis, E. Sustainable growth of EU economies and Baltic context: Characteristics and modelling. J. Int. Stud. 2017, 10, 209–224. [Google Scholar] [CrossRef]
  22. Bruno Soares, M.; Daly, M.; Dessai, S. Assessing the value of seasonal climate forecasts for decision-making. Wiley Interdiscip. Rev. Clim. Chang. 2018, 9, e523. [Google Scholar] [CrossRef] [Green Version]
  23. Giordano, R.; Pilli-Sihvola, K.; Pluchinotta, I.; Matarrese, R.; Perrels, A. Urban adaptation to climate change: Climate services for supporting collaborative planning. Clim. Serv. 2020, 17, 100100. [Google Scholar] [CrossRef]
  24. Gidhagen, L.; Olsson, J.; Amorim, J.H.; Asker, C.; Belusic, D.; Carvalho, A.C.; Engardt, M.; Hundecha, Y.; Körnich, H.; Lind, P.; et al. Towards climate services for European cities: Lessons learnt from the Copernicus project Urban SIS. Urban Clim. 2020, 31, 100549. [Google Scholar] [CrossRef]
  25. Baklanov, A.; Grimmond, C.S.B.; Carlson, D.; Terblanche, D.; Tang, X.; Bouchet, V.; Lee, B.; Langendijk, G.; Kolli, R.K.; Hovsepyan, A. From urban meteorology, climate and environment research to integrated city services. Urban Clim. 2018, 23, 330–341. [Google Scholar] [CrossRef]
  26. Lindberg, F.; Grimmond, C.S.B.; Gabey, A.; Huang, B.; Kent, C.W.; Sun, T.; Theeuwes, N.E.; Järvi, L.; Ward, H.C.; Capel-Timms, I.; et al. Urban Multi-scale Environmental Predictor (UMEP): An integrated tool for city-based climate services. Environ. Model. Softw. 2018, 99, 70–87. [Google Scholar] [CrossRef]
  27. UN Emissions Gap Report 2019|UNEP—UN Environment Programme. Available online: https://www.unenvironment.org/resources/emissions-gap-report-2019 (accessed on 14 May 2020).
  28. Simionescu, M.; Bilan, Y.; Krajňáková, E.; Streimikiene, D.; Gȩdek, S. Renewable energy in the electricity sector and GDP per capita in the European Union. Energies 2019, 12, 2520. [Google Scholar] [CrossRef] [Green Version]
  29. Perrels, A.; Le, T.T.; Cortekar, J.; Hoa, E.; Stegmaier, P. How much unnoticed merit is there in climate services? Clim. Serv. 2020, 17, 100153. [Google Scholar] [CrossRef]
  30. Perrels, A.; Frei, T.; Espejo, F.; Jamin, L.; Thomalla, A. Socio-economic benefits of weather and climate services in Europe. Adv. Sci. Res. 2013, 10, 65–70. [Google Scholar] [CrossRef] [Green Version]
  31. IPCC Summary for Policymakers. Climate Change 2014: Mitigation of Climate Change. Contribution of Working Group III to the Fifth Assessment Report of the Intergovernmental Panel on Climate Change; Edenhofer, O.R., Pichs-Madruga, Y., Sokona, E., Farahani, S., Eds.; Cambridge University Press: Cambridge, UK; New York, NY, USA, 2014. [Google Scholar]
  32. International Energy Agency. Energy Technology Perspectives 2017; International Energy Agency: Paris, France, 2017. [Google Scholar]
  33. Multilateral Development Banks. 2018 Joint Report on Multilateral Development Banks’ Climate Finance; IADB: New York, NY, USA, 2019. [Google Scholar]
  34. Rogelj, J.; Meinshausen, M.; Knutti, R. Global warming under old and new scenarios using IPCC climate sensitivity range estimates. Nat. Clim. Chang. 2012, 2, 248–253. [Google Scholar] [CrossRef]
  35. Larsen, M.A.D.; Drews, M. Water use in electricity generation for water-energy nexus analyses: The European case. Sci. Total Environ. 2019, 651, 2044–2058. [Google Scholar] [CrossRef]
  36. Larsen, M.A.D.; Petrovic, S.; Radoszynski, A.M.; McKenna, R.; Balyk, O. Climate change impacts on trends and extremes in future heating and cooling demands over Europe. Energy Build. 2020. [Google Scholar] [CrossRef]
  37. Halsnæs, K.; Drews, M.; Clausen, N.-E. Socio-economic Impacts—Offshore Activities/Energy. In North Sea Region Climate Change Assessment; Springer: Cham, Switzerland, 2016; pp. 409–415. [Google Scholar]
  38. Bruno Soares, M.; Dessai, S. Barriers and enablers to the use of seasonal climate forecasts amongst organisations in Europe. Clim. Chang. 2016, 137, 89–103. [Google Scholar] [CrossRef] [Green Version]
  39. Karnauskas, K.B.; Lundquist, J.K.; Zhang, L. Southward shift of the global wind energy resource under high carbon dioxide emissions. Nat. Geosci. 2018, 11, 38–43. [Google Scholar] [CrossRef]
  40. Peters, I.M.; Buonassisi, T. The Impact of Global Warming on Silicon PV Energy Yield in 2100. In Proceedings of the 2019 IEEE 46th Photovoltaic Specialists Conference, Chicago, IL, USA, 16–21 June 2019. [Google Scholar]
  41. Schaeffer, R.; Szklo, A.S.; de Lucena, A.F.P.; Borba, B.S.M.C.; Nogueira, L.P.P.; Fleming, F.P.; Troccoli, A.; Harrison, M.; Boulahya, M.S. Energy sector vulnerability to climate change: A review. Energy 2012, 38, 1–12. [Google Scholar] [CrossRef]
  42. van Vliet, M.T.H.; Wiberg, D.; Leduc, S.; Riahi, K. Power-generation system vulnerability and adaptation to changes in climate and water resources. Nat. Clim. Chang. 2016. [Google Scholar] [CrossRef]
  43. Heide, D.; von Bremen, L.; Greiner, M.; Hoffmann, C.; Speckmann, M.; Bofinger, S. Seasonal optimal mix of wind and solar power in a future, highly renewable Europe. Renew. Energy 2010, 35, 2483–2489. [Google Scholar] [CrossRef]
  44. Engeland, K.; Borga, M.; Creutin, J.D.; François, B.; Ramos, M.H.; Vidal, J.P. Space-time variability of climate variables and intermittent renewable electricity production—A review. Renew. Sustain. Energy Rev. 2017, 79, 600–617. [Google Scholar] [CrossRef]
  45. François, B.; Borga, M.; Anquetin, S.; Creutin, J.D.; Engeland, K.; Favre, A.C.; Hingray, B.; Ramos, M.H.; Raynaud, D.; Renard, B.; et al. Integrating hydropower and intermittent climate-related renewable energies: A call for hydrology. Hydrol. Process. 2014, 28, 5465–5468. [Google Scholar] [CrossRef]
  46. Drews, M.; Larsen, M.A.D.; Peña Balderrama, J.G. Projected water usage and land-use-change emissions from biomass production (2015–2050). Energy Strategy Rev. 2020, 29, 100487. [Google Scholar] [CrossRef]
  47. Bie, Z.; Lin, Y.; Li, G.; Li, F. Battling the Extreme: A Study on the Power System Resilience. Proc. IEEE 2017, 105, 1253–1266. [Google Scholar] [CrossRef]
  48. Espinoza, S.; Panteli, M.; Mancarella, P.; Rudnick, H. Multi-phase assessment and adaptation of power systems resilience to natural hazards. Electr. Power Syst. Res. 2016, 136, 352–361. [Google Scholar] [CrossRef]
  49. Larsen, M.A.D.; Petrovic, S.; Engström, R.E.; Drews, M.; Liersch, S.; Karlsson, K.B.; Howells, M. Challenges of data availability: Analysing the water-energy nexus in electricity generation. Energy Strategy Rev. 2019, 26, 100426. [Google Scholar] [CrossRef]
  50. Bartos, M.; Chester, M.; Johnson, N.; Gorman, B.; Eisenberg, D.; Linkov, I.; Bates, M. Impacts of rising air temperatures on electric transmission ampacity and peak electricity load in the United States. Environ. Res. Lett. 2016, 11. [Google Scholar] [CrossRef]
  51. UNEP Adaptation Gap Report; UNEP—UN Environment Programme: Nairobi, Kenya, 2018.
  52. Multilateral Development Banks. 2017 Joint Report on Multilateral Development Banks’ Climate Finance; IADB: New York, NY, USA, 2018. [Google Scholar]
  53. World Bank. The Costs to Developing Countries of Adapting to Climate Change: New Methods and Estimates; World Bank: Washington, DC, USA, 2010. [Google Scholar]
  54. Multilateral Development Banks. 2015 Joint Report on Multilateral Development Banks; IADB: New York, NY, USA, 2016. [Google Scholar]
  55. OECD Global Outlook on Financing for Sustainable Development 2019: Time to Face the Challenge; OECD Publishing: Paris, France, 2018. [CrossRef]
  56. United Nations World Urbanization Prospects: The 2018 Revision; United Nations: New York, NY, USA, 2018.
  57. Covenant of Mayors Covenant of Mayors for Climate & Energy. Available online: https://www.covenantofmayors.eu/en/ (accessed on 10 September 2020).
  58. World Mayors Council on Climate Change World Mayors Council on Climate Change. Available online: http://www.worldmayorscouncil.org/ (accessed on 18 June 2019).
  59. ICLEI. ICLEI - Local Governments for Sustainability. Available online: https://www.iclei.org/ (accessed on 18 June 2019).
  60. C40: C40 Cities. Available online: https://www.c40.org/ (accessed on 18 June 2019).
  61. UNDRR: UNDRR—UN Office for Disaster Risk Reduction. Available online: https://www.unisdr.org/ (accessed on 18 June 2019).
  62. Iwami, A.; Matsui, T.; Kimura, M.; Baba, K.; Tanaka, M. Organizing the Challenges Faced by Municipalities while Formulating Climate Change Adaptation Plans. Sustainability 2020, 12, 1203. [Google Scholar] [CrossRef] [Green Version]
  63. Reckien, D.; Salvia, M.; Heidrich, O.; Church, J.M.; Pietrapertosa, F.; De Gregorio-Hurtado, S.; D’Alonzo, V.; Foley, A.; Simoes, S.G.; Krkoška Lorencová, E.; et al. How are cities planning to respond to climate change? Assessment of local climate plans from 885 cities in the EU-28. J. Clean. Prod. 2018, 191, 207–219. [Google Scholar] [CrossRef]
  64. Reckien, D.; Flacke, J.; Dawson, R.J.; Heidrich, O.; Olazabal, M.; Foley, A.; Hamann, J.J.-P.; Orru, H.; Salvia, M.; De Gregorio Hurtado, S.; et al. Climate change response in Europe: What’s the reality? Analysis of adaptation and mitigation plans from 200 urban areas in 11 countries. Clim. Chang. 2014, 122, 331–340. [Google Scholar] [CrossRef]
  65. Climate-Adapt Climate-Adapt—City Profiles. Available online: https://climate-adapt.eea.europa.eu/ (accessed on 10 September 2020).
  66. IEA World Energy Outlook 2018. Available online: https://www.iea.org/weo2018/ (accessed on 18 June 2019).
  67. UNEP. The Adaptation Finance Gap Report 2016; UNEP: Nairobi, Kenya, 2016. [Google Scholar]
  68. McNie, E.C. Delivering climate services: Organizational strategies and approaches for producing useful climate-science information. Weather Clim. Soc. 2013, 5, 14–26. [Google Scholar] [CrossRef]
  69. Tart, S.; Groth, M.; Seipold, P. Market demand for climate services: An assessment of users’ needs. Clim. Serv. 2020, 17, 100109. [Google Scholar] [CrossRef]
  70. World Meteorological Organization. WMO Statement on the State of the Global Climate in 2016; World Meteorological Organization: Geneva, Switzerland, 2016; ISBN 978-92-63-11189-0. [Google Scholar]
  71. Cortekar, J.; Bender, S.; Brune, M.; Groth, M. Why climate change adaptation in cities needs customised and flexible climate services. Clim. Serv. 2016, 4, 42–51. [Google Scholar] [CrossRef] [Green Version]
  72. Andersson-Sköld, Y.; Thorsson, S.; Rayner, D.; Lindberg, F.; Janhäll, S.; Jonsson, A.; Moback, U.; Bergman, R.; Granberg, M. An integrated method for assessing climate-related risks and adaptation alternatives in urban areas. Clim. Risk Manag. 2015, 7, 31–50. [Google Scholar] [CrossRef] [Green Version]
  73. Halsnæs, K.; Larsen, M.A.D.; Kaspersen, P.S. Climate change risks for severe storms in developing countries in the context of poverty and inequality in Cambodia. Nat. Hazards 2018, 94, 261–278. [Google Scholar] [CrossRef] [Green Version]
  74. Al Irsyad, M.I.; Halog, A.; Nepal, R. Renewable energy projections for climate change mitigation: An analysis of uncertainty and errors. Renew. Energy 2019, 130, 536–546. [Google Scholar] [CrossRef] [Green Version]
  75. Tvaronavičienė, M.; Prakapienė, D.; Garškaitė-Milvydienė, K.; Prakapas, R.; Nawrot, Ł. Energy efficiency in the long run in the selected European countries. Econ. Sociol. 2018, 11, 245–254. [Google Scholar] [CrossRef] [Green Version]
  76. Coughlan de Perez, E.; van den Hurk, B.; van Aalst, M.K.; Jongman, B.; Klose, T.; Suarez, P. Forecast-based financing: An approach for catalyzing humanitarian action based on extreme weather and climate forecasts. Nat. Hazards Earth Syst. Sci. 2015, 15, 895–904. [Google Scholar] [CrossRef] [Green Version]
  77. Gilchrist, S.; Sim, J.; Zakrajšek, E. Uncertainty, Financial Frictions, and Investment Dynamics; National Bureau of Economic Research: Cambridge, MA, USA, 2014. [Google Scholar]
Figure 1. Forecast of the number of signatories to the Covenant of Mayors [57] of Energy and Climate, 2018–2030. The figure shows the number of Sustainable Energy and Climate Action Plans (red line) and Adaptation Plans (black line).
Sustainability 12 07540 g001
Figure 2. The cascade of uncertainties facing climate services (CS) penetration.
Sustainability 12 07540 g002
Table 1. Growth in gross electricity generation and capacity in the Reference Technology Scenario (RTS) and the 2 Degree Scenario (2DS) in 2030 compared to 2014 in index numbers. Index calculations are based on IEA figures [32].
Table Cont.Gross Electricity GenerationGross Electricity Capacity
Reference Technology Scenario (yr. 2014 = 100)2 °C Scenario (yr. 2014 = 100)Reference Technology Scenario (yr. 2014 = 100)2 °C Scenario (yr. 2014 = 100)
Oil24144646
Coal31165350
Natural gas129819688
Nuclear84968596
Biomass and waste165176138141
Hydro (excl. pumped storage)107107106106
Geothermal229229217217
Wind onshore270316244283
Wind offshore253628236528
Solar PV175175158157
Solar CSP278278216216
Ocean146220509251294
Total101102113120
Table 2. Growth of climate adaptation finance for various scenarios compared to 2011 in index numbers.
Year 2011 = 100Baseline ScenarioWorld Bank Driest ScenarioWorld Bank Wettest ScenarioPolicy Scenario 1 EUPolicy Scenario 2 UNEP-LowPolicy Scenario 2 UNEP-HighPolicy Scenario 3 SDG
Index growth in 2030123126122155250411179

