Article

A Sustainability Assessment of the Greenseeker N Management Tool: A Lysimetric Experiment on Barley

Department of Agriculture, Food, Environment and Forestry (DAGRI)—University of Florence, Piazzale delle Cascine, 18-50144 Florence, Italy
*
Author to whom correspondence should be addressed.
Sustainability 2020, 12(18), 7303; https://doi.org/10.3390/su12187303
Submission received: 21 July 2020 / Revised: 27 August 2020 / Accepted: 2 September 2020 / Published: 6 September 2020

Abstract

:
A preliminary study was conducted to analyze the sustainability of barley production through: (i) investigating sensor-based nitrogen (N) application on barley performance, compared with conventional N management (CT); (ii) assessing the potential of the Normalized Difference Vegetation Index (NDVI) at different growth stages for within-season predictions of crop parameters; and (iii) evaluating sensor-based fertilization benefits in the form of greenhouse gasses mitigation. Barley was grown under CT, sensor-based management (RF) and with no N fertilization (Control). NDVI measurements and RF fertilization were performed using a GreenSeeker™ 505 hand-held optical sensor. Gas emissions were measured using a static chamber method with a portable gas analyzer. Results showed that barley yield was not statistically different under RF and CF, while they both differed significantly from Control. Highly significant positive correlations were observed between NDVI and production parameters at harvesting from the middle of stem elongation to the medium milk stage across treatments. Our findings suggest that RF is able to decrease CO2 emission in comparison with CF. The relationship between N fertilization and CH4 emission showed high variability. These preliminary results provide an indication of the benefits achieved using a simple proximal sensing methodology to support N fertilization.

1. Introduction

In recent years, one of the most investigated solutions for improving fertilization efficiency involves taking into account the spatial and temporal crop and soil variability within a field, in an approach called “precision farming management” [1]. This approach is the result of the development and implementation of various technologies, such as the Global Positioning System (GPS), Geographic Information System (GIS), automatic control, variable rate technologies, proximal and remote sensing, computer-driven control devices and telecommunications [2]. Variable rate technologies are applicable to any input factor or crop but have been more frequently adopted for grain crops and fertilization operations [3]. The variable techniques are based on two methods of managing field variability, namely prescription maps based on historical field information and real-time sensing. The first approach is more popular among farmers, although the real-time method is currently receiving attention due to recent developments in proximal sensing technologies. In the past 20 years, several studies have been carried out on the use of precision farming technologies to evaluate crops’ agronomic traits, as well as stress detection and quantification. Naser et al. [4] used proximal sensor derived Normalized Difference Vegetation Index (NDVI) to discriminate productivity between different wheat genotypes. Ranđelović et al. [5] used a machine learning model and vegetation indices extracted by a Unmanned Aerial Vehicles (UAV) device to predict soybean plant density. Guo et al. [6] used hyperspectral images to detect wheat Yellow Rust infection, while Sandino et al. [7] used remote sensing to detect deterioration by fungal pathogens in forests. In addition, a lot of research has been focused on the use of precision devices to predict crop parameters (biomass, plant nutrient content, yield) [8,9,10,11,12] and nitrogen (N) management [13,14,15,16,17]. The proximal sensors are classified into active and passive devices, respectively. The former measure target reflected energy emitted from the sun, whereas the latter emit their own source of energy independently of the sun [18]. These instruments measure the reflectance of specific light spectra, typically in both the visible (VIS) and the near-infrared (NIR) spectrum, from the plant canopy, providing a wide range of vegetation indices [19,20]. The aim of precision farming techniques, such as the use of proximal sensing, is to increase profitability, optimize yield and quality, and reduce costs and environmental impact [21].
In the literature, research on the use of these technologies is reported, especially relating to crop N fertilization. In fact, sensor readings are firstly adopted to estimate crop yields and N content based on previous calibrations [22] and then used in the field to optimize N fertilization management [23]. Advantages and disadvantages of the adoption of variable rate technologies have been reported compared with uniform N management, focusing on particular aspects. Some studies evaluated the economic aspect, revealing savings in same cases [23,24] and poor economic performances in others due to reduced N rates that often affect yield [25]. Some studies focused on evaluating the productivity aspect, finding yield increase [26], no effect [27], or variable results [28]. Finally, other studies focused on evaluating the environmental aspects of adopting variable rate technologies, revealing an impact reduction in some cases [29,30,31,32] and no effect in others [33].
The latter aspect involves several dynamics and pollutants, such as N leaching and the greenhouse gas (GHG) emissions problem. Significant reduction in the amount of N applied to the field driven by precision fertilization techniques might be responsible for GHG mitigation, as reported by Li et al. [34] and Lenerts et al. [35]. This assumption has been taken as a basis for regulating international politics and sustainable proceedings worldwide [36,37]. Most of the studies point to reduced emission using precision N fertilization, indirectly through model or general estimation (IPCC Guidelines). The assumption of the mitigation effect is essentially linked to input reduction, but emissions dynamics related to N fertilization are regulated by such a complex connection between soil, climate and management conditions [38,39]. General studies dealing with the effect of N fertilization on GHG emissions have been reported contrasting results related to the gas analyzed and the soil conditions [40,41,42,43,44]. As the literature reports contrasting information about GHG dynamics, actual measurements related to different N application are required [45].
Italy is one of the main countries producing barley, covering 32.834 hectares [46]. For that reason, the sustainability of new technologies for barley should be tested across productivity, environmental and economic aspects. In this study, the goal was to quantify some of the benefits assigned to proximal sensing management practices, using a GreenSeeker Handheld instrument to carry out specific N fertilization on barley. More specifically, the aim was threefold. Firstly, to investigate whether the sensor-based N rate could lead to grain yield/economic savings compared with traditional practice. Secondly, to what extent NDVI, measured at different growth stages of barley grown in Mediterranean pedo-climatic conditions, could provide predictions of biomass, grain yield and N uptake; and thirdly whether GreenSeeker-based N rate fertilization could provide environmental benefit in terms of greenhouse gasses reduction. The paper could be used to convince farmers to use new precision farming techniques, avoiding inefficient traditional ones.

2. Materials and Methods

2.1. Experimental Design

The study was carried out in 2018 at the research farm (WGS84, 43°47′ N; 11°13′ E, 50 m a.s.l.) of the Istituto Tecnico Agrario Statale (ITAGR), Firenze, Italy. Daily meteorological data (average, minimum, and maximum temperatures and rainfall) were collected by the Regional Hydrological Service weather station, close to the experimental field [47]. Barley (Hordeum vulgare L.) was sown on 13 November 2017 using seeding density of 400 seeds m−2 and row spacing of 0.1 m in cylindrical tanks of 1 m3 (height: 0.77 m; area: 1.33 m2). The dimensions of tanks were considered suitable for barley growth based on Poorter et al. [48] and Fan et al. [49]. In fact, Fan et al. [49] reported that, on average, 50% of the total root amount in barley was accumulated within the upper 0.12 m soil profile, 67–76% of roots can be found within the upper 0.3 m, and 95% of total root amount was accumulated within 0.99 m. Further, Poorter et al. [48] suggested that pots with a plant biomass to soil volume ratio of less than 1 g L–1, such as in our case, had a plant biomass to soil volume ratio of the same order of magnitude as those of plants growing in the field. The tanks were filled in 2015 with a silty clay soil collected from the 0–0.9 m layer of a conventionally cultivated corn field. The soil was placed in the tanks maintaining the original profile’s order of layers and taking care to induce only temporary changes in soil structure [50]. Tanks were seeded with barley (Hordeum vulgare L.) on 13 November 2017 using seeding density of 400 seeds m−2 and row spacing of 0.1 m. Three N treatments were carried out in triplicate: a control treatment (Control: 0 kg N ha−1), a conventional rate (CF: 150 kg N ha−1) and a sensor-based N fertilization rate (RF) based on optical sensor measurements. The method to determine N fertilization rate by proximal sensing was the same as reported by Foster et al. [51], using the specific “Fertilizer Estimation Chart” adapted for Italian barley cultivation. A N-rich strip (150 kg N ha−1) was used as no limiting N, to calculate the variable N rate during the second top dress fertilization. Measures were performed on the final phase of stem elongation (BBCH, 39) to establish the N variable dose. The average target yield under the no limiting condition for Italian barley production was set to 7 t ha−1, whereby the amount of N supplied in the top dressing on RF, considered optimum to reach maximum yield, was 37.5 kg ha−1. No N was applied at sowing, whilst N was applied as ammonium nitrate (N: 27%) in two spring top dress fertilizations on 26 March and 24 April 2018, respectively. In the first top dressing, N fertilization 75 kg ha−1 (as the fixed rate) and 37.5 kg ha−1 were broadcasted in CF and RF, respectively. The remaining N was scheduled in the second top dress fertilization as a fixed rate for CF, 75 kg ha−1, and variable rate for RF, 37.5 kg ha−1. Barley was manually harvested at maturity (15 July 2018).

2.2. GHGs Emission Measurements and Flux Estimation

Fluxes of GHGs (CO2, CH4, N2O, NH3) were monitored using a static chamber method as reported in Verdi et al. [52]. Nine static chambers, one per tank, were built according to Parkin and Venterea [53]. Static chambers were comprised of a cylindric anchor (PVC, height of 15 cm and diameter of 20 cm) and a lid (PVC, height of 25 cm and diameter of 20 cm). The static chambers were covered by a reflective Mylar tape to cover solar reflectance. Anchors were inserted into the soil for approximately 5 cm immediately after sowing and remained in that position for the entire growing season to reduce root system disturbance. For each sampling date, the lid was placed on the anchors only during the measurement period (1 h). Measurements were performed by means of a portable gas analyzer Madur MaMoS (Madur, Zgierz, Poland) [52]. The gas analyzer used Nondispersive Infrared technology (NDIR) sensors for the detection of CO2, CH4 and NH3 (±1 mg kg−1) concentrations in the air sample and electrochemical technology for N2O (±1 mg kg−1). The time response of all sensor was approximately 30 s. Measurements were carried out for a total of 18 days, once daily during the first 6 days after fertilization and then every two days for the remaining time period. Interpolation methodology was adopted to obtain missing data from the days where measurements were not performed. Each measurement was composed of two subsequent samplings per chamber during which the sensor was held within the chamber for 1 min. The first sampling was performed just after chamber closing (T0) and then repeated after a 1 h interval of gas accumulation in the closed chamber (T1). The difference in gas concentration between T1 and T0 was taken as the emission data, which was used for gas flux calculations. Measurements were performed mid-morning, which was representative of a time frame more closely corresponding to average daily temperature [53]. Emission fluxes were calculated using gas concentration (mg kg−1), chamber dimensions (volume and area), molar weight of each gas and closing time. Results of this calculation provided the rate of CO2 and CH4 emissions in terms of carbon per unit area (kg C ha−1) and the rate of N2O and NH3 emissions in terms of nitrogen per unit area (kg N ha−1). Due to the reflective coverage, temperature increases inside the chambers were avoided. Nonetheless, temperature was monitored with two thermocouples. Knowing temperature and atmospheric pressure, air volume contained in each chamber was reduced to standard conditions (22.4 L at 15 °C and 1 bar).

2.3. Soil and Crop Analysis

Soil sampling was performed in triplicate for each tank in the 0–40 cm layer. Soil samples were air-dried and then analyzed for the determination of bulk density [54], pH, soil texture [55], total calcium carbonate [56], organic matter content (OM) [57] and total nitrogen (Nsoil) [58] (Table 1).
At harvest, whole-plant material was collected from each tank. In the laboratory, the straw and grain were separated, after which fresh biomass and mass of dry matter, dry matter content, and crop N uptake were determined. The mass of dry matter of the straw and grain was measured after oven-drying for 48 h at 80 °C [59]. Thereafter, the dried samples were weighed to determine the accurate by-plot biomass and grain yield. From each by-plot sample, sub-samples were taken and analyzed to detect N content in the straw and grains (Flash EA 1112-ThermoFisher, Waltham, MA, USA). The 3 replicate tanks for each treatment were analyzed separately, and then the average between replicates was determined.

2.4. Economic Evaluation Method

For economic evaluation of the different systems, Partial Budgeting was chosen as the method. This is commonly used for precision farming techniques evaluation, and it calculates changes in profit due to changes in inputs. The Partial Budgeting of CF and RF treatments was compared, subdividing economic and environmental partial costs. The net return from different systems, defined as total gains minus variable costs, was used to measure profitability. In this study, the total gains were the grain sale profits per farmer (Sp), considered in relation to 0.18 € kg−1 [60]. On the other hand, the variable costs include only fertilization (Fc), considering a fertilizer cost of 0.28 € kg−1 [61].
Economic partial cost = (Yield × Sp) − (Nrate × Fc)
The economic partial cost was calculated at a field scale as the difference between the product price and fertilizer cost as reported in Equation (1). However, the environmental partial cost (3) evaluation was also performed, adding to the cost due to CO2 emission equivalents. The environmental partial cost was subdivided in “Fertilizer production cost” (CO2Fpc) and “Fertilization cost” (CO2Fc). Regarding the “Fertilization cost” for each treatment, the total net Global Warming Potential (GWP; kg CO2-eq ha−1) was calculated, as reported in Equation (2). The net GWP was used to estimate the kg CO2 emissions equivalent for each GHG [62]. The GHG emissions data used were cumulated and measured after fertilization. The price per kg CO2 emissions equivalent (0.23 € kg−1 of CO2) was obtained from the European Emission Allowances (EUA) website. Thereafter, the “Fertilizer production cost” was calculated from the database “mineral fertilizer carbon footprint reference values: 2011” [63] as the amount of CO2 emissions produced from using ammonium nitrate fertilizer (3.06 kg CO2 per kg of ammonium nitrate).
GWP = 25 × CH4 + 298 × N2O + CO2
Environmental partial cost = Economic partial cost − (CO2Fpc + CO2Fc)

2.5. Statistical Analysis

Statistical analysis was performed by using R studio software (version 1.0.143) (RStudio PBC, Waltham, MA, USA). All data were investigated for normality using the Shapiro-Wilk’s test. Differences between treatments in grain yield and biomass values resulted in being normally distributed, thus they were statistically evaluated by means of analysis of variance (ANOVA), followed by Tukey’s honest significant difference test (Tukey HSD) at significance level p < 0.05. The Coefficient of Determination (R2) was used to analyze the relationship between NDVI, calculated at different growth stages of barley, with the values of the mass of dry matter of the whole biomass, the mass of dry matter of grain, and the nitrogen content in the whole biomass at harvesting. As flux data did not show normal distribution, differences between treatments at each sampling event and in the cumulative emissions were analyzed by means of the Kruskal–Wallis (K-W) test (p < 0.05). Then, Dunn’s post-hoc tests, with Bonferroni’s p value adjustment method, were used for pairwise multiple comparisons. All experiments were carried out with three replicates as previously indicated in the description of the experiments.

3. Results and Discussion

3.1. Meteorological Conditions during the Study Period

The dynamics of daily air temperature and rainfall are shown in Figure 1.
The cumulated rainfall during the growing period was 770 mm. Rainfall was mainly concentrated from November to April (the highest monthly cumulative precipitation was in March, corresponding to the initiation of the tillering stage in barley). Each sampling period corresponded to differing rainfall conditions, namely, 43 mm during the first (tillering stage) and 59.2 during the second (stem elongation stage) measurement, respectively. An average temperature value of 14.3 °C was measured during emissions sampling after the 1st fertilization (constant), while it reached 20 °C after the 2nd fertilization (temperature to decrease at the end of the sampling date).

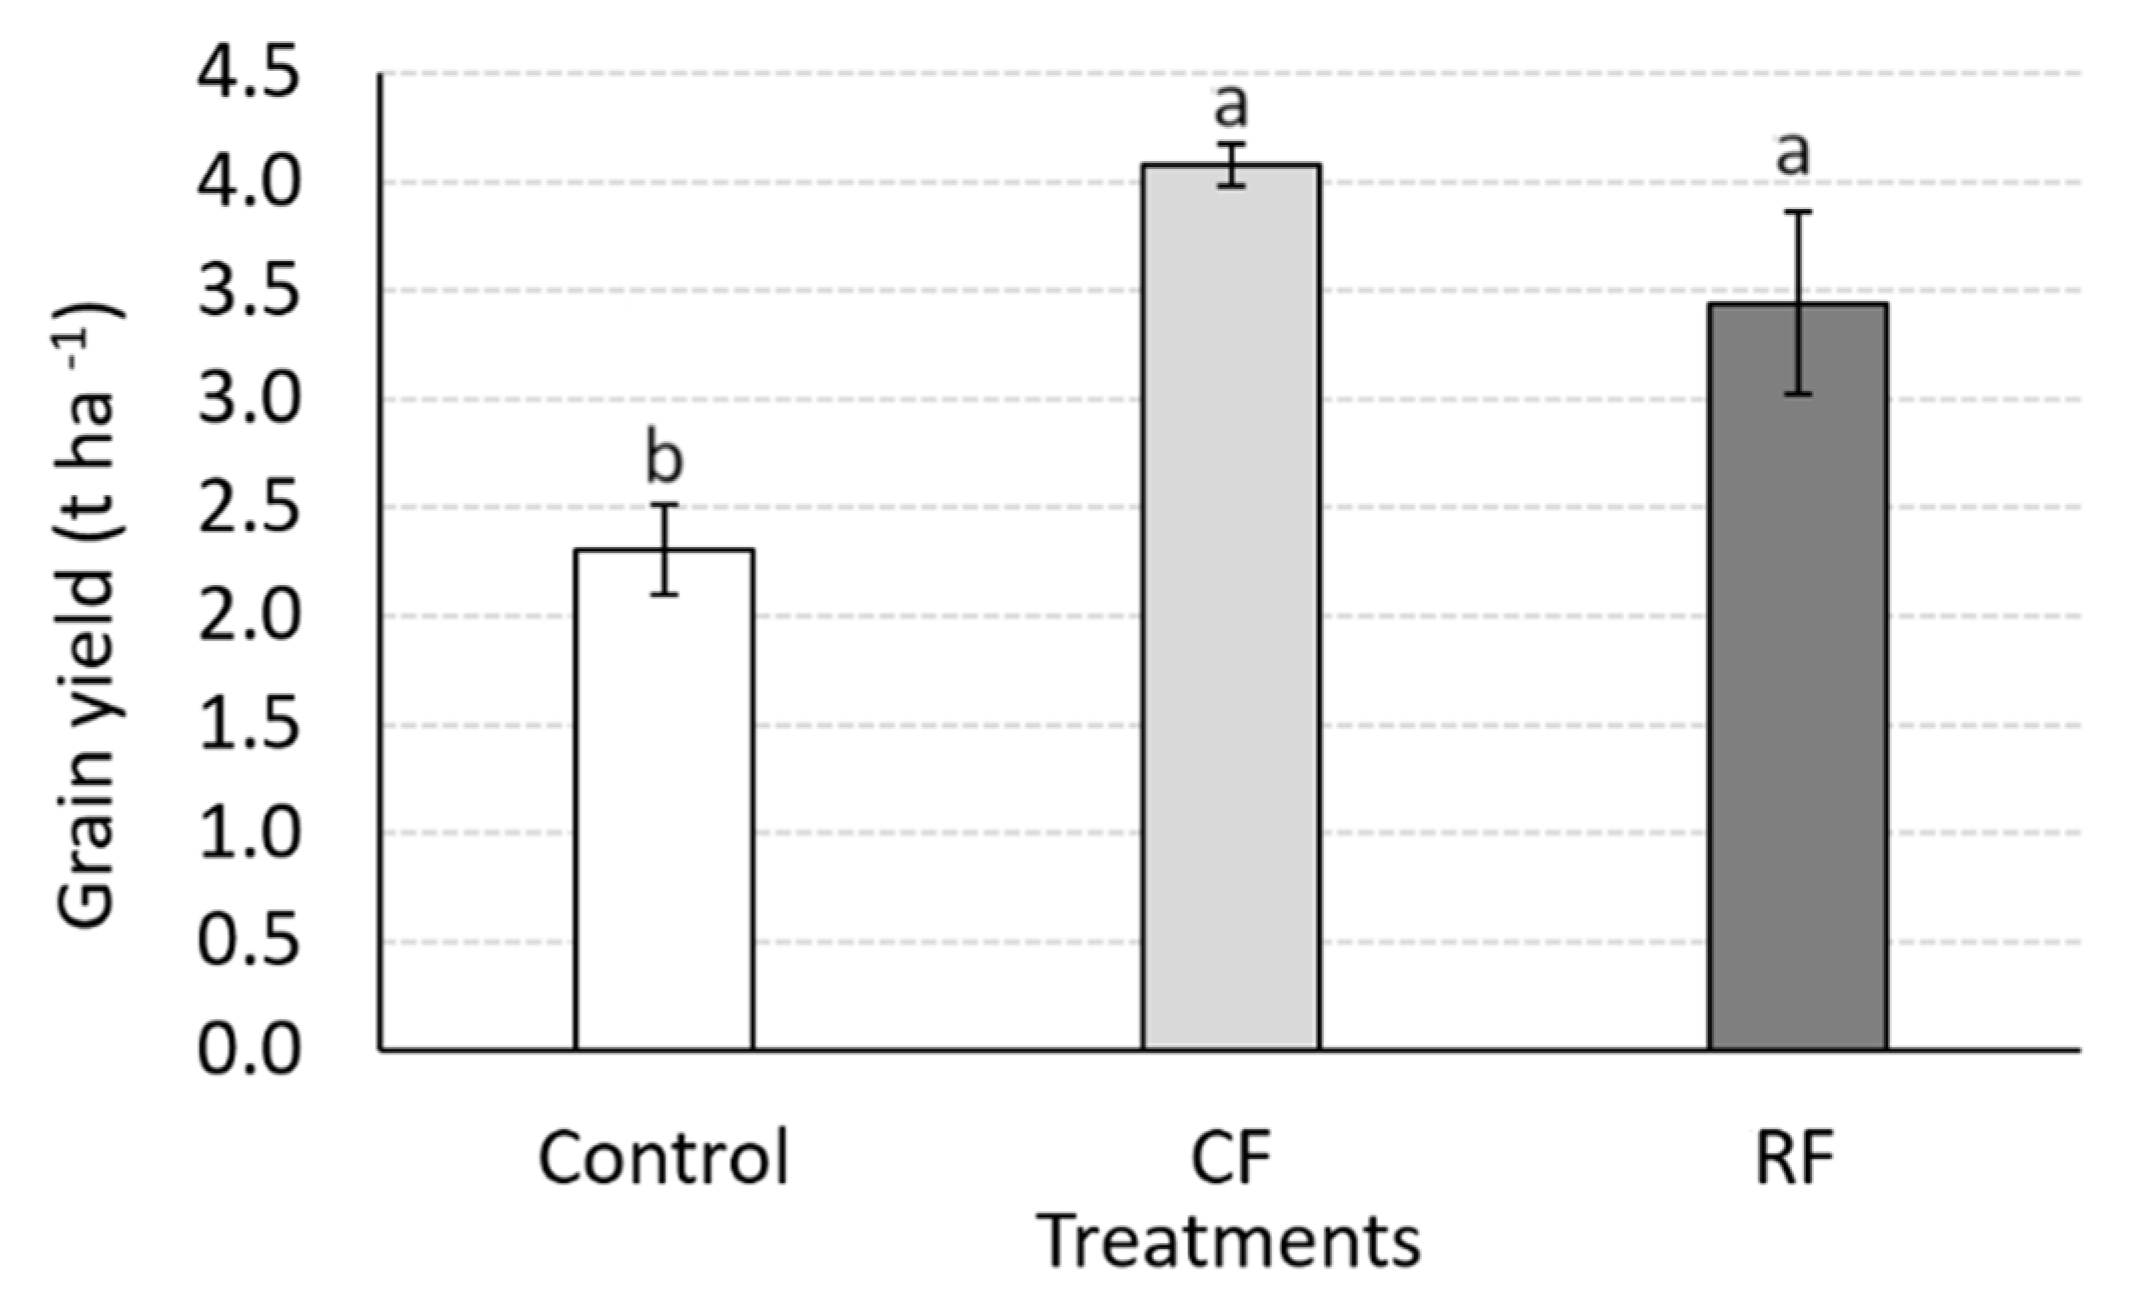
3.2. Yield Responses to N Rates and Economic Benefits

Barley yields at different N application rates are shown in Figure 2. Grain yield was significantly (p < 0.05) improved by N fertilization application with respect to Control. The results showed that the average CF (4.3 ± 0.2 t ha−1) and the RF grain yields (3.5 ± 0.5 t ha−1) were significantly higher than the Control by 82.6% and 49.3%, respectively. No significant differences (p > 0.05) between the grain yield of CF and RF were observed. Various studies have been performed comparing uniform N fertilization with variable rate fertilization techniques. Bragagnolo et al. [64] reported no significant differences in corn grain yield when applying either a traditional N fertilization application (150 kg ha−1) or a variable rate fertilization based on a crop optical sensor. Mayfield and Trengove [65] similarly made a comparison between variable rate fertilization and a uniform application fixed rate, showing non-significant differences. Therefore, results indicated that by applying less N fertilizer based on a sensor-based technique, it was possible to obtain the same production as traditional practice, leading to fertilizer saving.
Partial Budgeting of the different fertilization approaches (Table 2) resulted in higher fertilizer cost, amounting to 81 € ha−1 for CF compared with RF.
The environmental costs, in terms of CO2 production, significantly (p < 0.05) increased from Control to RF and then CF. The economic profit of Control was significantly (p < 0.05) lower than RF and CF by about 206.76 € ha−1 and 329.51 € ha−1, respectively. On the other hand, the profit difference between RF and CF (122.75 € ha−1) was not statistically significant (p > 0.05). There was no significant difference (p > 0.05) between Control and RF in term of environmental profit, while the environmental profit for CF was significantly (p < 0.05) lower than RF and Control by about 266.89 € ha−1 and 306.05 € ha−1, respectively. Therefore, CF and RF showed to have the same cost benefits, attributable to the increase in yield in comparison to the costs spent. Considering the environmental cost that might be paid by farmers for the use of N, the evaluation is in favor of variable rate fertilization due to the high application rate of the conventional practice. It is important to analyze this assumption because new environmental policies are being built up to protect ecosystems and climate, applying variable costs to different losses of N [66,67].

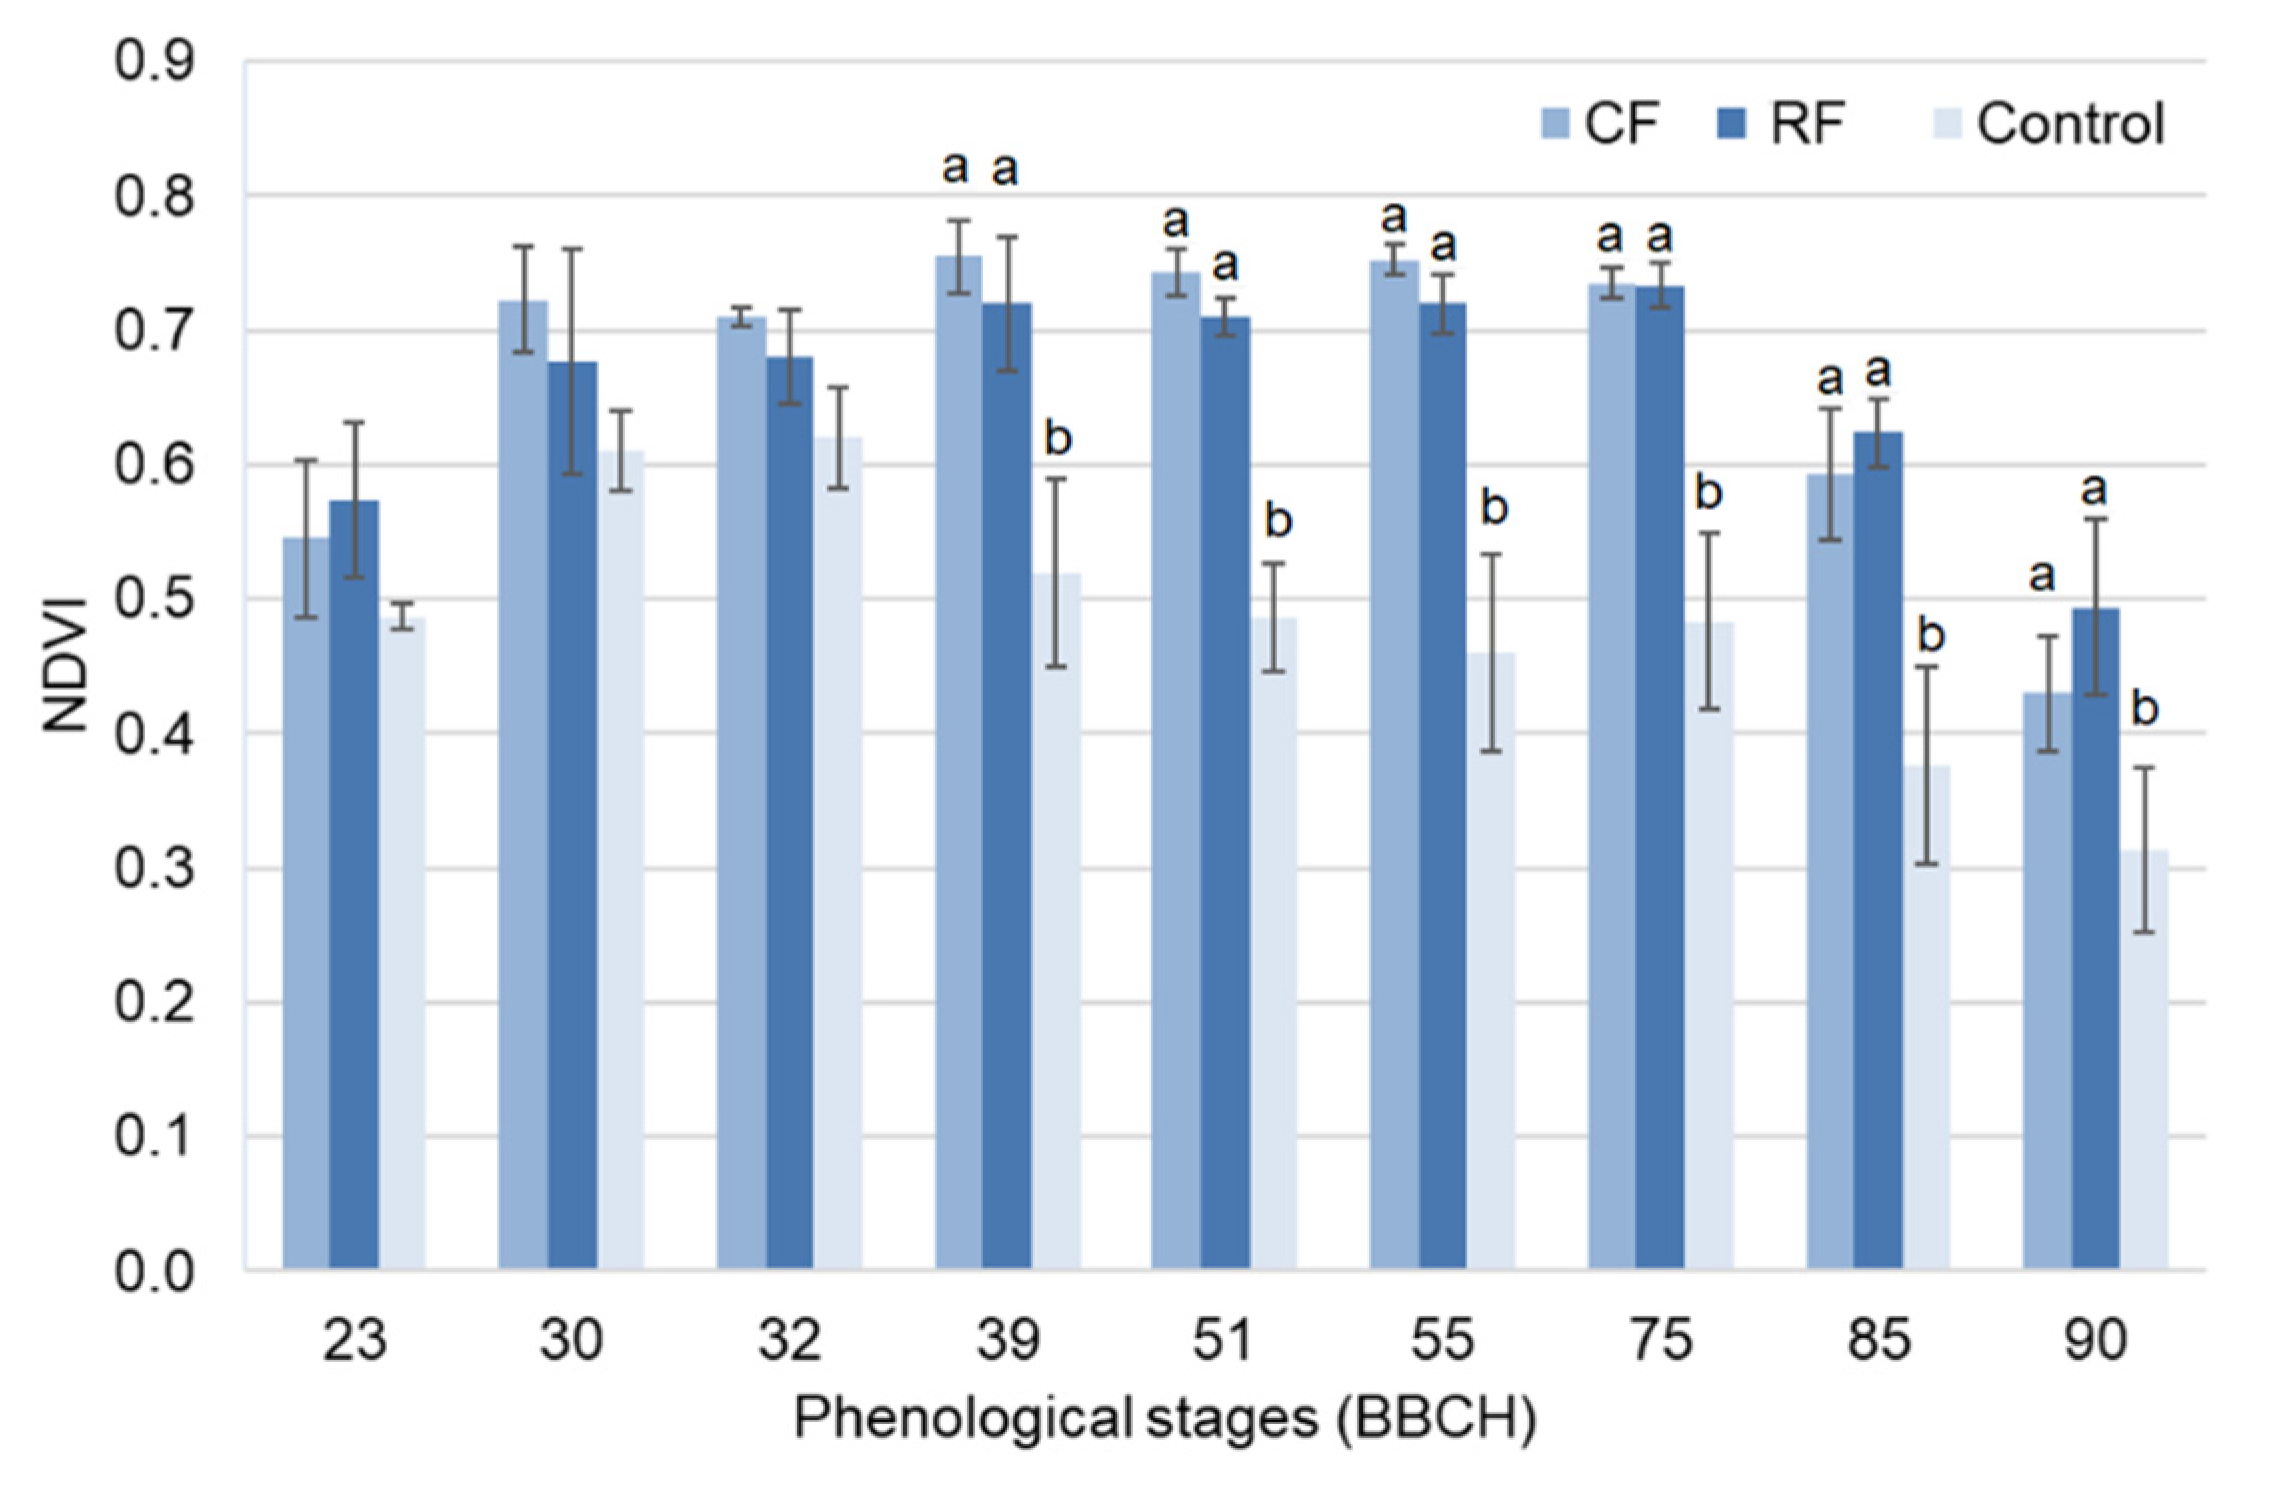
3.3. NDVI Trend during Crop Development

No significant differences (p > 0.05) were observed between CF and RF treatments during the monitoring period, even though the fertilization rates were different (Figure 3).
Even during the senescence stage, RF tanks showed higher NDVI than CF. Since NDVI is a way to measure plant health, in this experiment crops responded well to RF management: it thus appears that crops did not require additional N. On the contrary, significant differences were observed between the Control and the two fertilizer treatments starting from the flag leaf stage (BBCH 39). It was shown previously that NDVI is directly dependent on N fertilization [68]. The lower the N level supplied to crops, the lower the chlorophyll content and the lower the absorption of radiation in the visible region, which in turn results in a reduction of NDVI. Therefore, the lack of N in control tanks led to premature yellowing of crops and a stunted vegetative state.

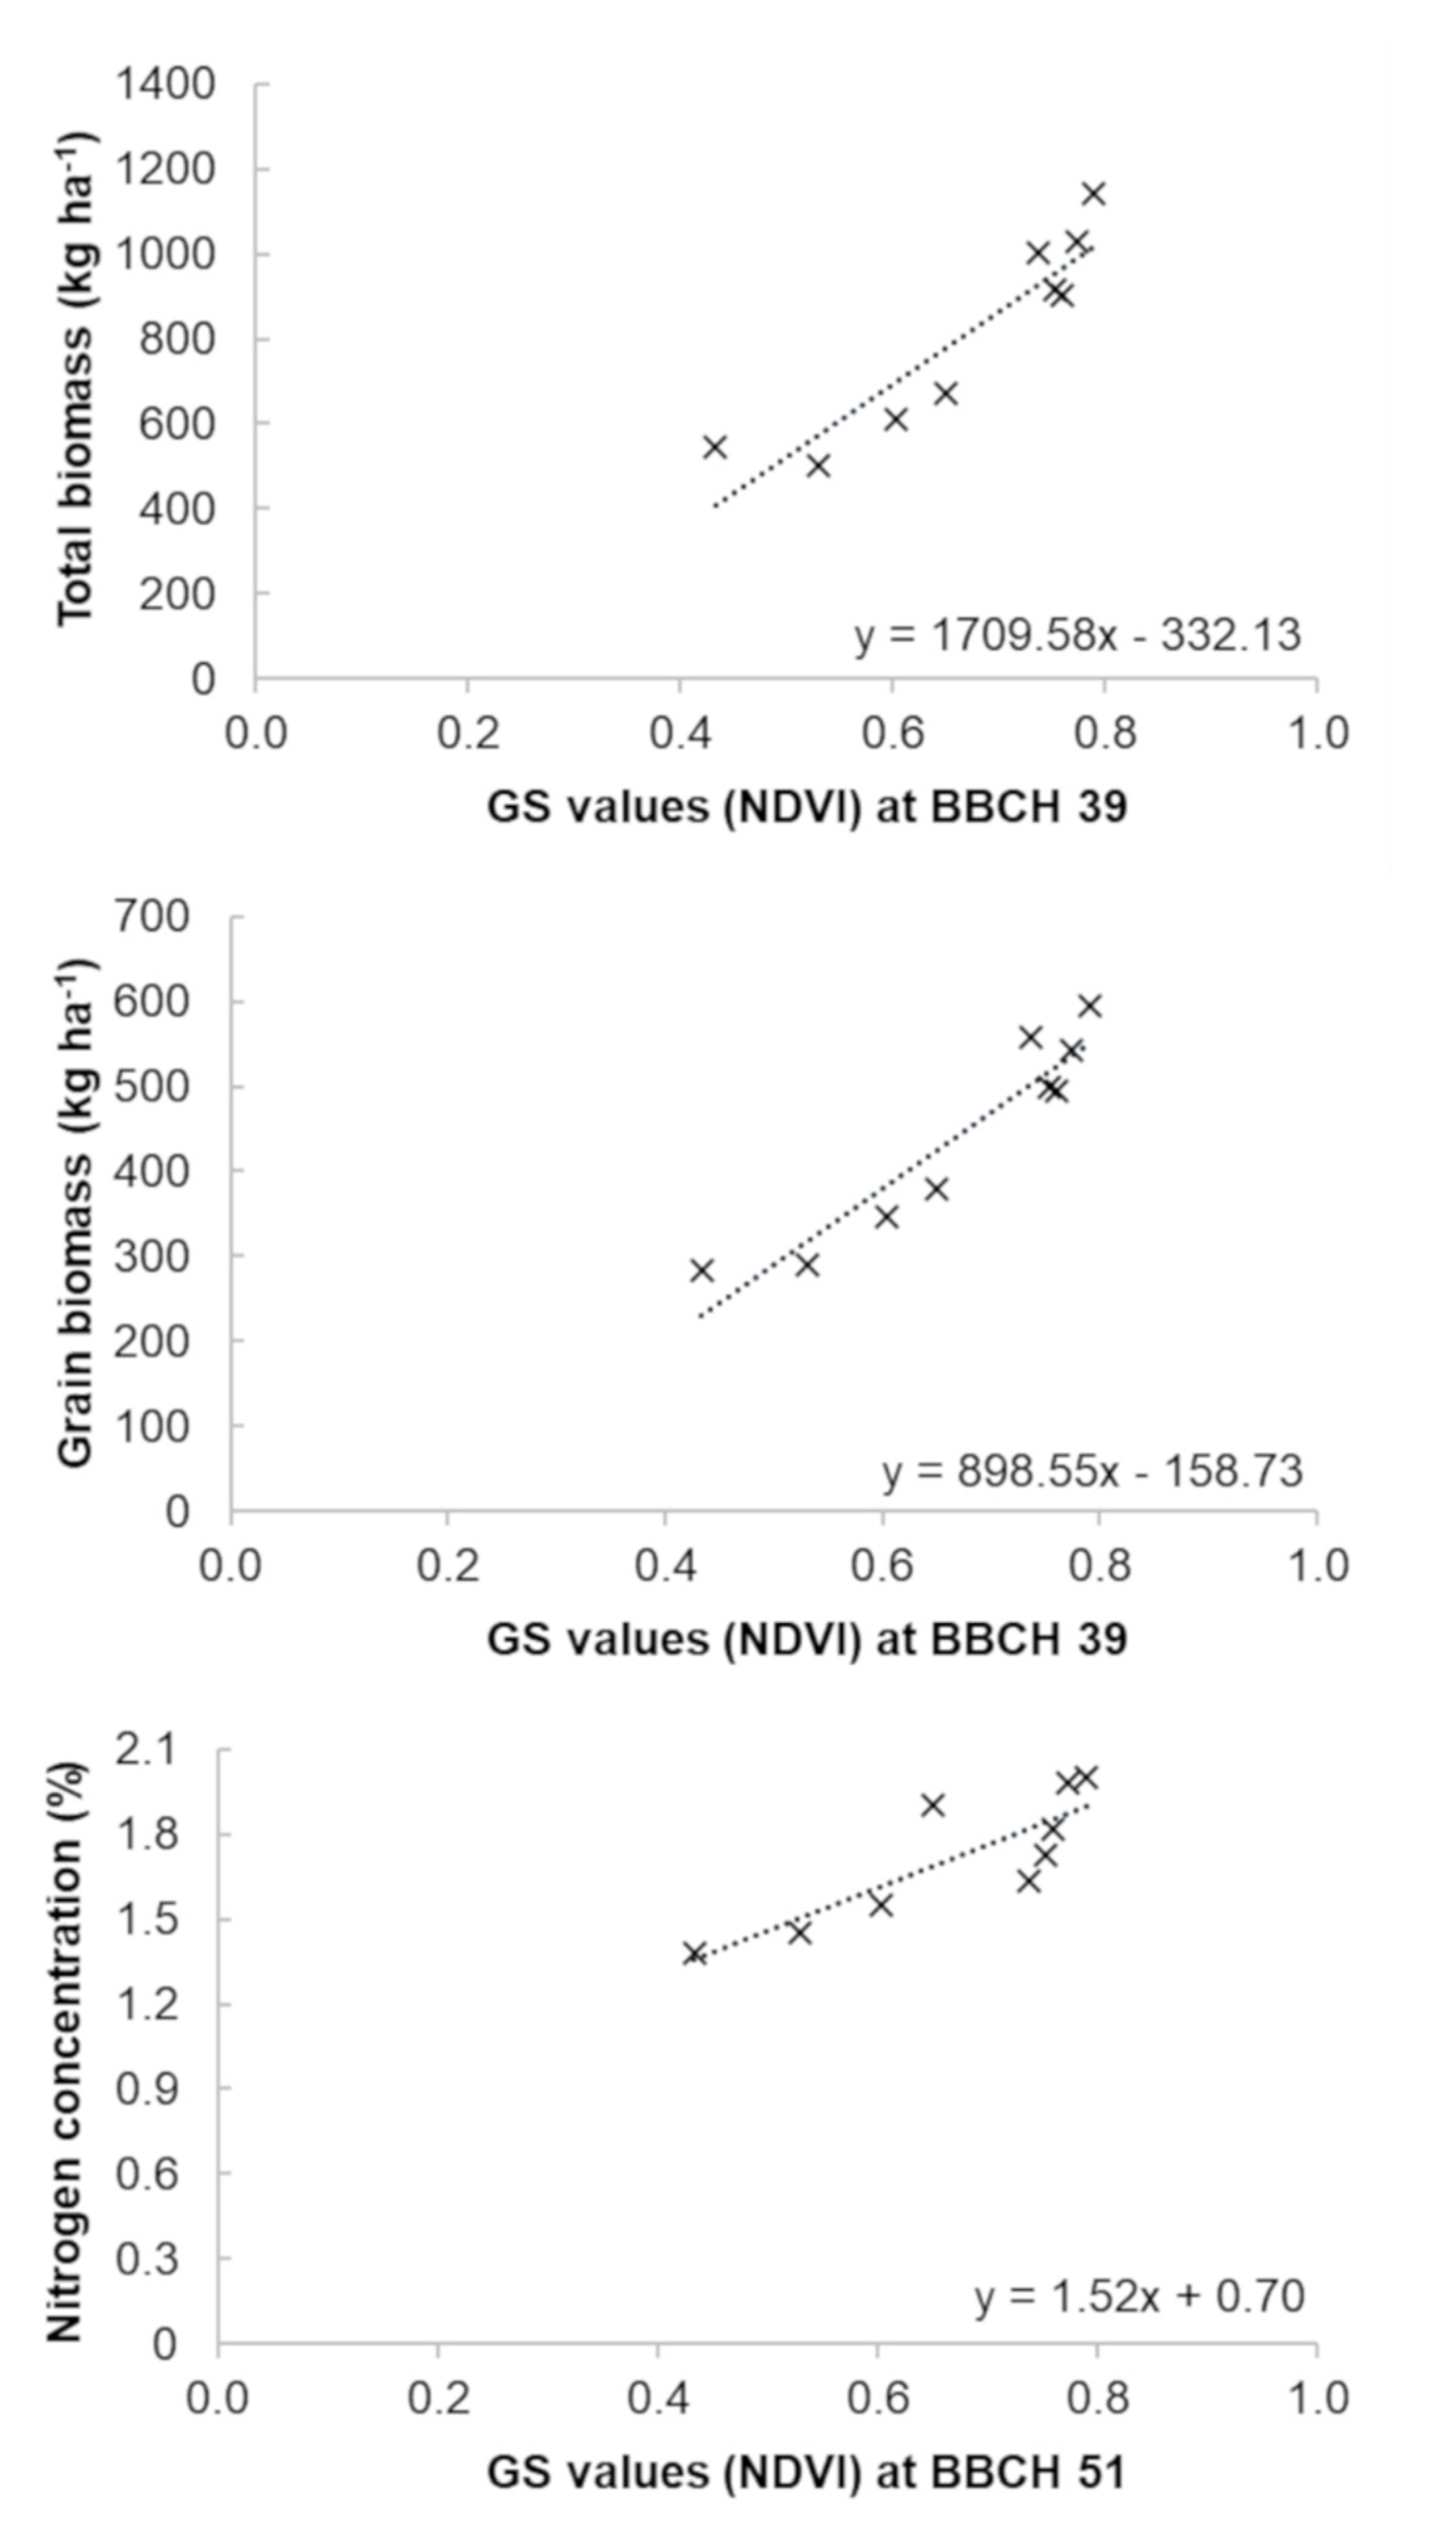
3.4. Possible Use of NDVI Measurements to Predict Plant, Grain Weight, and N Content

The correlation coefficients for the analyzed parameters were higher and highly significant (p < 0.05) from the middle of the stem elongation stage (BBCH 32) to the medium milk stage (BBCH 75) (Table 3). In the present study, no correlation was observed between NDVI (measured either at tillering or at the beginning of senescence) and final total biomass and mass of dry matter of grain. The highest positive and significant correlation (p < 0.05) was performed at the beginning of booting, followed by a slow decrease until the maturity stage, performing GreenSeeker measurements. Regarding the relationship between N content and NDVI, there was a significant correlation (p < 0.05) from BBCH 32 (stem elongation) to BBCH 75 (medium milk). In this study, the highest significant (p < 0.05) correlation for estimating the N concentration was found at the beginning of the heading stage (BBCH 51). This was a suitable stage to detect the final characteristics of crops (and is also suitable for biomass and grain weight). However, NDVI values measured during the early (23 and 30 BBCH) and final crop stages (85 and 90 BBCH), respectively, were unsuitable when predicting the final N content of barley. Thus, results suggested that at the beginning of booting (around 39 BBCH) is the most appropriate time to predict barley total biomass and grain biomass, while flowering (51 BBCH) is the best time to predict quality parameters (Figure 4).
These results were consistent with Hassan et al. [69] who reported that NDVI at booting stage can be used to predict grain yield of rainfed wheat, showing R2 values ranging from 0.38 to 0.90 from stem elongation to late grain filling across the treatments. Moreover, NDVI at heading stage can also be sensitive to yield changes at different N rates. Similar results were also found for wheat, showing a high positive correlation (R2 = 0.78) between NDVI and grain yield at the booting stage [70]. Spitkó et al. [71] similarly showed a weak positive relationship between NDVI and corn yield in the early stages and significant (p < 0.05) association in plant development. In this study, the lack of a positive and significant correlation (p > 0.05) between NDVI and biomass at the tillering stage could be due to the low canopy cover and the influence of soil background at early stages [72]. Instead, the lack of a significant relationship (p > 0.05) between NDVI and biomass and NDVI and yield at the senescence stage could be due to the yellowing of crops across the treatments [73]. Moreover, the relationship between biomass and NDVI showed similar results from BBCH stages 32 to 75, probably due to the saturation effect of indices when crop canopy closes over time [74].
Regarding the relationship between N content and NDVI, the present results corroborated previous findings, as a study carried out on wheat that showed correlation between NDVI measured in different growth stages and grain properties, thereby revealing high relationships (R2 > 0.90 at heading stage) for both grain/biomass yield and N content [75].

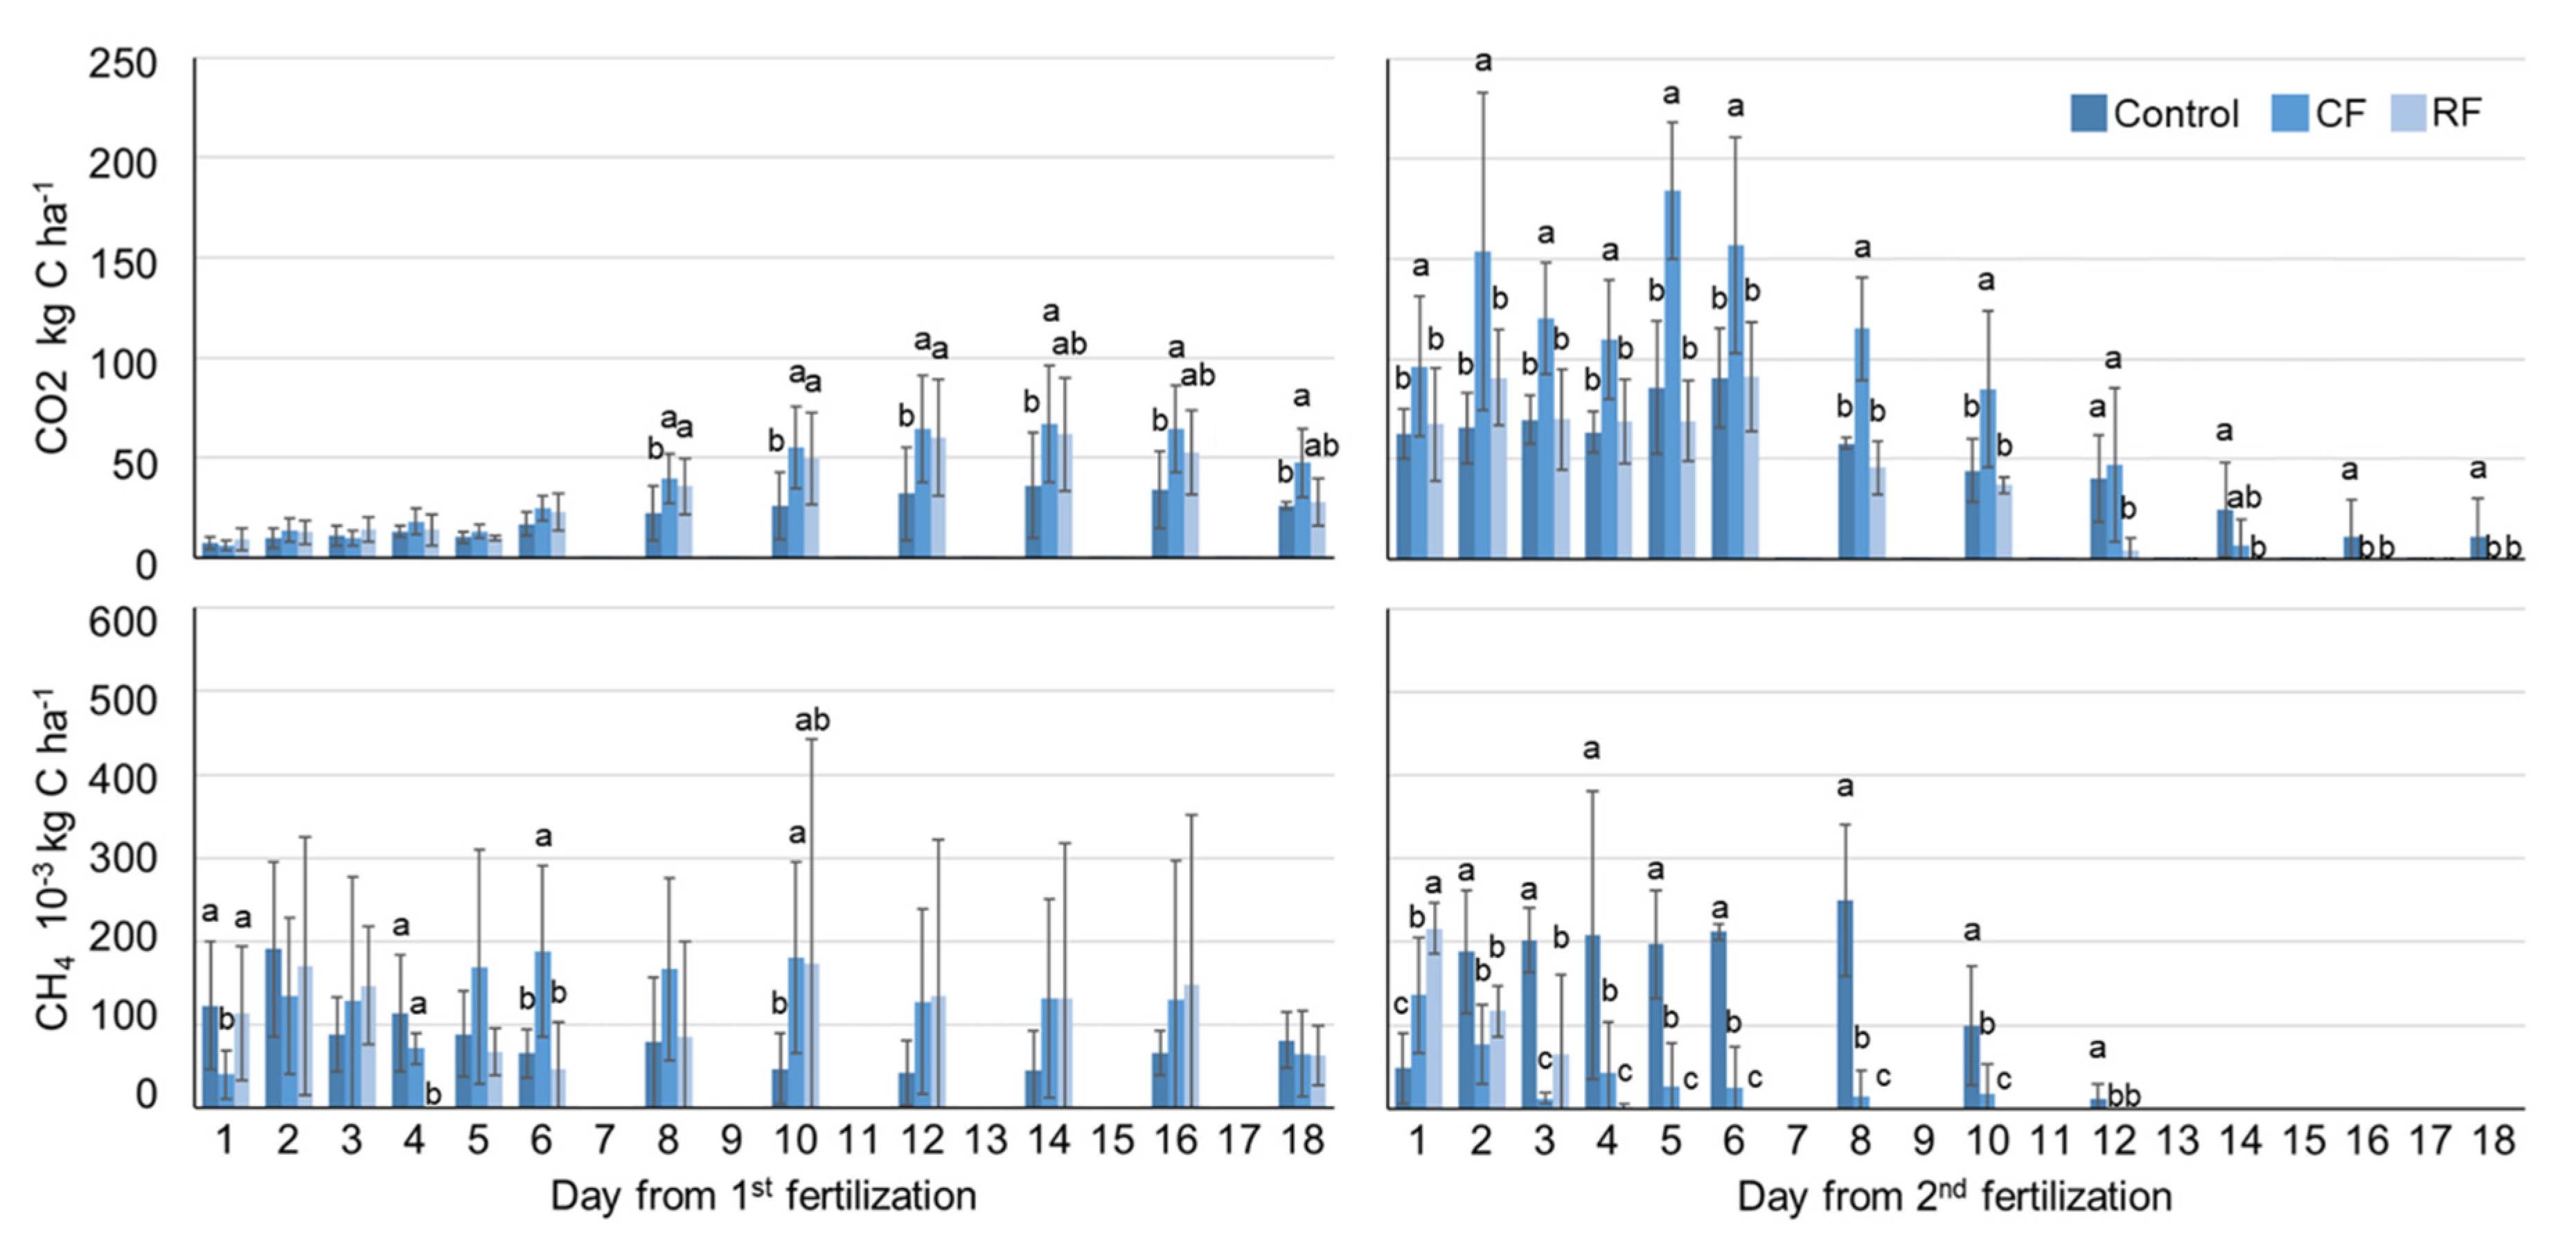
3.5. Effect of Fertilization Method on GHGs Emissions

During the growing period, no N2O and NH3 emissions were measured. It is likely that N2O and NH3 emissions throughout the whole experimental period were below the minimum detectable level of the gas measuring instrument. In addition, ammonium nitrate is known to have less volatilization and denitrification compared to other N sources. In this context, Chu et al. [43] found the maximum N2O fluxes in winter barley to be less than 50 µg m−2 h−1. The incorporation of the fertilizer into the soil may have substantially contributed to the prevention of N2O and NH3 emissions, as suggested by Boeckx et al. [76].
CO2 emissions increased approximately one week after the first fertilization treatment (Figure 5).
CO2 fluxes were low from day 1 to day 6, and no significant differences (p > 0.05) were found between treatments. Then, starting from day 7, CO2 emissions rapidly increased. Furthermore, significant differences (p < 0.05) between Control and CF were observed for all sampling dates. The differences between Control and RF were only significant (p < 0.05) within a five-day time frame over the monitoring period. Significant differences (p < 0.05) were evident between Control and N fertilization treatments but not (p > 0.05) between CF and RF.
After the second fertilization, the CO2 emissions from RF were significantly (p < 0.05) lower than those from CF until day 13, after which no significant differences (p > 0.05) were found. Additionally, no significant differences (p > 0.05) were found between RF and Control until day 10. The emissions might be influenced by differing ecosystem respiration, as well as temperature and soil moisture. During the second sampling, the CO2 emissions from the CF treatment were significantly (p < 0.05) higher than the other treatments for the first 10 days, with a peak at day five, where the highest temperature was also evident (Figure 1). The CO2 emissions from the Control were higher from day 15. During the second fertilization, the average emission measured for CF was significantly higher (p < 0.05) than those measured for RF and Control (Table 4). In the present study, the overall increase in CO2 emissions observed from the first to the second fertilization, respectively, was invariably attributable to higher temperatures. The average air temperature was 20 °C from the end of April to the beginning of May, compared with the average air temperature of 14.3 °C at the time of the first fertilization treatment (Figure 1). Significant differences (p < 0.05) in CO2 emissions between the different tanks, regardless of the fertilization treatment, were found with respect to the initial soil C content. The results showed that for the Control, the organic C content of the soil was negatively correlated with CO2 emissions. On the contrary, results indicated that emissions were positively correlated with the initial C content when N was supplied through fertilization.
In this study analyzing the dynamics of CH4 emissions from all treatments after both the first and the second fertilization, the results showed lower average emissions with respect to CO2 (Table 4). However, flux was similar with increases occurring during crop growth. Once again, these results might be attributable to weather conditions. The first fertilization treatment was characterized by lower rainfall conditions compared with the second treatment (43 mm F1 and 59.2 mm F2, respectively, see Figure 1), as well as colder temperatures. In the present study, owing to the variability of emissions during crop growth, it was not possible to carry out an appropriate statistical analysis of CH4 production. After the second fertilization, CH4 emissions revealed an opposite trend compared with that observed after the first fertilization treatment. The daily CH4 emissions varied after the second fertilization, showing a different duration that was related to N treatment. CH4 emissions were measured until day 12, 3 and 5 for the Control, RF and CF tanks, respectively. Moreover, for Control, daily emissions attained a level of 1.76 kg C ha−1 day−1, compared with 1.25 and 0.7 kg C ha−1 day−1 for RF and CF, respectively.
Grasslands studies showed that the ecosystem respiration in 60 kg N ha−1 plots was not significant compared to the control plots (no N), while ecosystem respiration in 120 and 240 kg N ha−1 treatment plots, respectively, was significantly enhanced relative to the control plots [77]. In general, N content influences soil carbon emissions, thereby affecting microbial activity, root respiration and chemical decay processes [78]. Previous studies have been conducted on the effect of N fertilization on CO2 emissions and microbiological activity. It was shown that increasing N fertilization was able to depress soil CO2 fluxes, probably due to a reduction of microbial activity [79]. On the other hand, Sainju et al. [80] demonstrated that N fertilization was able to increase CO2 flux compared with no N fertilization, probably as a result of accelerated root respiration due to enhanced crop growth. Our results were consistent with those of Tanveer et al. [81], who reported that CO2 emission fluxes increased with the enhancing of crop growth and air temperature. The positive relationship between CO2 emission and the initial C content may have been attributable to soil microbial activity, which is strongly influenced by C soil content [82]. Previous results showed that N availability can be substantially influenced by the effect of C availability on CO2 emissions, depending on the C/N ratio in the soil. Under low N, the C/N ratio is increased, and as a result microbial activity then becomes depressed by the lack of N, which is essential for protein synthesis. Hence, emissions are not shown to increase with increasing C in soil [83]. Instead, if N is available in the soil, microbial activity is stimulated, and an increase in emissions with increasing C is evident. N fertilization stimulated labile soil organic matter (SOM) decomposition, which is derived from soil residues. Hence, N fertilization supplies bioavailable N for microbes to generate hydrolase and achieve resources [84].
In regard to CH4, the exchange between croplands and the atmosphere is also affected by N fertilization [85]. Reports from the literature show variable results. In some studies, CH4 emissions were activated [86,87], whereas in others, they appeared inhibited [88], and in some cases, no significant effects were reported [89]. As reported previously, in wetland soils, warm spring rainfall was shown to promote CH4 production from the soil [90]. Chu et al. [43], in an experiment carried out on barley, showed that N fertilization application increased CH4 emissions, probably due to an effect on CH4 uptake. However, Chu et al. [43] again found positive CH4 emissions from no fertilized plots after March, linking this to the combination of soil and weather conditions.
Our results indicated that in the experiment, the rate of CO2 increased significantly with the addiction of N fertilizer, leading to larger emissions. On the other hand, CH4 emissions seemed to be more related to factors other than N fertilization. Deeper research has to be carried out in other similar studies to validate the results.

4. Conclusions

More suitable agricultural practices are required in Italian cereals farms, where farmers use techniques affected by tradition. Precision N fertilization techniques are reported to be modern and valid strategies for enhancing productivity and economy and decreasing environmental impact. This study tried to briefly evaluate these aspects, applying a specific sensor-based N rate for Italian barley production and comparing it with conventional N management. Results evidenced that GreenSeeker can be a useful tool for monitoring crop growth and managing N fertilizer in barley. In fact, GreenSeeker proved to be able in predicting barley crop quantity and quality traits at the booting stage. The method used to apply variable N has been proved to be effective, leading to a similar yield to conventional practice (150 kg N ha−1) while using less fertilizer (75 kg N ha−1). Additionally, the variable rate fertilization method has been proved to be a valid alternative to traditional fertilization, considering environmental impact in addition to economic evaluation and leading a saving of 266 € ha−1. Nowadays, the issue of the environmental cost of nutrients is spreading, and the possibility of adding taxes to the social cost of N might create serious problems for farmers. Analysis indicated that in the present study, the abatement of N rate for variable fertilization has led to lower CO2 production from the crop system. Unfortunately, the high variability in the emission data hampered a deep understanding of the relationship between N content and CH4 production in soil. In addition, it was not possible to detect N2O and NH3 emissions during the experiment. Due to the variability of the results, it is not possible to assert that the specific variable rate technique leads to a GHG emission reduction compared with conventional practice. Further, a more in-depth knowledge of spatial and temporal interactions between the soil-plant-atmosphere system is essential. Therefore, this study showed the potential of a proximal sensor-based fertilization to increase yield and farmers’ income, but further analysis is necessary to assess the effect of N fertilizer rates on C emissions dynamics.

Author Contributions

Conceptualization, M.N., M.M., S.O., and A.D.M.; visualization: C.F., M.N.; methodology, M.N., L.V., M.M., and A.D.M.; validation, C.F. and M.N.; formal analysis, M.N.; investigation, C.F., M.N., L.V. and M.M.; funding acquisition, M.M., S.O. and A.D.M.; data curation, C.F., L.V. and M.N.; writing—original draft preparation, C.L. and M.N.; writing—review and editing, C.F., M.N. and A.D.M.; supervision, S.O. All authors have read and agreed to the published version of the manuscript.

Funding

The project was financed by the project “PANE + DAYS” co-financed under Tuscany FEASR 2014-2020 Rural Development Programme; Measure 16.2; GO-PEI; the project was also supported by “Fondazione Cassa di Risparmio di Firenze” and “Fondazione per il Clima e la Sostenibilità”. The authors also wish to thank Roberto Vivoli from DAGRI for his support during the whole experimentation.

Conflicts of Interest

The authors declare no conflict of interest.

References

  1. Lindblom, J.; Lundström, C.; Ljung, M.; Jonsson, A. Promoting sustainable intensification in precision agriculture: Review of decision support systems development and strategies. Precis. Agric. 2017, 18, 309–331. [Google Scholar] [CrossRef] [Green Version]
  2. Brisco, B.; Brown, R.J.; Hirose, T.; McNairn, H.; Staenz, K. Precision agriculture and the role of remote sensing: A review. Can. J. Remote Sens. 2014, 24, 315–327. [Google Scholar] [CrossRef]
  3. Robertson, M.J.; Llewellyn, R.S.; Mandel, R.; Lawes, R.; Bramley, R.G.V.; Swift, L.; Metz, N.; O’Callaghan, C. Adoption of variable rate fertilizer application in the Australian grains industry: Status, issues and prospects. Precis. Agric. 2012, 13, 181–199. [Google Scholar] [CrossRef]
  4. Naser, M.A.; Khosla, R.; Longchamps, L.; Dahal, S. Using NDVI to differentiate wheat genotypes productivity under dryland and irrigated conditions. Remote Sens. 2020, 12, 824. [Google Scholar] [CrossRef] [Green Version]
  5. Ranđelović, P.; Đorđević, V.; Milić, S.; Balešević-Tubić, S.; Petrović, K.; Miladinović, J.; Đukić, V. Prediction of soybean plant density using a machine learning model and vegetation indices extracted from RGB images taken with a UAV. Agronomy 2020, 10, 1108. [Google Scholar] [CrossRef]
  6. Guo, A.; Huang, W.; Ye, H.; Dong, Y.; Ma, H.; Ren, Y.; Ruan, C. Identification of wheat yellow rust using spectral and texture features of hyperspectral images. Remote Sens. 2020, 12, 1419. [Google Scholar] [CrossRef]
  7. Sandino, J.; Pegg, G.; Gonzalez, F.; Smith, G. Aerial mapping of forests affected by pathogens using UAVs, hyperspectral sensors, and artificial intelligence. Sensors 2018, 18, 944. [Google Scholar] [CrossRef] [Green Version]
  8. Siqueira, R.; Longchamps, L.; Dahal, S.; Khosla, R. Use of fluorescence sensing to detect nitrogen and potassium variability in maize. Remote Sens. 2020, 12, 1752. [Google Scholar] [CrossRef]
  9. Alvar-Beltrán, J.; Fabbri, C.; Verdi, L.; Truschi, S.; Dalla Marta, A.; Orlandini, S. Testing proximal optical sensors on Quinoa growth and development. Remote Sensing 2020, 12, 1958. [Google Scholar] [CrossRef]
  10. Aranguren, M.; Castellón, A.; Aizpurua, A. Crop sensor based non-destructive estimation of nitrogen nutritional status, yield, and grain protein content in wheat. Agriculture 2020, 10, 148. [Google Scholar] [CrossRef]
  11. Zhao, Y.; Potgieter, A.B.; Zhang, M.; Wu, B.; Hammer, G.L. Predicting wheat yield at the field scale by combining high-resolution Sentinel-2 satellite imagery and crop modelling. Remote Sensing 2020, 12, 1024. [Google Scholar] [CrossRef] [Green Version]
  12. Tagarakis, A.C.; Ketterings, Q.M. In-season estimation of corn yield potential using proximal sensing. Agron. J. 2017, 109, 1323–1330. [Google Scholar] [CrossRef] [Green Version]
  13. Holland, K.H.; Schepers, J.S. Derivation of a variable rate nitrogen application model for in-season fertilization of corn. Agron. J. 2010, 102, 1415–1424. [Google Scholar] [CrossRef]
  14. Padilla, F.M.; Peña-Fleitas, M.T.; Gallardo, M.; Thompson, R.B. Threshold values of canopy reflectance indices and chlorophyll meter readings for optimal nitrogen nutrition of tomato. Ann. Appl. Biol. 2015, 166, 271–285. [Google Scholar] [CrossRef]
  15. Padilla, F.M.; Peña-Fleitas, M.T.; Gallardo, M.; Thompson, R.B. Proximal optical sensing of cucumber crop N status using chlorophyll fluorescence indices. Eur. J. Agron. 2016, 73, 83–97. [Google Scholar] [CrossRef]
  16. Lu, J.; Miao, Y.; Shi, W.; Li, J.; Hu, X.; Chen, Z.; Kusnierek, K. Developing a proximal active canopy sensor-based precision nitrogen management strategy for high-yielding rice. Remote Sens. 2020, 12, 1440. [Google Scholar] [CrossRef]
  17. Ali, A.M. Using hand-held chlorophyll meters and canopy reflectance sensors for fertilizer nitrogen management in cereals in small farms in developing countries. Sensors 2020, 20, 1127. [Google Scholar]
  18. Padilla, F.M.; Gallardo, M.; Peña-Fleitas, M.T.; de Souza, R.; Thompson, R.B. Proximal optical sensors for nitrogen management of vegetable crops: A review. Sensors 2018, 18, 2083. [Google Scholar] [CrossRef] [Green Version]
  19. Marino, S.; Alvino, A. Proximal sensing and vegetation indices for site-specific evaluation on an irrigated crop tomato. Eur. J. Remote Sens. 2014, 47, 271–283. [Google Scholar] [CrossRef]
  20. De Souza, R.; Peña-Fleitas, M.T.; Thompson, R.B.; Gallardo, M.; Padilla, F.M. Assessing performance of vegetation indices to estimate nitrogen nutrition index in pepper. Remote Sens. 2020, 12, 763. [Google Scholar] [CrossRef] [Green Version]
  21. Pallottino, F.; Biocca, M.; Nardi, P.; Figorilli, S.; Menesatti, P.; Costa, C. Science mapping approach to analyze the research evolution on precision agriculture: World, EU and Italian situation. Precis. Agric. 2018, 19, 1011–1026. [Google Scholar] [CrossRef]
  22. Lukina, E.V.; Freeman, K.W.; Wynn, K.J.; Thomason, W.E.; Mullen, R.W.; Stone, M.L.; Solie, J.B.; Klatt, A.R.; Johnson, G.V.; Elliott, R.L.; et al. Nitrogen fertilization optimization algorithm based on in-season estimates of yield and plant nitrogen uptake. J. Plant Nutr. 2001, 24, 885–898. [Google Scholar] [CrossRef]
  23. Scharf, P.C.; Shannon, D.K.; Palm, H.L.; Sudduth, K.A.; Drummond, S.T.; Kitchen, N.R.; Mueller, L.J.; Hubbard, V.C.; Oliveira, L.F. Sensor-based nitrogen applications out-performed producer-chosen rates for corn in on-farm demonstrations. Agron. J. 2011, 103, 1683–1691. [Google Scholar] [CrossRef]
  24. Robertson, M.; Carberry, P.; Brennan, L. Economic benefits of variable rate technology: Case studies from Australian grain farms. Crop Pasture Sci. 2009, 60, 799–807. [Google Scholar] [CrossRef]
  25. McFadden, B.R.; Brorsen, B.W.; Raun, W.R. Nitrogen fertilizer recommendations based on plant sensing and Bayesian updating. Precis. Agric. 2018, 19, 79–92. [Google Scholar] [CrossRef]
  26. Molin, J.P.; Motomiya, A.V.D.A.; Frasson, F.R.; Faulin, G.D.C.; Tosta, W. Test procedure for variable rate fertilizer in coffee. Acta Scientiarum. Agron. 2010, 32, 569–575. [Google Scholar] [CrossRef] [Green Version]
  27. Bragagnolo, J.; Amado, T.J.C.; Nicoloso, R.S.; Santi, A.L.; Fiorin, J.E.; Tabaldi, F. Optical crop sensor for variable-rate nitrogen fertilization in corn: II-indices of fertilizer efficiency and corn yield. Revista Brasileira de Ciência do Solo 2013, 37, 1299–1309. [Google Scholar] [CrossRef] [Green Version]
  28. Colaço, A.F.; Molin, J.P. Variable rate fertilization in citrus: A long-term study. Precis. Agric. 2017, 18, 169–191. [Google Scholar] [CrossRef]
  29. Basso, B.; Dumont, B.; Cammarano, D.; Pezzuolo, A.; Marinello, F.; Sartori, L. Environmental and economic benefits of variable rate nitrogen fertilization in a nitrate vulnerable zone. Sci. Total Environ. 2016, 545–546, 227–235. [Google Scholar] [CrossRef] [Green Version]
  30. Phillips, S.B.; Keahey, D.A.; Warren, G.W.; Mullins, G.L. Nitrogen management. Agron. J. 2004, 96, 591–600. [Google Scholar]
  31. Jana Havrankova, J.; Richard John Godwin, R.J.; Vladimir Rataj, V.; Gavin Adam Wood, G.A. Benefits from Application of Ground Based Remote Sensing Systems in Winter Wheat Nitrogen Management in Europe. In 2008 Providence, Rhode Island, USA, 29 June–2 July 2008; American Society of Agricultural and Biological Engineers: St. Joseph, MI, USA, 2008; p. 1. [Google Scholar]
  32. Diacono, M.; Rubino, P.; Montemurro, F. Precision nitrogen management of wheat. A review. Agron. Sustain. Dev. 2013, 33, 219–241. [Google Scholar] [CrossRef]
  33. Stefanini, M.; Larson, J.A.; Lambert, D.M.; Yin, X.; Boyer, C.N.; Scharf, P.; Buschermohle, M.J. Effects of optical sensing based variable rate nitrogen management on yields, nitrogen use and profitability for cotton. Precis. Agric. 2019, 20, 591–610. [Google Scholar] [CrossRef]
  34. Li, A.; Duval, B.D.; Anex, R.; Scharf, P.; Ashtekar, J.M.; Owens, P.R.; Ellis, C. A case study of environmental benefits of sensor-based nitrogen application in corn. J. Environ. Qual. 2016, 45, 675–683. [Google Scholar] [CrossRef] [PubMed] [Green Version]
  35. Lenerts, A.; Popluga, D. Facilitate calculations of GHG emissions in Latvian agriculture at farm level. In Proceedings of the 15th International Multidisciplinary Scientific Geoconference SGEM 2015 “Ecology, Economics, Education and Legislation” Conference Proceedings, Albena, Bulgaria, 18–24 June 2015; Volume III, pp. 287–294. [Google Scholar]
  36. Kritikos, M. Precision agriculture in Europe. Legal, Social and Ethical Considerations STUDY EPRS|European Parliamentary Research Service Science and Technology Options Assessment; STOA: Brussels, Belgium, 2017. [Google Scholar]
  37. Domínguez, P.; Fellmann, T.; Weiss, F.; Witzke, P.; Barreiro-Hurlé, J.; Himics, M.; Jansson, T.; Salputra, G.; Leip Ignacio Pérez Domínguez, A. EU Impact Analysis on GHG-Emission Proposal: Focus on Agriculture EcAMPA 2; JRC Science for Policy Report; European Commission, Publications Office of the European Union: Luxembourg, 2016. [Google Scholar]
  38. Millar, N.; Robertson, G.P.; Diamant, A.; Gehl, R.J.; Grace, P.R.; Hoben, J.P. Quantifying N2O Emissions Reductions in US Agricultural Crops through N Fertilizer Rate Reduction; Verified Carbon Standard: Washington, DC, USA, 2013. [Google Scholar]
  39. Oertel, C.; Matschullat, J.; Zurba, K.; Zimmermann, F.; Erasmi, S. Greenhouse gas emissions from soils—A review. Chemie der Erde 2016, 76, 327–352. [Google Scholar] [CrossRef] [Green Version]
  40. Lu, M.; Zhou, X.; Luo, Y.; Yang, Y.; Fang, C.; Chen, J.; Li, B. Minor stimulation of soil carbon storage by nitrogen addition: A meta-analysis. Agric. Ecosyst. Environ. 2011, 140, 234–244. [Google Scholar] [CrossRef]
  41. Al-Kaisi, M.M.; Kruse, M.L.; Sawyer, J.E. Effect of Nitrogen Fertilizer Application on Growing Season Soil Carbon Dioxide Emission in a Corn-Soybean Rotation. J. Environ. Qual. 2008, 37, 325–332. [Google Scholar] [CrossRef] [PubMed]
  42. Gagnon, B.; Ziadi, N.; Rochette, P.; Chantigny, M.H.; Angers, D.A.; Bertrand, N.; Smith, W.N. Soil-surface carbon dioxide emission following nitrogen fertilization in corn. Can. J. Soil Sci. 2016, 96, 219–232. [Google Scholar] [CrossRef]
  43. Chu, H.; Hosen, Y.; Yagi, K. NO, N2O, CH4 and CO2 fluxes in winter barley field of Japanese Andisol as affected by N fertilizer management. Soil Biol. Biochem. 2007, 39, 330–339. [Google Scholar] [CrossRef]
  44. Bin-Feng, S.; Zhao, H.; Yi-Zhong, L.Ü.; Fei, L.U.; Wang, X.-K. The effects of nitrogen fertilizer application on methane and nitrous oxide emission/uptake in Chinese croplands. J. Integr. Agric. 2016, 15, 440–450. [Google Scholar]
  45. Balafoutis, A.; Beck, B.; Fountas, S.; Vangeyte, J.; Wal, T.; Soto, I.; Gómez-Barbero, M.; Barnes, A.; Eory, V.; Balafoutis, A.; et al. Precision Agriculture Technologies Positively Contributing to GHG Emissions Mitigation, Farm Productivity and Economics. Sustainability 2017, 9, 1339. [Google Scholar] [CrossRef] [Green Version]
  46. Willer, H.; Yussefi-Menzler, M.; Sorensen, N. The World of Organic Agriculture—Statistics and Emerging Trends 2008; Earthscan: Bohn, Germany, 2010. [Google Scholar]
  47. SIR No Title. Available online: http://www.sir.toscana.it/ricerca-dati (accessed on 2 March 2019).
  48. Poorter, H.; Bühler, J.; van Dusschoten, D.; Climent, J.; Postma, J.A. Pot size matters: A meta-analysis of the effects of rooting volume on plant growth. Funct. Plant Biol. 2012, 39, 839–850. [Google Scholar] [CrossRef] [PubMed] [Green Version]
  49. Fan, J.; McConkey, B.; Wang, H.; Janzen, H. Root distribution by depth for temperate agricultural crops. Field Crops Res. 2016, 189, 68–74. [Google Scholar] [CrossRef] [Green Version]
  50. Napoli, M.; Cecchi, S.; Zanchi, C.A.; Orlandini, S. Leaching of glyphosate and aminomethylphosphonic acid through silty clay soil columns under outdoor conditions. J. Environ. Qual. 2015, 44, 1667–1673. [Google Scholar] [CrossRef] [PubMed]
  51. Foster, A.; Atwell, S.; Dunn, D. Sensor-based nitrogen fertilization for midseason rice production on Southeast Missouri. Crop Forage Turf. Man. 2017, 3, 1–7. [Google Scholar] [CrossRef] [Green Version]
  52. Verdi, L.; Kuikman, P.J.; Orlandini, S.; Mancini, M.; Napoli, M.; Dalla Marta, A. Does the use of digestate to replace mineral fertilizers have less emissions of N2O and NH3? Agric. For. Meteorol. 2019, 269–270, 112–118. [Google Scholar] [CrossRef]
  53. Parkin, T.B.; Venterea, R.T. Chamber-based trace gas flux measurements. In Sampling Protocols; Follet, R.F., Ed.; USDA-ARS: Beltsville, MD, USA, 2010; pp. 3-1–3-39. [Google Scholar]
  54. Napoli, M.; Cecchi, S.; Orlandini, S.; Mugnai, G.; Zanchi, C.A. Simulation of field-measured soil loss in Mediterranean hilly areas (Chianti, Italy) with RUSLE. Catena 2016, 145, 246–256. [Google Scholar] [CrossRef]
  55. Gee, G.W.; Bauder, J.W. Particle-size analysis. In Methods of Soil Analysis, Part 1. Physical and Mineralogical Methods, Agronomy Monograph No. 9; Klute, A., Ed.; Soil Science Society of America, American Society of Agronomy: Madison, WI, USA, 1986; pp. 383–411. [Google Scholar]
  56. Allison, L.E.; Moodie, C.D. Carbonate. In Methods of Soil Analysis. Part 2. Chemical and Microbiological Properties; Black, C.A., Ed.; American Society of Agronomy: Madison, WI, USA, 1965; pp. 1379–1398. [Google Scholar]
  57. Santi, C.; Certini, G.; D’Acqui, L.P. Direct determination of organic carbon by dry combustion in soils with carbonates. Commun. Soil Sci. Plant Anal. 2006, 37, 155–162. [Google Scholar] [CrossRef]
  58. Matejovic, I. Determination of carbon and nitrogen in samples of various soils by the dry combustion. Commun. Soil Sci. Plant Anal. 1997, 28, 1499–1511. [Google Scholar] [CrossRef]
  59. AOAC. AOAC Official Methods of Analysis, 13th ed.; Horwitz, W., Ed.; Association of Otlicial Analytical Chemists: Washington, DC, USA, 1980. [Google Scholar]
  60. FICAMCOM Listino dei Prezzi all’Ingrosso Rilevati sul Mercato di Firenze—Listino n. 8 dal 18 al 24 Febbraio. 2019. Available online: https://www.fi.camcom.gov.it/regolazione-del-mercato/tutela-di-consumatori-e-imprese/prezzi/listini-settimanali-dei-prezzi-allingrosso (accessed on 12 March 2019).
  61. MOCAMCOM Listino dei Prezzi all’Ingrosso Rilevati sul Mercato di Modena—Anno 2018—n° 53 del 31 Dicembre 2018. Available online: https://www.mo.camcom.it/tutela-del-mercato/borsamerci/listini (accessed on 12 March 2019).
  62. IPCC. The Physical Science Basis. Working Group I Contribution to the 5th Assessment Report of the IPCC. Available online: http://www.climatechange2013.org (accessed on 20 January 2020).
  63. Brentrup, F.; Pallière, C. Energy efficiency and greenhouse gas emissions in European nitrogen fertilizer production and use. In Proceedings of International Fertiliser Society; The International Fertiliser Society: Cambridge, UK, 2008; pp. 1–25. [Google Scholar]
  64. Bragagnolo, J.; Jorge Carneiro Amado, T.; da Silveira Nicoloso, R.; Jasper, J.; Kunz, J.; de Gregori Teixeira, T. Optical crop sensor for variable-rate nitrogen fertilization in corn: i-plant nutrition and dry matter production. Rev. Bras. Ciênc. Solo 2013, 37, 1288–1298. [Google Scholar] [CrossRef] [Green Version]
  65. Mayfield, A.H.; Trengove, S.P. Grain yield and protein responses in wheat using the N-Sensor for variable rate N application. Crop Pasture Sci. 2009, 60, 818–823. [Google Scholar] [CrossRef]
  66. Keeler, B.L.; Gourevitch, J.D.; Polasky, S.; Isbell, F.; Tessum, C.W.; Hill, J.D.; Marshall, J.D. The social cost of nitrogen. Sci. Adv. 2016, 2, e1600219. [Google Scholar] [CrossRef] [PubMed] [Green Version]
  67. Van Grinsven, H.J.; Holland, M.; Jacobsen, B.H.; Klimont, Z.; Sutton, M.A.; Jaap Willems, W. Costs and benefits of nitrogen for Europe and implications for mitigation. Environ. Sci. Technol. 2013, 47, 3571–3579. [Google Scholar] [CrossRef] [PubMed]
  68. de Motomiya, A.V.; Molin, J.P.; Chiavegato, E.J. Utilização de sensor óptico ativo para detectar deficiência foliar de nitrogênio em algodoeiro 1. Rev. Bras. Eng. Agrícola e Ambient. 2009, 13, 137–145. [Google Scholar] [CrossRef] [Green Version]
  69. Hassan, M.A.; Yang, M.; Rasheed, A.; Yang, G.; Reynolds, M.; Xia, X.; Xiao, Y.; He, Z. A rapid monitoring of NDVI across the wheat growth cycle for grain yield prediction using a multi-spectral UAV platform. Plant Sci. 2019, 282, 95–103. [Google Scholar] [CrossRef]
  70. Kaur, R.; Singh, B.; Singh, M.; Thind, S.K. Hyperspectral indices, correlation and regression models for estimating growth parameters of wheat genotypes. J. Indian Soc. Remote Sens. 2015, 43, 551–558. [Google Scholar] [CrossRef]
  71. Spitkó, T.; Nagy, Z.; Zsubori, Z.T.; Szőke, C.; Berzy, T.; Pintér, J.; Marton, C.L. Connection between normalized difference vegetation index and yield in maize. Plant Soil Environ. 2016, 62, 293–298. [Google Scholar] [CrossRef]
  72. Huete, A.R. A soil-adjusted vegetation index (SAVI). Remote Sens. Environ. 1988, 25, 295–309. [Google Scholar] [CrossRef]
  73. Prabhakara, K.; Dean Hively, W.; McCarty, G.W. Evaluating the relationship between biomass, percent groundcover and remote sensing indices across six winter cover crop fields in Maryland, United States. Int. J. Appl. Earth Obs. Geoinf. 2015, 39, 88–102. [Google Scholar] [CrossRef] [Green Version]
  74. Dalla Marta, A.; Grifoni, D.; Mancini, M.; Orlando, F.; Guasconi, F.; Orlandini, S. Durum wheat in-field monitoring and early yield prediction: Assessment of potential use of high resolution satellite imagery in a hilly area of Tuscany, Central Italy. J. Agric. Sci. 2015, 153, 68–77. [Google Scholar] [CrossRef]
  75. Chandel, N.S.; Tiwari, P.S.; Singh, K.P.; Jat, D.; Gaikwad, B.B.; Tripathi, H.; Golhani, K. Yield prediction in wheat (Triticum aestivum L.) using spectral reflectance indices. Curr. Sci. 2019, 116, 272–278. [Google Scholar] [CrossRef]
  76. Boeckx, P.; Vermoesen, A.; Van Cleemput, O. Emission of gaseous hydrocarbons and NH3 out of soils. In Biosphere-Atmosphere Exchange of Pollutants and Trace Substances; Springer: Berlin/Heidelberg, Germany, 1997; pp. 405–412. [Google Scholar]
  77. Song, C.; Wang, L.; Tian, H.; Liu, D.; Lu, C.; Xiaofeng Xu, X.; Zhang, L.; Yang, G.; Wan, Z. Effect of continued nitrogen enrichment on greenhouse gas emissions from a wetland ecosystem in the Sanjiang Plain, Northeast China: A 5 year nitrogen addition experiment. J. Geophys. Res. Biogeosci. 2013, 118, 741–751. [Google Scholar] [CrossRef]
  78. Chapuis-Lardy, L.; Wrage, N.; Metay, A.; Chotte, J.-L.; Bernoux, M. Soils, a sink for N2O? A review. Glob. Chang. Biol. 2007, 13, 1–17. [Google Scholar] [CrossRef]
  79. Fog, K. The effect of added nitrogen on the rate of decomposition of organic matter. Biol. Rev. 1988, 63, 433–462. [Google Scholar] [CrossRef]
  80. Sainju, U.M.; Jabro, J.D.; Stevens, W.B. Soil carbon dioxide emission and carbon content as affected by irrigation, tillage, cropping system, and nitrogen fertilization. J. Environ. Qual. 2008, 37, 98–106. [Google Scholar] [CrossRef] [Green Version]
  81. Tanveer, S.K.; Wen, X.; Lu, X.L.; Zhang, J.; Liao, Y. Tillage, mulch and N fertilizer affect emissions of CO2 under the rain fed condition. PLoS ONE 2013, 8, e72140. [Google Scholar] [CrossRef] [Green Version]
  82. Ma, L.; Huang, W.; Guo, C.; Wang, R.; Xiao, C. Soil microbial properties and plant growth responses to carbon and water addition in a temperate steppe: The importance of nutrient availability. PLoS ONE 2012, 7, e35165. [Google Scholar] [CrossRef]
  83. Liang, L.L.; Eberwein, J.R.; Allsman, L.A.; Grantz, D.A.; Jenerette, G.D. Regulation of CO2 and N2O fluxes by coupled carbon and nitrogen availability. Environ. Res. Lett. 2015, 10, 034008. [Google Scholar] [CrossRef]
  84. Allison, S.D.; Vitousek, P.M. Responses of extracellular enzymes to simple and complex nutrient inputs. Soil Biol. Biochem. 2005, 37, 937–944. [Google Scholar] [CrossRef]
  85. Cai, Z.; Xing, G.; Yan, X.; Xu, H.; Tsuruta, H.; Yagi, K.; Minami, K. Methane and nitrous oxide emissions from rice paddy fields as affected by nitrogen fertilisers and water management. Plant Soil 1997, 196, 7–14. [Google Scholar] [CrossRef]
  86. Liu, L.; Greaver, T.L. A review of nitrogen enrichment effects on three biogenic GHGs: The CO2 sink may be largely offset by stimulated N2O and CH4 emission. Ecol. Lett. 2009, 12, 1103–1117. [Google Scholar] [CrossRef]
  87. Shang, Q.; Yang, X.; Gao, C.; Wu, P.; Liu, J.; Xu, Y.; Shen, Q.; Zou, J.; Guo, S. Net annual global warming potential and greenhouse gas intensity in Chinese double rice-cropping systems: A 3-year field measurement in long-term fertilizer experiments. Glob. Chang. Biol. 2011, 17, 2196–2210. [Google Scholar] [CrossRef]
  88. Venterea, R.T.; Burger, M.; Spokas, K.A. Nitrogen oxide and methane emissions under varying tillage and fertilizer management. J. Environ. Qual. 2005, 34, 1467–1477. [Google Scholar] [CrossRef] [PubMed]
  89. Mosier, A.R.; Halvorson, A.D.; Reule, C.A.; Liu, X.J. Net global warming potential and greenhouse gas intensity in irrigated cropping systems in northeastern colorado. J. Environ. Qual. 2006, 35, 1584–1598. [Google Scholar] [CrossRef] [PubMed] [Green Version]
  90. Neumann, R.B.; Moorberg, C.J.; Lundquist, J.D.; Turner, J.C.; Waldrop, M.P.; McFarland, J.W.; Euskirchen, E.S.; Edgar, C.W.; Turetsky, M.R. Warming effects of spring rainfall increase methane emissions from thawing permafrost. Geophys. Res. Lett. 2019, 46, 1393–1401. [Google Scholar] [CrossRef]
Figure 1. Average daily air temperature and rainfall at the study site during the study period (from November to June); (a,b) indicate the emission sampling periods during the crop cycle. The arrows indicate the day on which the fertilization was performed.
Sustainability 12 07303 g001
Figure 2. Barley grain yield values for the control (Control), conventional fertilization (CF) and sensor-based N fertilization rate (RF) treatments. Different letters indicate statistical difference (p < 0.05) between the treatments according to the Tukey’s HSD test.
Sustainability 12 07303 g002
Figure 3. NDVI values of barley measured at different growth stages (BBCH scale) for control (Control), variable rate fertilization (RF) and conventional fertilization (CF) treatments. Error bars represent standard deviation of means. Different letters indicate significant difference (p < 0.05) between treatments according to the Kruskal–Wallis test, followed by the Dunn’s post hoc test.
Sustainability 12 07303 g003
Figure 4. The relationship between crop parameters measured at harvesting (total biomass, grain biomass and grain nitrogen concentration) and GreenSeeker (GS) values at the phenological stage, showing the highest determination coefficient.
Sustainability 12 07303 g004
Figure 5. Daily CO2 (on the top) and CH4 (on the bottom) emission values following the first (on the left) and the second (on the right) fertilization treatments. Control, CF and RF represent the daily emissions for the control, conventional fertilization and variable rate fertilization treatments. The error bar represents the daily standard deviation for each treatment. Different letters indicate significant difference, according to Dunn’s post-hoc test (p < 0.05), between different treatments in the same fertilizations.
Sustainability 12 07303 g005
Table 1. Main chemical and physical properties of soil. Nitrogen, organic matter and carbonates are reported as a percentage of the 2-mm sieved soil weight.
TreatmentsN ‰Organic Matter %Particle-Size Distribution (USDA)Bulk Density Mg m−3pHTotal CaCO3 %
Sand %Silt %Clay %
Control0.151.3613.1 ± 1.135.2 ± 0.251.7 ± 0.91.26 ± 0.147.8 ± 0.113.8 ± 0.2
RF0.171.53
CF0.151.37
Table 2. Average annual evaluation of partial economic benefit of barley managed with different nitrogen fertilization techniques. Different letters indicate statistical difference (p < 0.05) between the treatments according to the Tukey’s HSD test. The symbols *, ** and *** indicate that treatments differed significantly for p < 0.05, p < 0.01 and p < 0.001, respectively.
TreatmentsN Rate kg ha−1Environmental CostsFertilizer Cost € kg−1Sale Grain € ha−1Economic Profit € ha−1Environmental Profit € ha−1
Fertilizer Production € ha−1GHGs Release € ha−1
Control00 c217.11 b0 c582.74 b582.74 b365.63 a
RF75230 b233.52 ab81 b870.27 a789.50 a326.47 a
CF150459 a393.67 a162 a1073.79 a912.25 a59.58 b
ANOVA **************
Table 3. Determination coefficient between mass of dry matter of total biomass, mass of dry matter of grain, nitrogen content in the whole biomass and NDVI value calculated at different growth stages on barley. The symbols * and ** indicate significant levels for p < 0.05 and p < 0.01, respectively.
Phenological Stage (BBCH Scale)Mass of Dry Matter of Total Biomass kg ha−1Mass of Dry Matter of Grain kg ha−1Whole Plant Nitrogen Content %
230.230.230.08
300.74 **0.74 **0.41
320.79 **0.86 **0.45 *
390.84 **0.88 **0.54 *
510.8 **0.86 **0.64 **
550.81 **0.85 **0.52 *
750.71 **0.78 **0.48 *
850.44 *0.53 *0.26
900.160.210.07
Table 4. Average CO2 and CH4 emissions per day and number of days required to reach the zero-emission point following two fertilization treatments. The standard deviation is also reported. Gas emissions were measured for 18 days following each fertilization treatment. Values for control (Control), variable rate fertilization (RF) and conventional fertilization (CF) are reported. Different letters indicate significant difference (p < 0.05) between treatments according to the Kruskal–Wallis test, followed by Dunn’s post hoc test.
FertilizationTreatmentsDays CO2 EmissionAverage CO2 Emission kg C ha−1 day−1Days CH4 EmissionAverage CH4 Emission kg C ha−1 day−1
First fertilizationControl1823.17 ± 9.85 b180.084 ± 0.014 a
RF1837.36 ± 13.71 a180.116 ± 0.084 a
CF1842.22 ± 14.75 a180.146 ± 0.065 a
Second fertilizationControl15 ± 2.0556.22 ± 6.21 b11 ± 0.941.763 ± 0.450 a
RF11 ± 0.4760.57 ± 14.85 b3 ± 0.471.251 ± 0.453 a
CF13 ± 1.24114.98 ± 14.40 a5 ± 3.200.703 ± 0.198 b

