Batten Down the Hatches—Assessing the Status of Emergency Preparedness Planning in the German Water Supply Sector with Statistical and Expert-Based Weighting


Abstract
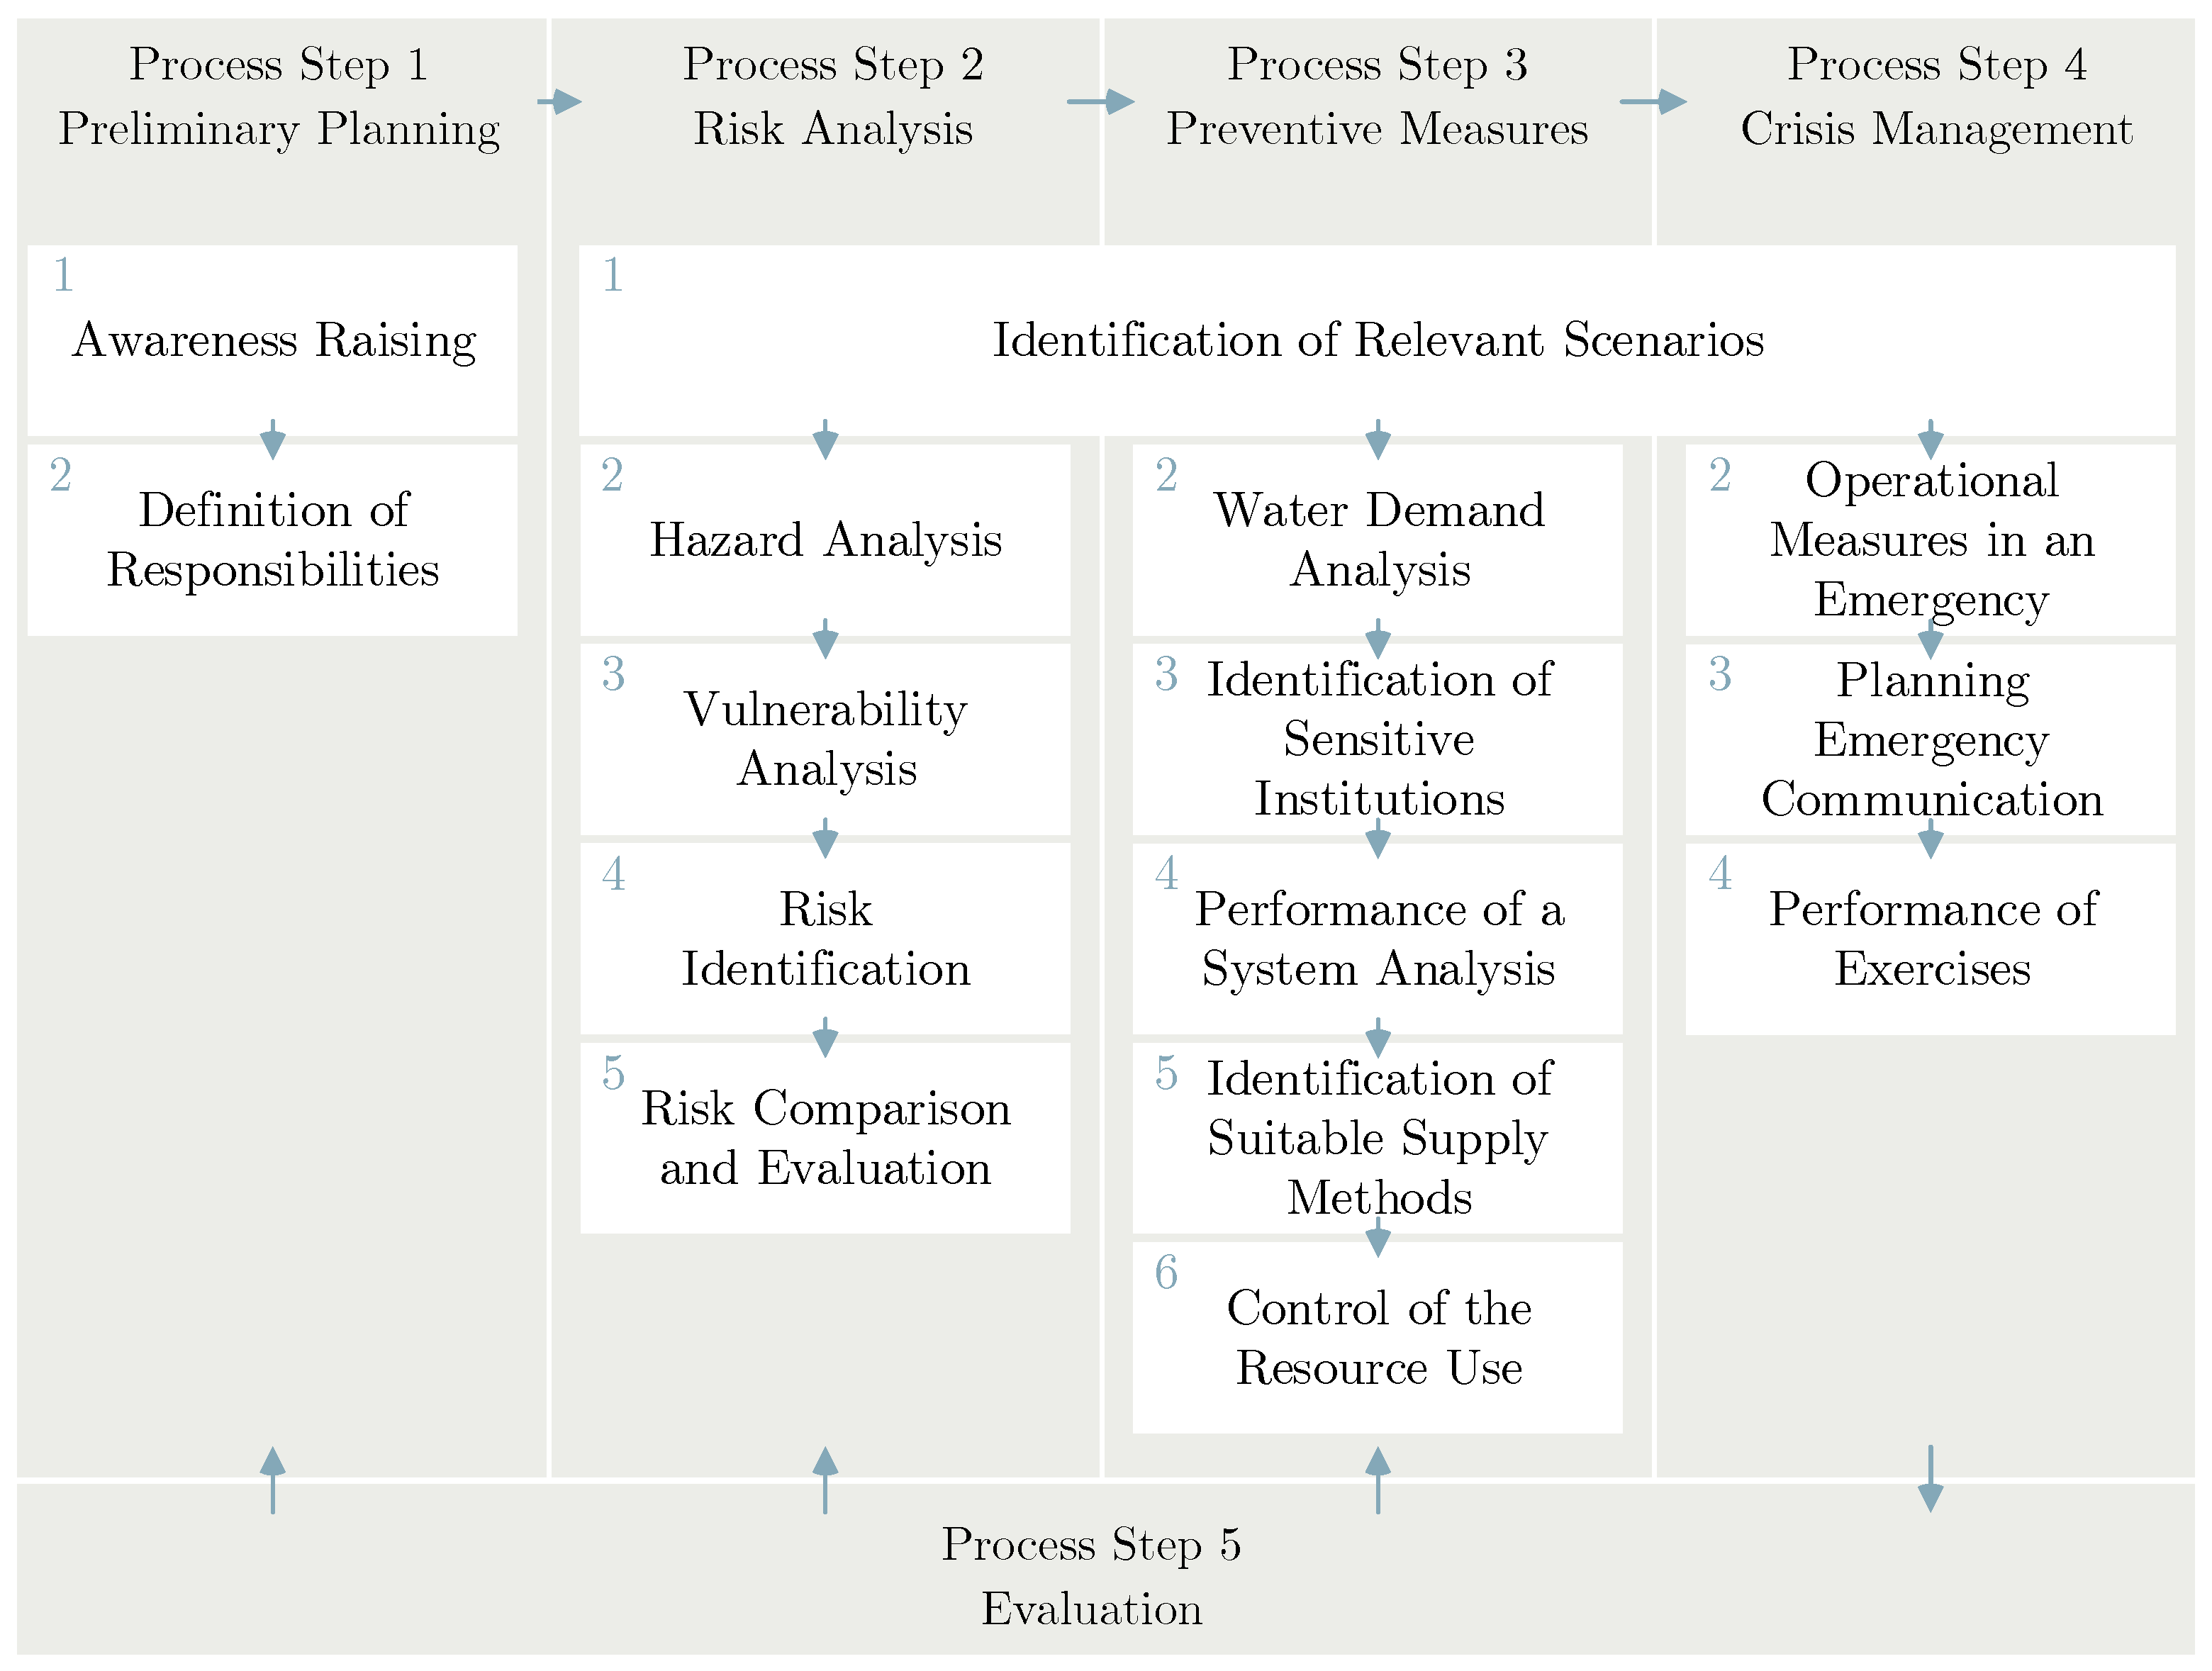
1. Introduction
2. Materials and Methods
2.1. Description of Approach for the Development of Composite Indicators
2.2. Data Acquisition and Selection
2.2.1. Case Study for Verification of Indicator
2.2.2. Germany-Representative Dataset
2.3. Imputation of Missing Data
2.4. Normalisation of Data
2.5. Weigthing and Aggregation
- Composite indicator
- m Number of main indicators
- weight of main indicator j
- normalized value of the main indicator (PP, RA, PM, CM and E)
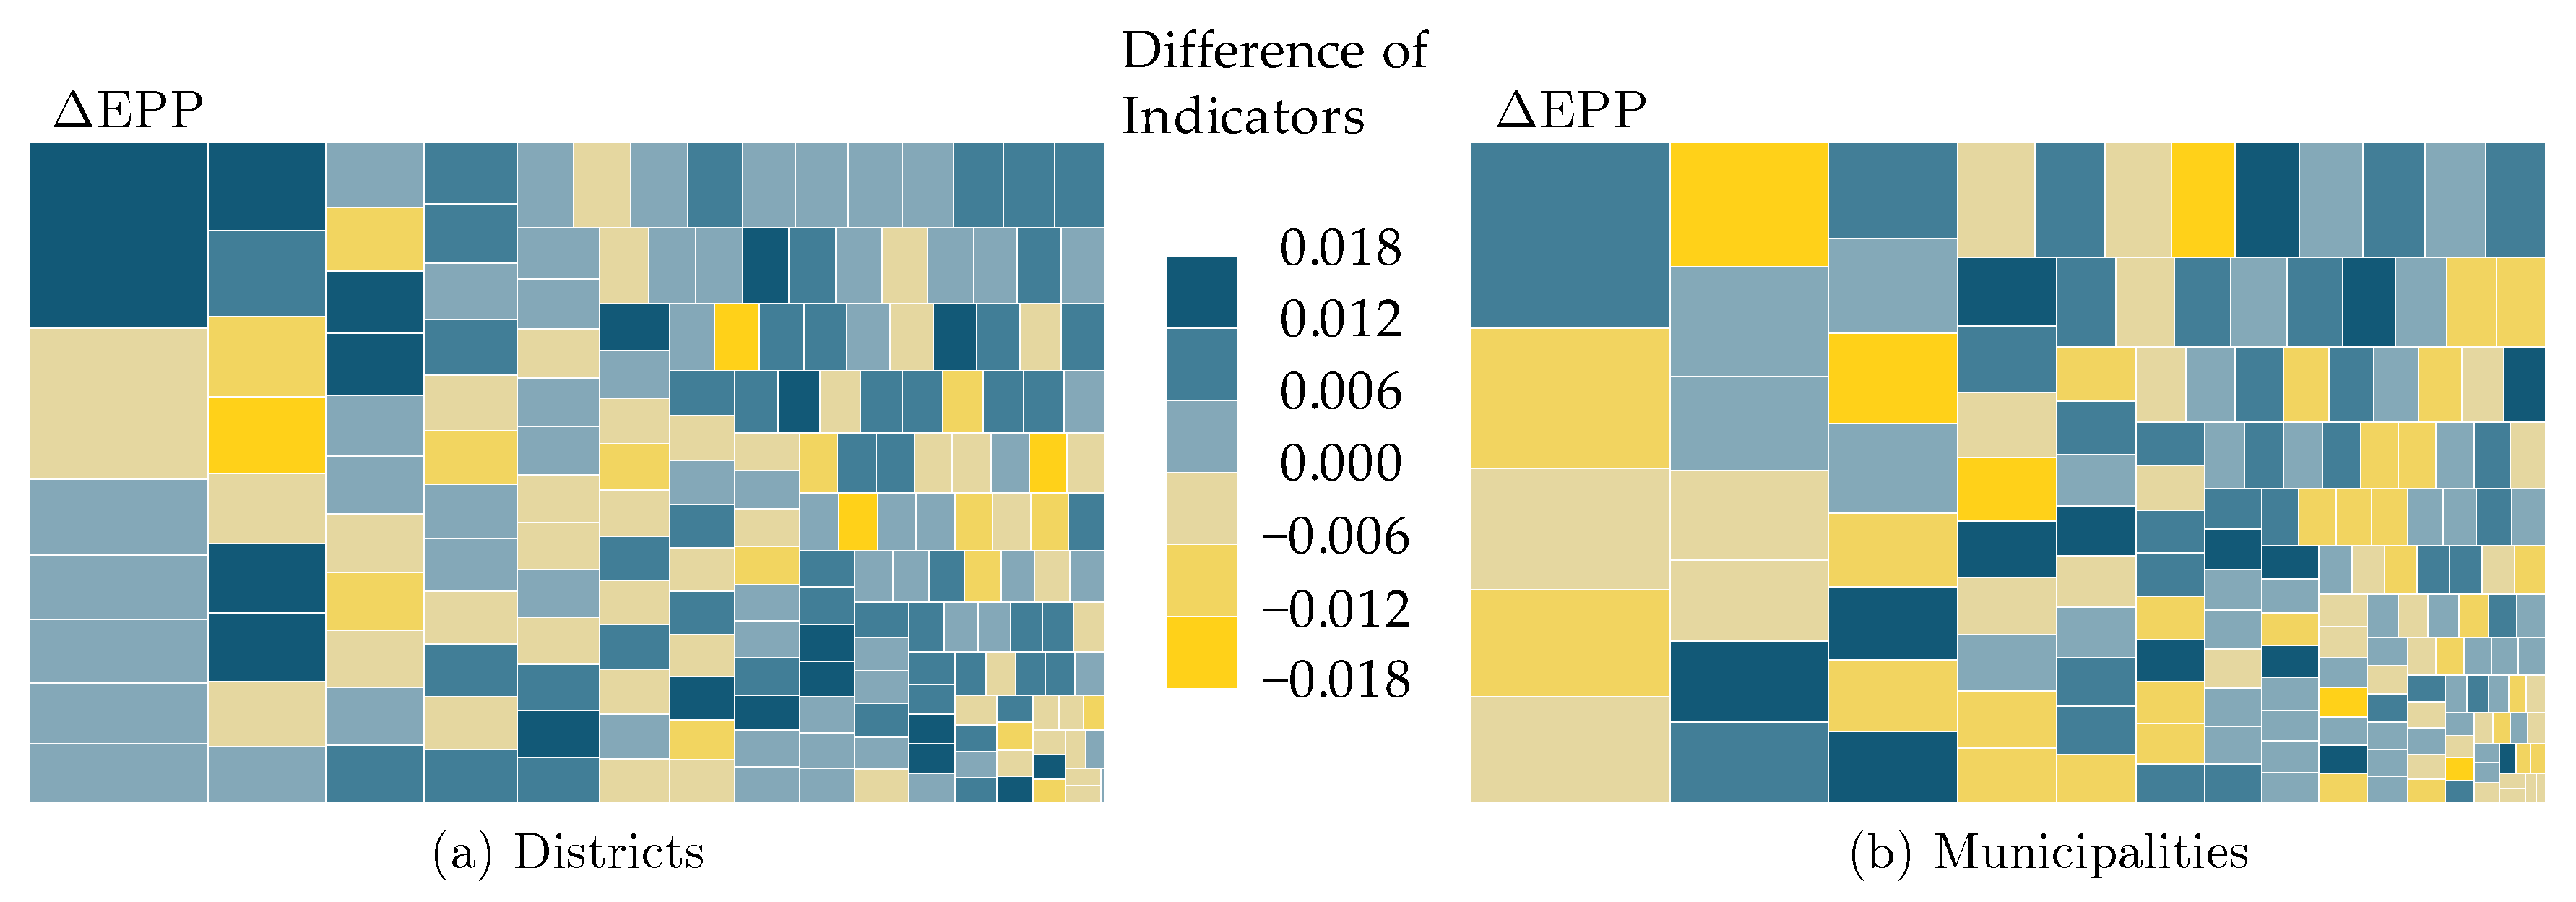
2.6. Visualisation
3. Results
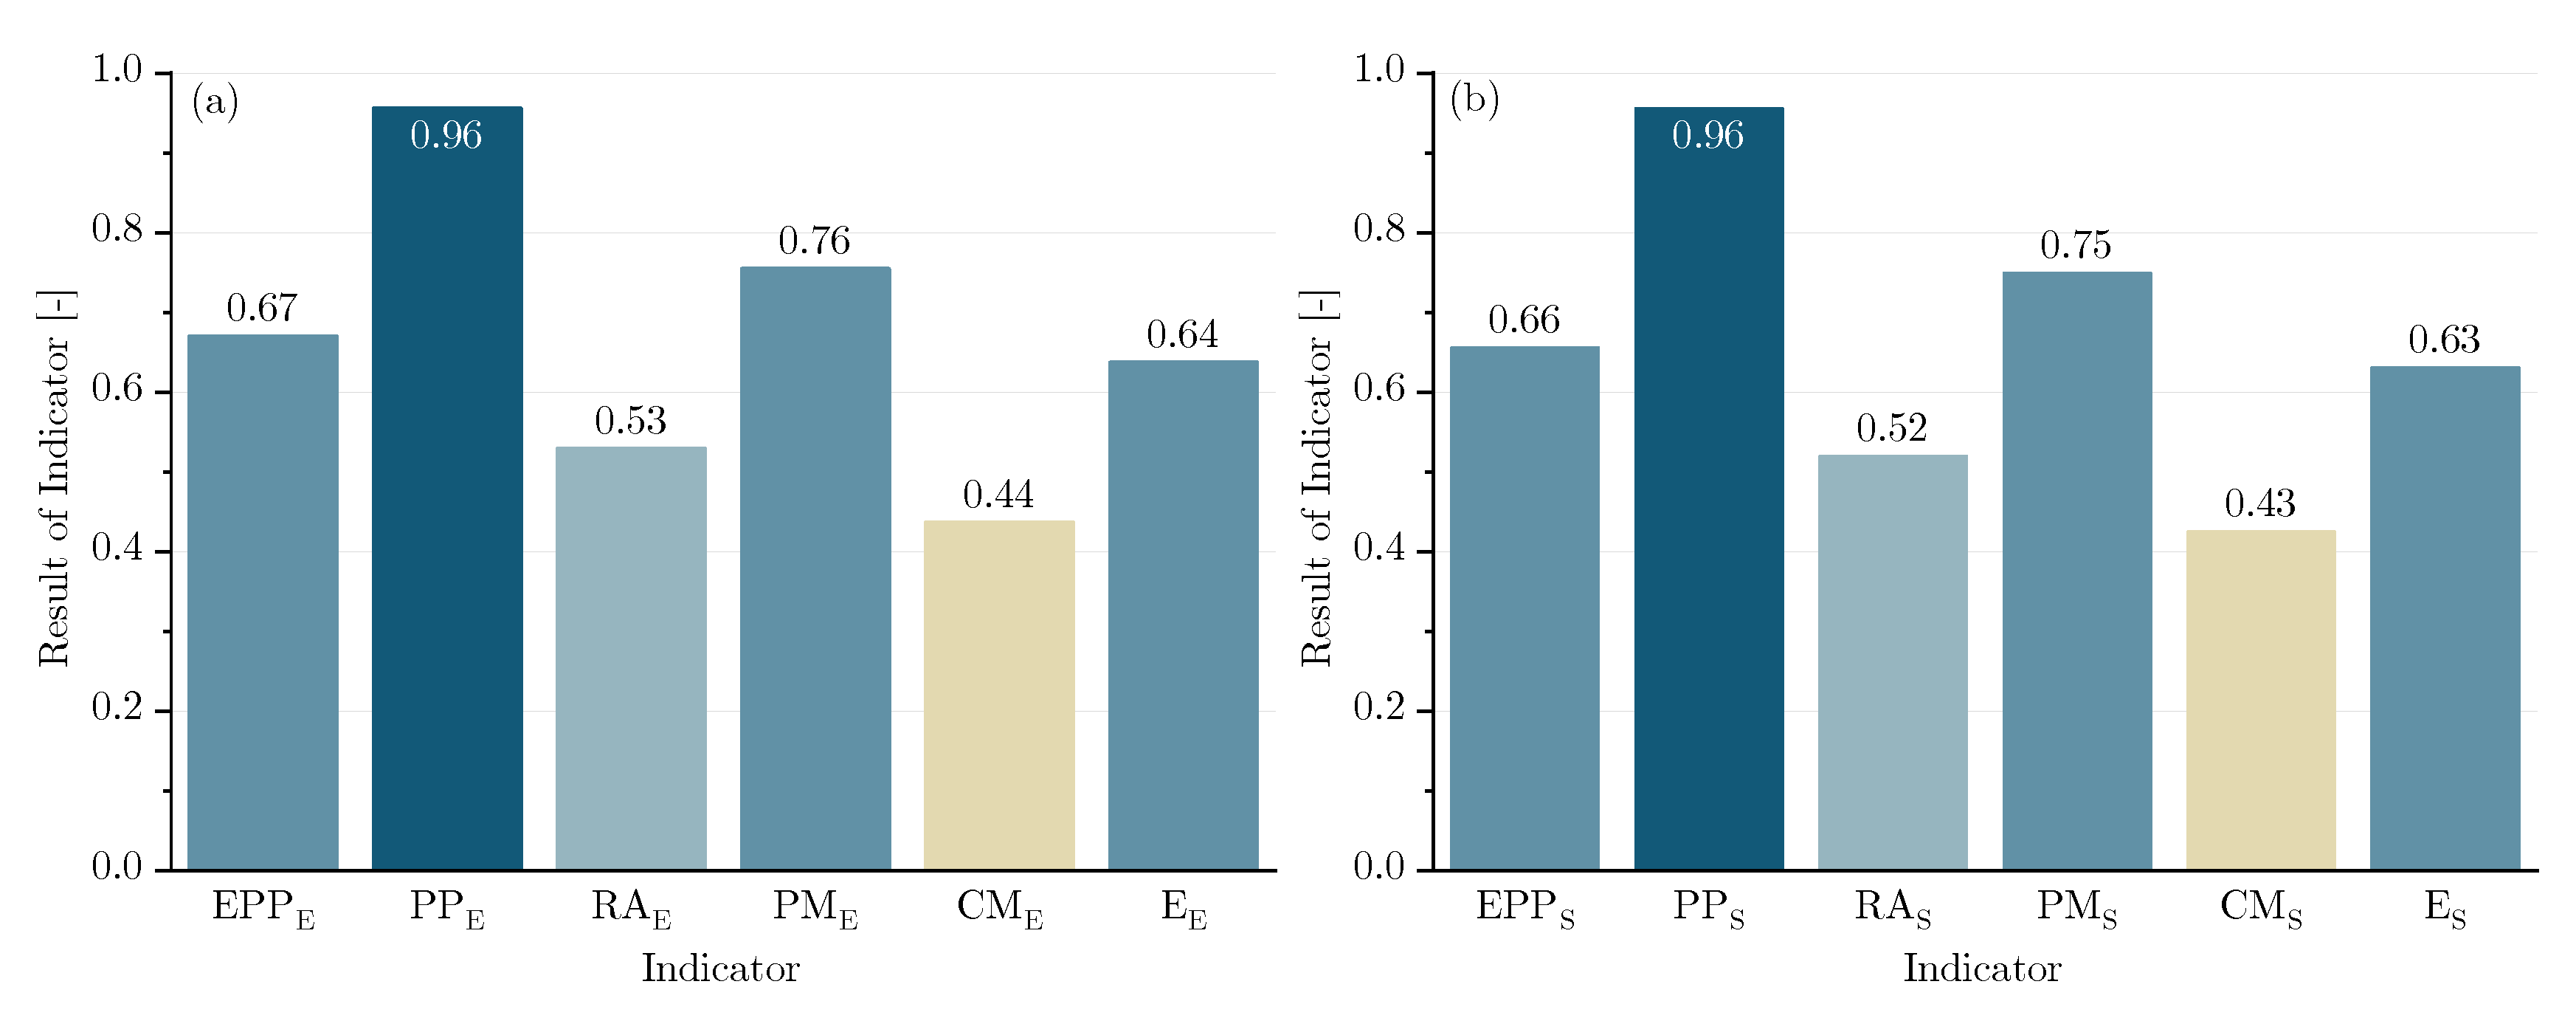
3.1. Determination of the Weighting of the Indicators
3.2. Assessment of the Applicability and Significance of the Emergency Preparedness Planning Indicator Based on the Case Study
3.3. Status of Emergency Preparedness Planning in Germany
Data Basis for the Analysis of the Status Quo of Emergency Preparedness Planning
3.4. Assessment of the Status of Emergency Preparedness Planning in Germany
4. Discussion
4.1. Discussion of the Applied Methods
4.2. Discussion of the Indicator and Assessment Results
5. Conclusions
Author Contributions
Funding
Acknowledgments
Conflicts of Interest
Abbreviations
| CM | Crisis Management |
| E | Evaluation |
| EPP | Emergency Preparedness Planning Indicator |
| EPPS | Emergency Preparedness Planning Indicator with statistical weights of main indicators |
| EPPE | Emergency Preparedness Planning Indicator with weights based on expert knowledge |
| PM | Preventive Measures |
| PP | Preliminary Planning |
| RA | Risk Analysis |
| E | Evaluation |
Appendix A

| ID | Question | Reply Options | Source | Individual Indicator |
|---|---|---|---|---|
| Main Indicator PP—Preliminary Planning | ||||
| Sub Indicator PP1—Awareness Raising | ||||
| 1 | Is it known how the supply zone is divided into municipalities or neighbourhoods? | Yes, partially, no | [14] | VP1,1 |
| 2 | Does the possible amount of water discharge correspond to the defined protection goals? | Yes, partially, no | [14] | VP1,2 |
| 3 | Is the technically maximum possible discharge quantity from the own extraction plant known? | Yes, partially, no | [14] | VP1,3 |
| 4 | Is the technically maximum possible water supply from other water utilities known? | Yes, partially, no | [14] | VP1,4 |
| 5 | Is the capacity of your own extraction plants known? | Yes, partially, no | [14] | VP1,5 |
| 6 | Is it known which part of the supply zone is supplied by which water extraction plant? | Yes, partially, no | [14] | VP1,6 |
| 7 | Is the following known for the individual tanks for water storage? | VP1,7 | ||
| 7.1 | Origin of water | Yes, partially, no | [14] | VP1,7,1 |
| 7.2 | Capacity of the storage tanks | Yes, partially, no | [14] | VP1,7,2 |
| 7.3 | max. possible feed-in quantity from the storage tanks into the grid | Yes, partially, no | [14] | VP1,7,3 |
| 8 | Is there an awareness in your community that there may be a quantitative impairment of the water supply? | Yes, partially, no | [14,21] | VP1,8 |
| 9 | Is there an awareness in your community that there may be a qualitative impairment of the water supply? | Yes, partially, no | [14,21] | VP1,9 |
| Sub Indicator PP2—Definition of Responsibilities | ||||
| 10 | Is it known who is the contact person for emergency situations in the water supply utility/ies? | Yes, partially, no | [12,14] | VP2,1 |
| 11 | Has a crisis task force been set up? | Yes, partially, no | [12,14] | VP2,2 |
| 12 | Is the organizational and operational structure defined? | Yes, partially, no | [12,14,44] | VP2,3 |
| ID | Question | Reply Options | Source | Individual Indicator |
|---|---|---|---|---|
| Main Indicator RA—Risk Analysis | ||||
| Sub Indicator RA1—Hazard Analysis | ||||
| 13 | Has a risk analysis been carried out? | Yes, partially, no | [14,17] | RA1,1 |
| 14 | Is there a list of which hazards have already been considered and which are not yet part of the risk analysis? | Yes, partially, no | [14] | RA1,1 |
| 15 | From the point of view of the water supply utility, do the following exceptional events represent relevant hazards for the water supply? | [14,24] | RA1,2 | |
| 15.1 | Natural hazards | Yes, partially, no | [14,24] | RA1,2,1 |
| 15.2 | Accidents (human failures) | Yes, partially, no | [14,24] | RA1,2,2 |
| 15.3 | Accidents (technical failures) | Yes, partially, no | [14,24] | RA1,2,3 |
| 15.4 | Terrorism | Yes, partially, no | [14,24] | RA1,2,4 |
| 16 | Does the hazard analysis include experiences from past events? | Yes, partially, no | [14] | RA1,3 |
| 17 | Have qualitative impairments of the water supply occurred in the past so that substitute supply measures were necessary? | Yes, partially, no | [12,22] | RA1,4 |
| 18 | Have quantitative impairments of the water supply occurred in the past so that substitute supply measures were necessary? | Yes, partially, no | [12,22] | RA1,5 |
| 19 | Does the hazard analysis include other potential hazards that have not yet occurred? | Yes, partially, no | [14,17] | RA1,6 |
| 20 | Have hazards been identified that need to be prioritised? | Yes, partially, no | [14,17] | RA1,7 |
| Sub Indicator RA2—Vulnerability Analysis | ||||
| 21 | Has a vulnerability analysis been conducted? | Yes, partially, no | [14,17] | RA2,1 |
| 22 | Was the vulnerability analysis carried out in cooperation with water supply utilities and disaster management? | Yes, partially, no | [12,14] | RA2,2 |
| 23 | Have scenarios been identified for the vulnerability analysis? | Yes, partially, no | [12,14] | RA2,3 |
| 24 | Are the components to be analysed specified? | Yes, partially, no | [14] | RA2,4 |
| 25 | Have you checked which components would be exposed to which hazards (exposure)? | Yes, partially, no | [14] | RA2,5 |
| 26 | Has the functionality of the components been checked? | Yes, partially, no | [14] | RA2,6 |
| 27 | Has the technical replaceability of the components been checked? | Yes, partially, no | [14] | RA2,7 |
| 28 | Has the organizational replaceability of the components been checked? | Yes, partially, no | [14] | RA2,8 |
| ID | Question | Reply Options | Source | Individual Indicator |
|---|---|---|---|---|
| Main Indicator RA—Risk Analysis | ||||
| Sub Indicator RA3—Risk Identification | ||||
| 29 | Was the risk assessment carried out with the involvement of specialist authorities or research institutions? | Yes, partially, no | [14] | RA3,1 |
| 30 | Has the extent of damage in the scenarios considered been determined? | Yes, partially, no | [14] | RA3,2 |
| 31 | Was the assessment of the extent of damage carried out with the involvement of those responsible for civil protection in the county/city? | Yes, partially, no | [14] | RA3,3 |
| 32 | Was the probability of occurrence determined in the scenarios considered? | Yes, partially, no | [14,21,45] | RA3,4 |
| 33 | Was the probability of occurrence carried out with the involvement of specialist authorities or research institutions? | Yes, partially, no | [16] | RA3,5 |
| 34 | Was the number of inhabitants affected in the scenarios considered determined? | Yes, partially, no | [14] | RA3,6 |
| 35 | Has the probability of occurrence and the extent of damage been classified on a scale (e.g., according to [14])? | Yes, partially, no | [14] | RA3,7 |
| Sub Indicator RA4—Risk Comparison and Evaluation | ||||
| 36 | Were the scenarios compared using a risk matrix? | Yes, partially, no | [14] | RA4,1 |
| 37 | Were the scenarios prioritized using a risk matrix? | Yes, partially, no | [14] | RA4,2 |
| ID | Question | Reply Options | Source | Individual Indicator |
|---|---|---|---|---|
| Main Indicator PM—Preventive Measures | ||||
| Sub Indicator PM1—Structural Redundancies | ||||
| 38 | Are the extraction plants designed redundantly? | Yes, partially, no | [14] | PM1,1 |
| 39 | Are the storage tanks designed redundantly? | Yes, partially, no | [17] | PM1,2 |
| 39.1 | quantitatively redundant? | Yes, partially, no | [14] | PM1,2,1 |
| 39.2 | structurally redundant? | Yes, partially, no | [14] | PM1,2,2 |
| Sub Indicator PM2—Interrelation of Supply | ||||
| 40 | Are there supply links with other water utilities? | Yes, partially, no | [14,26] | PM2,1 |
| Sub Indicator PM3—Grid Construction | ||||
| 41 | Are there supply links with other water utilities? | Yes, partially, no | [17,28] | PM3,1 |
| 42 | Have grid development measures, which are necessary to ensure security of supply, been implemented? | Yes, partially, no | [27] | PM3,2 |
| Sub Indicator PM4—Remote Monitoring, Control Systems | ||||
| 43 | Is the supply system connected to a remote monitoring system? | Yes, partially, no | [17,29,30] | PM4,1 |
| 44 | Is the supply system equipped with a state-of-the-art control system? | Yes, partially, no | [14] | PM4,2 |
| Sub Indicator PM5—General Measures | ||||
| 45 | Have renewal measures necessary to ensure security of supply been implemented? | Yes, partially, no | [17,32] | PM5,1 |
| 46 | Have maintenance measures necessary to ensure security of supply been implemented? | Yes, partially, no | [17,32] | PM5,2 |
| 47 | Have physical protection measures, which are necessary to ensure security of supply, been implemented? | Yes, partially, no | [14,31] | PM5,3 |
| ID | Question | Reply Options | Source | Individual Indicator |
|---|---|---|---|---|
| Main Indicator CM—Crisis Management | ||||
| Sub Indicator CM1—Organisation and Coordination | ||||
| 48 | Does the water utility develop contingency plans in addition to the action plans according to the Drinking Water Ordinance? | Yes, partially, no | [14,35] | CM1,1 |
| 49 | Are contingency plans for emergency situations in the water supply developed by the civil protection authority? | Yes, partially, no | [14,35] | CM1,2 |
| 50 | Are you familiar with the content of these plans? | Yes, partially, no | [14,34] | CM1,2 |
| 51 | Are the contact details of the following contact persons known? | Yes, partially, no | CM1,3 | |
| 51.1 | Water utility | Yes, no | [17,23] | CM1,3,1 |
| 51.2 | Emergency management / civil protection | Yes, no | [17,23] | CM1,3,2 |
| 51.3 | Principal administrator | Yes, no | [14] | CM1,3,3 |
| 51.4 | Fire department | Yes, no | [12] | CM1,3,4 |
| 51.5 | Federal Agency for Technical Relief | Yes, no | [12] | CM1,3,5 |
| 51.6 | Red Cross | Yes, no | [12] | CM1,3,6 |
| 51.7 | Civil-Military Cooperation | Yes, no | [12] | CM1,3,7 |
| 51.8 | National Command | Yes, no | [12] | CM1,3,8 |
| 51.9 | Other authorities (e.g., health, environment, police) | Yes, no | [12] | CM1,3,9 |
| 51.10 | Press | Yes, no | [12] | CM1,3,10 |
| 52 | Are sensitive facilities available in the supply area? | [14] | CM1,4 | |
| 52.1 | Hospital | Yes, no | CM1,4,1 | |
| 52.2 | Nursing home | Yes, no | CM1,4,2 | |
| 52.3 | Kindergarten/School | Yes, no | CM1,4,3 | |
| 52.4 | Dialysis centers | Yes, no | CM1,4,4 | |
| 53 | Are sensitive facilities in the supply area included? | [14] | CM1,5 | |
| 53.1 | Hospital | Yes, partially, no | CM1,5,1 | |
| 53.2 | Nursing home | Yes, partially, no | CM1,5,2 | |
| 53.3 | Kindergarten/School | Yes, partially, no | CM1,5,3 | |
| 53.4 | Dialysis centers | Yes, partially, no | CM1,5,4 | |
| 54 | Are the telephone number, location and capacity of the following facilities in the district/district free city recorded? | [12] | CM1,6 | |
| 54.1 | Brewery/beverage manufacturer | Yes, partially, no | CM1,6,1 | |
| 54.1.1 | telephone number | Yes, partially, no | CM1,6,1,1 | |
| 54.1.2 | location | Yes, partially, no | CM1,6,1,2 | |
| 54.1.3 | capacity | Yes, partially, no | CM1,6,1,3 | |
| 54.2 | Beverage suppliers (beverage market) | CM1,6,2 | ||
| 54.2.1 | telephone number | Yes, partially, no | CM1,6,2,1 | |
| 54.2.2 | location | Yes, partially, no | CM1,6,2,2 | |
| 54.2.3 | capacity | Yes, partially, no | CM1,6,2,3 | |
| 54.3 | Carriers | CM1,6,3 | ||
| 54.3.1 | telephone number | Yes, partially, no | CM1,6,3,1 | |
| 54.3.2 | location | Yes, partially, no | CM1,6,3,2 | |
| 54.3.3 | capacity | Yes, partially, no | CM1,6,3,3 | |
| 54.4 | Neighbouring Utilities | CM1,6,4 | ||
| 54.4.1 | telephone number | Yes, partially, no | CM1,6,4,1 | |
| 54.4.2 | location | Yes, partially, no | CM1,6,4,2 | |
| 54.4.3 | capacity | Yes, partially, no | CM1,6,4,3 | |
| ID | Question | Reply Options | Source | Individual Indicator |
|---|---|---|---|---|
| Main Indicator CM—Crisis Management | ||||
| Sub Indicator CM2—Provision of Resources | ||||
| 55 | Are the resources required for the substitute water supply (mobile treatment plants, mobile pipelines, transport vehicles) kept available or is access to them ensured? | Yes, partially, no | [14] | CM2,1 |
| 56 | Are the materials required for the substitute water supply (pressure increasing systems, hose connections, etc.) kept in stock or is access ensured? | Yes, partially, no | [14] | CM2,2 |
| Sub Indicator CM3—Exercises | ||||
| 57 | Was the interaction with the authorities and organisations involved in the event of a crisis in the water supply discussed? | Yes, partially, no | [14,17,23] | CM3,1 |
| 58 | Has the interaction with the authorities and organisations involved been practised for crisis situations in the water supply? | Yes, partially, no | [14,17,23] | CM3,2 |
| Sub Indicator CM4—Communication | ||||
| 59 | Is access to communication media ensured in the event of a crisis? | Yes, partially, no | [14,17,36] | CM4,1 |
| ID | Question | Reply Options | Source | Individual Indicator |
|---|---|---|---|---|
| Main Indicator E—Evaluation | ||||
| Sub Indicator E1—Evaluation Preliminary Planning | ||||
| 60 | Are the awareness raising aspects regularly evaluated? | Yes, partially, no | [14,17] | E1,1 |
| 61 | Are the definitions of responsibilities regularly evaluated? | Yes, partially, no | [14,17] | E1,2 |
| Sub Indicator E2—Evaluation Risk Analysis | ||||
| 62 | Is the hazard analysis regularly evaluated? | Yes, partially, no | [14,17] | E2,1 |
| 63 | Is the vulnerability analysis regularly evaluated? | Yes, partially, no | [14,17] | E2,2 |
| 64 | Is the risk identification regularly evaluated? | Yes, partially, no | [14,17] | E2,3 |
| 65 | Are the risk comparison and evaluation regularly evaluated? | Yes, partially, no | [14,17] | E2,4 |
| Sub Indicator E3—Evaluation Preventive Measures | ||||
| 66 | Are the structural redundancies regularly evaluated? | Yes, partially, no | [14,17] | E3,1 |
| 67 | Are the interrelations of supply regularly evaluated? | Yes, partially, no | [14,17] | E3,2 |
| 68 | Are the grid construction measures regularly evaluated? | Yes, partially, no | [14,17] | E3,3 |
| 69 | Are the remote monitoring and control systems regularly evaluated? | Yes, partially, no | [14,17] | E3,4 |
| 70 | Are the general measures regularly evaluated? | Yes, partially, no | [14,17] | E3,5 |
| Sub Indicator E4—Evaluation Crisis Management | ||||
| 71 | Are the organisation and coordination measures regularly evaluated? | Yes, partially, no | [14,17] | E4,1 |
| 72 | Is the provision of resources regularly evaluated? | Yes, partially, no | [14,17] | E4,2 |
| 73 | Are the exercised regularly evaluated? | Yes, partially, no | [14,17] | E4,3 |
| 74 | Are the communication measures regularly evaluated? | Yes, partially, no | [14,17] | E4,4 |
References
- Sowby, R.B. Emergency preparedness after COVID-19: A review of policy statements for the U.S. water sector. Util. Policy 2020, 64, 101058. [Google Scholar] [CrossRef] [PubMed]
- Haakh, F.; Merkel, W. Die Wasserversorgung im COVID-19 Krisenmanagement: Systemanalyse und Szenarienplanung. Energie Wasser-Praxis 2020, 71, 34–41. [Google Scholar]
- Mays, L.W. Water Supply Systems Security; McGraw-Hill Professional Engineering Civil Engineering; McGraw-Hill: New York, NY, USA, 2004. [Google Scholar]
- States, S. Security and Emergency Planning for Water and Wastewater Utilities; American Water Works Association: Denver, CO, USA, 2010. [Google Scholar]
- Gopalakrishnan, K.; Peeta, S. Sustainable and Resilient Critical Infrastructure Systems: Simulation, Modeling, and Intelligent Engineering; Springer: Berlin/Heidelberg, Germany, 2010. [Google Scholar] [CrossRef]
- Grigg, N.S. Water Utility Security: Multiple Hazards and Multiple Barriers. J. Infrastruct. Syst. 2003, 9, 81–88. [Google Scholar] [CrossRef]
- Spellman, F.R. Water Infrastructure Protection and Homeland Security; Government Institutes: Lanham, MD, USA, 2007.
- Mendonça, D.; Wallace, W.A. Impacts of the 2001 World Trade Center Attack on New York City Critical Infrastructures. J. Infrastruct. Syst. 2006, 12, 260–270. [Google Scholar] [CrossRef]
- Mendonça, D.; Wallace, W.A. Adaptive Capacity: Electric Power Restoration in New York City following the 11 September 2001 Attacks. In Proceedings of the 2nd Symposium on Resilience Engineering, Juan-les-Pins, France, 8–10 November 2006. [Google Scholar]
- Nelson, D.R.; Adger, W.N.; Brown, K. Adaptation to Environmental Change: Contributions of a Resilience Framework. Annu. Rev. Environ. Resour. 2007, 32, 395–419. [Google Scholar] [CrossRef]
- World Health Organization. Environmental Health in Emergencies and Disasters: A Practical Guide; World Health Organization: Geneva, Switzerland, 2002. [Google Scholar]
- Bross, L.; Wienand, I.; Krause, S. Sicherheit der Trinkwasserversorgung: Teil 2: Notfallvorsorgeplanung; Praxis im Bevölkerungsschutz; Bundesamt für Bevölkerungsschutz und Katastrophenhilfe: Bonn, Germany, 2019; Volume 15. [Google Scholar]
- Bundesministerium des Innern, für Bau und Heimat. Schutz Kritischer Infrastrukturen—Risiko- und Krisenmanagement · Leitfaden für Unternehmen und Behörden; Bundesministerium des Innern, für Bau und Heimat: Bonn, Germany, 2011. [Google Scholar]
- Wienand, I.; Hasch, M. Sicherheit der Trinkwasserversorgung: Teil 1: Risikoanalyse; Praxis im Bevölkerungsschutz; Bundesamt für Bevölkerungsschutz und Katastrophenhilfe: Bonn, Germany, 2016; Volume 15. [Google Scholar]
- Bundesamt für Bevölkerungsschutz und Katastrophenhilfe. Schutz Kritischer Infrastruktur: Risikomanagement im Krankenhaus; Praxis im Bevölkerungsschutz; Bundesamt für Bevölkerungsschutz und Katastrophenhilfe: Bonn, Germany, 2008; Volume 2. [Google Scholar]
- Bundesamt für Bevölkerungsschutz und Katastrophenhilfe. Risikoanalyse im Bevölkerungsschutz: Ein Stresstest für die Allgemeine Gefahrenabwehr und den Katastrophenschutz; Bundesamt für Bevölkerungsschutz und Katastrophenhilfe: Bonn, Germany, 2015. [Google Scholar]
- AWWA. M19 Emergency Planning for Water and Wastewater Utilities, 5th ed.; American Water Works Association: Denver, CO, USA, 2018. [Google Scholar]
- Organisation for Economic Co-operation and Development. Handbook on Constructing Composite Indicators: Methodology and User Guide; Organisation for Economic Co-operation and Development: Paris, France, 2008. [Google Scholar]
- Bollin, C.; Hidajat, R. Community-Basded Risk Index: Pilot Implementation in Indonesia. In Measuring Vulnerability to Natural Hazards. Towards Disaster Resilient Societies; Birkmann, J., Ed.; United Nations University Press: Tokyo, Japan; New York, NY, USA, 2006; pp. 271–289. [Google Scholar]
- Joerin, J.; Shaw, R.; Takeuchi, Y.; Krishnamurthy, R. The adoption of a climate disaster resilience index in Chennai, India. Disasters 2014, 38, 540–561. [Google Scholar] [CrossRef] [PubMed]
- DIN EN 15975-2. Sicherheit der Trinkwasserversorgung—Leitlinien für das Risiko- und Krisenmanagement—Teil 2: Risikomanagement; Springer Vieweg: Berlin/Heidelberg, Germany, 2013. [Google Scholar]
- Bross, L.; Krause, S.; Wannewitz, M.; Stock, E.; Sandholz, S.; Wienand, I. Insecure Security: Emergency Water Supply and Minimum Standards in Countries with a High Supply Reliability. Water 2019, 11, 732. [Google Scholar] [CrossRef]
- AWWA. G440 Emergency Preparedness Practices; AWWA: Singapore, 2017. [Google Scholar]
- AWWA. J100 Risk and Resilience Management of Water and Wastewater Systems; AWWA: Singapore, 2010. [Google Scholar]
- DIN ISO 31000. Risikomanagement; Walter de Gruyter GmbH & Co KG: Berlin, Germany, 2018. [Google Scholar]
- Boyle, D.B. Interagency Connections: Insurance Against Interruptions in Supply. J. Am. Water Works Assoc. 1980, 72, 192–195. [Google Scholar] [CrossRef]
- Hoch, W. Planungsgrundsätze für das Bemessen von Wasserverteilungsnetzen unter Berücksichtigung der Löschwasserversorgung. In Wassertransport und -Verteilung; Sattler, R., Hirner, W., Eds.; DVGW Lehr- und Handbuch Wasserversorgung, Oldenbourg: München, Germany, 1999; pp. 85–123. [Google Scholar]
- Baur, A.; Fritsch, P.; Hoch, W.; Merkl, G.; Rautenberg, J.; Weiß, M.; Wricke, B. Mutschmann/Stimmelmayr Taschenbuch der Wasserversorgung, 17th ed.; Springer Vieweg: Wiesbaden, Germany, 2019. [Google Scholar] [CrossRef]
- Mehlhorn, H.; Weiß, M. Fernleitungssysteme. In Wassertransport und -Verteilung; Sattler, R., Hirner, W., Eds.; DVGW Lehr- und Handbuch Wasserversorgung, Oldenbourg: München, Germany, 1999; pp. 123–169. [Google Scholar]
- Grombach, P.; Haberer, K.; Merkl, G. Handbuch der Wasserversorgungstechnik, 3rd ed.; Oldenbourg-Industrieverlag: München, Germany, 2000. [Google Scholar]
- DVGW W 1050. Objektschutz von Wasserversorgungsanlagen. 2012. Available online: http://www.dwa.de/dwa/sitemapping.nsf/literaturvorschau?openform&bestandsnr=57260 (accessed on 1 September 2020).
- Schlicht, H. Instandhaltung von Wasserverteilungsnetzen. In Wassertransport und -Verteilung; Sattler, R., Hirner, W., Eds.; DVGW Lehr- und Handbuch Wasserversorgung, Oldenbourg: München, Germany, 1999; pp. 373–403. [Google Scholar]
- Morley, K.; Riordan, R. Utilities Helping Utilities: An Action Plan for Mutial Aid and Assistance Networks for Water and Wastewater Utilities; American Water Works Association: Singapore, 2006. [Google Scholar]
- Doe, S.R.K.; Whitman, B.E. Security and Emergency Management for Water Systems, 1st ed.; Bentley Institute Press: Exton, PA, USA, 2011. [Google Scholar]
- DVGW W 1020. Empfehlungen und Hinweise für den Fall von Abweichungen von Anforderungen der Trinkwasserverordnung; Maßnahmeplan und Handlungsplan. 2018. Available online: https://shop.wvgw.de/var/assets/leseprobe//510186_lp_W%201020_2018_03.pdf (accessed on 1 September 2020).
- United States Environmental Protection Agency. Effective Risk and Crisis Communication during Water Security Emergencies: Summary Report of EPA Sponsored Message Mapping Workshops; United States Environmental Protection Agency: Washington, DC, USA, 2007.
- Bundesministerium des Innern, für Bau und Heimat. Leitfaden Krisenkommunikation, 5th ed.; Bundesministerium des Innern, für Bau und Heimat: Bonn, Germany, 2014. [Google Scholar]
- AWWA. G430 Security Practices for Operation and Management; AWWA: Singapore, 2015. [Google Scholar]
- Asadzadeh, A.; Kötter, T.; Salehi, P.; Birkmann, J. Operationalizing a concept: The systematic review of composite indicator building for measuring community disaster resilience. Int. J. Disaster Risk Reduct. 2017, 25, 147–162. [Google Scholar] [CrossRef]
- Islam, M.S.; Swapan, M.S.H.; Haque, S.M. Disaster risk index: How far should it take account of local attributes? Int. J. Disaster Risk Reduct. 2013, 3, 76–87. [Google Scholar] [CrossRef]
- Lazarus, N.W. Coping capacities and rural livelihoods: Challenges to community risk management in Southern Sri Lanka. Appl. Geogr. 2011, 31, 20–34. [Google Scholar] [CrossRef]
- Beccari, B. A Comparative Analysis of Disaster Risk, Vulnerability and Resilience Composite Indicators. PLoS Curr. 2016, 8. [Google Scholar] [CrossRef] [PubMed]
- Balica, S. Approaches of understanding developments of vulnerability indices for natural disasters. J. Environ. Eng. 2012, 11, 963–974. [Google Scholar] [CrossRef]
- DIN EN 15975-1. Sicherheit der Trinkwasserversorgung—Leitlinien für das Risiko- und Krisenmanagement—Teil 1: Krisenmanagement. 2016. Available online: https://www.boutique.afnor.org/standard/din-en-15975-1/security-of-drinking-water-supply-guidelines-for-risk-and-crisis-management-part-1-crisis-management-german-version-en-15975-120/article/852388/eu139819 (accessed on 1 September 2020).
- AWWA. Planning for an Emergency Drinking Water Supply; U.S. Environmental Protection Agency’s National Homeland Security Research Center: Manila, Philippines, 2011.


| Main Indicator | Sub Indicator | Individual Indicator | Source | In NoWa I Dataset | ||
|---|---|---|---|---|---|---|
| PP | Preliminary Planning | PP1 | awareness raising | PP1,1 to PP1,9 | [12,14,21,22] | Yes |
| PP2 | definition of responsibilities | PP2,1 to PP2,3 | [14,21,23] | No | ||
| RA | Risk Analysis | RA1 | hazard analysis | RA1,1 to RA1,8 | [14,17,24] | Yes |
| RA2 | vulnerability analysis | RA2,1 to RA2,8 | [14,17] | No | ||
| RA3 | risk identification | RA3,1 to RA3,7 | [14,16,17,25] | Yes | ||
| RA4 | risk comparison and assessment | RA4,1 to RA4,2 | [14] | No | ||
| PM | Preventive Measures | PM1 | structural redundancies | PM1,1 to PM1,2 | [14,17] | Yes |
| PM2 | interrelation of supply | PM2,1 | [14,17,26] | Yes | ||
| PM3 | grid construction | PM3,1 to PM3,2 | [17,27,28] | No | ||
| PM4 | remote monitoring, control systems | PM4,1 to PM4,2 | [14,17,29,30] | No | ||
| PM5 | general measures | PM5,1 to PM5,3 | [17,31,32] | Yes | ||
| CM | Crisis Management | CM1 | organisation and coordination | CM1,1 to CM1,7 | [12,14,17,23,33,34,35] | Yes |
| CM2 | provision of resources | CM2,1 to CM2,2 | [12,14] | Yes | ||
| CM3 | exercises | CM3,1 to CM3,2 | [12,14,17,23] | Yes | ||
| CM4 | communication | CM4,1 | [14,17,36,37] | Yes | ||
| E | Evaluation | E1 | evaluation preliminary planning | E1,1 to E1,2 | [14,17] | No |
| E2 | evaluation risk analysis | E2,1 to E2,4 | [14,17,38] | Yes | ||
| E3 | evaluation preventive measures | E3,1 to E3,5 | [14] | No | ||
| E4 | evaluation crisis management | E4,1 to E4,4 | [14,17,23,36] | Yes | ||
| Inhabitants | Proportion of Survey Forms | |||||
|---|---|---|---|---|---|---|
| Water Utility | Administration | Civil Protection | Health Department | Multiple Senders | Line Sum | |
| Municipalities (n = 166) | ||||||
| to 3.000 | 7% | 20% | 0% | 0% | 0% | 27% |
| 3.001 to 5.000 | 4% | 16% | 0% | 0% | 0% | 20% |
| 5.001 to 10.000 | 11% | 14% | 0% | 0% | 0% | 25% |
| more than 10.000 | 19% | 3% | 0% | 3% | 3% | 28% |
| Column Sum | 41% | 53% | 3% | 0% | 3% | 100% |
| Districs (n = 194) | ||||||
| to 100.000 | 0% | 6% | 10% | 3% | 4% | 23% |
| 100.001 to 150.000 | 0% | 7% | 12% | 4% | 2% | 25% |
| 150.001 to 250.000 | 2% | 5% | 18% | 1% | 4% | 30% |
| more than 250.000 | 2% | 1% | 11% | 6% | 2% | 22% |
| Column Sum | 4% | 19% | 51% | 14% | 12% | 100% |
| Indicator | Mean Value of Indicator (Standard Derivation) | ||
|---|---|---|---|
| Districs and Municipalities | |||
| EPP | EPPE | 0.42 (SD = 0.17) | 0.32 (SD = 0.18) |
| EPPS | 0.42 (SD = 0.16) | 0.32 (SD = 0.18) | |
| Main Indicator | PP | 0.43 (SD = 0.25) | 0.30 (SD = 0.27) |
| RA | 0.16 (SD = 0.32) | 0.14 (SD = 0.29) | |
| PM | 0.57 (SD = 0.31) | 0.39 (SD = 0.38) | |
| CM | 0.55 (SD = 0.32) | 0.43 (SD = 0.22) | |
| E | 0.38 (SD = 0.22) | 0.31 (SD = 0.25) | |
© 2020 by the authors. Licensee MDPI, Basel, Switzerland. This article is an open access article distributed under the terms and conditions of the Creative Commons Attribution (CC BY) license (http://creativecommons.org/licenses/by/4.0/).
Share and Cite
Bross, L.; Wienand, I.; Krause, S. Batten Down the Hatches—Assessing the Status of Emergency Preparedness Planning in the German Water Supply Sector with Statistical and Expert-Based Weighting. Sustainability 2020, 12, 7177. https://doi.org/10.3390/su12177177
Bross L, Wienand I, Krause S. Batten Down the Hatches—Assessing the Status of Emergency Preparedness Planning in the German Water Supply Sector with Statistical and Expert-Based Weighting. Sustainability. 2020; 12(17):7177. https://doi.org/10.3390/su12177177
Chicago/Turabian StyleBross, Lisa, Ina Wienand, and Steffen Krause. 2020. "Batten Down the Hatches—Assessing the Status of Emergency Preparedness Planning in the German Water Supply Sector with Statistical and Expert-Based Weighting" Sustainability 12, no. 17: 7177. https://doi.org/10.3390/su12177177
APA StyleBross, L., Wienand, I., & Krause, S. (2020). Batten Down the Hatches—Assessing the Status of Emergency Preparedness Planning in the German Water Supply Sector with Statistical and Expert-Based Weighting. Sustainability, 12(17), 7177. https://doi.org/10.3390/su12177177