Abstract
Points of interest (POIs)—areas with a concentration of places that attract people—are important urban planning and tourism policy targets. This study aims to determine the points of interest of urban residents by analyzing big data from search engines to reveal the physical characteristics of POIs. To achieve this, POI data were collected in three city centers in Seoul using a South Korean dominant portal site that includes a search engine. The most popular POIs were determined by using GIS search engine analysis frequency, and correlation and regression analyses were conducted to investigate the relation between POIs and urban elements. The results revealed different POI trends in each city center. While POIs were concentrated in old, narrow streets with small attractions and mixed-use construction near Seoul City Wall (historic downtown district), they also formed around notable architectural landmarks in the newly developed Yeouido and Yeongdeungpo areas. This study found that tourism attraction took different forms in old and new areas, demonstrating that citizens are interested in both historic downtown areas and new areas, as traditional urban theorists suggest. Thus, urban planners and tourism policy makers should consider specific spatial contexts with search engines.
1. Introduction
Points of interest (POIs) are regions of influence where citizens concentrate because of attractions or facilities that draw high numbers of people [1,2,3,4]. They are characterized by a concentration of facilities, a repetition of various activities, and high traffic volume. Accordingly, POIs are considered places where the energy of a city is focused, and understanding the form and size of POIs provides insights into how people experience cities. This then facilitates the selection of target points for public transit, urban development, and urban beautification, particularly in the context of urban planning with limited resources [2,5,6,7,8,9,10,11,12,13,14,15].
However, citizens experience POIs differently depending on the form and spatial structures of the city. Some people are attracted to separate, older structures and facilities [16,17,18], while other people find landmarks—including roads and skyscrapers—more attractive [19,20,21,22,23,24]. Therefore, despite similar socioeconomic conditions, POIs manifest differently in each urban area. This research seeks to understand the causal relationship between POIs and their physical spatial aspects. To achieve this, the research focuses on POIs within cities; more specifically, on urban spatial factors in regions with strongly formed POIs. In doing so, a framework of spatial interpretation for regions with well-developed POIs was constructed, thereby illuminating how people experience cities.
POIs were identified in this research by analyzing the density of points revealed by specific keyword searches via online map services. The coordinates supplied by online map services are produced by automated search logics based on users’ search intentions, correspondence with search keywords, level of usage (i.e., frequency of performed searches), use duration, and detailed information (i.e., information about the area, posts, receipts, and photo reviews). These characteristics are indicative of people’s interest in an area. As such, the search coordinates produced by online maps services were used as a means of securing more samples to estimate POIs. This method incurs significantly lower economic, social, and physical costs. Therefore, by using big data produced by the search coordinates within online map services, this study expands POI estimation methodologies.
Recently developed big data analysis technology helps citizens locate their favorite POI. In particular, the functionality of being able to determine the location of urban spaces that are frequently searched on search engines is useful for monitoring commercial areas [25,26]. In line with these research trends, this study utilized data from search engines to determine the interest of urban citizens in the three urban, commercial centers of Seoul. POIs are typically identified by landmarks or activities, including places of residence, work, commute, shopping, dining, and leisure. This research aimed to identify POIs related to daily life rather than tourism and is thus more interested in regular, urban activities [2,6,27]. The specific target area of the study is limited to the three city centers (one traditional and old center, and two newly formed centers) set out in the 2030 Seoul Development Plan: Seoul City Wall, Yeouido and Yeongdeungpo, and Gangnam (Seoul Metropolitan Government) [28]. The three centers are representative of city centers within Seoul, a metropolis of 10 million people. In terms of the spatial area, the focus was on the commercial zones formed around the major subway stations within each region. These centers have been formed at different times and in different ways, resulting in a clearly defined urban structure appropriate for a comparative analysis.
Despite the recent increase in academic interest in POIs, its research through search engine data crawling has not been conducted in the context of Seoul, the largest city and capital of Korea. In addition, this study made a methodologically meaningful proposal in terms of the use of search engine Open API data, used by many citizens. These research methods will improve the accuracy of urban research by enriching it with big data, SNS, and social media data in the future. This marks the significance and novelty of this study. More importantly, such endeavors to figure out research problems and questions from the perspective of urban space management will contribute to offering an empirically evident basis on sustainable development including tourism and hospitality industries. The remainder of this research paper is organized as follows. The second section reviews the relevant literature and introduces the study method. The third section describes how online map services were used to extract and identify the POIs of each city center. To achieve this, this study used Naver (search engine) Open API to secure the coordinates exposed within online map services, which were then converted into analyzable coordinates using geocoding. The fourth section describes how ArcGIS was used to conduct a density analysis of the converted coordinates, thereby estimating the intensity of each POI. It provides details of the correlation and regression analyses of the spatial factors used to categorize POI intensities on a scale ranging from 1 to 10 (a range capable of providing a comparison of the differences in each urban space) and derive the influential factors. Finally, based on the analysis results, this study examines and interprets the derived POIs.
2. Research Framework
2.1. Literature Review
Points of interest refer to specific areas that attract people. In the urban context, POIs tend to form around main commercial points or landmarks [2]. As noted, POIs are often destinations that signify regions with high volumes of traffic and consumption [2]. Additionally, the distribution of POIs can influence visitor behavior, the formation of commercial markets and major transport hubs (railway and subway stations), the topography, and commercial use of the city, which are important factors for urban analyses [29]. A growing number of studies have explored the relationship among POIs and search engines, social networks, map visualizations, and matching services [30,31,32,33,34,35,36].
Traditional urban theorists have argued that people tend to have positive impressions of old memories related to historic places, architectural heritage, and narrow streets [1,16,17]. Other researchers have argued that new roads are more attractive to people [23,37,38]. To demonstrate these varying positions, researchers have mapped regions of New York that people have photographed using images on Flickr [39]. Similarly, researchers have also evaluated the attractiveness of a city based on the density of digital footprints, which they measured through indicators such as images on Flickr [14]. More recently, researchers have analyzed POIs using Flickr and Twitter and a time-series analysis [2], while two other studies categorized POIs based on their urbanity, vitality, and functionality [6,40]. In another recent study, POIs were utilized to define the level of urban vitality [41].
The development of information technology and big data has provided scholars with valuable resources, and there have been efforts to define city concepts using big data. For instance, recent studies have used big data from smartcards, Twitter, mobile devices, credit/debit card expenditure, WIFI access, and search engines to examine urban activities [9,42,43]. POI studies have utilized social networking service (SNS) data to identify relevant areas. Historically, data on people’s location are included in the social network; similarly, check-ins on social networks provide data on people’s movements. In turn, areas with many visitors receive more attention on social networks, and this phenomenon has the effect of receiving more visitors to the area [44,45,46,47,48,49,50]. These data are easy to extract and process, allowing for time-series analyses.
However, previous studies using SNS data have the limitation in terms of collecting samples from SNS users. While some people frequently engage in SNS activities, others are intentionally ignored or silent. In this sense, there might be some issue of selection bias in conducting quantitative analysis. To address this methodological issue, this study utilizes online map services within search engines, which are more general and may include a more diverse range of users in comparison to SNS. While these data are limited to search engine users, this study has a higher level of reliability compared to extant studies [51,52]. Moreover, analyses on the concentration of urban space using search engines can be effective in determining citizens’ POIs as those include a larger amount of data. Previously, such analyses were difficult because the data that citizens searched regarding places were not open or accessible for research purposes. However, using portal sites, which provide open API and geolocated data, has proved to be an effective way of analyzing the distribution of POIs. Consequently, this offers many further research possibilities [25,53,54]. In recent years, information technology has developed rapidly, and big data analysis has played an important role in urban studies [55,56,57]. In addition, as portal sites using cell phone data have become more common, the analysis of urban hot spots and public centers using these data connections has also increased [14,58,59,60,61].
Another merit of using search engines is that the examination of POIs might be significant for urban research, because elements such as land price, floating population, land use, development density, public transport accessibility, park accessibility, road width, and terrain conditions can help in understanding the characteristics of urban space. Further, when certain search engines dominate the market in one country, such as Weibo and Google, visit histories from check-ins remain on the portal site in the region; this information is then used by other users, and this phenomenon tends to become stronger [25,31,35,45,54]. In Seoul, the expansion of the city has resulted in the formation of several city centers, and many POIs have developed in these city centers, which are gradually growing. This study examines the relationship among these POI areas and the urban space, subway stations, urban structure, and spatial structure emphasized in traditional urban planning. When an urban space becomes a POI, these relationships can demonstrate how POIs differ according to the characteristics of urban space.
2.2. Method
This study utilized a search engine’s map services to estimate POIs. We identified POIs by searching for subway station names and related keywords and obtaining the coordinates of the highest listed establishments. In other words, this study combines the “OO Station” and specific keywords—including restaurants, entertainment, cafes, and bars—to discern coordinates and estimate POIs. POIs around specific subway stations included in the three city centers in Seoul were derived from the research method, which is why the areas outside the three city centers in Seoul were not included.
The search period was from July 2019 to September 2019, and the spatial distribution of the POIs, as determined from Naver data, was analyzed using ESRI ArcGIS Pro software (2019). The most important condition of this type of method is that the search engine utilized must have a high market share, which is indicative of the number of samples in the data; a higher market share indicates that the extracted data have higher reliability. As noted above, this study utilizes Naver, a search engine with almost 70% of the market share in South Korea in 2019. While Google’s market share is rising in South Korea, it is still not as popular as Naver [62].
Furthermore, as it is not a domestic search engine, the market share of Google Maps is much lower than the market share of South Korean search engines. Although the results of search engine analyses on all portal sites were not used, it was assumed that the search results from a portal site with a market share of 70% and results from other portal sites would not differ significantly. Considering prior studies analyzed using Weibo, the largest portal site in China, this assumption was judged to be reasonable [25,31,35,45,54]. As noted, the search area was set to key subway stations within three city centers in Seoul, as set out in the 2030 Seoul Development Plan—Seoul City Wall, Yeouido and Yeongdeungpo, and Gangnam (Figure 1) [28]. The searches initially concentrated on subway stations for the following three reasons: first, to discern reference points necessary to derive the POI; second, because the distances between the subway stations are similar within the region (typically 700–800 m, with some exceptions in the Seoul City Wall area, which had distances of 400–500 m between subway stations); and third, because the area produced by the searches only contained regions reachable from the stations (Figure 2).
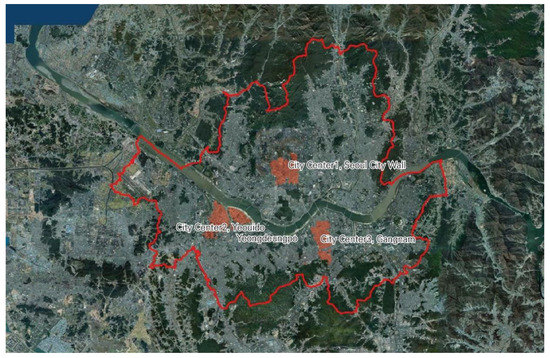
Figure 1.
Location of three city centers as a study area.
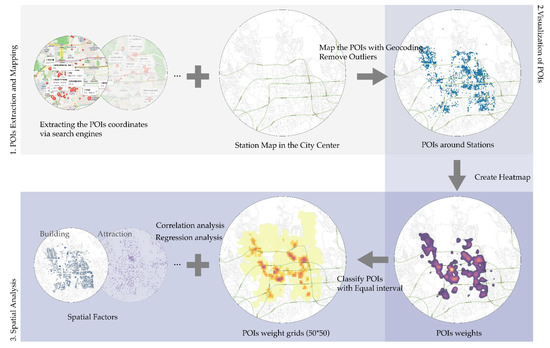
Figure 2.
Analytic process.
The search keywords were set using the keyword suggestion service of the search portal, with only spatial keywords selected from the suggested keywords provided when each station was searched. The keyword suggestion service was provided by analyzing search trends, behaviors, and relevance and is based on user traffic. The suggested terms indicate user attraction, and in the process of deriving the POI, the keyword related to the top searched region was used as the related search keyword by using the keywords ranked at the top through an analysis of the related search words of the search engine. This study utilizes the GIS temperature map function to estimate comprehensive POI areas, including non-residential buildings in residential areas. This method supplements the identification of specific keywords, and subsequently, the following suggested keywords were used: restaurants, bars, cafes, entertainment, diners, etc. These keywords were the most searched keywords in the region under analysis. These keywords differed across regions and stations.
Through a spatial analysis of the POIs in the three city centers in Seoul, building and POI data were obtained, and the spaces of interest for citizens in the three city centers of Seoul were determined. Correlation and regression analyses were conducted to understand the relationship among the urban spatial variables and how the variables of each urban space influenced the POI. In a previous study of a sample matrix of pairs values in a correlation analysis process based on spatial data, an appropriate sample size was described [63]. In this study, by considering the size and road widths of Seoul, the sample size of the POI construction was set as 50 m ∗ 50 m. The personal information retrieved in this process does not appear in this study; only the records concerning the search of an area were used. Thus, ethical considerations were carefully followed.
2.3. Data Sources and Variables
This study conducted correlation and regression analyses to examine the urban space characteristics of the identified POIs. The factors described in Table 1 were also used in this analysis and included socioeconomic factors, land use mix, development capacity, access to public transportation, access to green space/attractions, and adjacent roads and terrain conditions, with a total of 15 sub-components. These factors were used in the analysis because several former successful studies also considered these [1,2,4,8,16,17,19,20,35,41]. In addition, these variables were selected as independent of each other, and the VIF values between these variables were confirmed.

Table 1.
Variables and data sources.
POI values were found in 50 m ∗ 50 m unit cells. POI value utilized Open API data provided by Naver’s search engine. As a result, the frequency of keywords searching in the 50 m ∗ 50 m unit cell was derived as a number. For the process of deriving numbers, extensive big data analysis was required, so we applied a data crawling technique using Python. The crawled points were displayed in spatial coordinates using GIS Geo Coding in GIS. Finally, we created a heat map and removed the outliers. In the case of the outliers, a method of removing the points located in the 5% lowest density was used. Additionally, POI data were obtained through the National Spatial Data Infrastructure Portal, Seoul Open Data Portal, and Big Data Campus.
3. Identification of POIs
3.1. City Center 1: Seoul City Wall
Surrounding Hanyang (the old name of Seoul)—an area that was once the capital of the Joseon Dynasty and is now a central part of Seoul—the Seoul City Wall constitutes the city’s International Cultural Center (ICC) and the site of international tourism. Designated as the capital at the beginning of the Joseon Dynasty in 1394, Hanyang’s boundaries were defined with the construction of the Seoul City Wall in 1396. This region represents Seoul’s traditional city center, which is characterized by old urban districts with organic urban forms that were centered around Gyeongbokgung, one of the Joseon Dynasty palaces. It is characterized by abundant historical resources, including high concentrations of traditional housing and stringent regional regulations. Today, the Seoul City Wall constitutes the economic, administrative, and cultural core of Seoul.
Seven stations within the Seoul City Wall were selected: Gyeongbokgung Station, Jonggak Station, Gwanghwamun Station, City Hall Station, Euljiro 3-ga Station, Euljiro 1-ga Station, and Anguk Station. These stations opened in the 1980s as a result of the Seoul railway project, and have a similar number of users, ranging between 50,000 and 100,000 per day.
Figure 3 illustrates the results of measuring the POIs near the seven stations within the Seoul City Wall. The POIs are concentrated near Seoul City Hall and characteristically formed near alleyways. This phenomenon is more pronounced near City Hall—in the Seochon neighborhood, a densely populated traditional housing area—and in the regions of Iksun-dong and Insa-dong, old sections of the city.
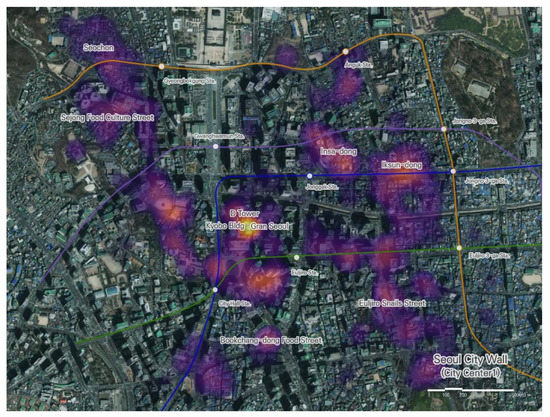
Figure 3.
Estimated points of interest (POIs) in Seoul City Wall (City Center 1): Seochon, Sejong Food Culture Streets, Gyeongbokgung Station, Anguk Station, Gwanghwamun Station, Insa-dong, Jongno 3-ga Station, Iksun-dong, Kyobo Building, D Tower, Gran Seoul, Jonggak Station, City Hall Station, Euljiro 1-ga Station, Bookchang-dong Food Street, Euljiro Sea Snails Street, and Euljiro 3-ga Station.
3.2. City Center 2: Yeouido and Yeongdeungpo
The Yeouido and Yeongdeungpo regions constitute Seoul’s international financial center (IFC), which oversees international finance functions through facilities such as the stock exchange. Yeouido is an island in the Han River, and as it is only separated from Yeongdeungpo by the narrow Saet river, Yeouido falls under the same administrative zone as Yeongdeungpo. Contemporary Yeongdeungpo is the result of land compartmentalization and rearrangement projects implemented in 1937. Contemporary Yeouido was shaped by the Yoonjungje project (circle levee project) implemented by the Seoul Metropolitan Government in the late 1960s.
This study selected nine stations in the Yeouido and Yeongdeungpo regions: Yeouido Station, Yeouinaru Station, National Assembly Station, and Saetgang Station in the Yeouido region and Yeongdeungpo Station, Yeongdeungpo Market Station, Yeongdeungpo-gu Office Station, Sindorim Station, and Singil Station in the Yeongdeungpo area. While stations in the Yeongdeungpo area opened in similar timeframes as those in Seoul City Wall, most stations in the Yeouido area opened with the development of subway Line 9 in 2009. Sindorim has a significantly higher volume of traffic than other stations. Aside from the Yeouido, Yeongdeungpo-gu Office, and Dangsan stations, several stations have relatively little traffic.
Figure 4 illustrates the results of measuring the POIs near the stations in the Yeouido and Yeongdeungpo regions mentioned above. These POIs tend to be situated within blocks—likely as a result of dense human activity within these blocks—as multiple businesses are located within large buildings. The identified POIs are also concentrated around the offices and large markets of the Yeongdeungpo area.
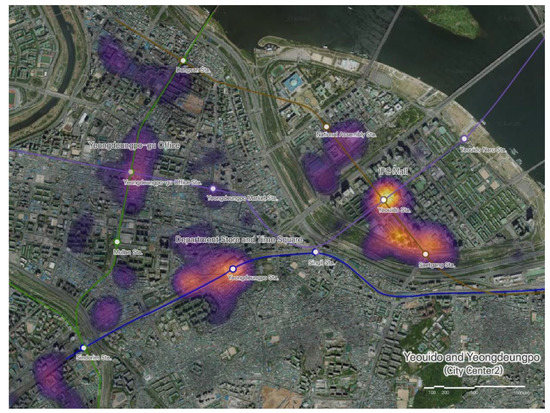
Figure 4.
Estimated POIs in the Yeouido and Yeongdeungpo region (City Center 2): Dangsan Station, Yeongdeungpo-gu Office, Yeongdeungpo-gu Office Station, National Assembly Station, Yeouinaru Station, IFC Mall, Yeouido Station, Yeongdeungpo Market Station, Mullae Station, Department Store and Times Square, Yeongdeungpo Station, Singil Station, Saetgang Station, and Sindorim Station.
3.3. City Center 3: Gangnam
Gangnam, Seoul’s international business center, is a largescale commercial zone, making it a quintessential business and commercial complex. Multi-unit apartment complexes are located a bit farther away from the stations, providing a mix of residential, commercial, and business uses. Contemporary Gangnam was shaped by the Yeongdong development initiative of the 1970s, which urbanized about 1 km of old residential areas and farming lands using a typical grid city structure.
This study selected six stations in Gangnam: Gangnam Station, Sinnonhyeon Station, Eonju Station, Yeoksam Station, Nonhyeon Station, and Yangjae Station. With the exception of Yeoksam Station (1982), the selected stations were built or expanded in the 2000s. Gangnam has a significant lead in the daily average users (DAUs) of Seoul, which varies widely between stations.
Figure 5 illustrates the results of estimating the POIs near the six stations within the Gangnam area. POIs are concentrated around the main roads and connected side roads that form blocks. While the linear formation trends alongside the roads are generally similar, there are clear differences in density. Particularly, the POIs of Gangnam-daero, which connects Gangnam Station and Sinnonhyeon Station, appear to be denser, and this indicates that there is little connection between the POI and the number of daily average users.
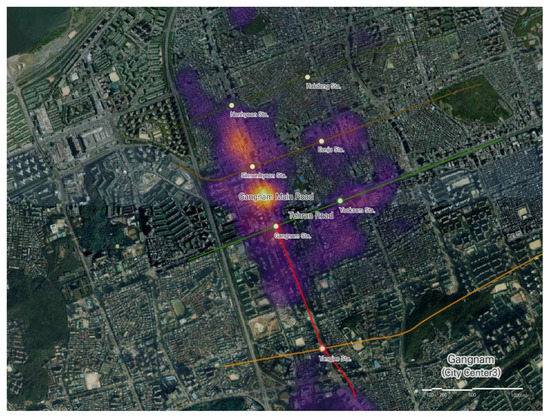
Figure 5.
Estimated POIs in Gangnam (City Center 3): Nonhyeon Station, Hakdong Station, Sinnonhyeon Station, Eonju Station, Gangnam Main Road, Gangnam Station, Tehran Road, Yeoksam Station, and Yangjae Station.
3.4. Differences between Centers
The three city centers examined in this study developed in different ways and at different times. For instance, the old city center has been the capital city since the start of the Joseon Dynasty in 1394. In addition to traditional and historic structures, large-scale office buildings have since been developed along the area’s main roads. In contrast, the Yeouido and Yeongdeungpo areas were shaped by planned development: Yeongdeungpo was subject to land compartmentalization and rearrangement projects in 1937, and Yeouido to the Yoonjungje project of the late 1960s. Consequently, the Yeongdeungpo area has small grain plots and a grid-based hierarchal road system. Major station districts are formed around the Yeongdeungpo and Sindorim stations, through which the Gyeongbu line runs.
Meanwhile, Gangnam is a relatively new, grid-style city center shaped by the Youngdong development projects of the 1970s, which formed a 1-km grid-style road system with 50-m-wide roads on top of an existing residential area. Offices and commercial structures are located along the main roads, while markets and eateries populate the side roads. Residential areas are located within the blocks, and as such, Gangnam demonstrates a trend of varying land use mixed within single blocks.
These three cities have different POI trends in terms of shape, size, location, and density. With regard to the Seoul City Wall, the major POIs are concentrated in small alleyways. This region contains old urban fabrics, including traditional vernacular architecture and irregular streets such as Iksun-dong, Insa-dong, and Seochon, and several significant POIs have formed along key historic alleyways. Although this region does not have as much density as the other two regions, the concentration of POIs seems to be very high. In Yeouido and Yeongdeungpo, the POIs appear to be situated within superblocks. This region has large-scale, multi-use buildings, including the IFC Mall and a diverse range of commercial facilities, which are densely located within single buildings. POIs have emerged within buildings and blocks in a fragmented manner. In other words, the POIs in Yeouido and Yeongdeungpo are highly dense and segmented fragmentations. Finally, the Gangnam region consists of a grid pattern, with some sections located some 800–1000 m apart; here, the POIs are primarily situated along the main roads that form these grids. The POI trend in Gangnam can be described as a set of strong interconnected POIs. While this is similar to the POIs near the Seoul City Wall, in that the POIs are situated along roads, the size of the roads and the hierarchy of the POIs are markedly different in both areas.
4. Results
4.1. Spatial Analysis: POI Density
This study conducted correlation and regression analyses on the identified POIs and urban spatial factors (socioeconomic factors, land use mix, development capacity, access to public transportation, access to green space/attractions, and adjacent roads and terrain conditions) to understand where citizens tended to become concentrated based on a POI density distribution analysis in Seoul. This study set POI density as ranging from 1 to 10, mapped the results, and conducted Pearson’s bivariate correlation and regression analyses to understand the relationships among the POIs and urban spatial factors. To enable relative comparisons between the regions, we normalized to a range of 1–10 rather than a natural scale. The analysis units are square cells sized 50 m ∗ 50 m, which is the analysis unit used by the Seoul Metropolitan Government for data such as floating populations (Appendix A).
4.2. Correlation Analysis
The results of the correlation analysis demonstrated that most of the factors were significant in all three city centers. The characteristics shared by the city centers indicate that POIs tend to form in places with high land prices, floating population traffic, and mixed-use ratios, as well as locations close to a subway station, taxi stops, and places of attraction.
In contrast, development capacity differed between the city centers. In the Seoul City Wall area, there was a negative correlation between POIs and development capacity and floor area ratio, and a positive correlation between POIs and height. In Gangnam, POIs typically formed in places with a high building-to-land ratio, while Yeouido and Yeongdeungpo had a positive correlation between POIs and all development capacity factors. The POIs of the three city centers also demonstrate different terrain characteristics. In the case of Seoul City Wall, POIs were formed in places with low elevation and slope, as were those in Yeongdeungpo. In Gangnam, POIs were formed in regions with low elevation and high slopes (Table 2).
Table 2.
Results of correlation analysis.
4.3. Regression Analysis
A regression analysis was conducted by setting the densities of POIs as the dependent variable and urban spatial factors as the independent variable to extract the factors that influence POI density. First, this study examined the variance inflation factors (VIF) to determine the issue of the multicollinearity of the independent variables. Typically, multicollinearity between independent variables is an issue when the VIF is over 10. In this study, the maximum VIF was 3.44, indicating that there were no issues with multicollinearity. Table 3 presents the influence of each urban spatial factor on POI density.
Table 3.
Results of regression models.
Table 4 ranks the various factors according to the results of the regression analysis. In the case of Seoul City Wall, land price, floating population mix rate, building height, and distance to taxi stops positively influenced POI density, while floor area ratio, distance to the subway station, distance to parks/green space, distance to attraction facilities, road width, road extensions, elevation, and slope negatively impacted POI density. These results can be translated as follows. In the old downtown area of Seoul, the urban form is irregular, and there are many old buildings and commercial areas, making it a convenient place for transportation, such as taxi stops or subway stations, which affects the POIs. This also means that the height and use of buildings are complex, and unusual buildings influenced how people were attracted to the area.
Table 4.
Summary of results of regression models: ranking of β values.
In the case of Yeouido and Yeongdeungpo, land price, floating population, mix rate, building height, distance to parks/green space, and road extension positively influenced POI density. Meanwhile, floor area ratio, building-to-land ratio, distance to subway station, distance to bus stops, distance to taxi stops, distance to attraction facilities, road width, and slope negatively impacted POI density. In Yeouido and Yeongdeungpo, which was formed in the 1970s, a period of rapid economic growth, financial-oriented business areas dominate, and these are characterized by wide streets and landmark buildings rather than a dense urban form like the old city center. As this attracts people, and the density of most buildings is high, factors such as the density and height of buildings are not very influential.
Finally, in the case of Gangnam, land prices, floating population, building height, road extension, and slope positively impacted POI density, while floor area ratio, distance to subway station, distance to bus stops, distance to taxi stops, road width, and elevation negatively impacted POI density. The Gangnam area, which was formed in the 1980s, is a transportation node that connects to the southern part of Seoul. Subsequently, the subway station, floating population, and taxi stop, which are heavily used transportation facilities, served as important factors in determining the POIs. This also means that land prices do not influence the POIs.
4.4. Tourist Attraction and Points of Interest
The correlation and regression analyses revealed four main findings. First, in all three city centers, POIs tended to emerge around sites with higher land prices, larger floating populations, a higher mixed-use ratio, a lower floor area ratio, higher building heights, and greater proximity to subway stations. The fact that a higher mixed-use ratio leads to higher POI density supports Jacobs’ theory that a mix of buildings with different uses improves the vitality of a city [16,17]. While low floor area ratios coupled with higher building heights may appear to be contradictory, recent buildings are generally designed with lower floor area ratios compared to building heights. By separating mass, the buildings’ external space is mostly in the lower levels and provides a pedestrian-friendly space, or it has external space on its middle floors. As such, this study contends that human activity is higher in regions with denser skylines coupled with lower-level floors open to the public [23]. This is made clearer when examining the building-to-land ratio, which was not interpreted because it did not fall within the significance level, as low building-to-land ratios in all three city centers influenced the formation of POIs.
Second, the results demonstrated two noteworthy characteristics of POI formation in Seoul City Wall. Accessibility is a very important factor for the formation of POIs in Seoul City Wall, along with the distance to taxi stops, distance to subway stations, elevation, and slope. POIs typically form in regions with high mixed-use ratios, indicating that non-residential use buildings significantly influence POI formation.
Third, in Yeouido and Yeongdeungpo, land price and the floating population had the greatest impact, indicating that urban activity occurs in regions where people gather and that such situations are reflected in the land price. Additionally, proximity to taxi stops had a positive influence on POI formation. More specifically, there is low conformity between subway stations and taxi stops in Yeouido and Yeongdeungpo, and the influence of taxi stops is greater because they grant better access to key buildings than subway stations, which are located on the main roads.
Finally, two factors—the distance to subway stations and floating population—are very influential in Gangnam. The results indicate that the floating population is focused around subway stations and that urban activity is high in these regions. This also indicates that POIs typically form around subway stations. Subway stations are located around main roads in Gangnam, and taxi stops are located between the subway stations. As such, the characteristics of POI formation along the main road in Gangnam appears to be because of major public transport facilities that are located on the main road. The elevation is also low around the main roads, indicating that Gangnam’s POIs form around main roads with low elevation and convenient public transportation facilities.
5. Discussion and Conclusions
This study examined the spatial characteristics of regions with popular POIs in major subway station districts located within three city centers of Seoul. In doing so, this study spatially confirms the trends in the formation of POIs and empirically verifies the relationship among POI formation trends and urban spatial analyses variables. This study demonstrated that big data analyses that utilize search engine data could identify the POIs where people concentrate, and the characteristics of the distribution of POIs vary depending on the urban characteristics [5,6,8,25,43,45,55,58,61].
The three city centers exhibit different POI trends, which were estimated using online search engine data, and the findings can be summarized as follows. First, in Seoul City Wall, the most popular POIs are located around key office buildings such as Gran Seoul in front of the City Hall, which is located in the center of the region. Other POIs typically form in older, smaller alleyways and in front of City Hall. Arguably, these characteristics are because Seoul City Wall is a historic area, predating the urban planning and redesign that shaped the other city centers, and the distinctive characteristics of each alley attract visitors. Second, POIs in Yeouido and Yeongdeungpo typically form around key buildings such as the IFC Mall, Times Square, and Yeongdeungpo-gu Office. Although this region is similar in size to Seoul City Wall, POIs form in a very segmented manner and are typically contained inside blocks. This may be due to the characteristics of the Yeouido and Yeongdeungpo region, which has multiple mixed shopping malls and is divided by a narrow river. It may also be indicative of the lack of characteristic alleyways, which are associated with old city centers such as Seoul City Wall. Third, POIs in Gangnam were formed along the key main roads, which are 50 m in width, and the side roads, which are approximately 8 m in width. While this is similar to Seoul City Wall, where POIs formed along roads, there are significant differences in the width of the key roads. POIs in Gangnam are also connected and are more densely connected compared to those in Seoul City Wall.
This study found that POIs are formed through different factors in accordance with the spatial characteristics of the urban area, as evident in the different results for each city center. This indicates that policies to expand POIs based on different region-specific spatial characteristics are necessary. This study also identified the following factors as influencing POI formation: high land price, large floating population, a mix of various uses, low floor area ratio, high buildings, and proximity to subway stations [1,3,16,17,37]. While high-density ratios are thought to contribute to urban revitalization [23], this study’s results indicate that lower floor area ratios lead to higher POI densities [1]. However, the results also demonstrated an association between taller buildings and higher POI densities [2,23,25]. This appears to be due to the gap between the height of buildings, which influences views and the landscape, and the floor area ratio, which can influence the pedestrian environment. Consequently, the findings indicated that while high-rise skylines positively influenced POI formation, employing methods to create a lower floor area ratio—such as the separation of high-rise buildings to secure pedestrian paths at the lower levels and the formation of exterior space in terms of public space—may be a more effective means of forming POIs [1,16].
These results verify that the concept of POIs raises the value of the region and attracts visitors. Furthermore, this study confirms the correlation between physical aspects and POI formation. This study also demonstrates how appropriately designed and formulated physical environments can attract and amplify people’s attention, although their importance and relevance may differ according to regional characteristics. By individually examining the three city centers, the results indicated that increases in development capacity were not the solution for vitalizing commercial activities or attracting people; rather, development programs that consider high accessibility to public transportation or well-designed pedestrian areas, depending on the region, might be more effective [1,3,4,9,16,19,20,29,41].
Notwithstanding, this study quantitatively measured the vague but frequently used concept of POIs, expanding the spatial understanding of the three city centers of Seoul through POI mapping. Despite the increasing importance of POIs, this type of POI research has never been conducted using data from Seoul, South Korea’s largest city. This study also has methodological significance as it demonstrates the potential of search engine data as a resource for the measurement of POIs; thus, this study could help improve the efficiency of data extraction and processing in future urban studies using big data, SNS data, and social media data [51,52].
Moreover, this study used search engine data from Naver, the portal site with the most dominant market share in South Korea. This was based on the assumption that other portal site analysis results would be similar, but in the future, analysis of search engine data from other portal sites should also be considered. Future integrated analyses should also be conducted to include spatial big data other than data from search engines. For example, social media or population census data were not analyzed in this study but could be included in future studies. As search engines were used to derive the POIs, tourists and non-Internet users were excluded from the analysis. In future research, combining data analysis techniques and using general interview techniques could include information from these other groups.
With the increase in the use of the Internet, both globally and in South Korea, citizens now use the Internet more to find attractive spaces by searching about the areas they will visit in advance. This trend is increasing with the increase in the use of mobile technology. In the future, SNS data will be combined with data from search engines and increase the trends of these searches. This study focused on the differences in the searches for attractive areas conducted by citizens, and the results demonstrated that the three city centers in Seoul have different POI patterns. Some of the downtown areas are over 500 years old, and some were relatively newly formed in the 1970s. This helps to explain the findings that demonstrated that the city form, density, height, and transportation infrastructure create different types of POIs for the urban residents of these areas. These results demonstrate that creating attractive spaces as part of urban planning processes must involve considerations of the characteristics of the area. The recently emerging POI analysis technique is significant as it provides a specific and empirical method for creating attractive urban spaces.
Lastly and more importantly, we did not take into account cultural variation in explaining the density of POIs due to the lack of an available dataset within the specific spatial unit of analysis (i.e., a 50 m ∗ 50 m grid cell). More specifically, Yeouido and Yeongdeungpo (City Center 2) are closely located in the district where multicultural activities are dominant and localized. Such factors also potentially affect the distribution and intensity of POIs. Likewise, this study focused more on the limited case areas in one city without any comparison to findings not only from other cities in South Korea but also from other countries with different spatial and cultural contexts. Given the issue of data availability and the universality of the research, it might be premature to generalize the quantified roles and ranks of spatial/physical factors in the previous regression models. Therefore, future studies should consider the measurement of cultural factors at the micro-spatial level as well as the comparable research frameworks between cultural-specific locations, cities, and countries.
Author Contributions
Conceptualization, E.G. and Y.K.; methodology, E.G. and Y.K.; software, E.G. and Y.A.; validation, E.G. and Y.K.; formal analysis, Y.K.; investigation, E.G. and Y.K.; resources, E.G.; data curation, E.G.; writing, E.G. and Y.K.; visualization, E.G. and Y.K.; revision, Y.A. and Y.K.; supervision, Y.K.; project administration, Y.K.; funding acquisition, Y.K. All authors have read and agreed to the published version of the manuscript.
Funding
This research was funded by Creative-Pioneering Researchers Program, which is funded by Seoul National University, the Basic Science Research Program through the National Research Foundation of Korea funded by the Ministry of Education (NRF-2018R1D1A1B07048832), and the Germany-Korea Partnership Program (GEnKO Program) through the National Research Foundation of Korea funded by the Ministry of Education (NRF-2018K2A9A2A15075843).
Acknowledgments
This research was supported by the Integrated Research Institute of Construction and Environmental Engineering at Seoul National University. The authors wish to express their gratitude for the support.
Conflicts of Interest
The authors declare no conflict of interest.
Appendix A
Table A1.
Spatial analysis: POI density and urban factors.
Table A1.
Spatial analysis: POI density and urban factors.
| City Center 1 Seoul City Wall | City Center 2 Yeouido and Yeongdeungpo | City Center 3 Gangnam | |
|---|---|---|---|
| POI density |  |  |  |
| Land price |  |  |  |
| Floating population |  |  |  |
| Land use mix rate |  |  |  |
| Floor area ratio |  |  |  |
| Building-to-land ratio |  |  |  |
| Height |  |  |  |
| Distance from the subway station |  |  |  |
| Distance from the bus stop |  |  |  |
| Distance from the taxi stop |  |  |  |
| Distance from parks and green space |  |  |  |
| Distance from the attraction facilities |  |  |  |
| Near road width |  |  |  |
| Near road extensions |  |  |  |
| Elevation (altitude) |  |  |  |
| Slope |  |  |  |
References
- Gehl, J. Life Between Buildings Using Public Space; Island Press: Washington, DC, USA, 1971. [Google Scholar]
- Hu, Y.; Gao, S.; Janowicz, K.; Yu, B.; Li, W.; Prasad, S. Extracting and understanding urban areas of interest using geotagged photos. Comput. Environ. Urban Syst. 2015, 54, 240–254. [Google Scholar] [CrossRef]
- Montgomery, J. Editorial: Urban vitality and the culture of cities. Plan Pract. Res. 1995, 10, 101–110. [Google Scholar] [CrossRef]
- Ravenscroft, N. The vitality and viability of town centres. Urban Stud. 2000, 37, 2533–2549. [Google Scholar] [CrossRef]
- Cai, L.; Xu, J.; Liu, J.; Ma, T.; Pei, T.; Zhou, C. Sensing multiple semantics of urban space from crowdsourcing positioning data. Cities 2019, 93, 31–42. [Google Scholar] [CrossRef]
- Gao, S.; Janowicz, K.; Couclelis, H. Extracting urban functional regions from points of interest and human activities on location-based social networks. Trans. GIS 2017, 21, 446–467. [Google Scholar] [CrossRef]
- Lyu, G.; Bertolini, L.; Pfeffer, K. Developing a TOD typology for Beijing metro station areas. J. Trans. Geogr. 2016, 55, 40–50. [Google Scholar] [CrossRef]
- Yue, Y.; Zhuang, Y.; Yeh, A.G.O.; Xie, J.-Y.; Ma, C.-L.; Li, Q.-Q. Measurements of POI-based mixed use and their relationships with neighbourhood vibrancy. Int. J. Geogr. Inf. Sci. 2017, 31, 658–675. [Google Scholar] [CrossRef]
- Liu, K.; Qiu, P.; Gao, S.; Lu, F.; Jiang, J.; Yin, L. Investigating urban metro stations as cognitive places in cities using points of interest. Cities 2020, 97, 102561. [Google Scholar] [CrossRef]
- Liu, K.; Yin, L.; Lu, F.; Mou, N. Visualizing and exploring POI configurations of urban regions on POI-type semantic space. Cities 2020, 99, 102610. [Google Scholar] [CrossRef]
- McKenzie, G.; Janowicz, K.; Gao, S.; Gong, L. How where is when? On the regional variability and resolution of geosocial temporal signatures for points of interest. Comput. Environ. Urban Syst. 2015, 54, 336–346. [Google Scholar] [CrossRef]
- Bentley, I.; Alcock, A.; Murrain, P.; McGlynn, S.; Smith, G. Responsive Environments: A Manual for Designers; Architectural Press: Oxford, UK, 1985. [Google Scholar]
- Espuche, A.G.; Guardia, M.; Monclús, F.J.; Oyón, J.L. Modernization and urban beautification: The 1888 Barcelona world’s fair. Plan Perspect. 1991, 6, 139–159. [Google Scholar] [CrossRef]
- Girardin, F.; Vaccari, A.; Gerber, A.; Biderman, A.; Ratti, C. Quantifying urban attractiveness from the distribution and density of digital footprints. Int. J. Spat Data Infrastruct. Res. 2009, 4, 175–200. [Google Scholar]
- Carmona, M.; Heath, T.; Oc, T.; Tiesdell, S. Public Places Urban Spaces, Second Edition: The Dimensions of Urban Design; Architectural Press: Oxford, UK, 2010. [Google Scholar]
- Jacobs, J. Death and Life of Great American Cities; Random House: New York, NY, USA, 1961. [Google Scholar]
- Whyte, W.H. The Social Life of Small Urban Spaces; Conservation Foundation: Washington, DC, USA, 1980. [Google Scholar]
- Sung, H.-G.; Go, D.-H.; Choi, C.G. Evidence of Jacobs’s street life in the great seoul city: Identifying the association of physical environment with walking activity on streets. Cities 2013, 35, 164–173. [Google Scholar] [CrossRef]
- Lynch, K. The Image of the City; MIT Press: Cambridge, MA, USA, 1960. [Google Scholar]
- Lynch, K. A Theory of Good City Form; MIT Press: Cambridge, MA, USA, 1981. [Google Scholar]
- Chion, M. Producing urban vitality: The case of dance in San Francisco. Urban Geogr. 2009, 30, 416–439. [Google Scholar] [CrossRef]
- Shane, D.G. Urban Design Since 1945: A Global Perspective; Wiley: Chichester, UK, 2011. [Google Scholar]
- Glaeser, E. Triumph of the City: How Our Greatest Invention Makes Us Richer, Smarter, Greener, Healthier, and Happier; Penguin Books: New York, NY, USA, 2011. [Google Scholar]
- Hsu, F.-C.; Elvidge, C.D.; Matsuno, Y. Exploring and estimating in-use steel stocks in civil engineering and buildings from night-time lights. Int. J. Remote. Sens. 2013, 34, 490–504. [Google Scholar] [CrossRef]
- Hu, Q.; Bai, G.; Wang, S.; Ai, M. Extraction and monitoring approach of dynamic urban commercial area using check-in data from Weibo. Sustain. Cities Soc. 2019, 45, 508–521. [Google Scholar] [CrossRef]
- Zong, W.; Zhang, J. Use of smartphone applications and its impacts on urban life: A survey and random forest analysis in Japan. Sustain. Cities Soc. 2019, 49, 101589. [Google Scholar] [CrossRef]
- Markusen, A. Fuzzy concepts, proxy data: Why indicators would not track creative placemaking success. Int. J. Urban Sci. 2013, 17, 291–303. [Google Scholar] [CrossRef]
- Seoul Metropolitan Government. 2030 Seoul Basic Urban Plan (2030 Seoul Plan). Available online: http://urban.seoul.go.kr/4DUPIS/sub3/sub3_1.jsp (accessed on 1 May 2020).
- Sugimoto, K.; Ota, K.; Suzuki, S. Visitor mobility and spatial structure in a local urban tourism destination: GPS tracking and network analysis. Sustainability 2019, 11, 919. [Google Scholar] [CrossRef]
- García-Palomares, J.C.; Gutiérrez, J.; Mínguez, C. Identification of tourist hot spots based on social networks: A comparative analysis of European metropolises using photo-sharing services and GIS. Appl. Geogr. 2015, 63, 408–417. [Google Scholar] [CrossRef]
- Khan, N.; Wan, W.; Yu, S. Spatiotemporal analysis of tourists and residents in Shanghai based on location-based social network’s data from Weibo. Int. J. Geo-Inf. 2020, 9, 70. [Google Scholar] [CrossRef]
- Kuai, X.; Guo, R.; Zhang, Z.; He, B.; Zhao, Z.; Guo, H. Spatial context-based local toponym extraction and Chinese textual address segmentation from urban POI data. Int. J. Geo-Inf. 2020, 9, 147. [Google Scholar] [CrossRef]
- Liu, C.; Liu, J.; Xu, S.; Wang, J.; Liu, C.; Chen, T.; Jiang, T. A spatiotemporal dilated convolutional generative network for point-of-interest recommendation. Int. J. Geo-Inf. 2020, 9, 113. [Google Scholar] [CrossRef]
- Piech, M.; Smywinski-Pohl, A.; Marcjan, R.; Siwik, L. Towards automatic points of interest matching. Int. J. Geo-Inf. 2020, 9, 291. [Google Scholar] [CrossRef]
- Wang, Y.; Wang, T.; Tsou, M.-H.; Li, H.; Jiang, W.; Guo, F. Mapping dynamic urban land use patterns with crowdsourced geo-tagged social media (Sina-Weibo) and commercial points of interest collections in Beijing, China. Sustainability 2016, 8, 1202. [Google Scholar] [CrossRef]
- Xiao, Y.; Ai, T.; Yang, M.; Zhang, X. A multi-scale representation of point-of-interest (poi) features in indoor map visualization. Int. J. Geo-Inf. 2020, 9, 239. [Google Scholar] [CrossRef]
- Hall, P. Cities in Civilisations: Culture, Innovation and Urban Order; Weidenfeld & Nicholson: London, UK, 1998. [Google Scholar]
- Michell, W.J. City of Bits: Space, Place, and the Infobahn; MIT Press: Cambridge, MA, USA, 1994. [Google Scholar]
- Crandall, D.; Backstorm, L.; Huttenlocher, D.; Kleinberg, J. Mapping the World’s Photo. In Proceedings of the WWW ‘09: 18th International World Wide Web Conference, Madrid, Spain, 20–24 April 2009. [Google Scholar]
- Yuan, N.J.; Zheng, Y.; Xie, X.; Wang, Y.; Zheng, K.; Xiong, H. Discovering urban functional zones using latent activity trajectories. IEEE Trans. Knowl. Data Eng. 2014, 27, 712–725. [Google Scholar] [CrossRef]
- Liu, S.; Zhang, L.; Long, Y. Urban vitality area identification and pattern analysis from the perspective of time and space fusion. Sustainability 2019, 11, 4032. [Google Scholar] [CrossRef]
- Sulis, P.; Manley, E.; Zhong, C.; Batty, M. Using mobility data as proxy for measuring urban vitality. J. Spat. Inf. Sci. 2018, 16, 137–162. [Google Scholar] [CrossRef]
- Kim, Y.-L. Seoul’s Wi-Fi hotspots: Wi-Fi access points as an indicator of urban vitality. Comput. Environ. Urban Syst. 2018, 72, 13–24. [Google Scholar] [CrossRef]
- Deng, Y.; Luo, A.; Liu, J.; Wang, Y. Point of Interest Matching between Different Geospatial Datasets. ISPRS Int. J. Geo-Inf. 2019, 8, 435. [Google Scholar] [CrossRef]
- Zhang, X.; Sun, Y.; Zheng, A.; Wnag, Y. A new approach to refining land use types: Predicting point-of-interest categories using Weibo check-in data. Int. J. Geo-Inf. 2020, 9, 124. [Google Scholar] [CrossRef]
- Huang, J.; Liu, Y.; Chen, Y.; Jia, C. Dynamic recommendation of POI sequence responding to historical trajectory. Int. J. Geo-Inf. 2020, 8, 433. [Google Scholar] [CrossRef]
- Gan, M.; Gao, L. Discovering memory-based preferences for POI recommendation in location-based social networks. Int. J. Geo-Inf. 2020, 8, 279. [Google Scholar] [CrossRef]
- Wang, S.; Xu, G.; Guo, Q. Street centralities and land use intensities based on Points of Interest (POI) in Shenzhen, China. Int. J. Geo-Inf. 2018, 7, 425. [Google Scholar] [CrossRef]
- Kuo, C.-L.; Chan, T.-C.; Fan, I.-C.; Zipf, A. Efficient method for POI/ROI discovery using Flickr geotagged photos. Int. J. Geo-Inf. 2018, 7, 121. [Google Scholar] [CrossRef]
- Touya, G.; Antoniou, V.; Olteanu-Raimond, A.-M.; Damme, M.-D.V. Assessing crowdsourced POI quality: Combining methods based on reference data, history, and spatial relations. Int. J. Geo-Inf. 2017, 6, 80. [Google Scholar] [CrossRef]
- Ruths, D.; Pfeffer, J. Social media for large studies of behavior. Science 2014, 346, 1063. [Google Scholar] [CrossRef]
- Elias, B. Extracting landmarks with data mining methods. In Spatial Information Theory: Foundations of Geographic Information Science, Proceedings of the International Conference, COSIT Kartause Ittingen, Switzerland, 19–23 September 2003; Kuhn, W., Worboys, M., Timpf, S., Eds.; Springer: Berlin, Germany, 2003; pp. 375–389. [Google Scholar]
- Jendryke, M.; Balz, T.; Liao, M. Big location-based social media messages from China’s Sina Weibo network: Collection, storage, visualization, and potential ways of analysis. Trans. GIS 2017, 21, 825–834. [Google Scholar] [CrossRef]
- Guan, W.; Gao, H.; Yang, M.; Li, Y.; Ma, H.; Qian, W.; Cao, Z.; Yang, X. Analyzing user behavior of the micro-blogging website Sina Weibo during hot social events. Phys. A 2014, 395, 340–351. [Google Scholar] [CrossRef]
- Batty, M. Big data, smart cities, and city planning. Dialogues Hum. Geogr. 2013, 3, 274–279. [Google Scholar] [CrossRef]
- Khan, M.; Babar, M.; Ahmed, S.H.; Shah, S.C.; Han, K. Smart city designing and planning based on big data analytics. Sustain. Cities Soc. 2017, 35, 271–279. [Google Scholar] [CrossRef]
- Rathore, M.M.; Paul, A.; Ahmad, A.; Jeon, G. IoT-based big data: From smart city towards next generation super city planning. Int. J. Semant. Web Inf. 2017, 13, 28–47. [Google Scholar] [CrossRef]
- Hu, Q.W.; Wang, M.; Li, Q.Q. Urban hotspot and commercial area exploration with check-in data. Acta. Geod. Cart. Sin. 2014, 43, 314–321. [Google Scholar]
- Jinlei, X.U.; Fang, Z.; Xiao, S.L.; Yin, L. The spatio-temporal heterogeneity analysis of massive urban mobile phone users’ stay behavior: A case study of Shenzhen City. J. Geogr. Inf. Sci. 2015, 17, 197–205. [Google Scholar]
- Liu, Y.; Sui, Z.; Kang, C.; Gao, Y. Uncovering patterns of inter-urban trips and spatial interactions from check-in data. PLoS ONE 2013, 9, e86026. [Google Scholar]
- Zuo, X.; Zhang, Y. Detection and analysis of urban area hotspots based on cell phone traffic. J. Comput. (Taipei) 2012, 7, 1753–1760. [Google Scholar] [CrossRef]
- Ace Counter. Available online: http://www.acecounter.com (accessed on 1 May 2020).
- Haining, R. Bivariate correlation with spatial data. Geog. Anal. 1991, 23, 210–227. [Google Scholar] [CrossRef]
- Naver. Available online: https://naver.com (accessed on 1 May 2020).
- National Spatial Data Infrastructure Portal. Available online: http://www.nsdi.go.kr/lxportal/?menuno=2679 (accessed on 1 May 2020).
- Seoul Open Data Platform. Available online: https://data.seoul.go.kr/ (accessed on 1 May 2020).
- Seoul Metropolitan Government Big Data Campus. Available online: https://bigdata.seoul.go.kr/main.do (accessed on 1 May 2020).
© 2020 by the authors. Licensee MDPI, Basel, Switzerland. This article is an open access article distributed under the terms and conditions of the Creative Commons Attribution (CC BY) license (http://creativecommons.org/licenses/by/4.0/).