Article

Evaluation of Water Quality Interaction by Dam and Weir Operation Using SWAT in the Nakdong River Basin of South Korea

1
Graduate School of Civil, Environmental and Plant Engineering, Konkuk University, 120 Neungdong-ro, Gwangjin-gu, Seoul 05029, Korea
2
School of Civil and Environmental Engineering, College of Engineering, Konkuk University, 120 Neungdong-ro, Gwangjin-gu, Seoul 05029, Korea
*
Author to whom correspondence should be addressed.
Sustainability 2020, 12(17), 6845; https://doi.org/10.3390/su12176845
Submission received: 30 July 2020 / Revised: 20 August 2020 / Accepted: 21 August 2020 / Published: 23 August 2020
(This article belongs to the Collection Modeling and Simulations for Sustainable Water Environments)

Abstract

:
The purpose of this study was to evaluate the streamflow and water quality (SS, T-N, and T-P) interaction of the Nakdong river basin (23,609.3 km2) by simulating dam and weir operation scenarios using the Soil and Water Assessment Tool (SWAT). The operation scenarios tested were dam control (Scenario 1), dam control and weir gate control (Scenario 2), dam control and sequential release of the weirs with a one-month interval between each weir (Scenario 3), dam control and weir gate full open (Scenario 4), dam control and weir gate sequential full open (Scenario 5), weir gate control (Scenario 6), weir gate full open (Scenario 7), and weir gate sequential full open (Scenario 8). Before evaluation, the SWAT was calibrated and validated using 13 years (2005–2017) of daily multi-purpose dam inflow data from five locations ((Andong Dam (ADD), Imha Dam (IHD), Hapcheon Dam (HCD), Namkang Dam (NKD), and Milyang Dam (MYD))multi-function weir inflow data from seven locations (Sangju Weir (SJW), Gumi Weir (GMW), Chilgok Weir (CGW), Gangjeong-Goryeong Weir (GJW), Dalseong Weir (DSW), Hapcheon-Changnyeong Weir (HCW), and Changnyeong-Haman Weir (HAW)), and monthly water quality monitoring data from six locations (Andong-4 (AD-4), Sangju (SJ-2), Waegwan (WG), Hapcheon (HC), Namkang-4 (NK-4), and Mulgeum (MG). For the dam inflows and dam storage, the Nash-Sutcliffe efficiency (NSE) was 0.59~0.78, and the coefficient of determination (R2) was 0.71~0.90. For water quality, the R2 values of SS, T-N, and T-P were 0.58~0.83, 0.53~0.68, and 0.56~0.79, respectively. For the eight dam and weir release scenarios suggested by the Ministry of Environment, Scenarios 4 and 8 exhibited water quality improvement effects compared to the observed data.

1. Introduction

Water is one of the most important resources for human survival. Experts who engage in water resources planning and management must address how to determine policy in accordance with future climate change and how to evaluate the resulting environmental effects [1]. In South Korea, the Four Major Rivers Restoration Project has been in place since the end of 2009 to prevent drought and flooding due to climate change, and to create healthy water ecosystems as well as various waterfront spaces. The project has significantly changed stream environments [2]. According to the annual report on the generation of algae (algal bloom) and response [3], water quality problems such as T-N and T-P increases and algal bloom have occurred in the Nakdong River Basin every year since 2013, lasting for up to 161 days in 2015, when the country suffered its most severe drought.
The Survey and Evaluation Committee of the Four Major Rivers Restoration Project proposed that to reduce algal bloom and improve water quality, it is necessary to simultaneously increase streamflow and lower weir water levels through the combined operation of dams, weirs, and reservoirs. The committee also proposed that it is necessary to establish standards for weir operation considering water use, flood control, and water quality improvement. In response to water pollution, related ministries such as the Ministry of Environment (ME) and the Ministry of Land, Infrastructure, and Transport (MOLIT) have reviewed plans for dam-weir-reservoir combined operations through the Dam-Weir Combined Operation Council, and they have performed partial release for some dams and weirs in the Nakdong River since August 2016.
In South Korea, the seasonal rainfall concentrated in the summer makes it difficult to maintain water quality during dry seasons due to the lack of instream flow, as well as during the flood season due to the torrential rainfall and the subsequent introduction of soil from draining basins. It is, therefore, necessary to secure water quantity with the construction of multi-function weirs and to develop hydraulic-hydrologic combined models to maintain water quality using such weirs. Dam-weir combined operations must be considered, and the importance of techniques that comprehensively examine complex factors, such as water quantity, water quality, and sediment transport, along with various scenarios, is increasing [4].
Several studies recently assessed the dam and weir operation using hydrological models, such as Fang et al. [5], who attempted to optimize the water resources system operation policy of a multi-reservoir water supply system. Ahn et al. [6] conducted research on the combined operation of 16 multi-function weirs in South Korea. Kim [7] proposed an analysis method linking and combining three-dimensional models that considered water quality and water quantity, such as the water pollution accident response management system (WARMS) and the water quality forecasting system for dam-weir combined operation used in the Nakdong River water system. Ahn et al. [8] quantified the improvement in the water supply efficiency through the combined operation of dams and multi-function weirs in the Nakdong River water system using Hydrological Engineering Center—Reservior System Simulation (HEC-Resim). Jang [9] evaluated the supply capacity of each dam in the Nakdong River Basin using HEC-Resim and PRMS, then evaluated the supply capacity of the water system by conducting a simulation under inter-dam combined supply conditions. Lee et al. [10] quantitatively derived the water quality improvement effect of the inter-weir combined operation by analyzing the water quality improvement in the Nakdong River through inter-weir combined operation in the Nakdong River water system using the CE-QUAL-W2 model. Ryu et al. [11] analyzed the change in water quality caused by the construction of weirs in the Nakdong River using water quality measurement data. Lin and Rutten [12] examined state-of-the-art reviews in the operational management of a network of multi-purpose reservoirs with recent developments while focusing on the application of Model Predictive Control for real-time control of a reservoir system. Ahn et al. [13,14] investigated the environmental effects of multi-function weir operation in the Geum River basin. Li et al. [15] and Sun et al. [16] studied an improved multi-objective optimization model for reservoir operations in China.
The analysis of hydrological and water quality interaction and how it changes due to dam-weir combined operation is an important issue that needs to be a primary component of watershed management. However, there are currently no studies analyzing the hydrological and water quality improvement effects of the dam-weir operation scenarios published by the related ministries in 2017 using hydrologic-water quality models. Therefore, in this study, we set up the dam-weir combined operation to assess the streamflow and water quality interaction for efficient operation in stream water quality reduction.

2. Materials and Methods

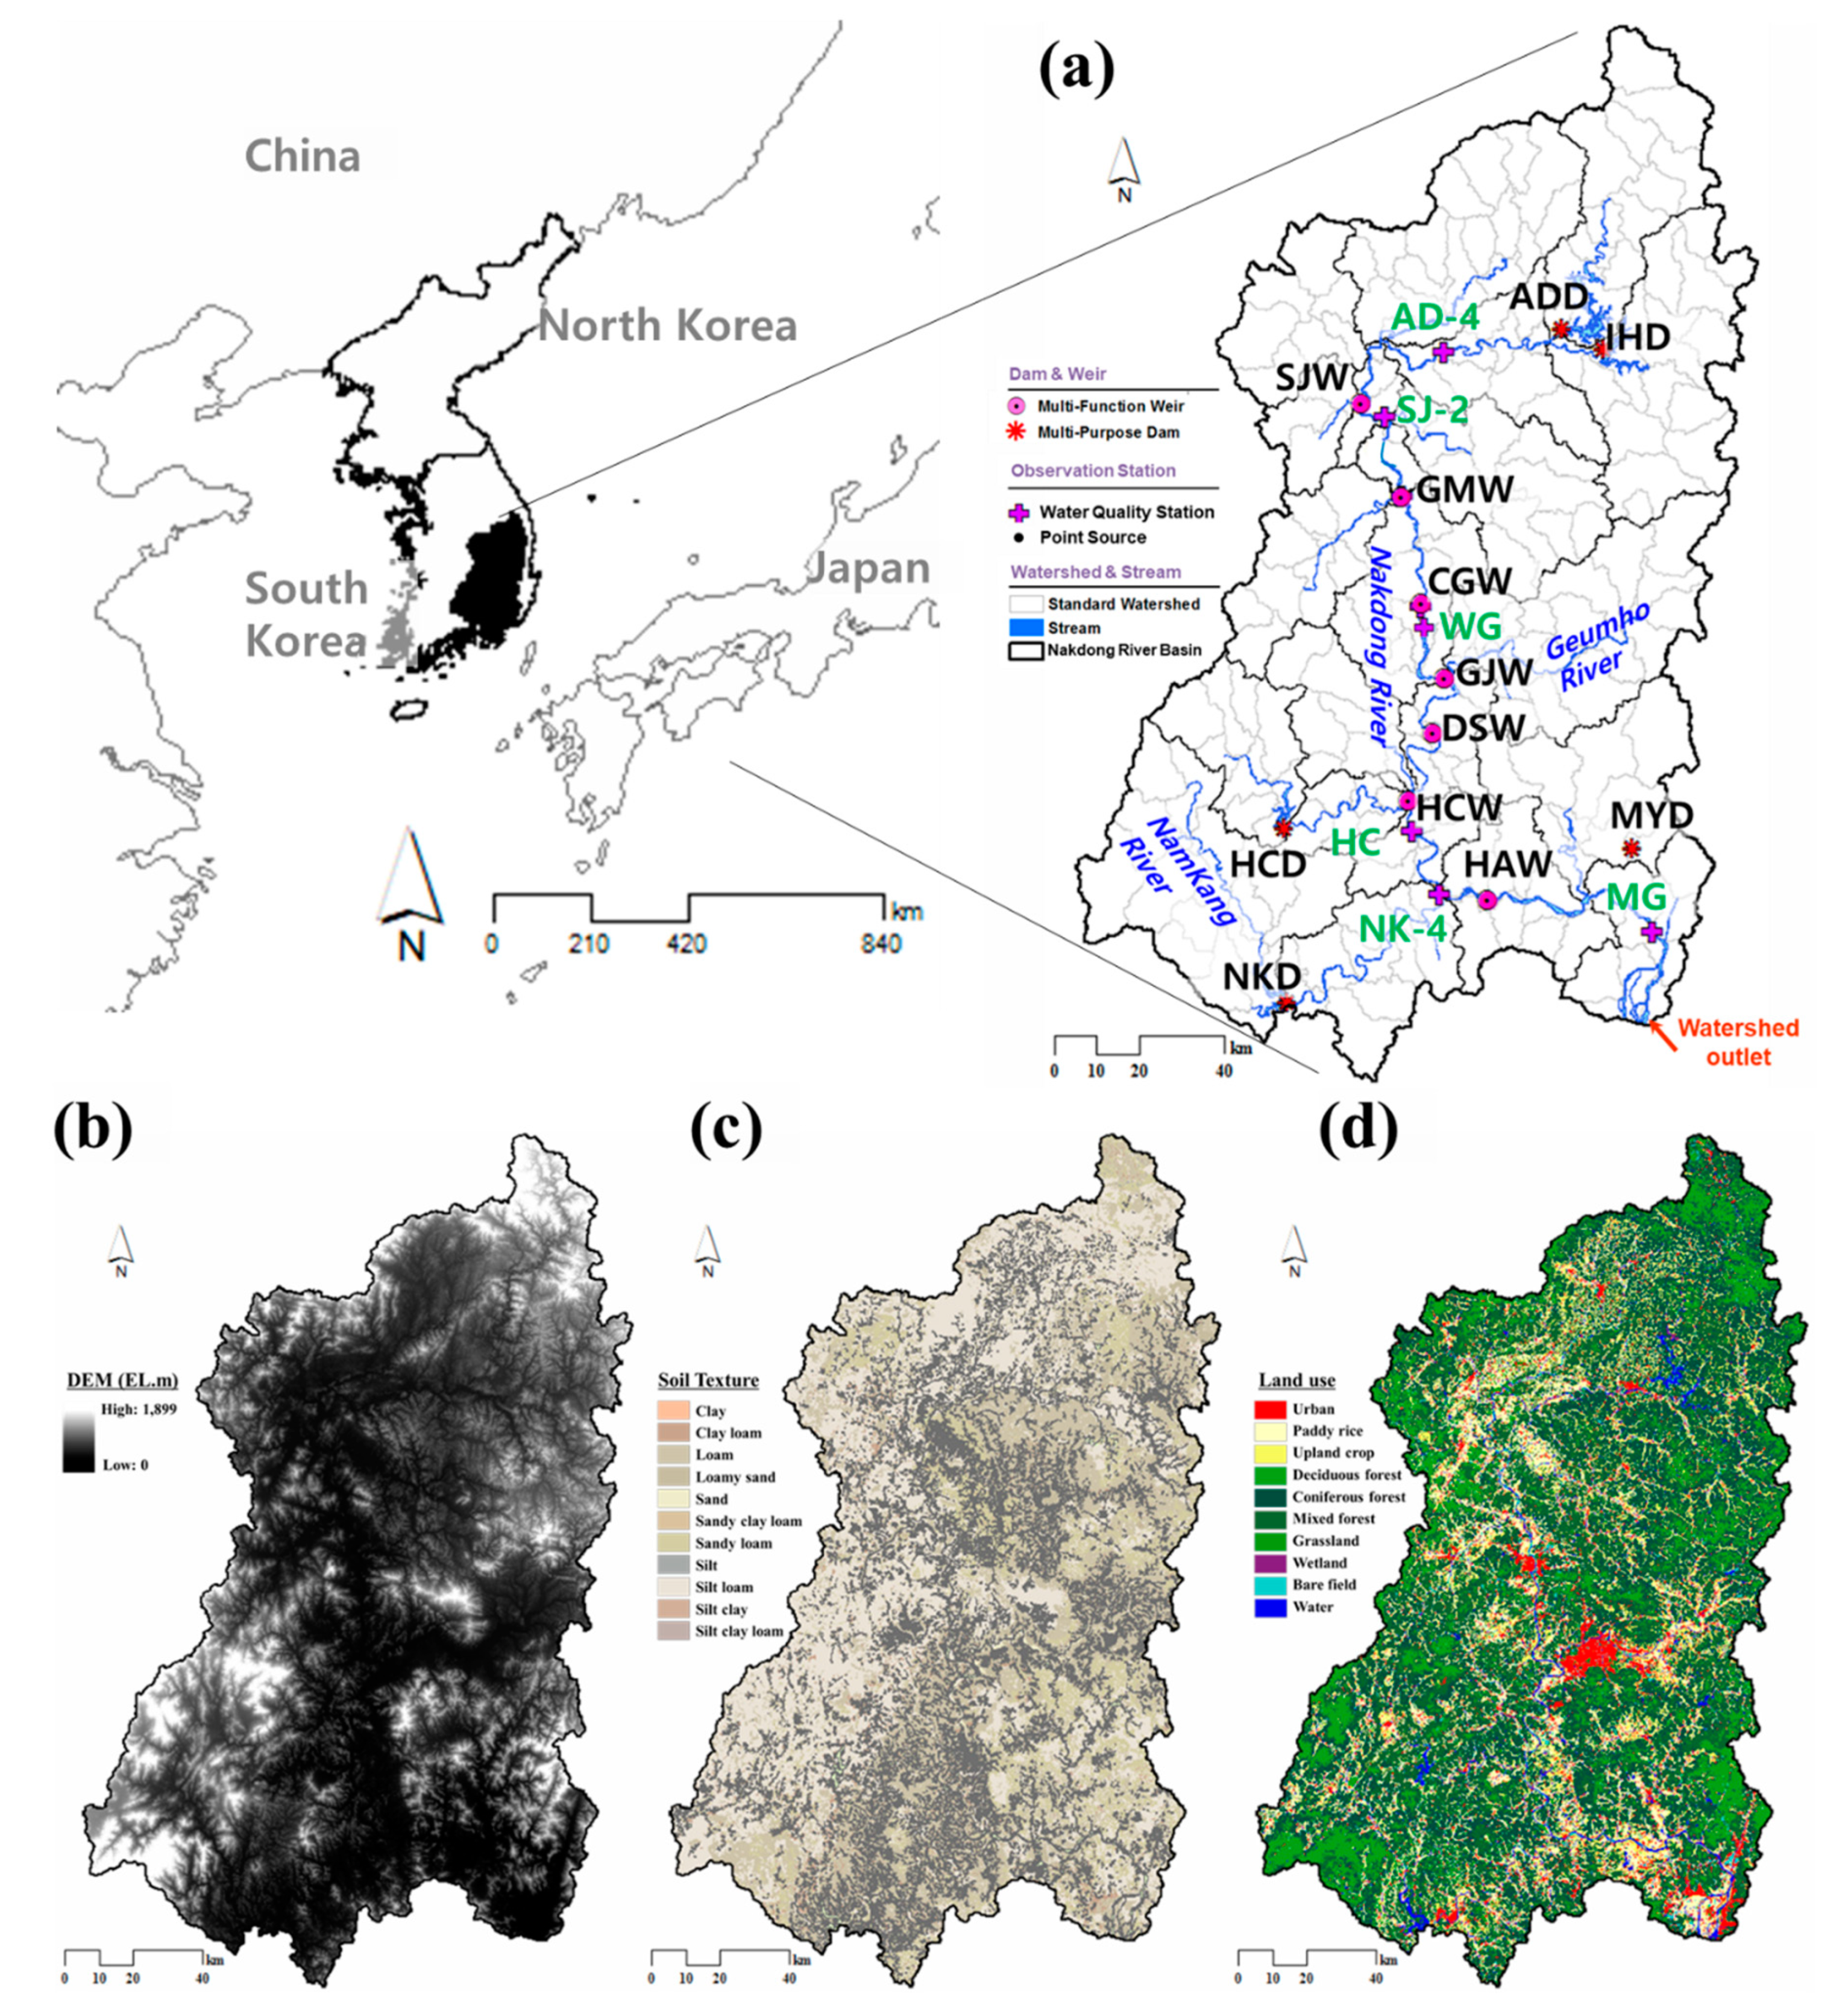
2.1. Study Area Description

The study watershed is the Nakdong River Basin, which accounts for 25% of the entire area of South Korea. In this area, the frequency of algal blooms in water supply sources and weir sections is increasing due to the increase in nutrients, the decrease in the flow velocity due to weirs, and the increase in the residence time. The watershed area is 23,609.3 km2 and the river length is 510.36 km. In the watershed, seven multi-function dams (Andong Dam (ADD), Imha Dam (IHD), Gunwi Dam, Buhang Dam, Hapcheon Dam (HCD), Namkang Dam (NKD), and Milyang Dam (MYD)) and eight multi-function weirs (Sangju Weir (SJW), Nakdan Weir, Gumi Weir (GMW), Chilgok Weir (CGW), Gangjeong-Goryeong Weir (GJW), Dalseong Weir (DSW), Hapcheon-Changnyeong Weir (HCW), and Changnyeong-Haman Weir (HAW)) have been constructed and are currently operating. Forests account for 68.4% of the total watershed area; paddy fields and upland fields represent 10.4% and 7.2% of the area, respectively; urban, grasslands, and bare lands represent 0.1–6.9% of the area. Figure 1a shows 195 sub-watersheds, dams, weirs, and water quality calibration and validation points to be applied to the Soil and Water Assessment Tool (SWAT) model.

2.2. SWAT Model Description

In this study, SWAT, developed by the USDA Agricultural Research Service (ARS), was selected to simulate the daily runoff of the target watershed for an extended period of time. The SWAT model is a physical-based semi-distribution continuous rainfall-runoff model that can simulate runoff according to various soil types, land uses, and land-management conditions. This model can simulate the precipitation, evapotranspiration, surface runoff, baseflow, and groundwater for each hydrological response unit (HRU) based on the water balance equation [17].
In the SWAT model, the daily runoff is calculated using the Soil Conservation Service Curve Number (SCS-CN) method. The Kinematic Storage Model is used for lateral inflows, and infiltration is calculated using the linear storage tracking technique after subdividing the soil layer into a maximum of ten layers. Soil erosion is calculated using the Modified Universal Soil Loss Equation (MUSLE), which can simulate the transport of organic chemicals such as phosphorus and nitrogen. Water bodies represent streams and reservoirs, and the streamflow, sediments, nutrient salts, and reactions of organic chemicals are considered in the model as well [18].

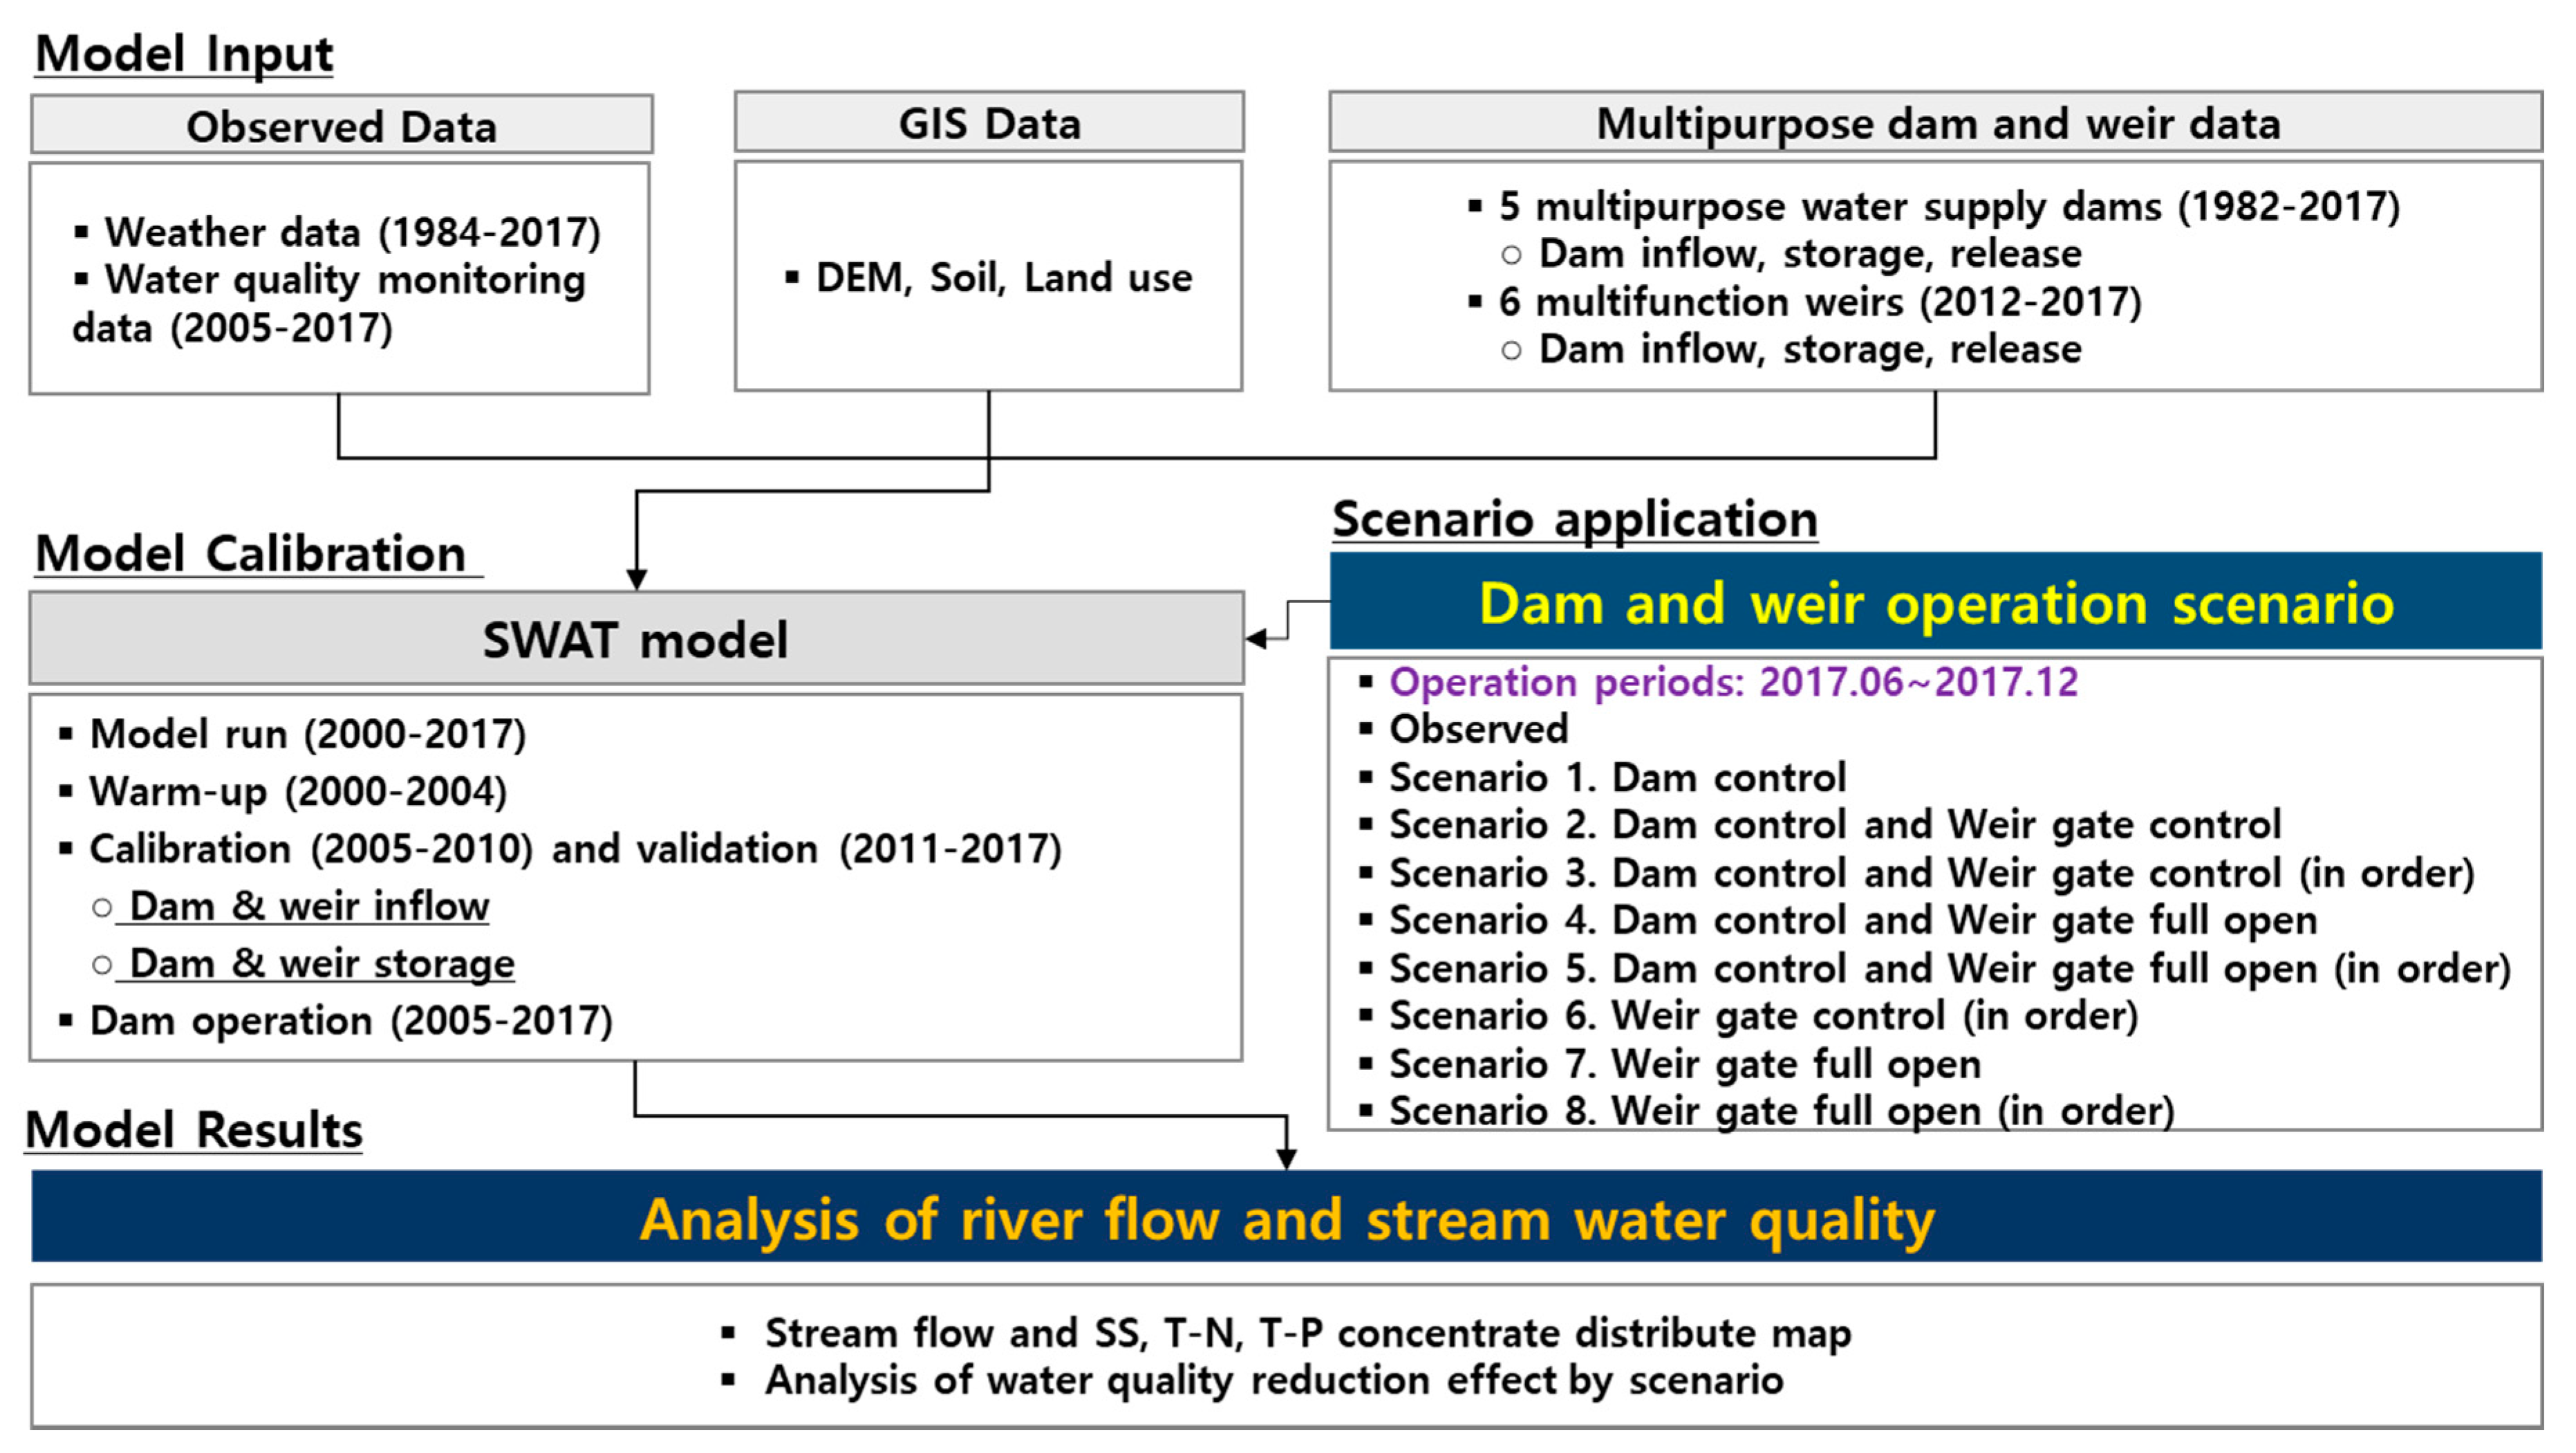
2.3. Data Collection and Analysis Method

2.3.1. GIS, Weather, and Hydrological Monitoring Data

A digital elevation model (DEM) was used for the GIS spatial data of the SWAT model; a 30 m × 30 m DEM and a 1:25,000 precision soil map of the Water Management Information System (WAMIS) were used for the soil map (Figure 1b,c). For the land use map, 2013 data classified by ME were used. The data were classified into nine categories (deciduous forest, coniferous forest, mixed forest, residential area, paddy field, upland field, grassland, bare land, and waters) and used as input data for the model (Figure 1d). Regarding the soil types in the Nakdong River Basin, silt loam and loam represented high proportions of 40% and 30%, respectively. In terms of land use, forests and farmlands accounted for 68% and 18%, respectively.
The weather data used for the calibration and validation of SWAT was daily data from a 14-year period (2005–2017) on the precipitation (mm), highest and lowest temperatures (°C), wind speed (m/s), relative humidity (%), and solar radiation (MJ/m2) from 34 weather stations (Chungju, Uljin, Chupungnyeong, Andong, Sangju, Pohang, Daegu, Ulsan, Changwon, Busan, Tongyeong, Jinju, Taebaek, Boeun, Namwon, Jangsu, Gimhae City, Bukchangwon, Yangsan City, Euiryeong-gun, Hamyang-gun, Bonghwa, Yeongju, Mungyeong, Cheongsong-gun, Yeongdeok, Euiseong, Gumi, Yeongcheon, Gyeongju City, Geochang, Hapcheon, Milyang, and Sancheong). During this period, the daily dam inflow and storage data of ADD, IHD, HCD, MYD, and NKD were collected. The daily weir inflow and storage data of SJW, GWM, CGW, GJW, HCW, and HAW over a period of five years and five months (August 2012–December 2017) were also collected (http://www.water.or.kr).

2.3.2. Simulation Scenarios

This study focused on water quality in the Nakdong River, one of the four rivers in which several detailed basin investigations and field surveys have been conducted for many years to obtain highly reliable hydrological and water quality data. In the Nakdong River, eight multifunction weirs were constructed, and these are operated based on a target water level throughout the year [19].
Although many facilities are currently in operation in the Nakdong River, it is necessary to set up a scenario specifically targeting the watershed where the water quality needs to be improved, rather than simply modeling all facilities. Table 1 presents the water quality monitoring data of the Nakdong River from 2008 to 2017, where it can be seen that the water quality is good upstream of the watershed, but the downstream water quality is only fair. Therefore, in this study, the simulation scenarios were set up for the downstream, where it was necessary to improve the water quality.
The SWAT was applied to evaluate the hydrology and stream water quality resulting from the coordinated operation of the existing water resource facilities. The specifications of the structures were used as input data for SWAT, and these are listed in Table 2.
In general, facilities such as dams and weirs are operated according to given requirements. In this study, a dam release scenario was designed to simultaneously minimize the impact of the opening gates on the downstream area and avoid the occurrence of drift flow. The weir release scenarios were designed to consider water surface elevation.
The dam-weir-reservoir combined operation scenarios that were proposed in a research service report published by ME, MOLIT, and Ministry of Agriculture, Food and Rural Affairs (MAFRA) on 20 March 2017 were used for dam-weir operation scenarios (Table 3). The simulation was conducted by constructing daily release data, which are reservoir input data in the SWAT model, according to the scenario for the period of 2017, and the results were analyzed. The dam release scenario was applied to ADD, IHD, HCD, NKD, and MYD as suggested by the dam-weir-reservoir combined operation scenarios, and the weir release scenarios were applied to GJW, HCW, and HAW, where weir release was observed from the data from 2017.
The observed data were the actual operating data in the Nakdong River from 3 June 2017, so the observation data were analyzed as they were. In Scenarios 3, 5, 6, and 8, the weirs were sequentially released with a one-month (30 days) interval from the upstream weirs. The release of GJW on 3 June 2017 occurred first, followed in order by the release of HCW on 3 July 2017 and that of HAW on 3 August 2017. The release amount data were constructed so that the decreased water levels could be maintained until 31 August. In Scenarios 1, 2, 3, 4, and 5, the release amounts of ADD, IHD, GJW, HCW, and HAW for the five-day period starting from 3 June 2017 were adjusted as minimum drawdown level (MDDL).

2.3.3. Research Method

Figure 2 shows the flowchart of this study. First, the input data for the SWAT and the observation data for the calibration and validation points were collected. After constructing and inputting the specifications and release amount data of the dams and weirs, the inflows and storage volumes of the dams and weirs were calibrated and validated sequentially from the upstream to the downstream of the watershed. The SWAT enables simulation based on the operation data by inputting the specifications and release amounts of dams to the reservoir module, but the characteristics of the structures enabling natural overflow must be reflected for weirs, not dams. Therefore, the module inside the SWAT was improved by referring to previous studies [20,21,22].
The release amount observation data of weirs provided by MyWater (http://www.water.or.kr) are in the form of the sum of all releases through small hydropower, operating weirs, sand-flash gates (fixed weirs), natural overflows, and fishways. When the total release amount is inputted into the model, the calculated streamflow was excessive. Therefore, the total release amount was subtracted from the total inflow from the upstream, the result was regarded as the actual release amount, and the module inside SWAT was modified so the result could be considered.
To use the observation data to calibrate and validate the water quality, the data of six points in the water quality measurement network, provided by the water environment information system of ME, were collected. Parameter estimation was applied to the model through a process of trial and error which involved selecting optimal parameters based on previous studies to simulate hydrological and water quality elements in a balanced manner. To evaluate streamflow and water quality interaction according to the dam-weir combined operation scenarios, changes in scenarios were analyzed based on observed data, which were applied and operated.

3. Results and Discussion

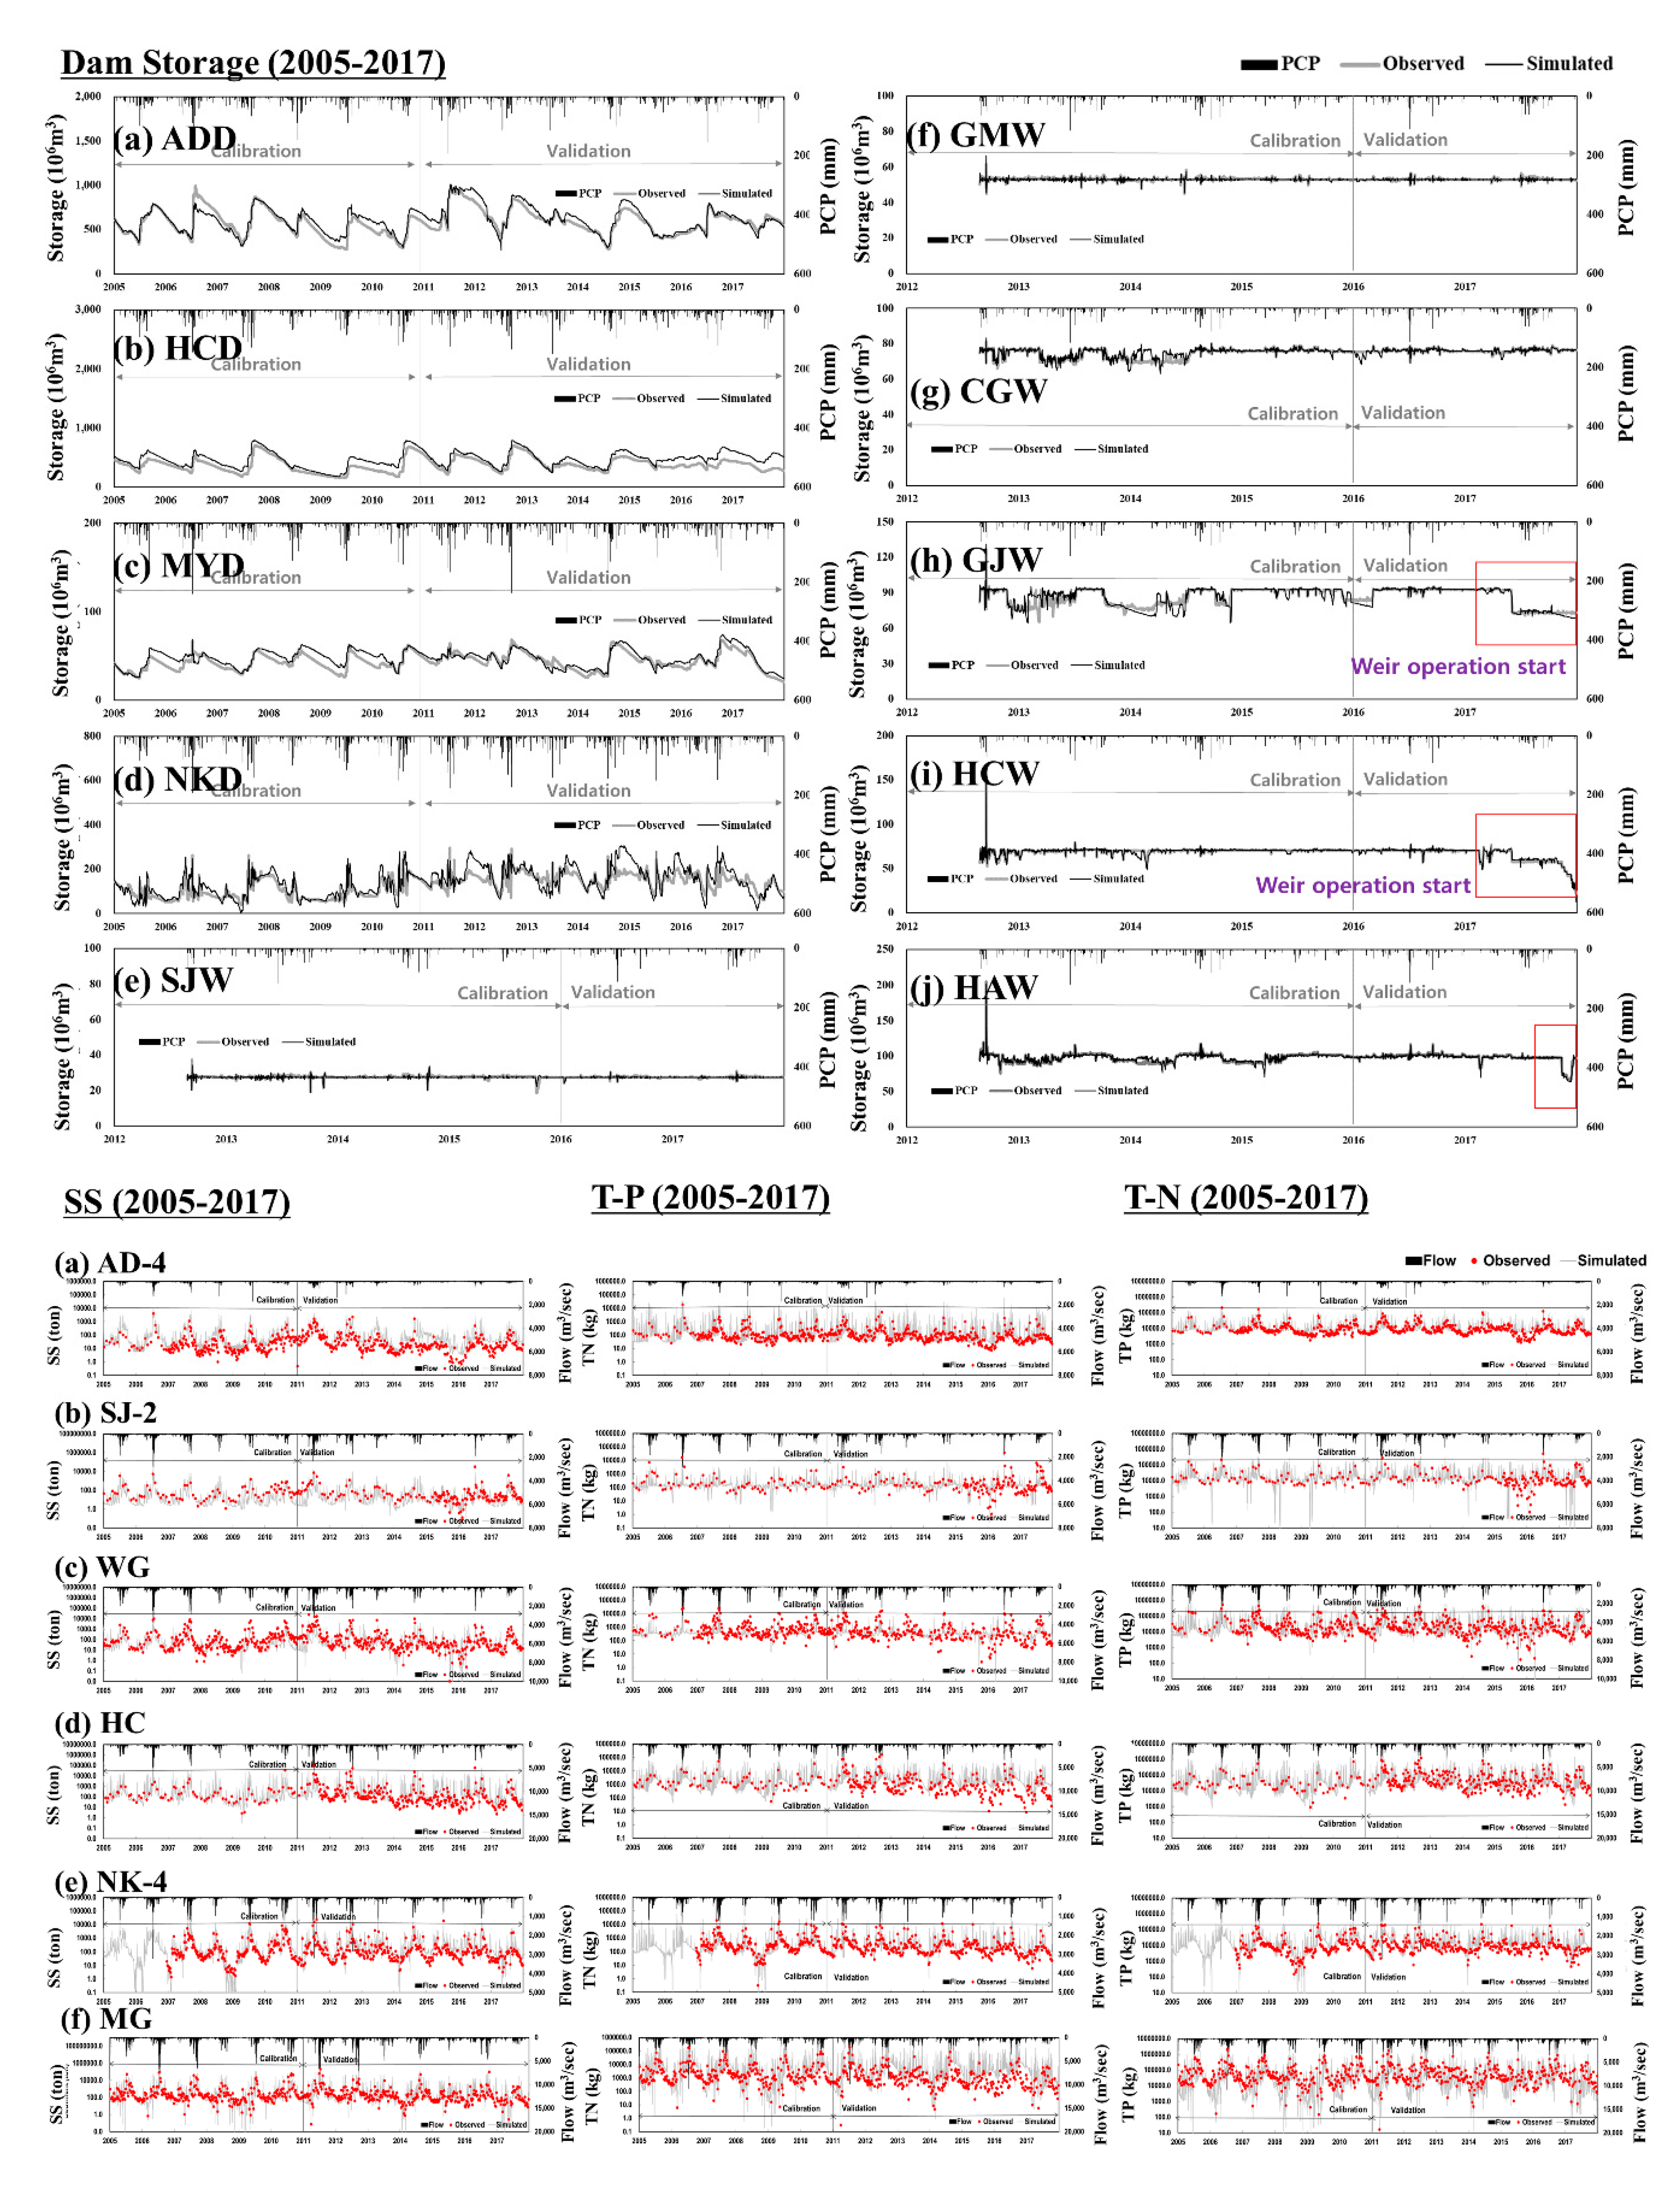
3.1. Calibration and Validation of the Model

In this study, the parameter sensitivity for the Nakdong River Basin was examined prior to the calibration and validation of the model, and optimal parameters were selected through this process. Table 4 summarizes the parameters used for the calibration and validation of the model.
The calibration period of the SWAT model was set to six years (2005–2010), and its validation period was set to seven years (2011–2017). For the six weirs (SJW, GMW, CGW, GJW, HCW, and HAW), three years (2013–2015) were set as the calibration period and two years (2016–2017) were set as the validation period, because they began operation in August 2012.
The statistical results for hydrology and water quality for the model calibration and validation are summarized in Table 5 and Figure 3. The applicability of the model was evaluated using the coefficient of determination (R2), Nash and Sutcliffe [23] model efficiency (NSE), root-mean-square error (RMSE), and percent bias (PBIAS). As R2 approaches 1, the observed values fall in perfect agreement with the simulated values. NSE evaluates the efficiency of the model in the range from −∞ to 1. When it is higher than 0, the applicability of the model can be said to be high [24]. RMSE represents the error between the measured and simulated values, and as it is close to 0, the error is small. PBIAS represents the error between the observed and simulated values as a percentage. A smaller error value means that the model has higher efficiency [22].
The statistical analysis results of the dam inflow showed that R2 ranged from 0.71 to 0.90 and that NSE ranged from 0.59 to 0.78 for the entire period. RMSE ranged from 1.14 to 1.69 mm/day, while PBIAS ranged from −18.04 to 7.32%. The statistical analysis results were significant for all calibration and validation points. Regarding the water quality R2 results for the entire period, the R2 of SS ranged from 0.58 to 0.83, while that of T-N ranged from 0.53 to 0.68. T-P exhibited a correlation between 0.56 and 0.79%. Diff was calibrated to be 35% or less, as suggested by Donigian [25]. The SWAT constructed in this study did not consider the QULE2E module.

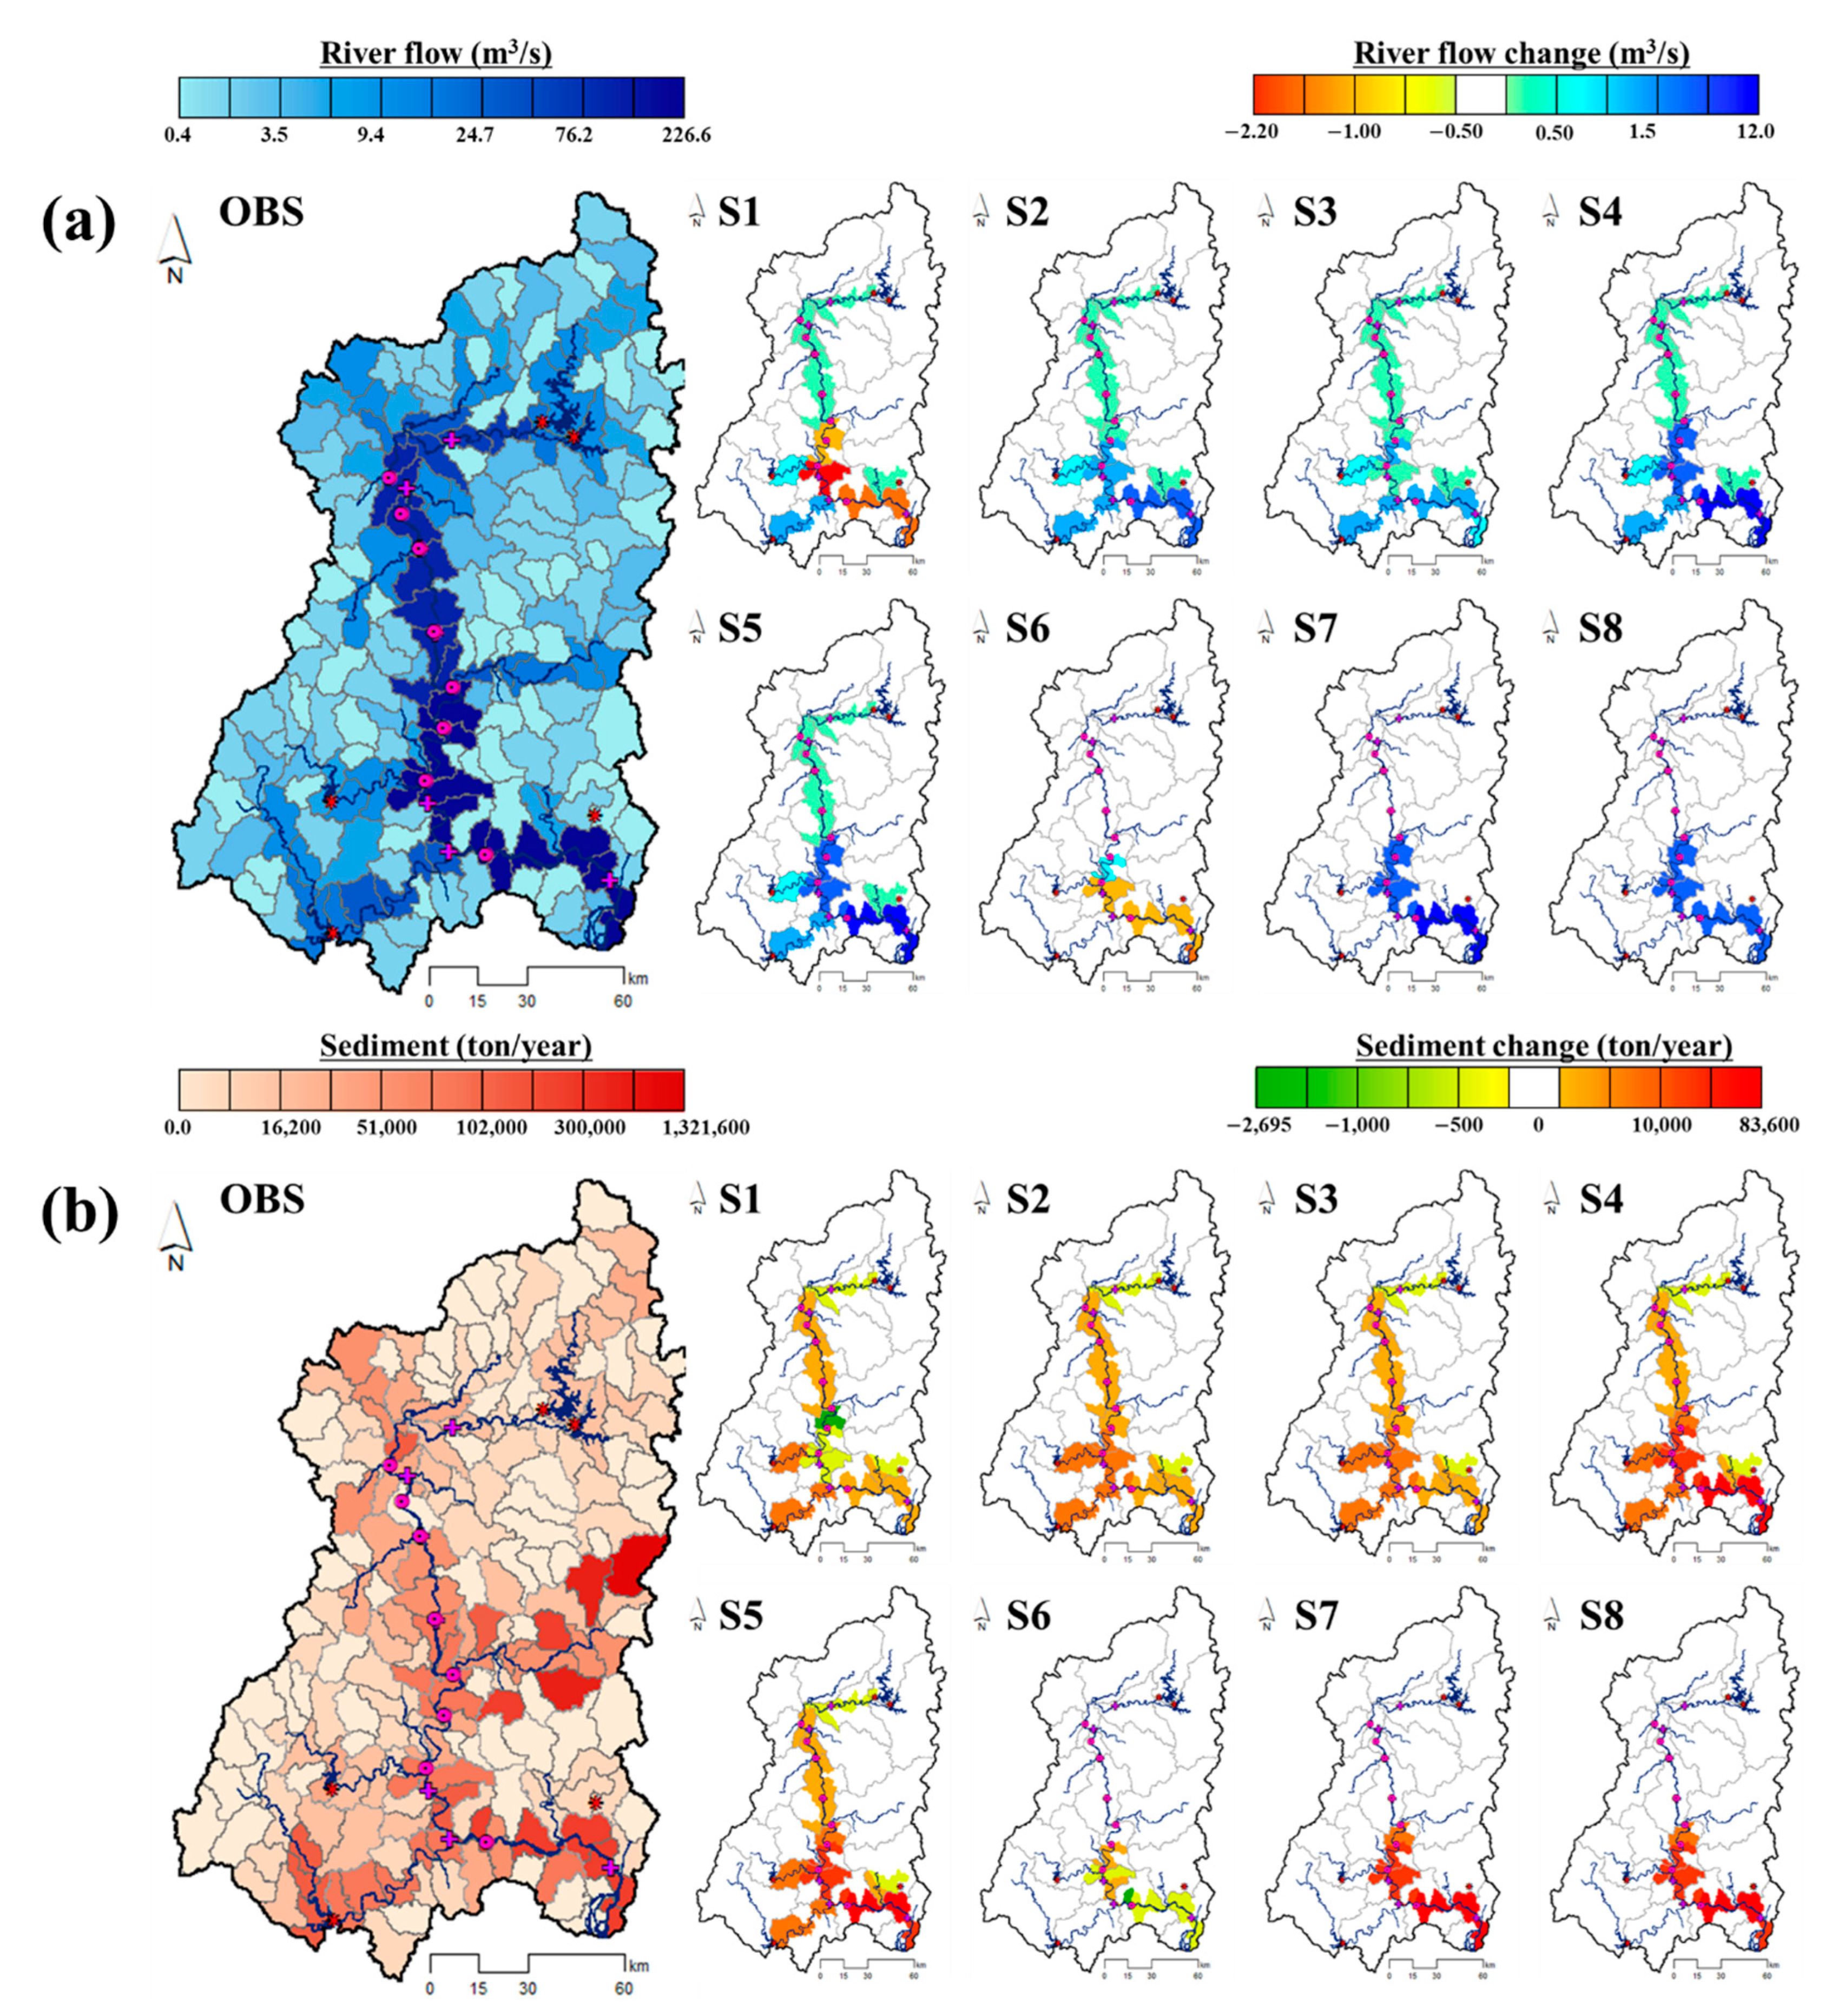
3.2. Analysis of Streamflow and Water Quality Interaction in 2017 According to the Dam-Weir Combined Operation Scenarios

In this study, streamflow and water quality interaction were examined by standard unit watershed for the year 2017 by constructing input data for the dam-weir combined operation scenarios. Prior to the simulation, the actual observation data from 2005 to 2016 were applied to stabilize the SWAT.
Dam operation proceeds similar to the operating conditions under which the water supply capacity of the existing dams was investigated. By operating weirs, the water level can be maintained at a constant level, in contrast to dam operation. The operating rule is applied based on the rules suggested by ME [26]. Figure 4 summarizes the streamflow and water quality simulation results by scenario for 2017. In the figure, the simulation results of each scenario and the changes compared to observed data were shown based on the spatial distribution.
In terms of streamflow, the average annual flow rate of the entire Nakdong River Basin in observed data was found to be 28.7 m3/s. Scenario 1, in which dam release was simulated, showed a decrease in the average annual streamflow by 0.05 m3/s compared to the observed data, as the annual average streamflow from HCW to the downstream area of the Nakdong River decreased. Scenarios 2, 3, 4, and 5 exhibited increases in the average annual streamflow by 0.13~0.79 m3/s compared to the observed data, which were attributed to the simultaneous release of the dams and weirs. Scenario 8, which involved weir gate full open sequential release, showed an increase in streamflow by 0.55 m3/s compared to the observed data (Figure 4a).
However, the water quality improvement and deterioration phenomena were different in each section. The simulation results of SS in observed data showed an annual average SS load of 120.0 ton/day. In the downstream case in ADD and IHD, the SS loads decreased, but in the SJW-CGW and NKD downstream-HAW sections, which are the areas downstream of the dams, the SS loads increased. Scenarios 4, 5, 7, and 8, in which weir gate full open release was simulated, show increases in SS loads by 8.5~11.3 ton/day compared to the observed data (Figure 4b). Based on the relationship between SS and streamflow described in previous studies [27,28,29], it is likely that high inflow will be accompanied by the transport of high SS from upstream to the estuary.
Regarding the simulation results of T-N, the T-N loads decreased in all scenarios compared to the observed data. The simulation result shows that the weir release scenarios were more effective in reducing T-N loads than the dam control scenarios. In Scenarios 2 and 3, in which dam and weir control was simulated, the T-N load decreased by 3.5 to 4.7 kg/day, while Scenario 6 reduced the T-N load by 5.8 kg/day when only weir was released sequentially without dam control (Figure 4c).
As shown in Figure 4d, the simulation results of T-P revealed that the T-P loads in the GMW-CGW and HCD-HCW sections were increased in dam control scenarios compared to the observed data, but were reduced in the HCW-Nakdong River estuary section, as was the case with the T-N simulation results. In the cases of Scenarios 7 and 8, the T-P loads decreased in the HCW-Nakdong River estuary section. In Scenario 8, which exhibited the largest load change, the T-P load decreased by 50.5 kg/day compared to the observed data in the Nakdong River estuary.
Table 6 presents the monthly streamflow and water quality (SS, T-N, and T-P) changes at MG stations from June to December in 2017, which is when the dam-weir combined operation scenarios were applied. The calculation of the water quality reduction efficiency was ranked based on the reduced load compared to the observed data.
Scenarios 4 and 8 showed the greatest effect of reducing water quality loads. Although the two scenarios have something in common to fully open the weir gate, Scenario 4 simultaneously releases dam and weirs, while Scenario 8 opens only weirs sequentially.
For the operation of dams and weirs in the case of the full gate open (Scenario 4), the river flow was 325.35 m3/s, but the SS load was increased by 67.51%. In the case of Scenario 8, the SS load increased by 49.11% compared to the observed data, but this increase was lower than that in Scenario 4. This was because the SS load increased in the downstream of ADD and IHD by dam control. The reductions of T-N and T-P loads in Scenarios 4 and 8 were 1.00~1.12% and 1.14~1.45%, respectively.
Similar relationships between streamflow and water quality were found in previous studies [30,31,32]. This is reflected in T-N and T-P loads and wash off, which were concentrated in the dam and weir operation, showing clear patterns of scenarios. The change in characteristics could be explained in that the environmental condition changes substantially when the hydrologic structures begin operating, and the streamflow changes lead to SS, T-N and T-P changes in the water body.
Figure 5 and Figure 6 show monthly water quality simulation results of the observed data as well as Scenarios 4 and 8. The analysis results for each scenario showed improvement in the watershed in the simulated results of T-N and T-P. The analysis results were illustrated on the map by sub-basin, and the areas where rapid changes were made in the downstream where the dams and weirs were operated were derived.
Scenario 4 exhibited T-N and T-P load reduced compared to the observed data for the simultaneous release of the dams and weirs. Scenario 4 exhibited T-N and T-P load reduction effects within the shortest period of time among the scenarios by causing the largest streamflow change within that period of time and instantly increasing the stagnant flow velocity of the Nakdong River estuary. However, it was confirmed that water quality (SS, T-N, and T-P) worsened at the downstream of five dams.
Scenario 8 exhibited T-N and T-P load reduced compared to the observed data from July to September when the sequential release occurred. However, T-N and T-P loads in October after the completion of sequential release were temporally increased compared to the observed data.
In general, water quality is closely related to streamflow, and it is known to worsen during water shortage events in dry seasons; therefore, the increased streamflow according to the dry season operation method should result in water quality improvements. The highest positive effects appearing in September and November indicate the possibility of reduced T-N and T-P loads in the estuaries during those periods. This is attributed to the high inflow volume observed during those periods. In most cases, because streamflow higher than those secured through the natural water cycling system of the river are required, the increased streamflow of the water body resulting from coordinated operations of hydrological facilities will have positive effects on the environment. In addition, the increased loads in December could also be associated with low temperature, and T-N and T-P wash-off also increased due to the increase in release compared to the observed data (Figure 5 and Figure 6).
When the water level drops the target release, the actual operating conditions should be adjusted appropriately according to the water storage and flow rate conditions of the dams and weirs in the water systems [19]. This study found that water quality improvement could be maintained through sequential weir operation (Scenario 8) while minimizing the operation of the hydrological facility.

4. Summary and Conclusions

In this study, the reliable hydrologic cycle was reproduced by calibrating and validating the SWAT model, a physical-based semi-distribution continuous rainfall-runoff model, using operation data from the multi-purpose dams and multi-function weirs in the Nakdong River water system (23,690.3 km2). In addition, for the application of the dam-weir combined operation scenarios, the streamflow and water quality improvement effects of each scenario were examined by collecting the release amount data for each scenario. The main results of this study can be summarized as follows:
(1)
The calibration and validation results for the inflow and storage of 10 dam and weir points in the Nakdong River Basin showed R2 values that ranged from 0.71 to 0.90 and NSE values that ranged from 0.59 to 0.78. RMSE ranged from 1.14 to 1.69 mm/day, and PBIAS exhibited statistical values between −18.04 and 7.32%. The water quality R2 results revealed that the R2 of SS ranged from 0.58 to 0.83 and that that of T-N ranged from 0.53 to 0.68. T-P exhibited a correlation between 0.56 and 0.79. The results showed that the statistical analysis results were significant for all the calibration and validation points.
(2)
Dam-weir operation scenarios were selected among the eight dam-weir-reservoir combined operation scenarios published by the Ministry of Environment (ME), the Ministry of Land, Infrastructure, and Transport (MOLIT), and the Ministry of Agriculture, Food and Rural Affairs (MAFRA) on 20 March 2017. For the years 2016 and 2017, when weir release was initiated, daily release data were constructed, then simulation was performed for each scenario, and the results were finally analyzed.
(3)
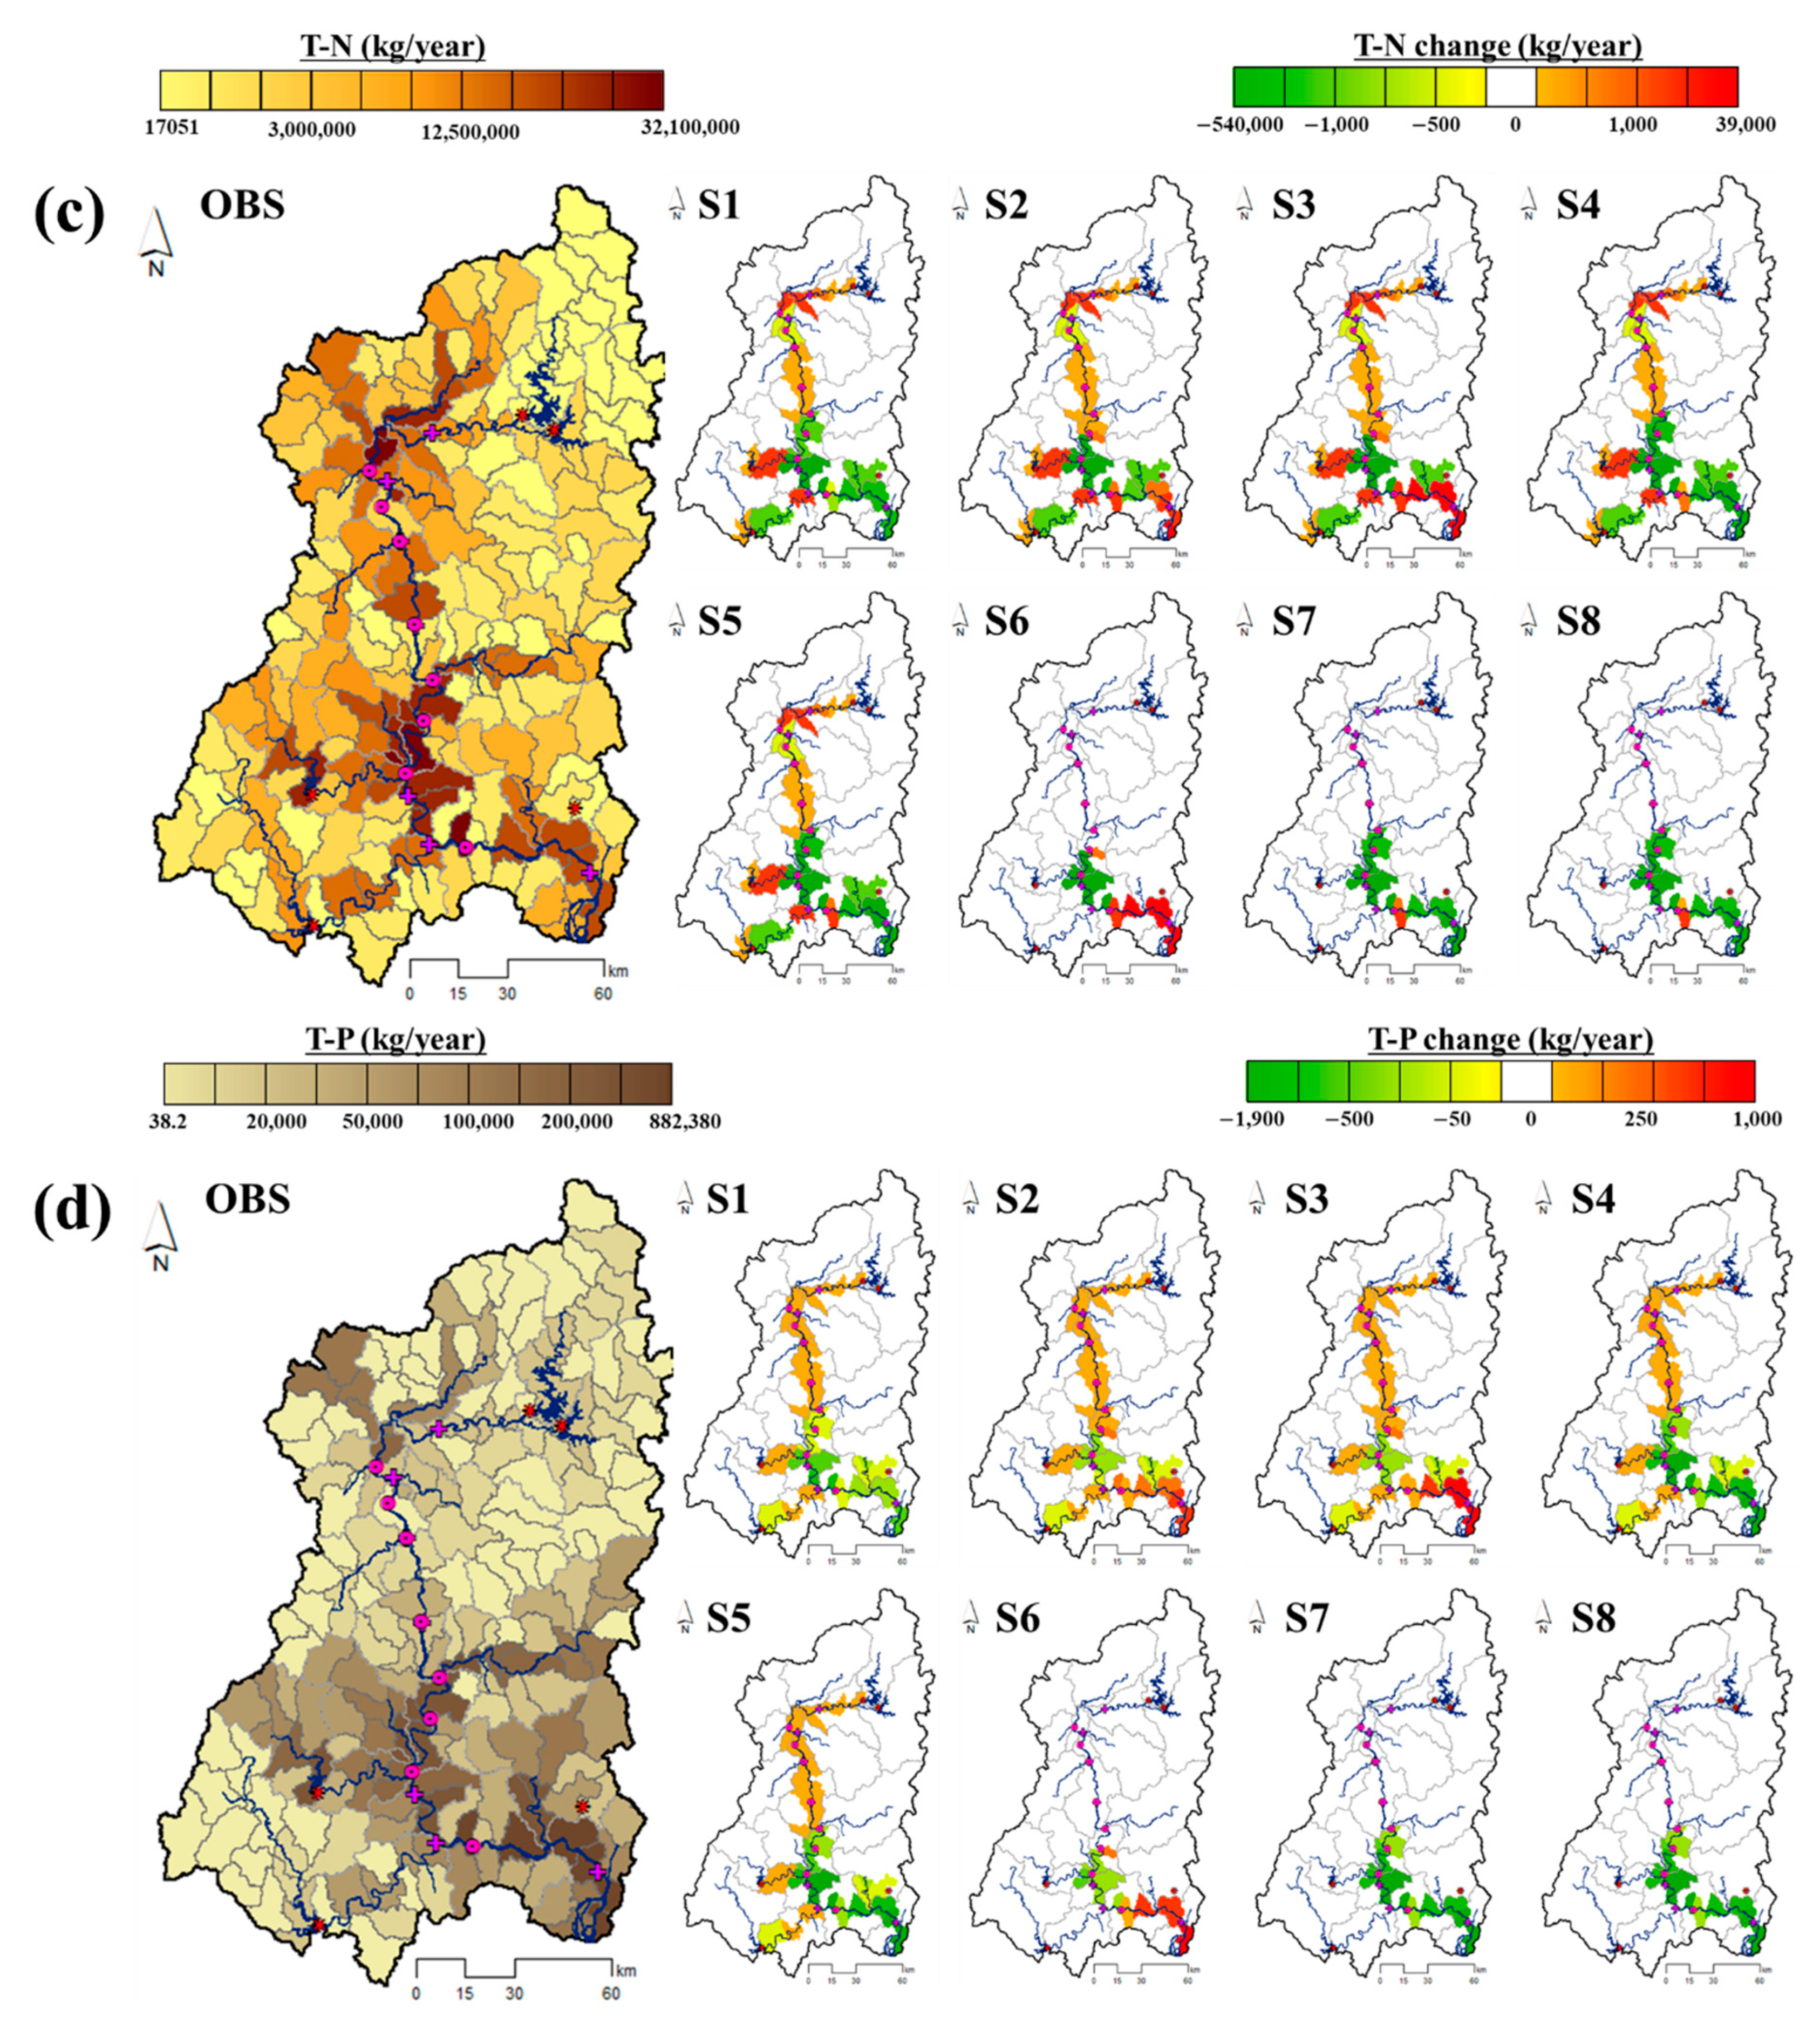
The average annual streamflow in 2017 was analyzed by scenario, and the average annual flow rate of the entire Nakdong River Basin in observed data was found to be 28.7 m3/s. Scenarios 2, 3, 4, and 5 exhibited increases in the average annual streamflow by 0.13~0.79 m3/s compared to the observed data due to the simultaneous release of the dams and weirs. However, water quality improvement and deterioration phenomena were different in each section.
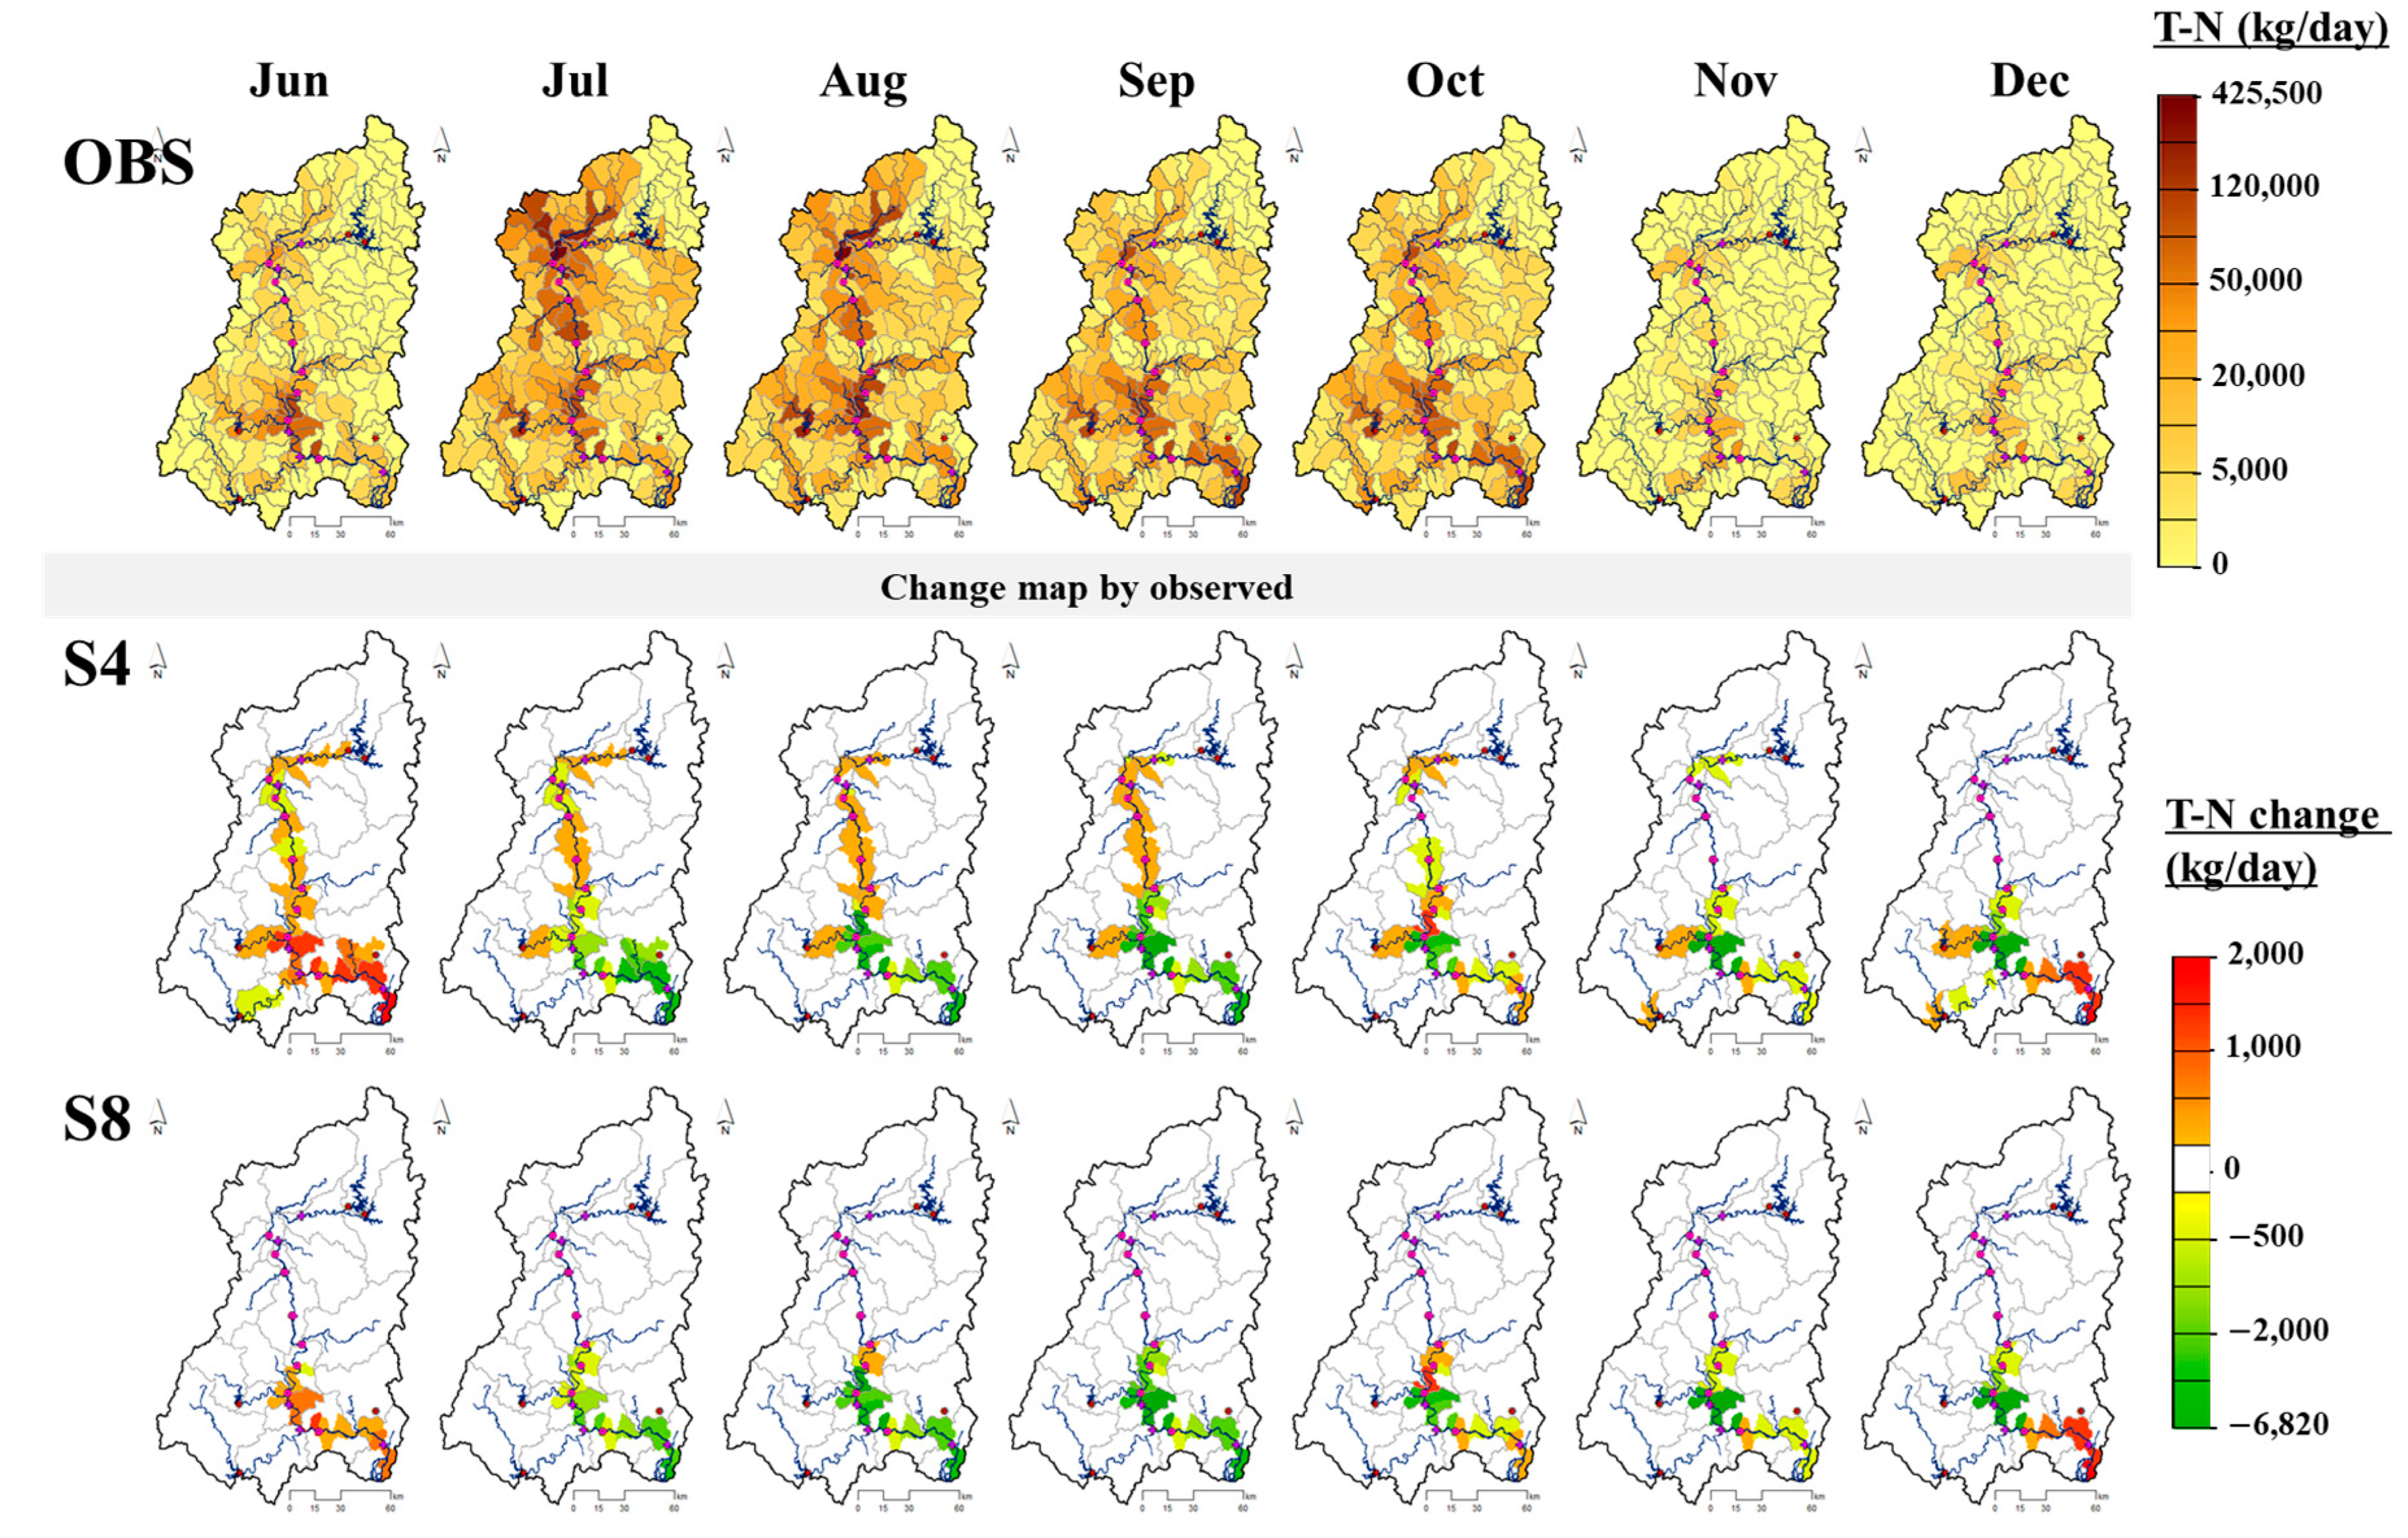
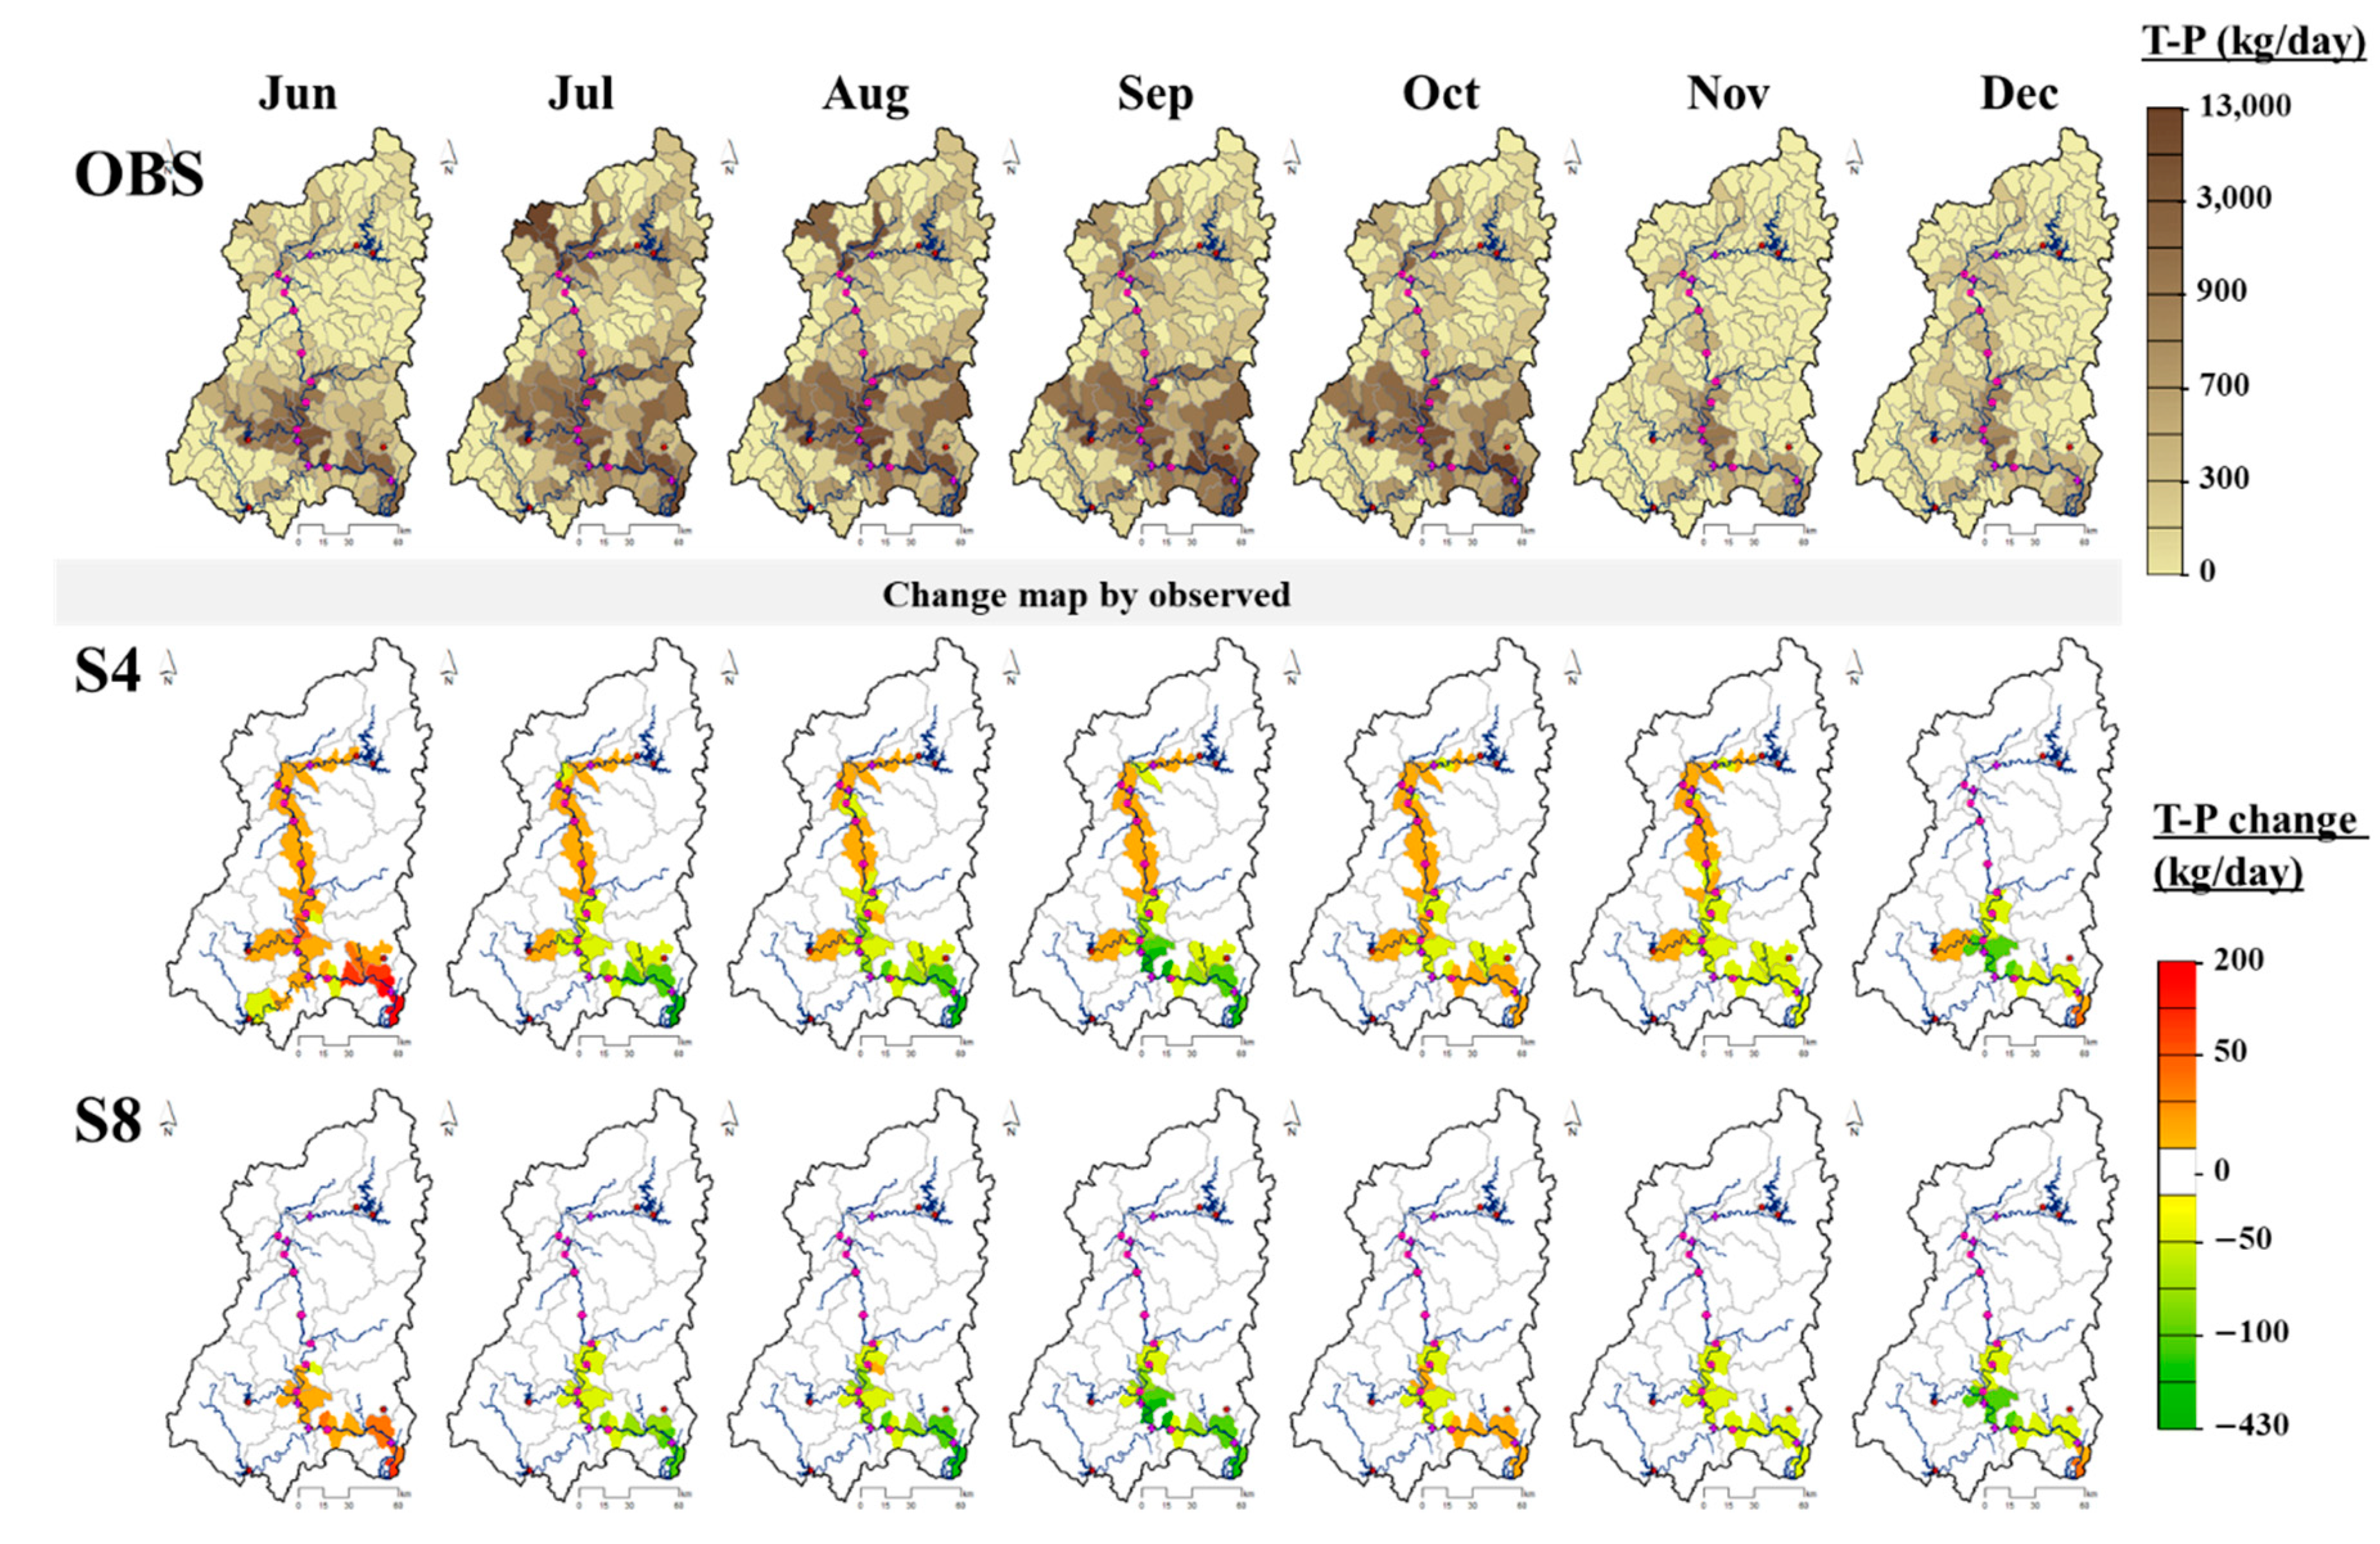
(4)
The monthly changes in streamflow and water quality (SS, T-N, and T-P) from June to December in 2017 were analyzed, and Scenarios 4 and 8 exhibited water quality improvement effects compared to the observed data. The results showed that water quality improvement could be maintained through sequential weir operation while minimizing the operation of the hydrological facility.
In this study, the dam-weir-reservoir combined operation scenarios published in 2017 through the joint research of multiple ministries were applied to the SWAT model, and the water quality improvement effects of each scenario were analyzed. Based on the published research results, the dam-weir combined operation scenarios for five multi-purpose dams (ADD, IHD, HCD, NKD, MYD) and four weirs (GJW, DSW, HCW, and HAW) that operated in 2017 were simulated, and the water quality improvement effects were analyzed.
The results showed that the water quality improved in the downstream of the Nakdong River. Each release scenario resulted in different timescales and subwatershed for the improvement of water quality. Therefore, it is necessary to consider the number of release days, the release quantity of dams, and the facilities for combined operation during dam-weir combination scenarios, in addition to the existing release scenarios. Based on this, it is also necessary to derive the optimal dam-weir combined operation scenario by establishing and analyzing various combined operation scenarios for the water resources available in the watershed.
Systematic stream water quality management through hydraulic-hydrologic combined models is the basis for comprehensive stream management considering the factors of flood control, water use, and environment. Further, it is necessary to verify such academic research results and water quality management for field applications [4].
The results are expected to be used as decision-making data for dam-weir combined operation because this method of identifying and predicting streamflow and water quality interaction is a useful tool for predicting the likely outcomes of multiple scenarios. Moreover, this study enables the continuous supplementation and qualitative improvement of the results for the combined operation scenarios in the future and may aid in the construction of models to reflect changes in the environment. It will be possible to evaluate hydrologic and water quality interaction considering the change in the stream environment by combining the model with the existing real-time data.

Author Contributions

J.L. and S.K. conceived and designed the experiments; S.W. and W.K. analyzed the data; S.K. supervised the paper; and J.L. and Y.L. wrote the original draft paper. All authors have read and agreed to the published version of the manuscript.

Funding

This subject is supported by Korea Ministry of Environment (MOE) as “Water Management Research Program (79617)”.

Conflicts of Interest

The authors declare no conflict of interest.

References

  1. Ahn, J.M.; Lee, S.; Kang, T. Evaluation of dams and weirs operating for water resource management of the Geum River. Sci. Total Environ. 2014, 478, 103–115. (In Korean) [Google Scholar] [CrossRef]
  2. Na, E.H.; Park, S.Y.; Kim, J.H.; Im, S.S.; Kim, K.H. A study on spatial and temporal patterns of water quality in the middle area of the Nakdong River, Korea. J. Korean Soci. Water Environ. 2015, 31, 723–731. (In Korean) [Google Scholar] [CrossRef] [Green Version]
  3. Ministry of Environment. Occurrence of Algae (Green Algae) and Corresponding Annual Report; Ministry of Environment: Sejong-si, Korea, 2016; pp. 3–7. (In Korean)
  4. Ministry of Environment. A Study on the Water Quality Management and Construction of Watergate Link Model Considering Beam and Repair Operation Law Preparation; Research Report; Ministry of Environment: Sejong-si, Korea, 2015; p. 64. (In Korean)
  5. Fang, H.; Cheng, Y.; Yan, S. Optimization on water resource system operation policy during drought. J. Water Resour. Prot. 2011, 3, 140. [Google Scholar] [CrossRef] [Green Version]
  6. Ahn, J.M.; Cha, K.U.; Ryoo, K.S.; Lyu, S. Study of the lower duration curve characteristic by reservoir and weir couple-operating system in Geum River basin. J. Korea Water Resour. Assoc. 2011, 44, 285–293. (In Korean) [Google Scholar] [CrossRef] [Green Version]
  7. Kim, S.K. Coordinated operation of weirs and reservoirs of Nakdong River basin after the four-river restoration project. Water Future 2012, 45, 11–17. (In Korean) [Google Scholar]
  8. Ahn, J.M.; Im, T.H.; Lee, I.J.; Lee, K.L.; Jung, K.Y.; Lee, J.W.; Cheon, S.U.; Park, I.H. A study on efficiency of water supply through conjunctive operation of reservoirs and multi-function weirs in the Nakdong River. J. Korean Soc. Water Environ. 2014, 30, 138–147. (In Korean) [Google Scholar] [CrossRef]
  9. Jang, C.H. A Study on the Reevaluation of Dams and Coordinated Operation with Weirs in the Nakdong River Basin. Master’s Thesis, Seoul National University, Seoul, Korea, 2014. (In Korean). [Google Scholar]
  10. Lee, S.J.; Kim, J.W.; Lee, H.J.; Han, J.H. Analysis of Water Quality improvement of Conjunctive Operation of Weirs in the Nakdong River. In Proceedings of the Korean Society of Civil Engineers 2014 Convention, Daegu, Korea, 23–24 October 2014; pp. 195–196. (In Korean). [Google Scholar]
  11. Ryu, S.H.; Lee, I.C.; Jang, T.Y.; Kim, K.H. Analysis of water quality variation by weir construction in the Nakdong river basin. In Proceedings of the Korean Society for Marine Environment and Energy, Tongyeong, Korea, 19–20 November 2015; pp. 16–20. (In Korean). [Google Scholar]
  12. Lin, N.; Rutten, M. Estimation of reservoir inflow in data scarce region by using Sacramento rainfall runoff model—A case study for Sittaung River Basin, Myanmar. EGU Gen. Assem. Conf. Abstr. 2017, 19, 15891. [Google Scholar]
  13. Ahn, J.M.; Jung, K.Y.; Shin, D. Effects of coordinated operation of weirs and reservoirs on the water quality of the Geum River. Water 2017, 9, 423. [Google Scholar]
  14. Ahn, J.M.; Yang, D.S.; Jung, K.Y.; Shin, D.S. Assessing the coordinated operation of reservoirs and weirs for sustainable water management in the Geum River basin under climate change. Water 2018, 10, 30. [Google Scholar]
  15. Li, Y.; Cui, Q.; Li, C.; Wang, X.; Cai, Y.; Cui, G.; Yang, Z. An improved multi-objective optimization model for supporting reservoir operation of China’s South-to-North water diversion project. Sci. Total Environ. 2017, 575, 970–981. [Google Scholar] [CrossRef]
  16. Sun, X.; Luo, J.; Xie, J. Multi-Objective optimization for reservoir operation considering water diversion and power generation objectives. Water 2018, 10, 1540. [Google Scholar] [CrossRef] [Green Version]
  17. Arnold, J.G.; Williams, J.R.; Srinivasan, K.; King, W. SWAT Manual, USDA; Agricultural Research Service and Black land Research Center: Temple, TX, USA, 2005. [Google Scholar]
  18. Neitsch, S.L.; Arnold, J.G.; Kiniry, J.R.; Williams, J.R. Soil and Water Aseessment Tool (SWAT) Theoretical Documentation; Texas Water Reosurces Institute Technical Report; Texas A&M University: Temple, TX, USA, 2001; pp. 340–367. [Google Scholar]
  19. Ahn, J.M.; Lyu, S. Analysis of the coordinated operation of reservoirs and weirs during the management of Nakdong River water resources. J. Water Res. Plan. Manag. 2017, 143, 04017030. [Google Scholar] [CrossRef]
  20. Ahn, S.R.; Lee, J.W.; Jang, S.S.; Kim, S.J. Large scale SWAT watershed modeling considering multi-purpose dams and multi-function weirs operation—For Namhan River basin. J. Korea Soc. Agric. Eng. 2016, 58, 21–35. (In Korean) [Google Scholar]
  21. Ahn, S.R.; Kim, S.J. Analysis of water balance by surface–groundwater interaction using the SWAT model for the Han River basin, South Korea. Paddy Water Environ. 2018, 16, 543–560. [Google Scholar] [CrossRef]
  22. Lee, J.; Jung, C.; Kim, S.; Kim, S. Assessment of climate change impact on future groundwater-level behavior using SWAT groundwater-consumption function in Geum River basin of South Korea. Water 2019, 11, 949. [Google Scholar] [CrossRef] [Green Version]
  23. Nash, J.E.; Sutcliffe, J.V. River flow forecasting through conceptual models part I—A discussion of principles. J. Hydrol. 1970, 10, 282–290. [Google Scholar] [CrossRef]
  24. Mkhwanazi, M.; Chavez, J.L.; Rambikur, E.H. Comparison of Large aperture scintillometer and satellitebased energy balance models in sensible heat flux and crop evapotranspiration determination. Int. J. Remote Sens. Appl. 2012, 12, 24–30. [Google Scholar]
  25. Donigian, A.S., Jr. HSPF Training Workshop Handbook and CD. Lecture #19. Calibration and Verification Issues, Slide #L19-22; Presented and prepared for U.S. EPA, Office of Science and Technology; EPA Headquarters, Washington Information Center: Washington, DC, USA, 2000. [Google Scholar]
  26. Ministry of Environment. Optimal Linkage Operation Plan of Dam-Weir-Reservoir; Ministry of Environment: Sejong-si, Korea, 2017. (In Korean)
  27. Reid, I.; Bathurst, J.C.; Carling, P.A.; Walling, D.E.; Webb, B.W. Sediment erosion, transport and deposition. In Applied Fluvial Geomorphology for River Engineering and Management; Thorne, C.R., Hey, R.D., Newson, M.D., Eds.; John Wiley & Sons: Chichester, UK, 1997; pp. 106–113. [Google Scholar]
  28. Walling, D.E.; Moorehead, P.W. The particle size characteristics of fluvial suspended sediment: An overview. Hydrobiologia 1989, 176, 125–149. [Google Scholar] [CrossRef]
  29. Surbeck, C.Q.; Jiang, S.C.; Ahn, J.H.; Grant, S.B. Flow fingerprinting fecal pollution and suspended solids in stormwater runoff from an urban coastal watershed. Environ. Sci. Technol. 2016, 40, 4435–4441. [Google Scholar] [CrossRef]
  30. Zhang, H.; Huang, G.H.; Wang, D.; Zhang, X.; Li, G.; An, C.; Chu, Z.; Liao, X.; Nie, X. An integrated multi-level watershed-reservoir modeling system for examining hydrological and biogeochemical processes in small prairie watersheds. Water Res. 2012, 46, 1207–1224. [Google Scholar] [CrossRef]
  31. Shen, Z.; Qiu, J.; Hong, Q.; Chen, L. Simulation of spatial and temporal distributions of non-point source pollution load in the Three Gorges Reservoir Region. Sci. Total Environ. 2014, 493, 138–146. [Google Scholar] [CrossRef] [PubMed]
  32. Shi, Y.; Xu, G.; Wang, Y.; Engel, B.A.; Peng, H.; Zhang, W.; Cheng, M.; Dai, M. Modelling hydrology and water quality processes in the Pengxi River basin of the Three Gorges Reservoir using the soil and water assessment tool. Agric. Water Manag. 2017, 182, 24–38. [Google Scholar] [CrossRef]
Figure 1. Study area: (a) monitoring points, (b) digital elevation model (DEM), (c) soil, and (d) land use.
Sustainability 12 06845 g001
Figure 2. Flowchart of this study.
Sustainability 12 06845 g002
Figure 3. Calibration and verification results for hydrology and water quality.
Sustainability 12 06845 g003
Figure 4. Streamflow and water quality interaction in 2017. (a) river flow (b) SS (c) T-N, and (d) T-P.
Sustainability 12 06845 g004aSustainability 12 06845 g004b
Figure 5. Monthly T-N changes in 2017.
Sustainability 12 06845 g005
Figure 6. Monthly T-P changes in 2017.
Sustainability 12 06845 g006
Table 1. Water quality of Nakdong River from 2008 to 2017.
StationSS (mg/L)T-N (mg/L)T-P (mg/L)Condition of River Water
Dam & WeirWQ Monitoring
UpstreamADD, IHDAD-45.872.1440.034Good
SJWSJ-214.702.430.035Good
CGWWG11.172.960.092Good
DownstreamGJW, DSW, HCW, HCDHC27.303.280.156Fair
NKDNK-442.893.110.139Fair
HAW, MYDMG17.973.060.135Fair
Table 2. Specifications of dams and weirs.
DamReservoir Level (EL.m)Reservoir Storage (103 m3)
MWLFRLMDDLMWLFRLMDDL
ADD161.7160.0130.01,309,9201,216,420228,320
IHD164.7163.0137.0614,320565,580122,420
HCD179.0176.0140.0801,150724,070150,570
NKD46.041.032.0346,190182,37016,130
MYD210.2207.2150.076,24169,8973254
WeirOperating Water Surface Elevation (EL.m)Weir Storage (103 m3)
FloodConservationMinimumFloodConservationMinimum
SJW49.6047.043.636,80427,40012,500
NDW43.6940.037.450,85134,70022,200
GMW35.5232.522.673,38752,700500
CGW28.3925.524.5109,47075,30076,200
GJW24.0219.514.9152,42392,30044,900
DSW21.8614.06.6147,38958,6003200
HCW18.5710.52.3169,70170,0008900
HAW13.655.01.5272,870100,90044,900
EL.m: elevation meter above mean sea level; MWL: maximum water level; FRL: full reservoir level; MDDL: minimum drawdown level.
Table 3. Operating rule for coupled operation of dams and weirs.
ScenarioOBSS1S2S3S4S5S6S7S8
DAM control OOOOO
WeirGate controlRelease at the same timeO O
Release with one-month interval from upstream to downstream O O
Gate full openRelease at the same time O O
Release with one-month interval from upstream to downstream O O
OBS: observed; O: selected operation scenarios.
Table 4. Calibrated parameters for the SWAT.
ParameterDefinitionRangeYDDSJWGMWCGWCJWHCWHCDMYDNKDHAW
Runoff
CN2SCS curve number for moisture condition35 to 98+5--+5+5--+10+10+5
CH_N (2)Manning’s “n” value for main channel0.01 to 300.040.040.040.040.040.040.0140.040.0140.04
Evapotranspiration
ESCOSoil evaporation compensation coefficient0 to 10.950.750.750.750.950.950.950.950.950.95
CANMXMaximum canopy storage0 to 10011------87-
Lateral flow
SLOILSlope length of lateral subsurface flow (m)0 to 1505555555555
LAT_TIMELateral flow travel time (days)0 to 1805555555555
Groundwater
GW_DELAYDelay time for aquifer recharge (days)0 to 5009031315080701507015070
GWQMNThreshold water level in shallow aquifer for base flow (mm)0 to 5000100010001000100010001000100050010001000
ALPHA_BFBase flow recession constant0 to 10.0480.0480.0480.0480.0480.0480.0480.0240.0480.048
Reservoir
RES_ESAReservoir surface area when the reservoir is filled to the emergency spillway (ha)-561733537440095432826362185493621
RES_EVOLVolume of water needed to fill the reservoir to the emergency spillway (104 m3)-124,8002951559980449719745379,000762410,78930,920
RES_PSAReservoir surface area when the reservoir is filled to the principal spillway (ha)-538430534437092429824292055192810
RES_PVOLVolume of water needed to fill the reservoir to the principal spillway (104 m3)-121,6422751527375329234699672,407699010,09318,237
RES_VOLInitial reservoir volume (104 m3)-58,2902744525775178655688034,652438610,05312,706
RES_KHydraulic conductivity of the reservoir bottom (mm/hr)0 to 10.50.50.50.50.50.50.50.50.50.5
EVRSVLake evaporation coefficient0 to 10.60.60.60.60.60.60.60.60.60.6
ParameterDefinitionRangeAD-4SJ-2EGHCMK-4MG
SS
USLE_PUSLE equation support practice factor0 to 10.10.51111
SPCONLinear parameter for calculating the maximum amount of sediment that can be re-entrained during channel sediment routing0.0001 to 0.010.00010.00010.00010.00010.00010.0001
SPEXPExponent parameter for calculating sediment re-entrained in channel sediment routing1 to 1.51.51.51.51.51.51.5
T-N
LAT_ORGNOrganic N in the baseflow (mg/l)0 to 2000.172020801020
NPERCONitrate percolation coefficient0 to 10.250.250.250.250.250.25
SDNCOThreshold value of nutrient cycling water factor for denitrification to occur0 to 1111111
RAMMO_SUBAtmospheric deposition of ammonium0 to 10.950.950.950.950.950.95
RCN_SUBAtmospheric deposition of nitrate0 to 2222222
T-P
GWSOLPConcentration of soluble phosphorus in groundwater contribution to streamflow from sub-basin (mg P/L or ppm)0 to 10000.0180.10.10.40.10.4
LAT_ORGPOrganic P in the base flow (mg/L)0 to 200---4--
Table 5. Summary of model calibration and validation for dam inflow and water quality.
Hydrology
Evaluation CriteriaADDHCDMYDNKDSJWGMWCGWGJWHCWHAW
Dam inflow (mm)R20.730.900.900.840.710.760.760.770.800.83
NSE0.590.620.780.620.630.690.680.710.610.63
RMSE (mm/day)1.681.651.431.691.451.481.311.141.631.38
PBIAS (%)5.97−2.027.32−18.04−15.06−14.51−8.56−15.20−16.31−10.63
Dam storage (106 m3)R20.920.900.810.720.550.520.590.720.710.88
NSE0.990.620.980.921.001.001.001.001.001.00
RMSE (mm/day)1.311.650.500.910.140.160.160.270.210.22
PBIAS (%)5.9023.429.01−1.74−0.44−0.180.68−0.91−1.03−0.02
Water Quality
Evaluation CriteriaAD-4SJ-2WGHCNK-4MG
SS (ton/day)R20.690.740.660.580.830.62
% Diff29.622.925.411.79.42.6
TN (kg/day)R20.590.530.680.540.540.56
% Diff2.58.62.45.414.813.4
TP (kg/day)R20.560.790.590.560.610.57
% Diff19.411.38.59.80.431.7
Table 6. Changes in river flow and water quality compared with observed data at MG stations.
ComponentOBSS1S2S3S4S5S6S7S8
Flow (m3/s)304.42302.49307.97306.13325.35322.20302.76324.24318.82
(−0.63)(1.17)(0.56)(6.88)(5.84)(−0.55)(6.51)(4.73)
SS (ton/day)515.00515.74516.75515.79862.66771.99513.49861.18767.94
(0.14)(0.34)(0.15)(67.51)(49.9)(−0.29)(67.22)(49.11)
T-N (kg/day)26,383.0426,294.2626,393.2926,476.1226,088.0326,092.8426,487.1226,133.8726,119.32
(−0.34)(0.04)(0.35)(−1.12)(−1.10)(0.39)(−0.94)(−1.00)
T-P (kg/day)3976.803966.793982.503989.673919.113920.053986.533920.123919.18
(−0.25)(0.14)(0.32)(−1.45)(−1.43)(0.24)(−1.43)(−1.44)
Efficiency of pollutant load reductionSS-24386175
T-N-56712843
T-P-56813742
Total-46813651
( ): Percent change by observed.

