Article

Assessment of Debris Flow Risk Factors Based on Meta-Analysis—Cases Study of Northwest and Southwest China

College of Construction Engineering, Jilin University, Changchun 130026, China
*
Author to whom correspondence should be addressed.
Sustainability 2020, 12(17), 6841; https://doi.org/10.3390/su12176841
Submission received: 29 July 2020 / Revised: 20 August 2020 / Accepted: 21 August 2020 / Published: 23 August 2020
(This article belongs to the Section Hazards and Sustainability)

Abstract

:
Debris flow is a type of special torrent containing numerous solid materials. With many types of factors affecting debris flow, there is no reliable basis for the selection of risk factors for debris flow risk assessment. Therefore, to study the factors affecting debris flow, exploring a reliable method for assessing the relative importance of these factors is a significant endeavor in debris flow prevention and control work. In this research, debris flow risk assessment was combined with meta-analysis to analyze quantitatively the relative importance of risk factors of debris flow in northwest and southwest China. The final relative importance of each factor in northwest China is as follows, maximum relative height difference > slope of main channel > maximum daily precipitation > ratio of longitudinal slope > drainage area > length of main channel. In addition, in southwest China, maximum relative height difference > maximum daily precipitation > slope of main channel > ratio of longitudinal slope > length of main channel > drainage area. The meta-analysis results were accurate, which can provide a reliable basis for the selection of debris flow risk factors in debris flow risk assessment. Furthermore, it provides strong support for the application of meta-analysis in risk assessment of other geological hazards.

1. Introduction

Debris flow is a type of sudden natural disaster in mountainous areas and a complicated natural geographical process of landmarks. Debris flow is one of the most frequent and costly hazards worldwide [1]. Debris flow disasters in the world have caused serious infrastructure damage and casualties for centuries [2]. Dilley [3] suggested that debris flows and landslides claim globally approximately 1000 lives per year. A recent detailed study by Dowling and Santi [4] showed that this number may be even higher (approximately 1200 fatalities per year) since between 1950 and 2011, at least 77,779 fatalities were recorded worldwide during 213 debris flow events in 38 countries. Debris flow also costs China up to 2 billion yuan a year in direct economic losses [5]. According to data, there are nearly 8500 debris flows distributed across 29 provinces, with an area of approximately 4.3 km × 106 km [6]. Every year, nearly 100 counties are directly endangered by debris flow, and hundreds of people lose their lives, resulting in irreparable losses [7]. Due to the complex nature of debris flows, it is quite difficult to fully understand their initiation mechanism and precisely forecast their occurrence [8,9]. Various environmental background factors affect the occurrence, development, movement, accumulation, intensity, energy, and destructive power of debris flow, which has more than 70 different types [10]. An in-depth understanding and assessment of the risks of natural hazards is necessary to develop sustainable risk management strategies including efficient damage mitigation approaches [11,12]. Therefore, the comprehensive judgment of debris flow risk should not only consider scientific and correct factors but also consider the comprehensiveness, representativeness, conciseness, and practicability of the assessment. The analysis and selection of the main impact factors of debris flow disaster and the study on the impact of these factors on debris flow risk are conducive to the exploration of the main causes of debris flow formation as well as lead to more a reasonable and targeted prevention and control of debris flow. In existing studies, scholars selected different influencing factors for their respective research objects. When Jiang Zhongxin [13] established a simple discrimination method for debris flow gulch, he selected the average of daily rainfall over many years, the storage of loose matter in the basin area, lithology, and other influencing factors. To analyze the relationship between environmental factors and landslides and debris flow disasters nationwide, Zhang [14] selected six factors, including elevation, elevation difference, slope, slope direction, vegetation type, and vegetation coverage. Based on the “2 major factors plus 14 minor factors” proposed by Liu Xilin, Chen [15] selected the maximum outflow quantity and frequency of debris flow as major factors through a preliminary screening of scatter diagram and the continued screening of rank correlation coefficient. Then, they evaluated the risk of debris flow using seven minor factors, including the length of the main channel. Zhu Liang introduced a clustering validity index to determine the clustering number, and the fuzzy C-means algorithm and factor analysis method were combined to classify 21 debris flow catchments in northeast China, the weight order of each of the factors selected were basin area > main channel length = maximum elevation difference > drainage density > average slope angle [16]. Although some methods performed better than others, no single method proved to be superior in all conditions [17]. According to the results of previous studies, the selection of debris flow impact factors can be generally divided into single-channel study and regional study, and the selection of impact factors has its emphasis depending on the research environment.
Owing to the randomness of the determination of risk factors in debris flow assessment, the use of meta-analysis to select debris flow risk assessment factors can provide a reliable basis for determining these assessment factors. In recent years, the research field has been applied to various areas, including clinical medicine [18,19,20], ecology [18,21,22,23,24,25,26,27,28], computer systems [29], and environmental and energy applications [30]. Therefore, the application of meta-analysis across domains is imperative.
The remainder of this paper is organized as follows. Section 2 describes our research methods and introduces the research question and the six related debris flow risk factors. It also presents the selection, collection and analysis data of these factors. Section 3 presents the results, starting with general information about the selected cases, followed by the analyses of the research questions. Section 4 discusses the practical relevance of the results and presents recommendations on how to diminish the risk of biases. Section 5 concludes the article.

2. Methods

2.1. Meta-Analysis

Meta-analysis is a systematic review that uses quantitative methods to summarize the results [31] (see Figure 1). The statistical purpose of meta-analysis is to summarize and combine the results of several similar independent studies to increase the sample size and improve test efficiency. Especially when the results of multiple studies are inconsistent or have no statistical significance, statistical analysis results closer to the real situation can be obtained by using meta-analysis [32]. The selection of assessment factors and results of debris flow risk assessments are uncertain. Meta-analysis can effectively exclude the trials with poorer quality, which makes the statistical results more practical [32]. The use of meta-analysis to select debris flow risk assessment factors can provide a reliable basis for determining these assessment factors.
If the results of the studies differ greatly then it may not be appropriate to combine the results. One approach is to examine statistically the degree of similarity in the studies’ outcomes—in other words, to test for heterogeneity across studies [32]. The meta-analysis process needs to analyze the heterogeneity of the results of multiple studies to eliminate the causes of heterogeneity as much as possible to achieve homogeneity. The usual test statistic (Cochran’s Q) is computed by summing the squared deviations of each study’s estimate from the overall meta-analytic estimate, weighting each study’s contribution in the same manner as in the meta-analysis [33]. If the result of tests for heterogeneity is p > 0.10, multiple studies are homogeneous, and the fixed effect model can be selected. If the result is p ≤ 0.10, and multiple studies are not homogeneous, the heterogeneity elimination analysis and treatment should be carried out first; if the heterogeneity cannot be eliminated, the random effect model can be selected. p values are obtained by comparing the statistic with a ϰ2 distribution with k − 1 degrees of freedom (where k is the number of studies) [34].
In Revman 4.2 and later software, a new heterogeneity index I2 appeared. The calculation formula is as follows:
I 2 = Q ( k 1 ) Q × 100 %
Q is the chi-square value in the tests for heterogeneity, k is the number of studies included in the meta-analysis. I2 can be used to measure the degree of heterogeneity among multiple research results [34]. In the Cochrane systematic review, heterogeneity was acceptable as long as I2 was not greater than 70%. We would tentatively assign adjectives of low, moderate, and high to I2 values of 25%, 50%, and 75%.
Forest map, the most commonly used form of result expression in the meta-analysis, was adopted in this study. This method is based on statistical effect size and statistical analysis method (confidence interval). In the statistical range, confidence interval refers to the distribution range of the real measured values, which can reflect the accuracy of the results. In this meta-analysis, the Cochrane systematic evaluation adopted the confidence interval range of 95%. In an ideal state, the objects included in the meta-analysis should be homogeneous. However, due to the differences in researchers, subjects, conditions, and other factors, the heterogeneity between studies is absolute, so a heterogeneity test is still necessary. Meta-analysis of the Q statistic test and the I2 test two methods, the two indicators can be read at the bottom of the forest figure. The parameters are as follows:
Heterogeneity :   T a u 2 = 0.00 ,   C h i 2 = 27.89 ,   d f = 29 ( P = 0.52 ) ,   I 2 = 0 %
Among the parameters, the top four items are Q statistic test parameters, and the last item is on the test parameters for I2. In the Q statistic test, the p value (p > 0.1) was mainly used, so there was no heterogeneity. Heterogeneity exists if p < 0.1. In the inspection, the I2 value was from 0 to 100%. According to the Cochrane handbook, if I2 ≤ 50%, then no heterogeneity exists; otherwise, heterogeneity exists [31]. All statistical analysis was performed by Review Manager V.5.3 (The Nordic Cochrane Centre, The Cochrane Collaboration) [35].
In the meta-analysis, heterogeneity exists naturally. If the heterogeneity is small, the fixed effect model is more reliable. If the heterogeneity is large, the random effect model is recommended. However, it is still necessary to find the basis of heterogeneity through sensitivity analysis to eliminate its influence [32].

2.2. Procedures

2.2.1. Data Collection

The data of debris flow risk assessment were collected by consulting the literature and reports on debris flow disaster and risk assessment published in Chinese and in English in the last 10 years. Data published in English were collected from the ISI-Web of Science (http://apps.webofknowledge.com/) and Google Scholar (Google Inc., Mountain View, CA, USA), while data published in Chinese were collected from the China National Knowledge Infrastructure (http://www.cnki.net/).
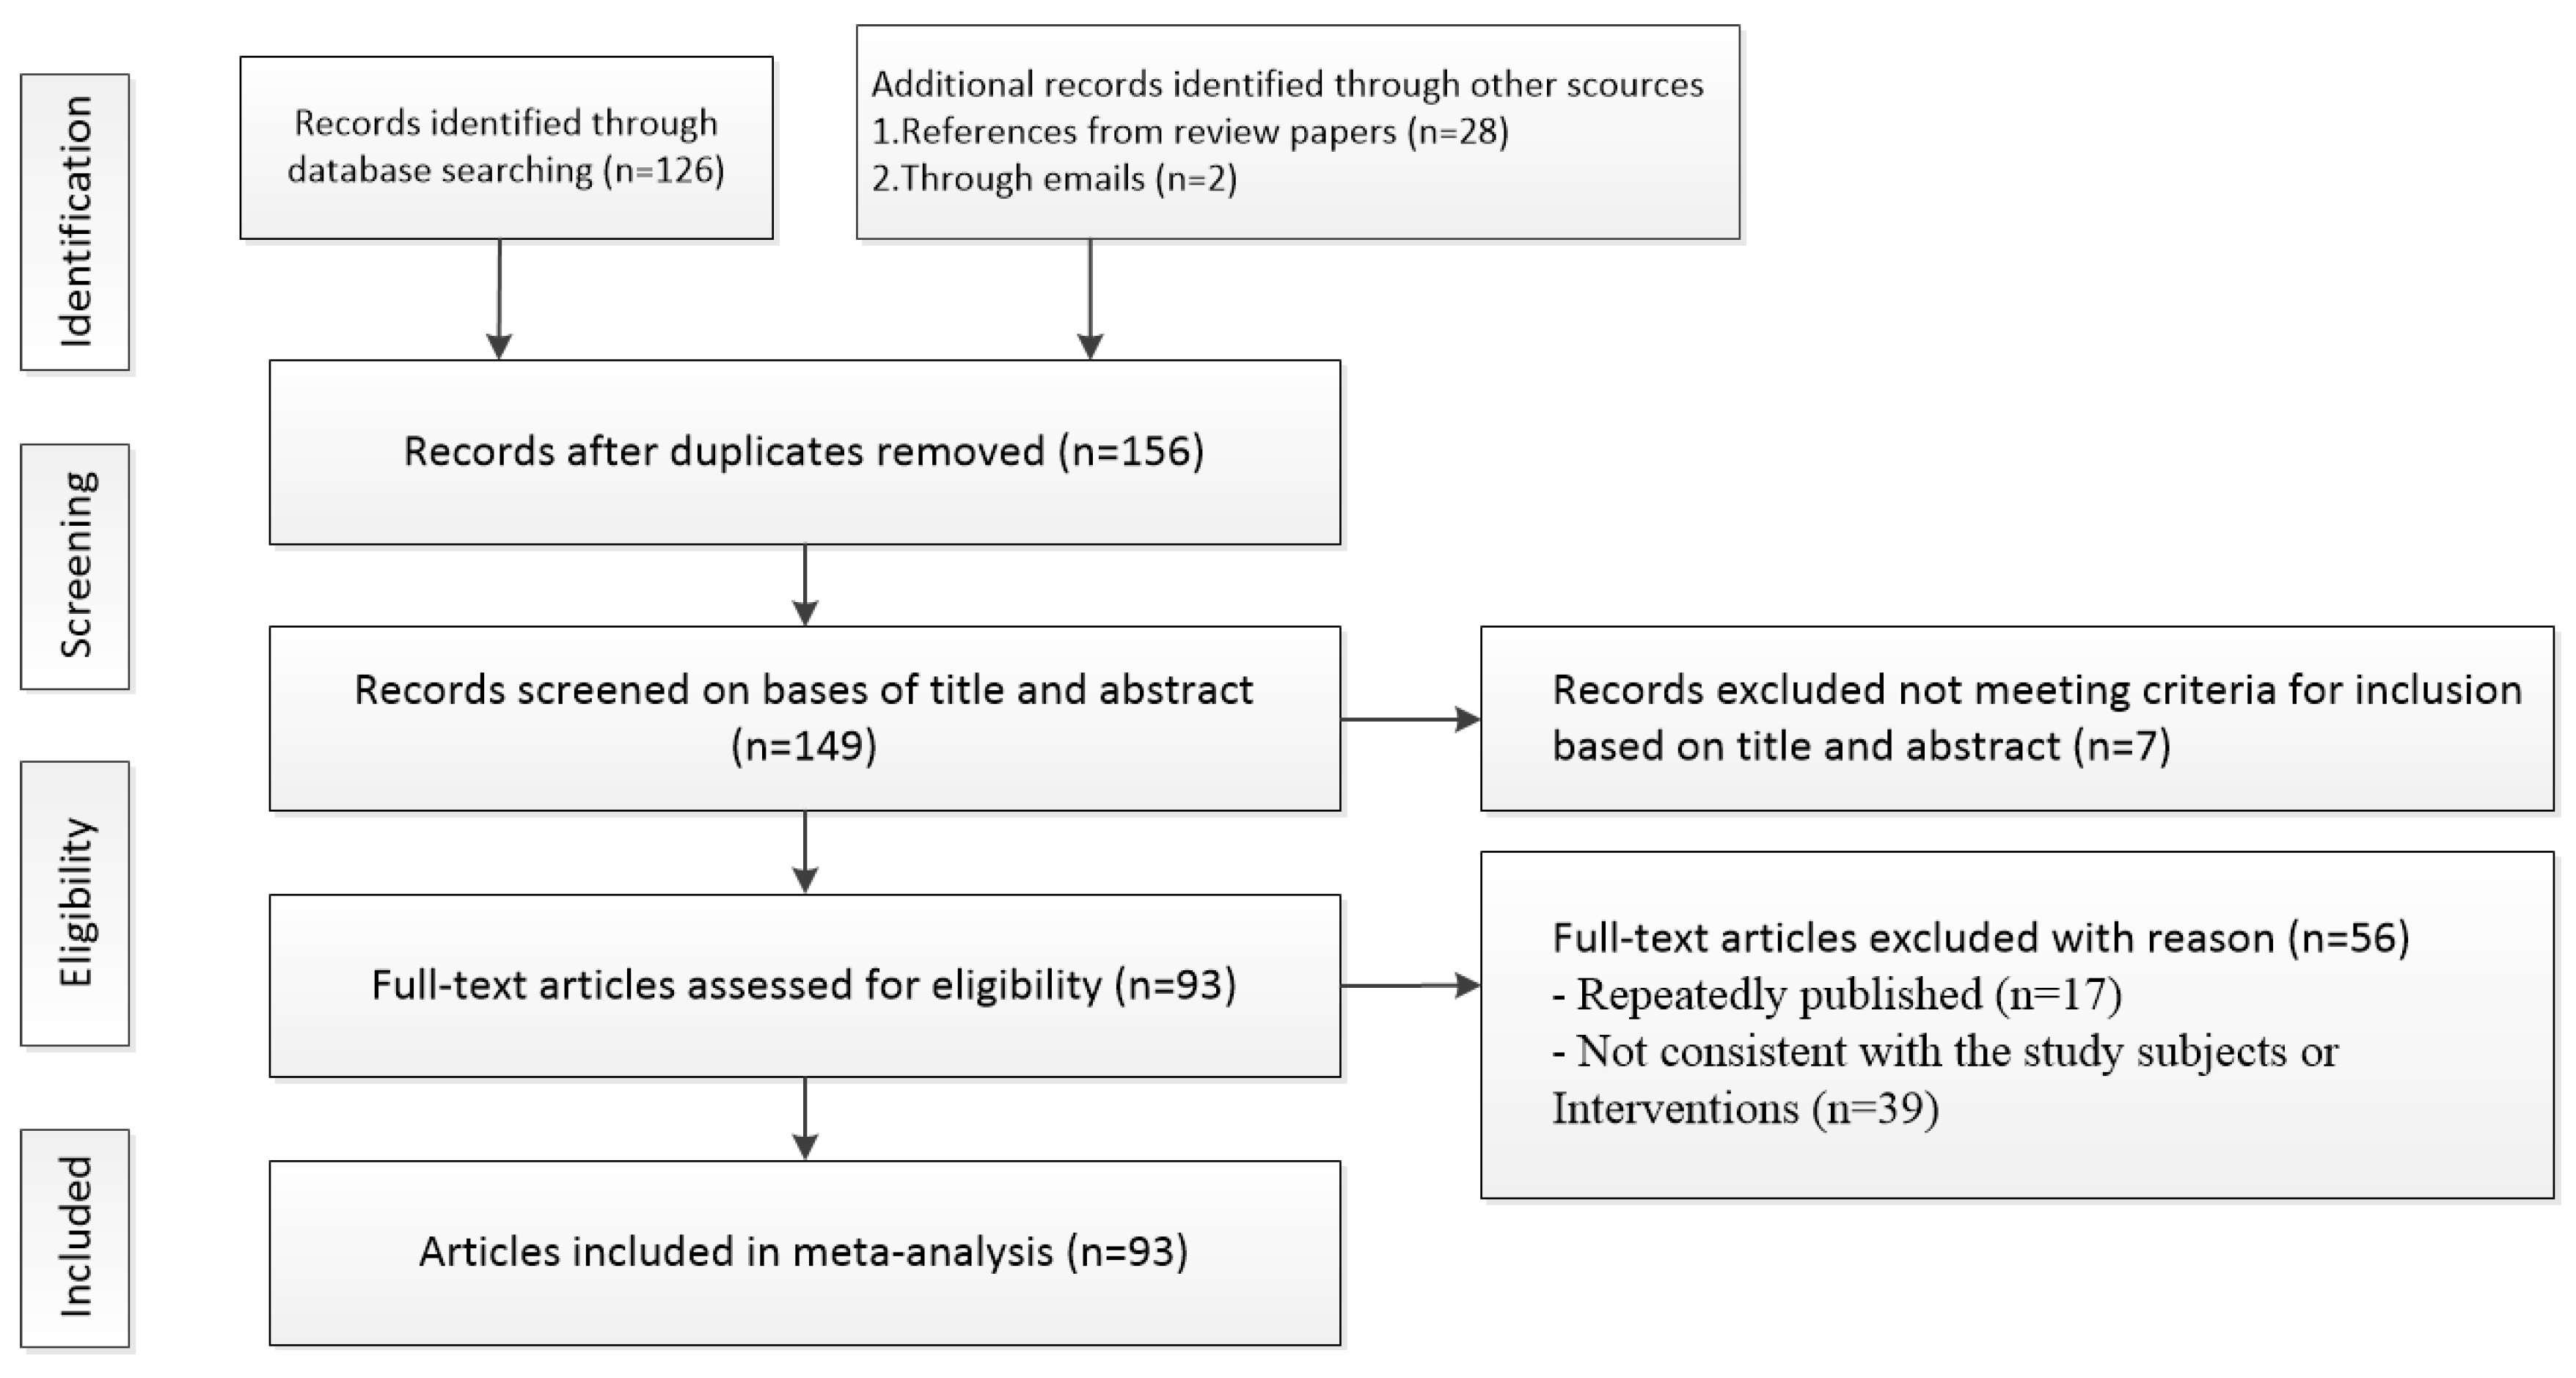
A total of 156 studies were retrieved in this paper. Among them, 149 articles that met the inclusion criteria were selected by reading the abstract, title, and full text (if necessary), and 7 were eliminated. Then, full-text articles were assessed for eligibility by the authors, and 56 were excluded. Among the excluded literature, 17 were repeatedly published, and 39 were not consistent with the study subjects or interventions. With the use of bibliometrics, the publication year, publication distribution, and literature quality (methodology and experimental design) of the included studies were analyzed. In terms of innovation theory, 26 out of the 93 references mentioned GIS support and APH model. There were 22 articles related to the grey relational degree and fuzzy judgment, 10 references to geomorphological information entropy, 14 applications of the extension method, and 21 references to the analytic hierarchy process and weight analysis. From the aspect of research level, 39 of 93 studies were about engineering technology, and 54 about basic and applied basic research. Our dataset covers a total of 183 debris flow gullies evaluated by 47 authors in northwest China and 158 debris flow gullies evaluated by 48 authors in southwest China. The procedure of the study search and selection as shown in Figure 2 and the results are as shown in Table 1.

2.2.2. Selection of Risk Factors for Debris flow

The formation and evolution of debris flow disasters are controlled by a variety of time–space factors. Most of the original data collected were analyzed by using 7 influencing factors, and most of the debris flow types were channelized debris flow [36,37]. China is a mountainous country. The mountains on the edge of the Loess Plateau and the Inner Mongolia Plateau in northwest China are Qinling Mountains, Taihang Mountains, Helan Mountains, Yinshan Mountains, Daxinganling Mountains and so on. Among them, Taihang Mountains and Helan Mountains were formed during the Cretaceous orogeny, which formed many intermountain fault basins, and accumulated huge thick sand shale in the basins; while the Great Xing’an Mountains and Qinling Mountains were formed during the Paleozoic Carboniferous to Permian orogeny, which led to the uplift of the Altai and Tianshan mountains in northern China accompanied by a large number of Granite intrusion. The Yunnan–Guizhou Plateau in the southwest falls to an altitude of 2000 ~ 1000 m, surrounded by mountains such as Ailao Mountain, Miaoling Mountain, Wumeng Mountain, Dalou Mountain, Wuling Mountain, etc., which were formed during the Triassic to Jurassic orogeny of the Mesozoic era. China covers a vast territory with significant differences between the North and the South. It also affects human activities directly or indirectly. The mountainous conditions in each region are greatly different, so the combined statistics of the influence factors (such as rock structure) with significant differences do not comply with the evaluation criteria. So, the raw data collected by some of the impact factors, such as lithology and storage of loose solids, are not appropriate for supporting this meta-analysis. In addition, taking into account the formation conditions and characteristics of debris flow and the statistical principle of meta-analysis, six influential factors with obvious digital characteristics and quantifiable characteristics are selected from the influencing factors of debris flow. These factors include maximum relative height difference (m), maximum daily precipitation (mm), ratio of longitudinal slope (%), drainage area (km2), slope of main channel (°), and length of main channel (km).
Maximum relative height difference (MHD): The difference between the highest elevation and the lowest elevation in the basin is the maximum relative elevation difference. This factor determines whether the loose material on the slope surface can be activated to provide potential energy conditions for debris flow. Generally speaking, the greater the relative height difference and the worse the slope stability, the more sufficient the dynamic conditions for debris flow, which has a greater impact on the risk assessment of debris flow.
Maximum daily precipitation (MDP): The vast majority of debris flow is triggered by (extraordinary) precipitation events [38]. Continuous rainfall and instantaneous torrential rain are conducive to the stimulation of debris flow. Continuous rainfall will increase the storage of rainwater in the soil and cause soil damage. Instantaneous rainstorms can easily form surface runoff and cause damage. For two different rain patterns, the maximum daily rainfall can reach the unified evaluation standard. It indirectly reflects the potential kinetic energy of debris flow and has a certain influence on risk assessment.
Ratio of longitudinal slope (RLS): the ratio of the difference between the elevation of the gully source and the gully mouth of the debris flow to the length of the main gully. The larger the longitudinal slope of the gully bed, the more rapid and concentrated the high-speed water flow that will be formed in the process of precipitation in a short period time. Such water flow enhances the ability of water binding and erosion and can form debris flow in a short period time. It has a great influence on risk assessment.
Drainage area (DA): this factor reflects the status of sediment yield and confluence in the basin. The accumulation of loose solid matter in the basin is affected by sediment yield, and the outbreak of debris flow is closely related to the abundance of loose matter. It has a great influence on risk assessment.
Slope of main channel (SMC): this factor has a controlling effect on the stress distribution in the slope, the packing thickness of loose materials on the slope, and the thickness of vegetation. The larger the slope, the greater the potential energy provided by the loose material source deposits, which weaken the stability of the slope. Too large a gradient can also weaken the stability of surface material.
Length of main channel (LMC): this factor reflects the flow distance of debris flow and the ability to accept loose deposits along the way. The farther the flow distance of debris flow is, the greater the energy and destructive power are. It also has a great influence on risk assessment.
In addition to the above six factors, other geological factors, such as regional lithology, structure, and weathering, and other economic factors, such as local grazing methods and human activities, also have an important impact on the occurrence of disasters. However, due to the huge regional differences of these factors, and based on the statistical principle of meta-analysis, the above indicators are difficult to quantify and cannot be selected as the impact factors of the debris flow.

2.2.3. Data Analysis

The standardized mean difference (SMD) was used as an effective indicator in this study. For continuous variables, weighted mean difference (WMD) and SMD are two important measures in meta-analysis. WMD is the difference between the average of the two sets of data. It is used when all studies in the meta-analysis have the same continuous outcome variable and measurement unit. SMD is the estimated mean difference between the two groups divided by the mean standard deviation. In this study, due to the different dimensionality of maximum relative height difference, daily maximum precipitation, and other influencing factors, dimensional influence must be eliminated in the analysis. In the effect index, SMD is obtained by dividing the estimated mean difference between the two groups by the mean standard deviation. When the dimensional effects are eliminated, the results can be combined. In SMD calculation, the expectation, standard deviation, and sample size of the original study must be identified first. The weight of the mean difference of each original study is determined by the accuracy of its effect estimation and is generally determined by variance or standard deviation. SMD, a relative indicator that is unaffected by baseline risk, has a good consistency.
Our dataset covers a total of 183 debris flow gullies evaluated by 47 authors in northwest China and 158 debris flow gullies evaluated by 48 authors in southwest China. According to the regional distribution and debris flow type (channelized debris flow), 300 debris flow gullies (150 debris flow gullies in northwest China and 150 debris flow gullies in southwest China) were selected and divided into 10 groups, a total of 30 groups. Ten debris flows in Tianjiagou [39] were selected as the experimental group and 10 debris flows in shuijinggou [40] as the control group. MHD (m), MDP (mm), RLS (%), DA (km2), SMC (°), and LMC (km), the expected value (E) and the standard deviation (SD) of the six factors are shown in Table 2 and Table 3.
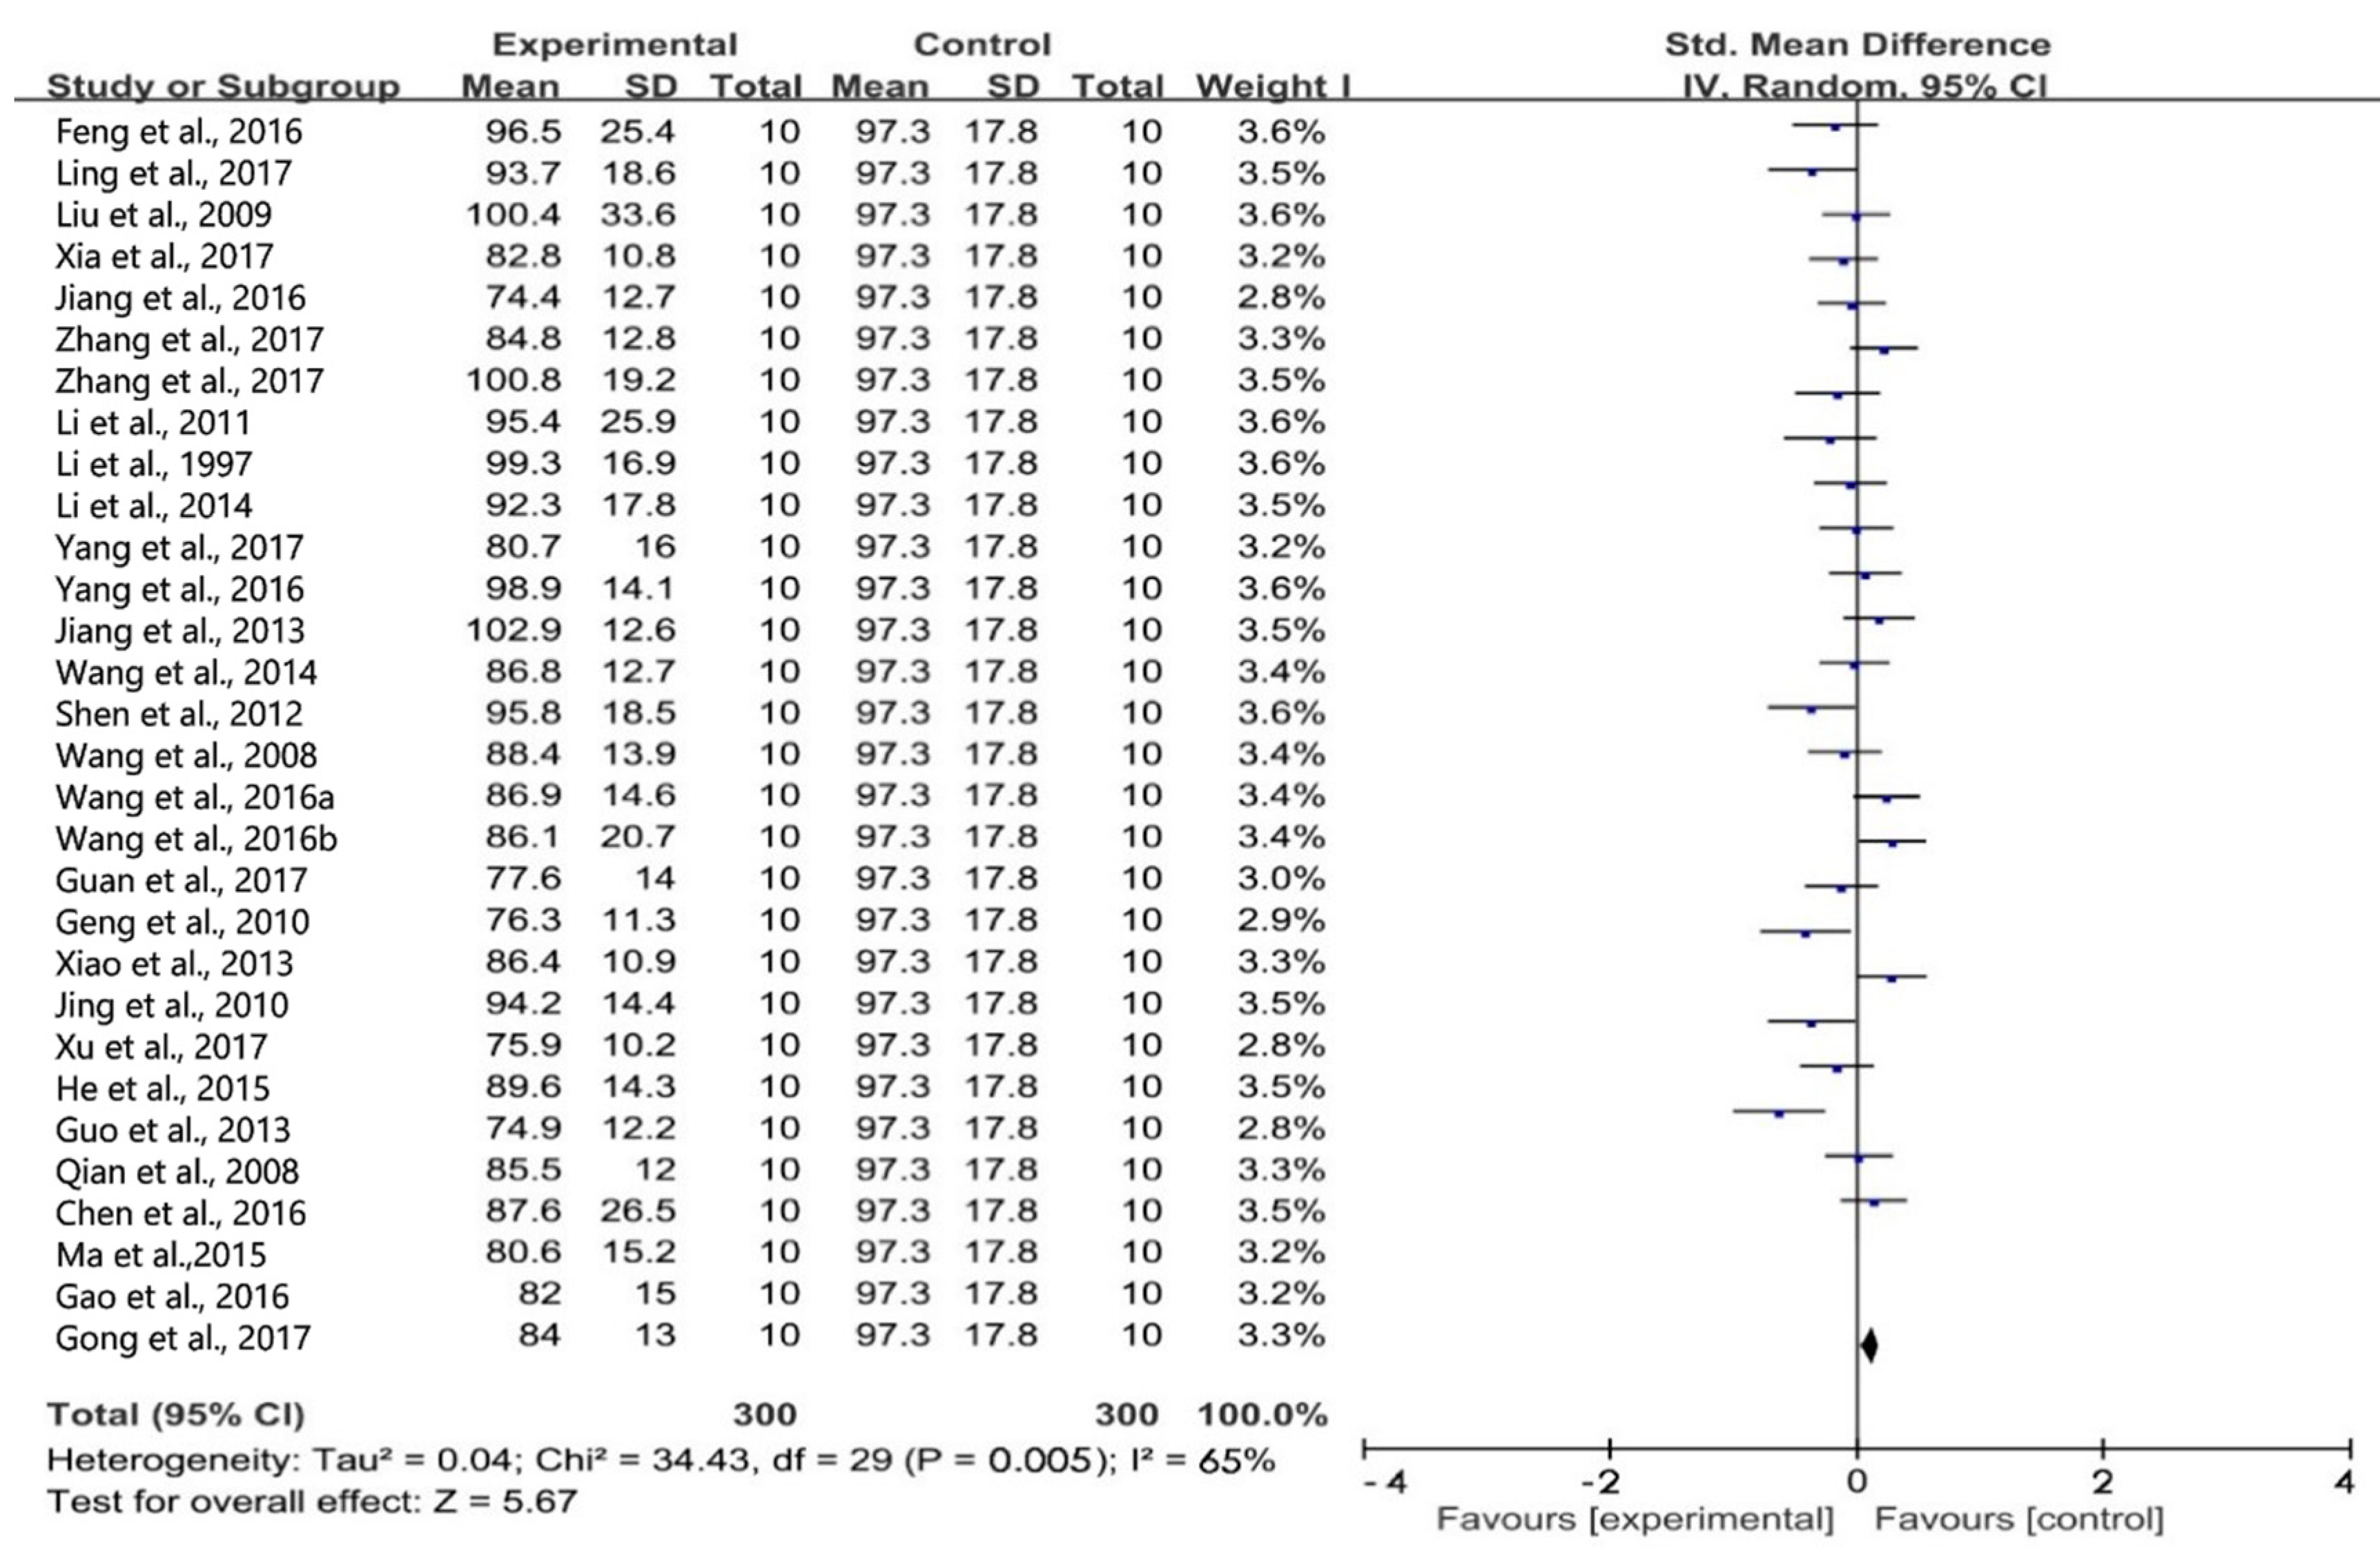
The differences in studies were estimated by forest plots. Forest plots are based on statistical indicators and statistical analysis methods and are drawn with numerical results. They describe the statistical results of meta-analysis very simply and intuitively, and is the most commonly used expression form of results in meta-analysis. After analyzing the above data, the result of MDP is shown in Figure 3 and Figure 4.
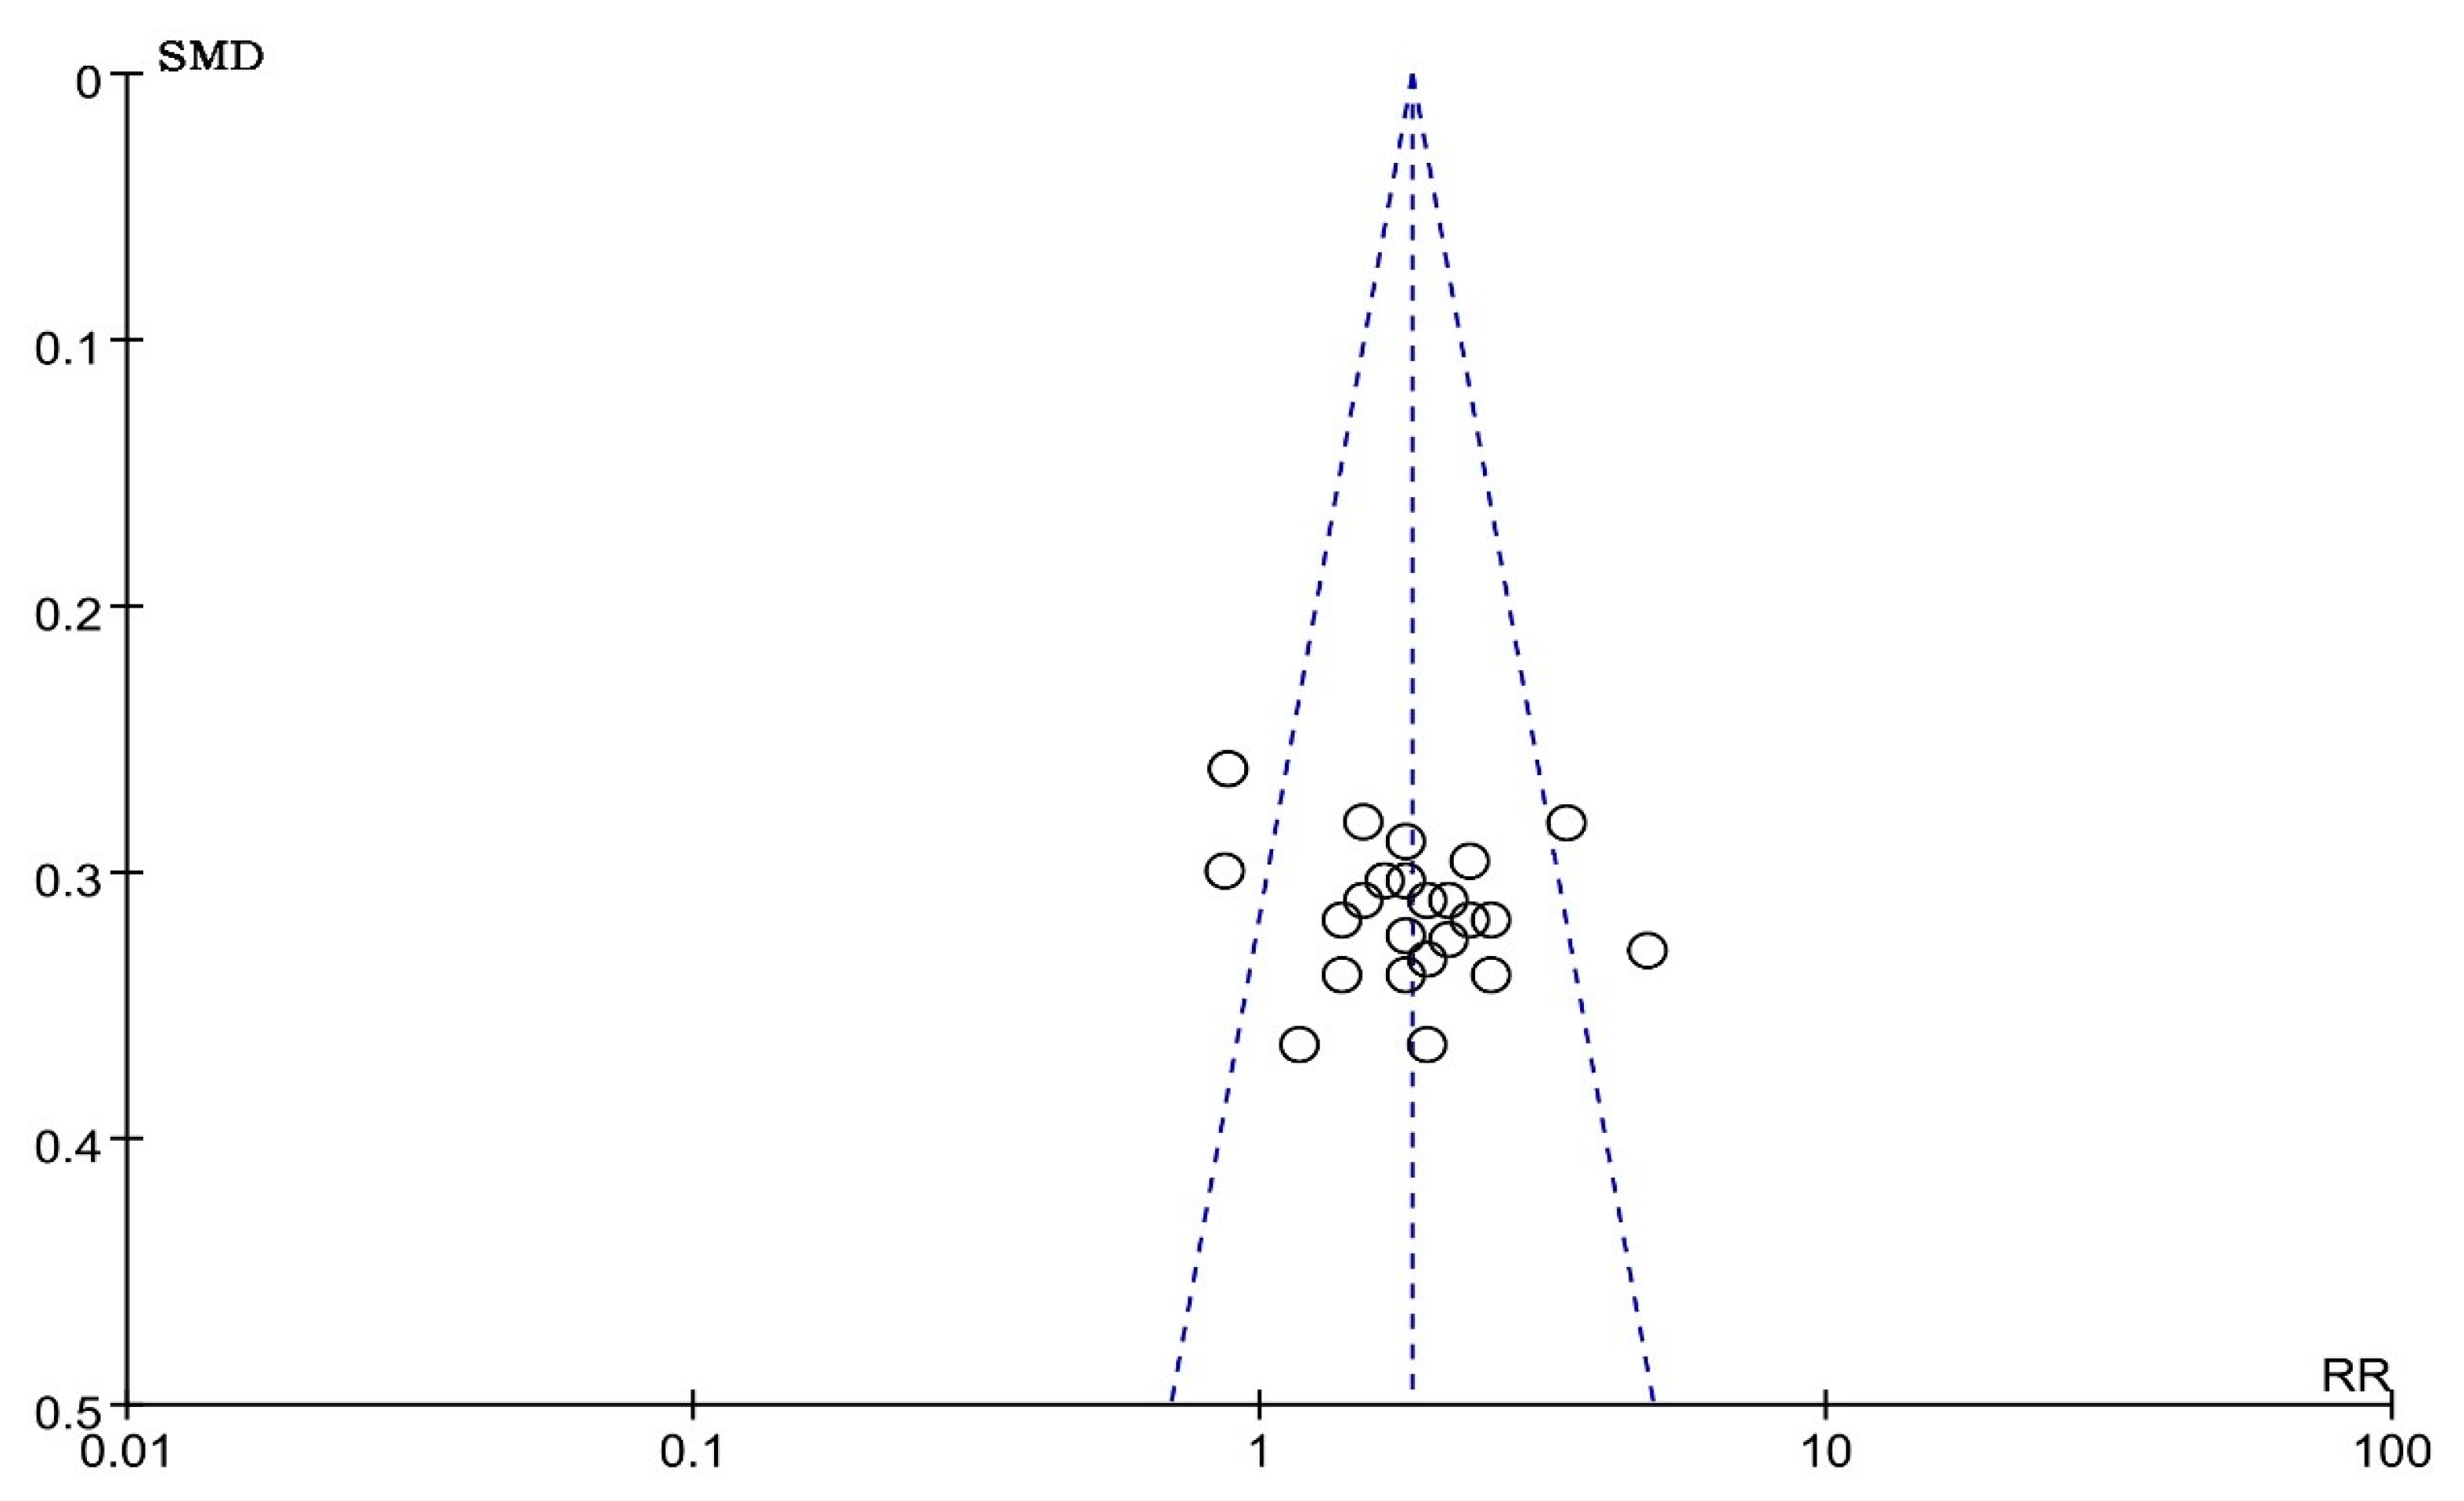
As shown in Figure 3, p = 0.005, I2 = 65%. Combined with image analysis, there is less overlap between the confidence intervals of each study, indicating that there is heterogeneity among the data, which requires further subgroup analysis. As shown in Figure 4, data points are not symmetrically arranged, and some data points are beyond the scope of the funnel, indicating heterogeneity. After a repeated search for the cause of heterogeneity, it is considered that the factors affecting debris flow in different regions are quite different, and the geological conditions and geological structure of debris flow development in different regions are different.
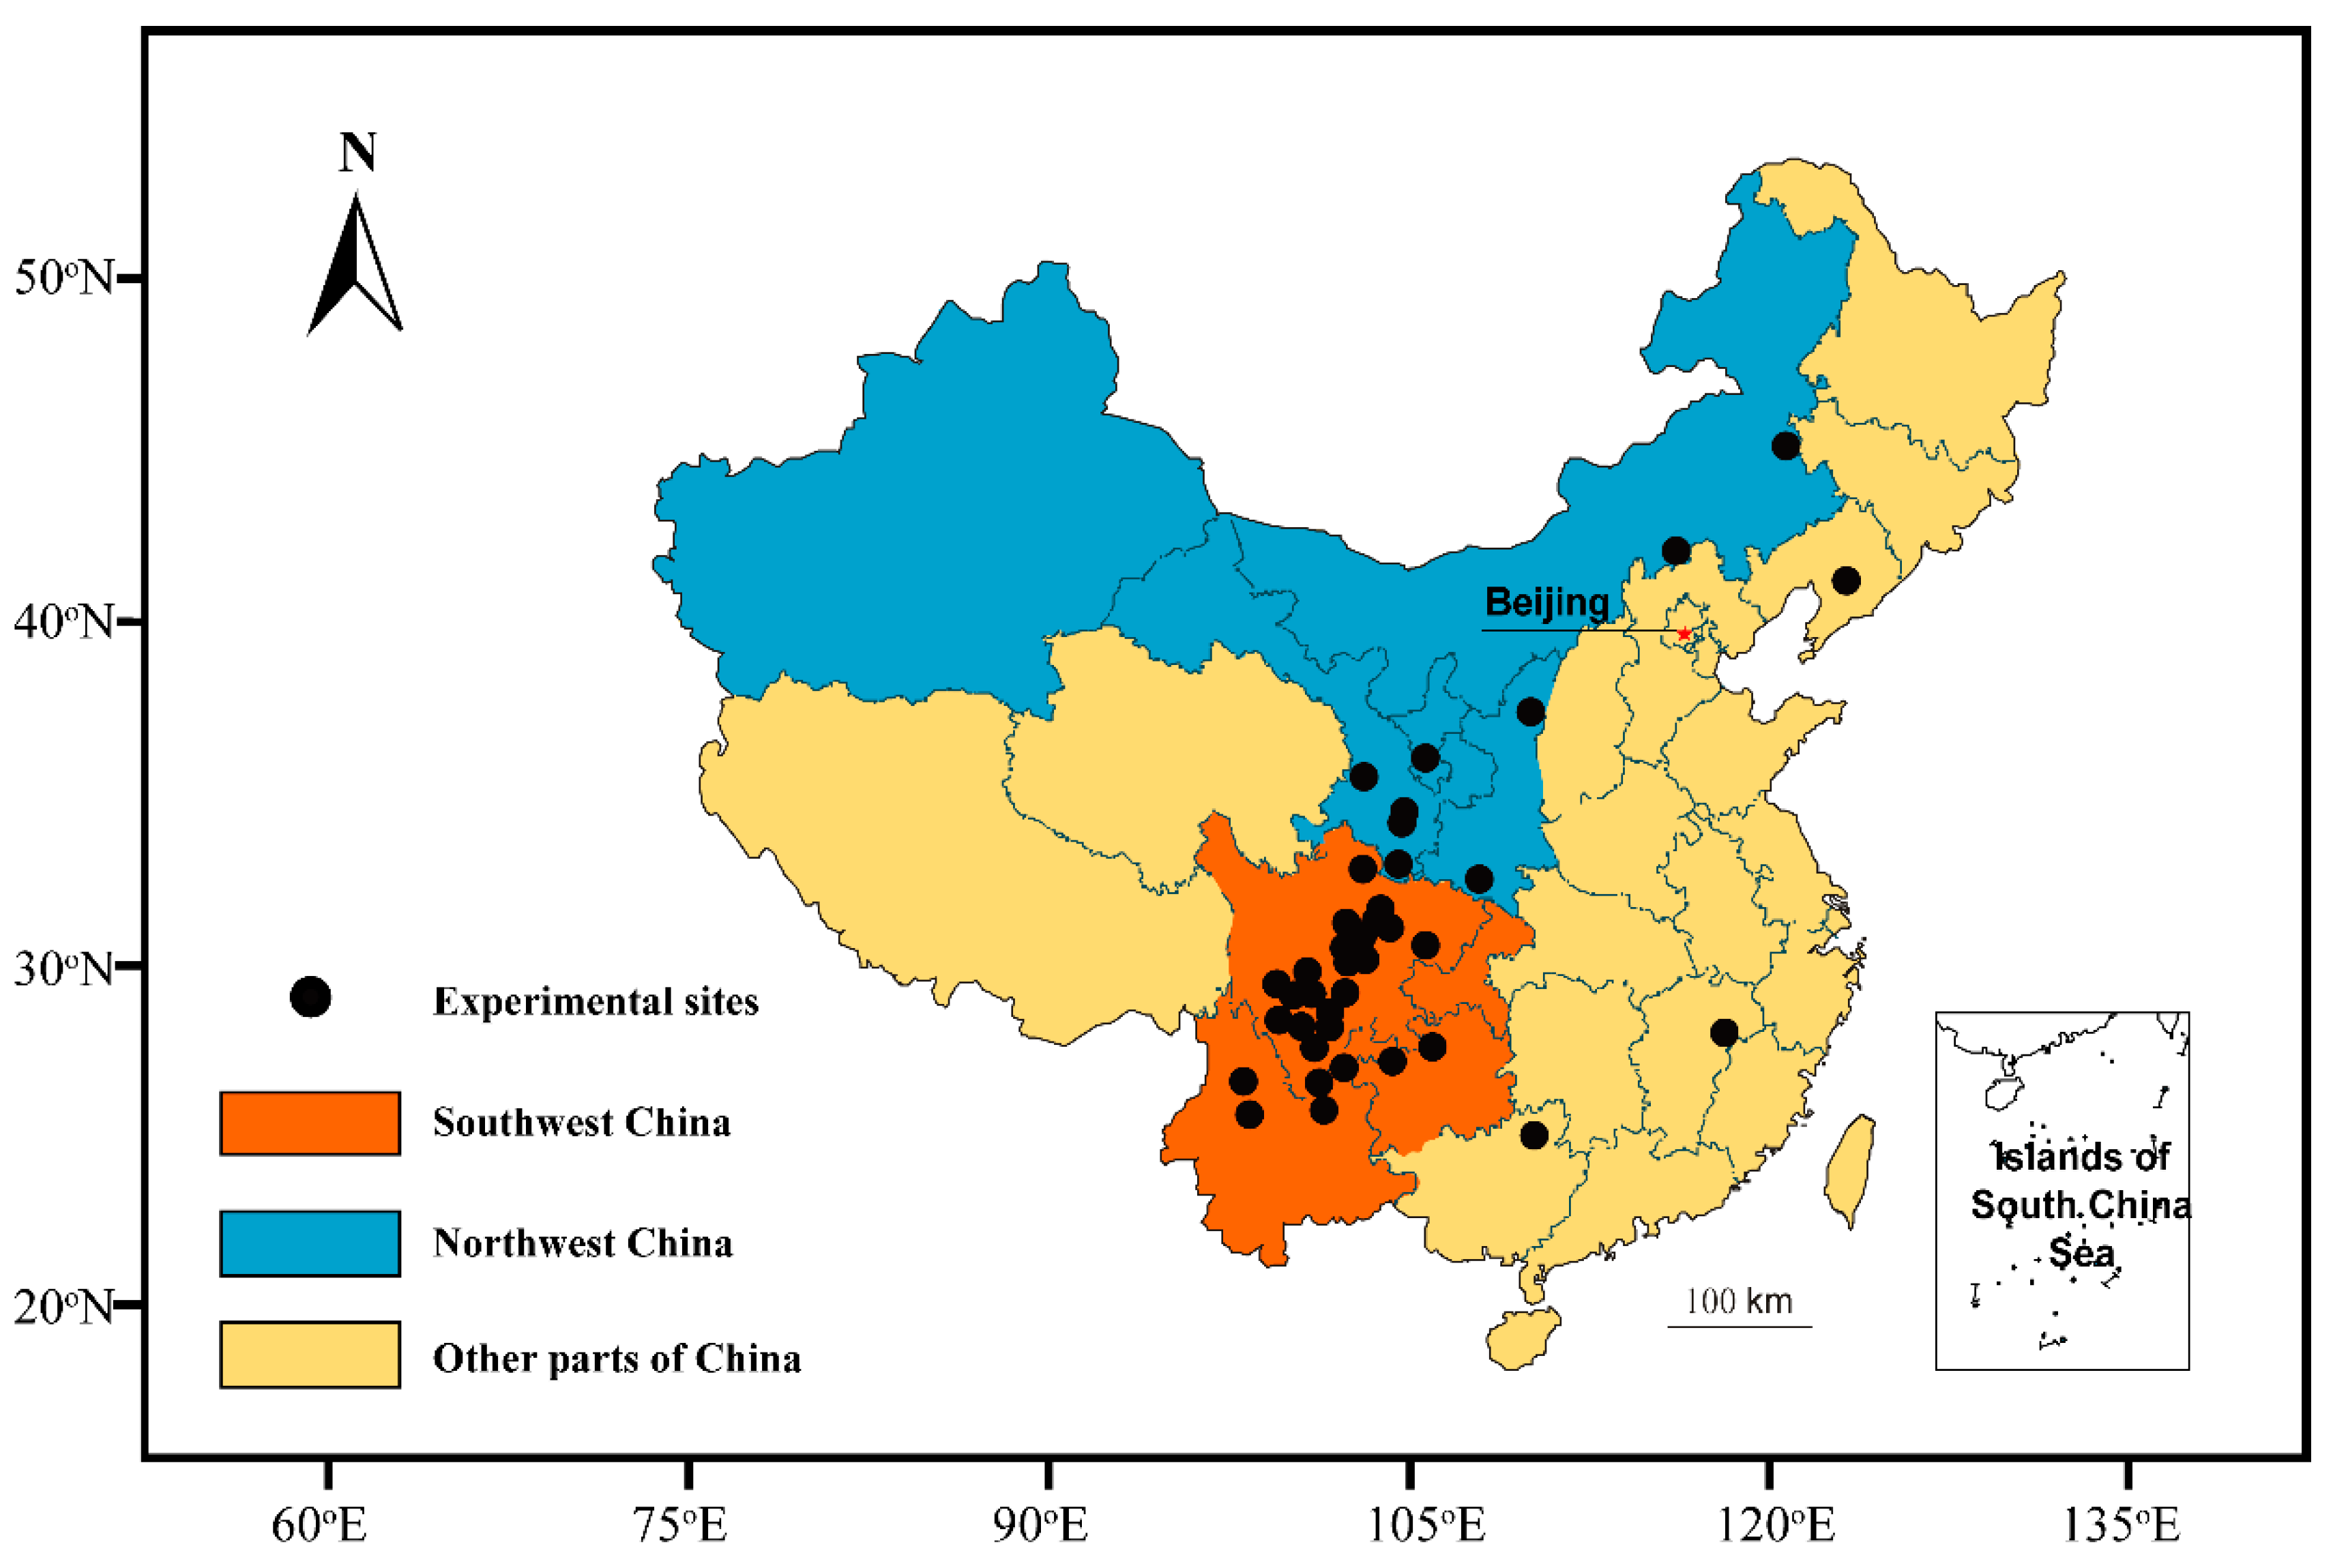
Owing to the obvious differences in geological conditions and geological structures of debris flow development in different regions, these two factors cannot be included in the meta-analysis index with specific data. The study areas were grouped into two geographic regions: northwest China and southwest China, as shown in Figure 5.
Northwest China: this zone includes Inner Mongolia, Gansu, Xinjiang, Ningxia, and Shaanxi provinces. Large and extra-large debris flows, which have the characteristics of wide distribution, large scale, and heavy disaster, are mainly distributed in this area.
Southwest China: this zone includes Guizhou, Yunnan, Chongqing, and Sichuan provinces. Debris flows in this region are widely distributed, frequently active, and seriously harmful.
SMD of the two groups (experimental group and control group) estimate the mean difference divided by the average standard deviation according to the landslide area, which is divided into northwest and southwest. These areas each have 15 groups. Among them, the northwest Tianjiagou [39] debris flow and the 10 other debris flows are treated collectively as the control group to calculate the expectations and standard deviation of MHD (m), MDP (mm), RLS (%), DA (km2), SMC (°), and LMC (km). The data are shown in Table 2.
The corresponding indexes of other experimental groups were calculated, with 10 debris flows, such as the Shuiqinggou [40] debris flow, taken as examples as shown in Table 3.
In southwest China, 10 debris flows, including the Shenjiagou debris flow in Luding County [41], Sichuan Province, were taken collectively as the control group. The expectation and standard deviation of six influencing factors were calculated in the list, as shown in Table 4.
The corresponding indexes of other experimental groups were calculated, and 10 debris flows, such as that in Ziluogou, Daocheng County [42], were taken as examples as shown in Table 5.

3. Results

3.1. Overview of the Dataset

Our dataset covers a total of 150 debris flow gullies evaluated by 45 authors in northwest China and 150 debris flow gullies evaluated by 48 authors in southwest China. The two regions are studied separately because the geomorphic and water source conditions of southwest and northwest China are quite different. Each region was divided into a control group and 14 experimental groups according to the similarity of geomorphic and water source conditions in the debris flow gully. After calculation, the expected value (E) and standard deviation (SD) of different debris flow groups in the two regions were obtained, as shown in Table 6 and Table 7, respectively.

3.2. The Influence of Six Factors on the Risk of Debris Flow

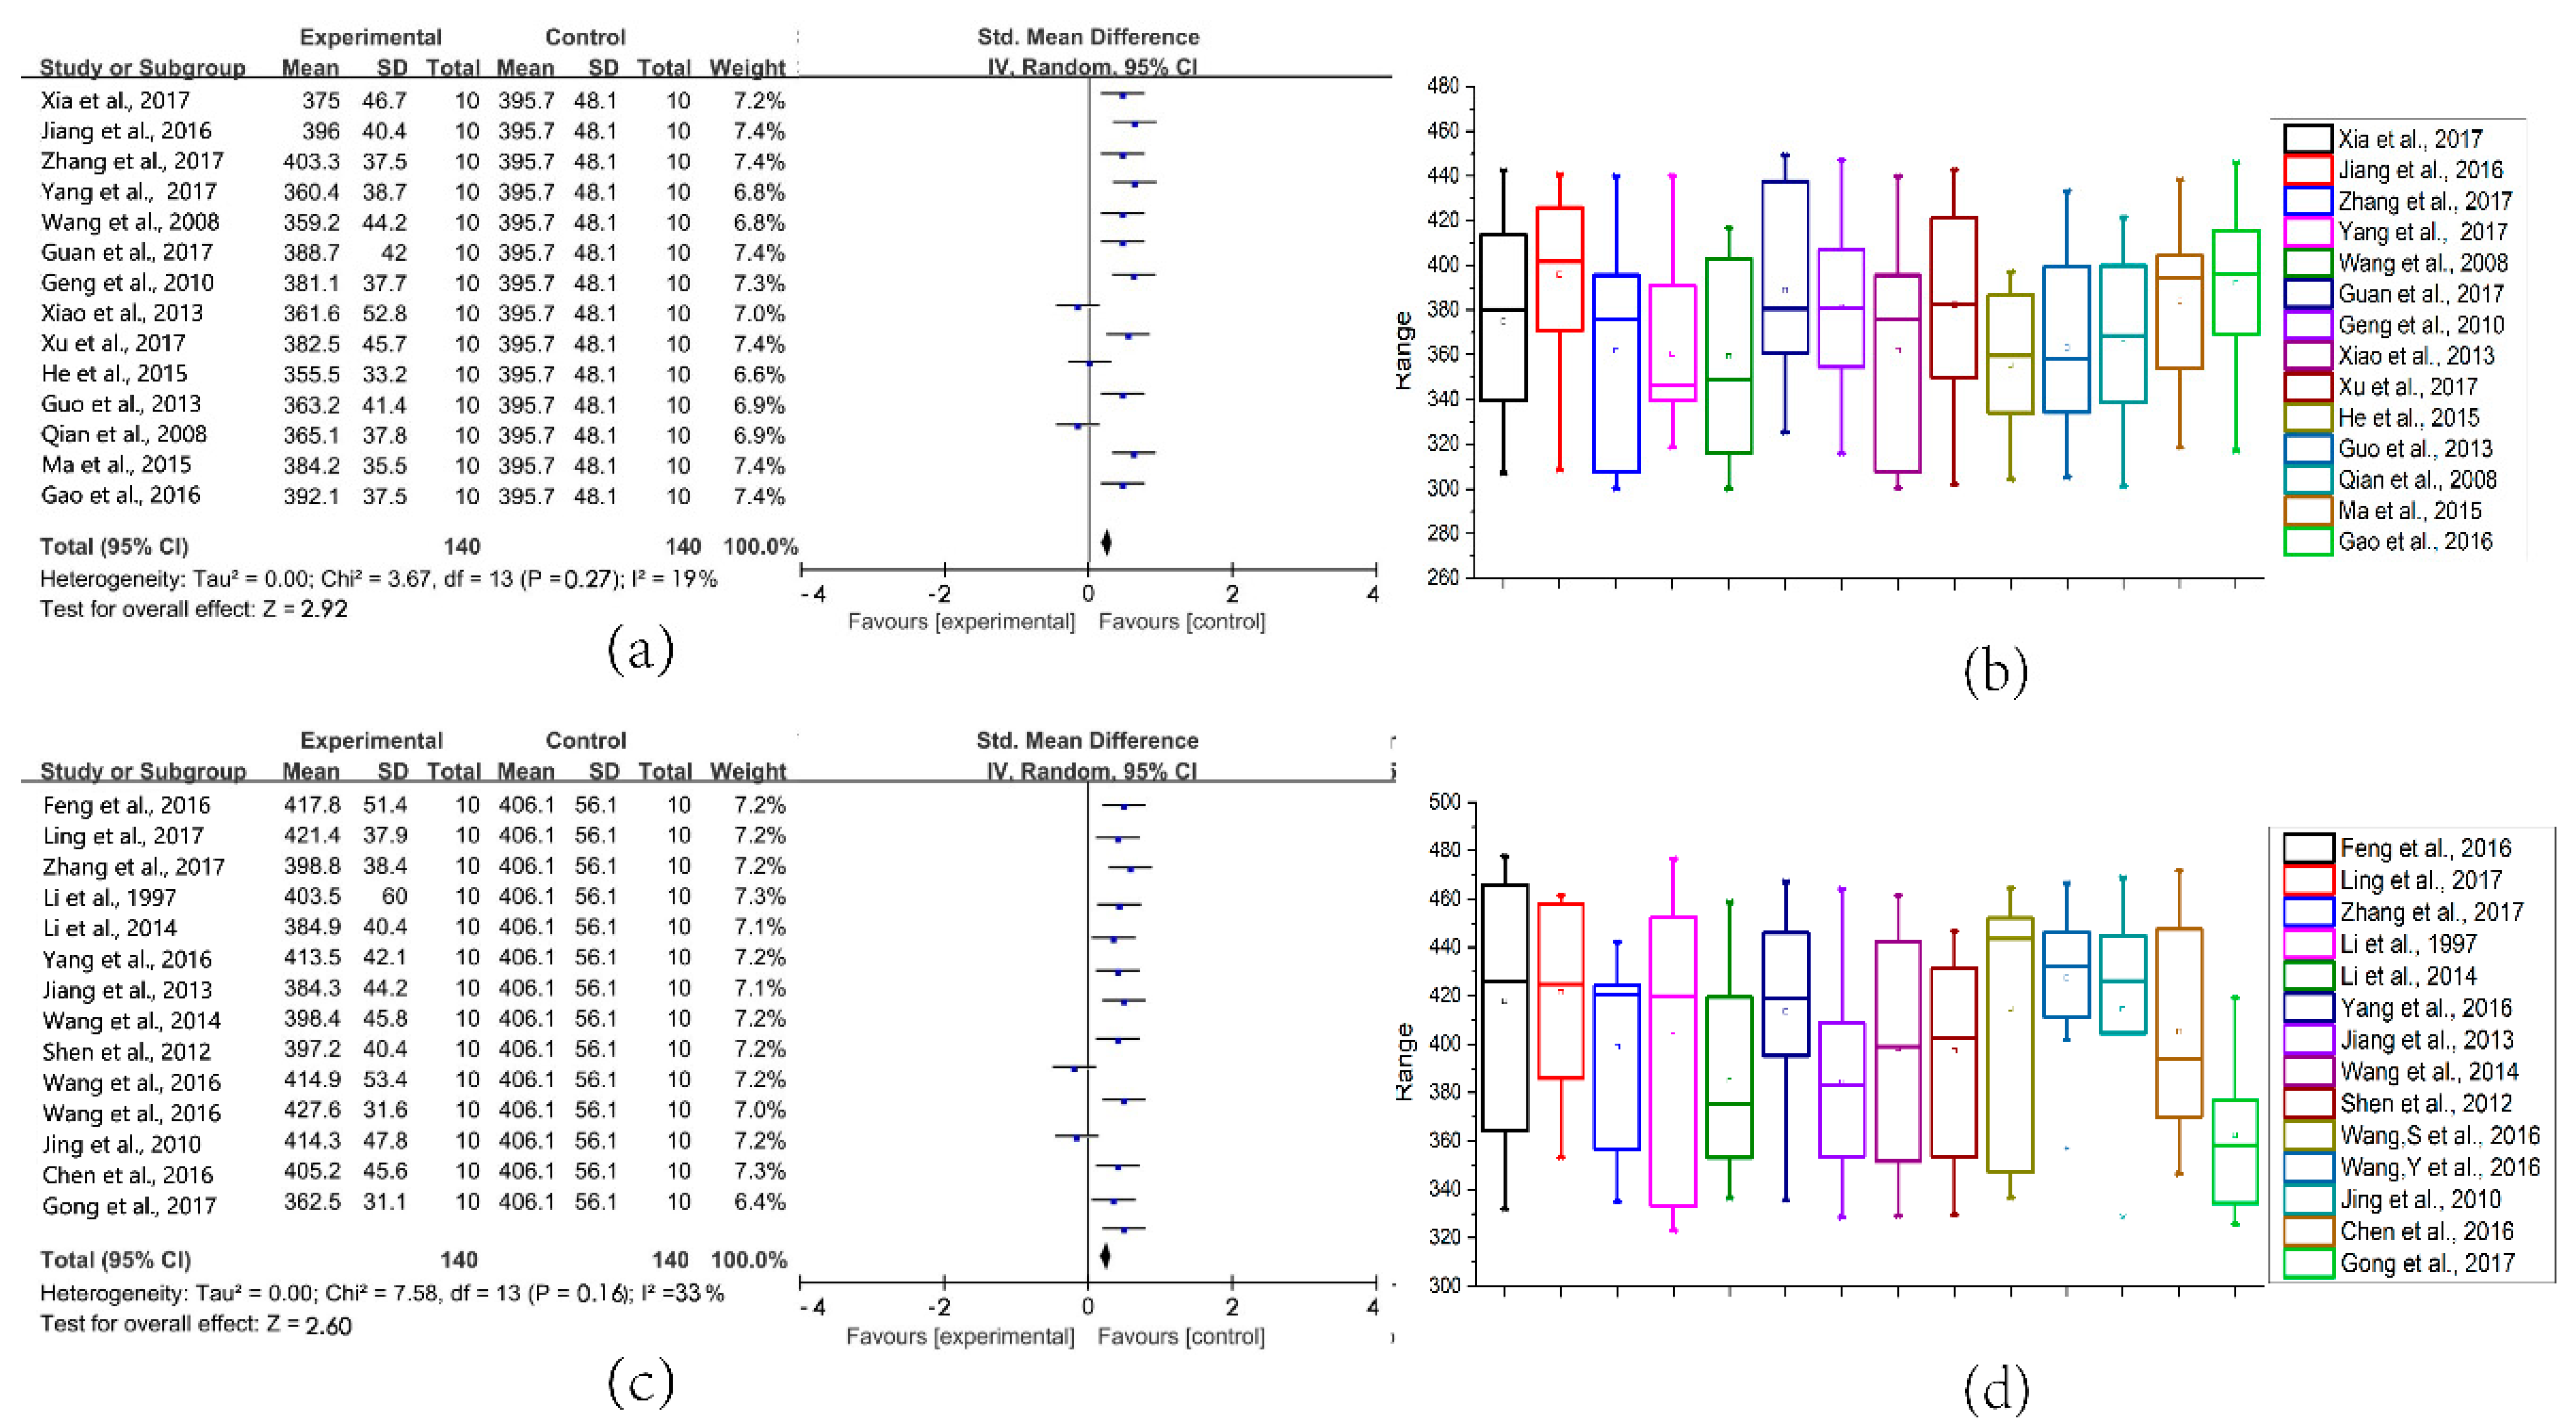
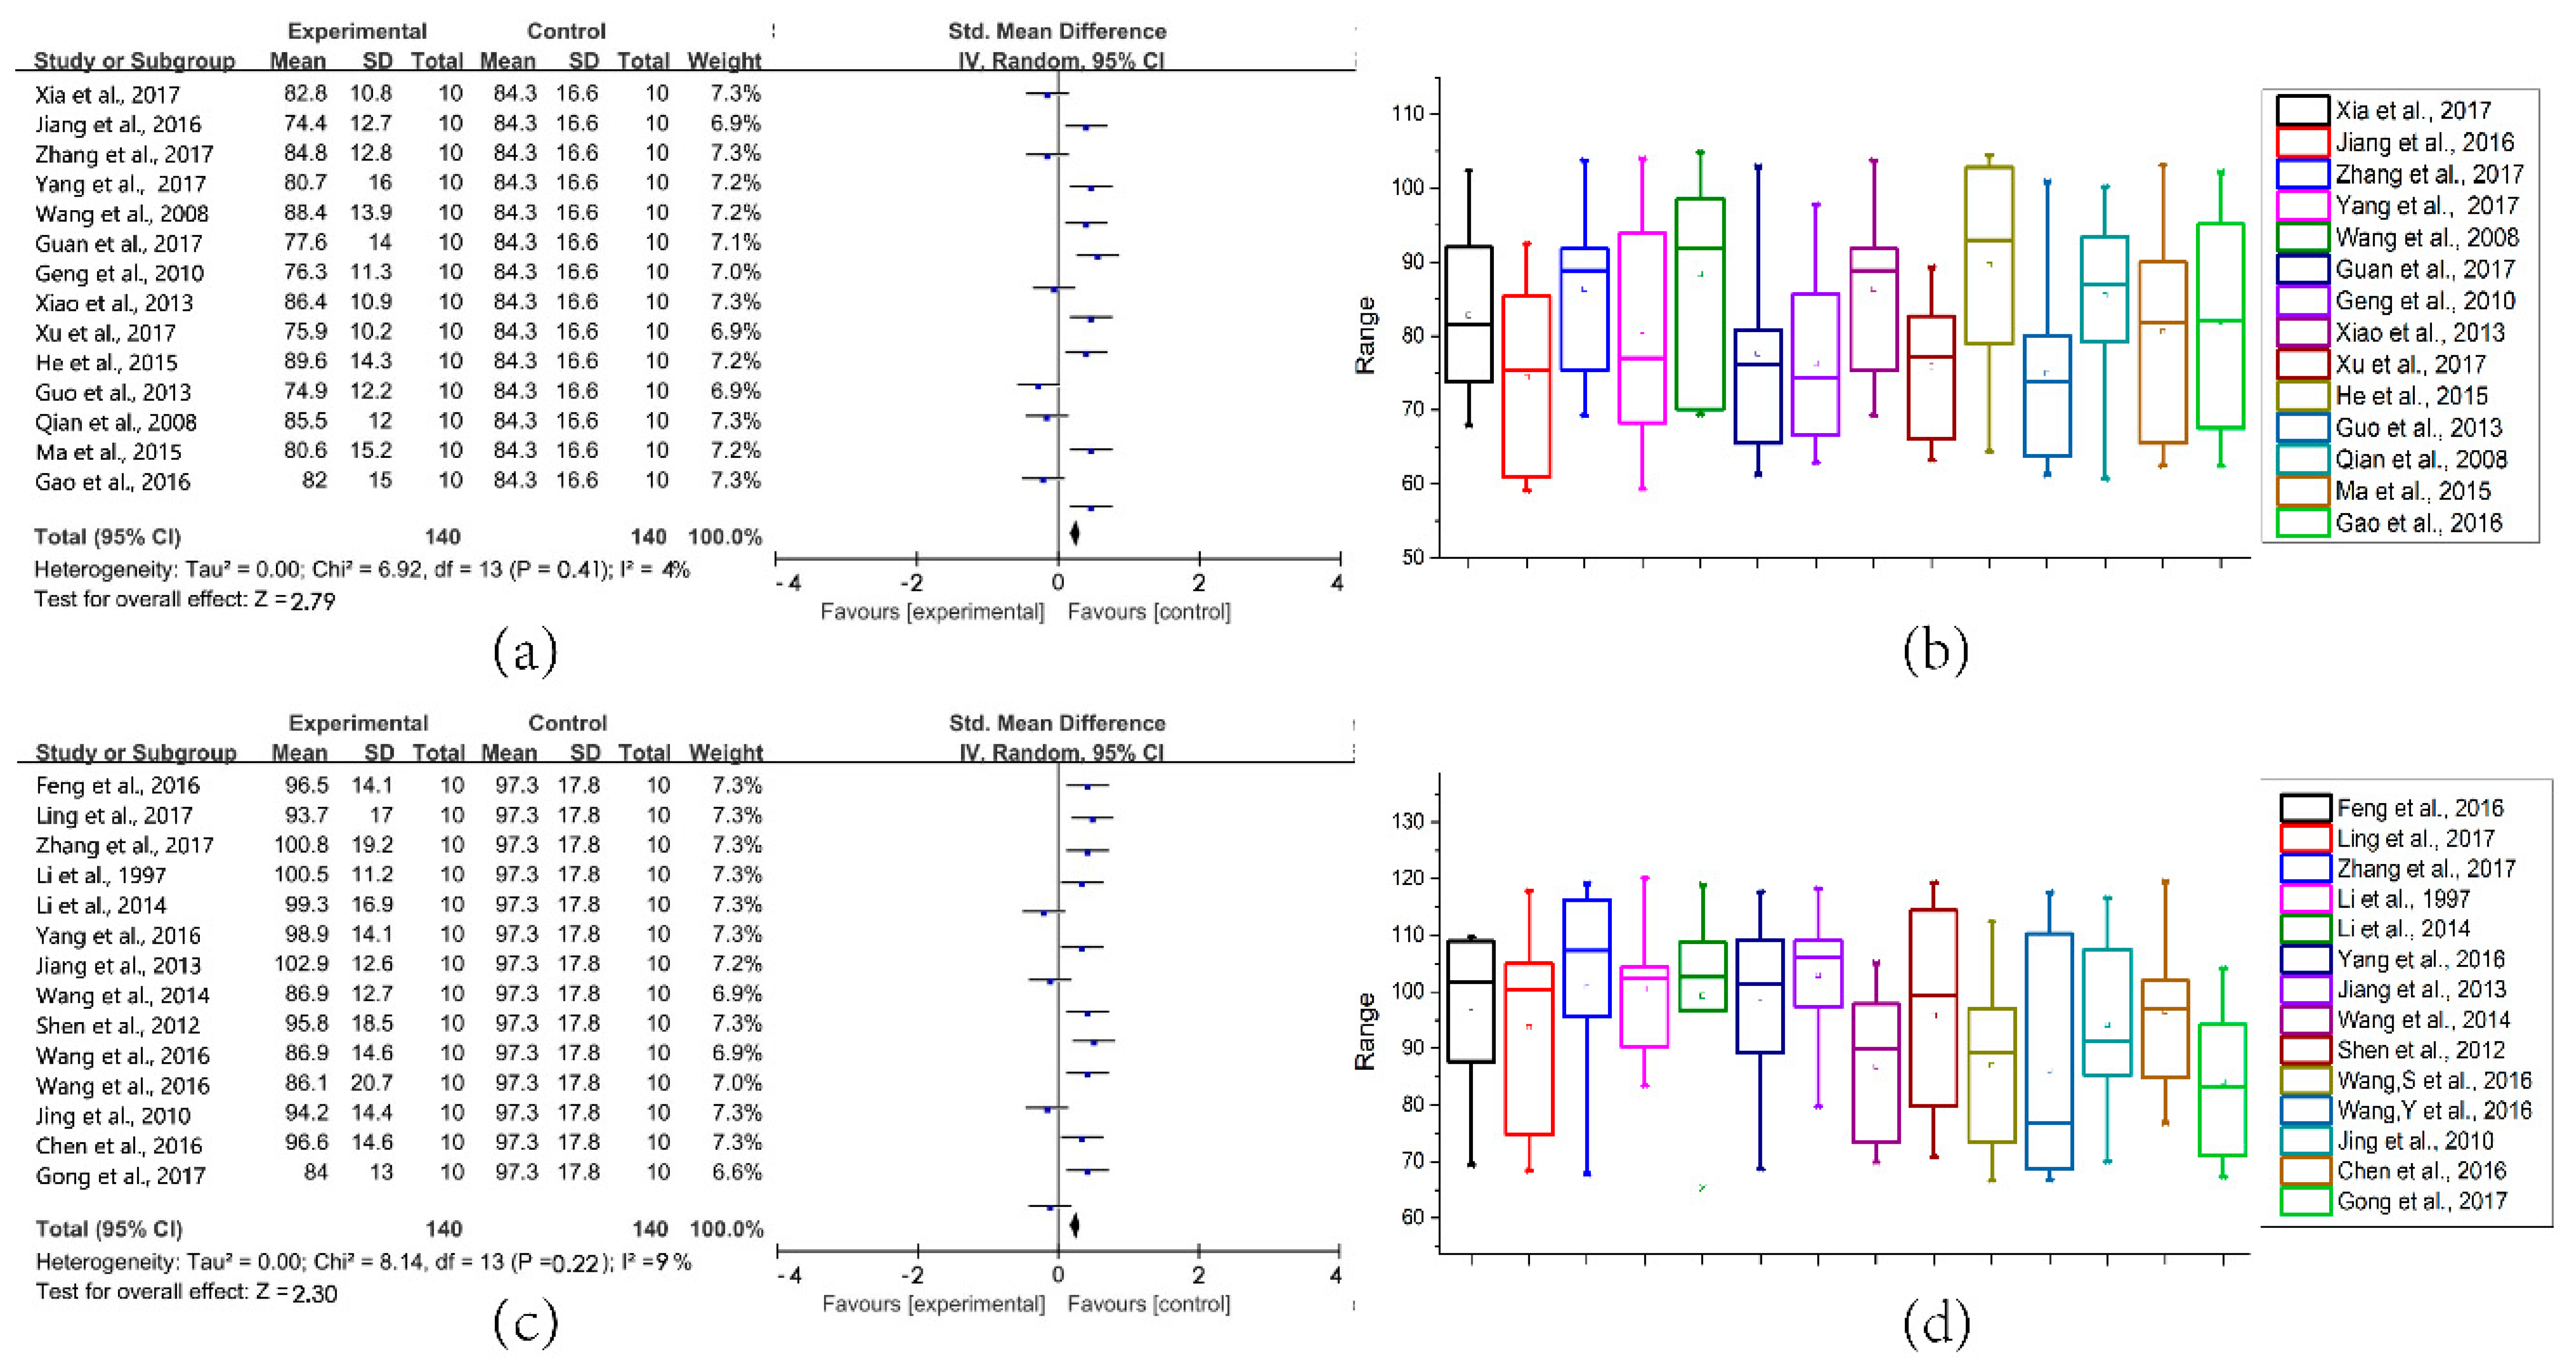
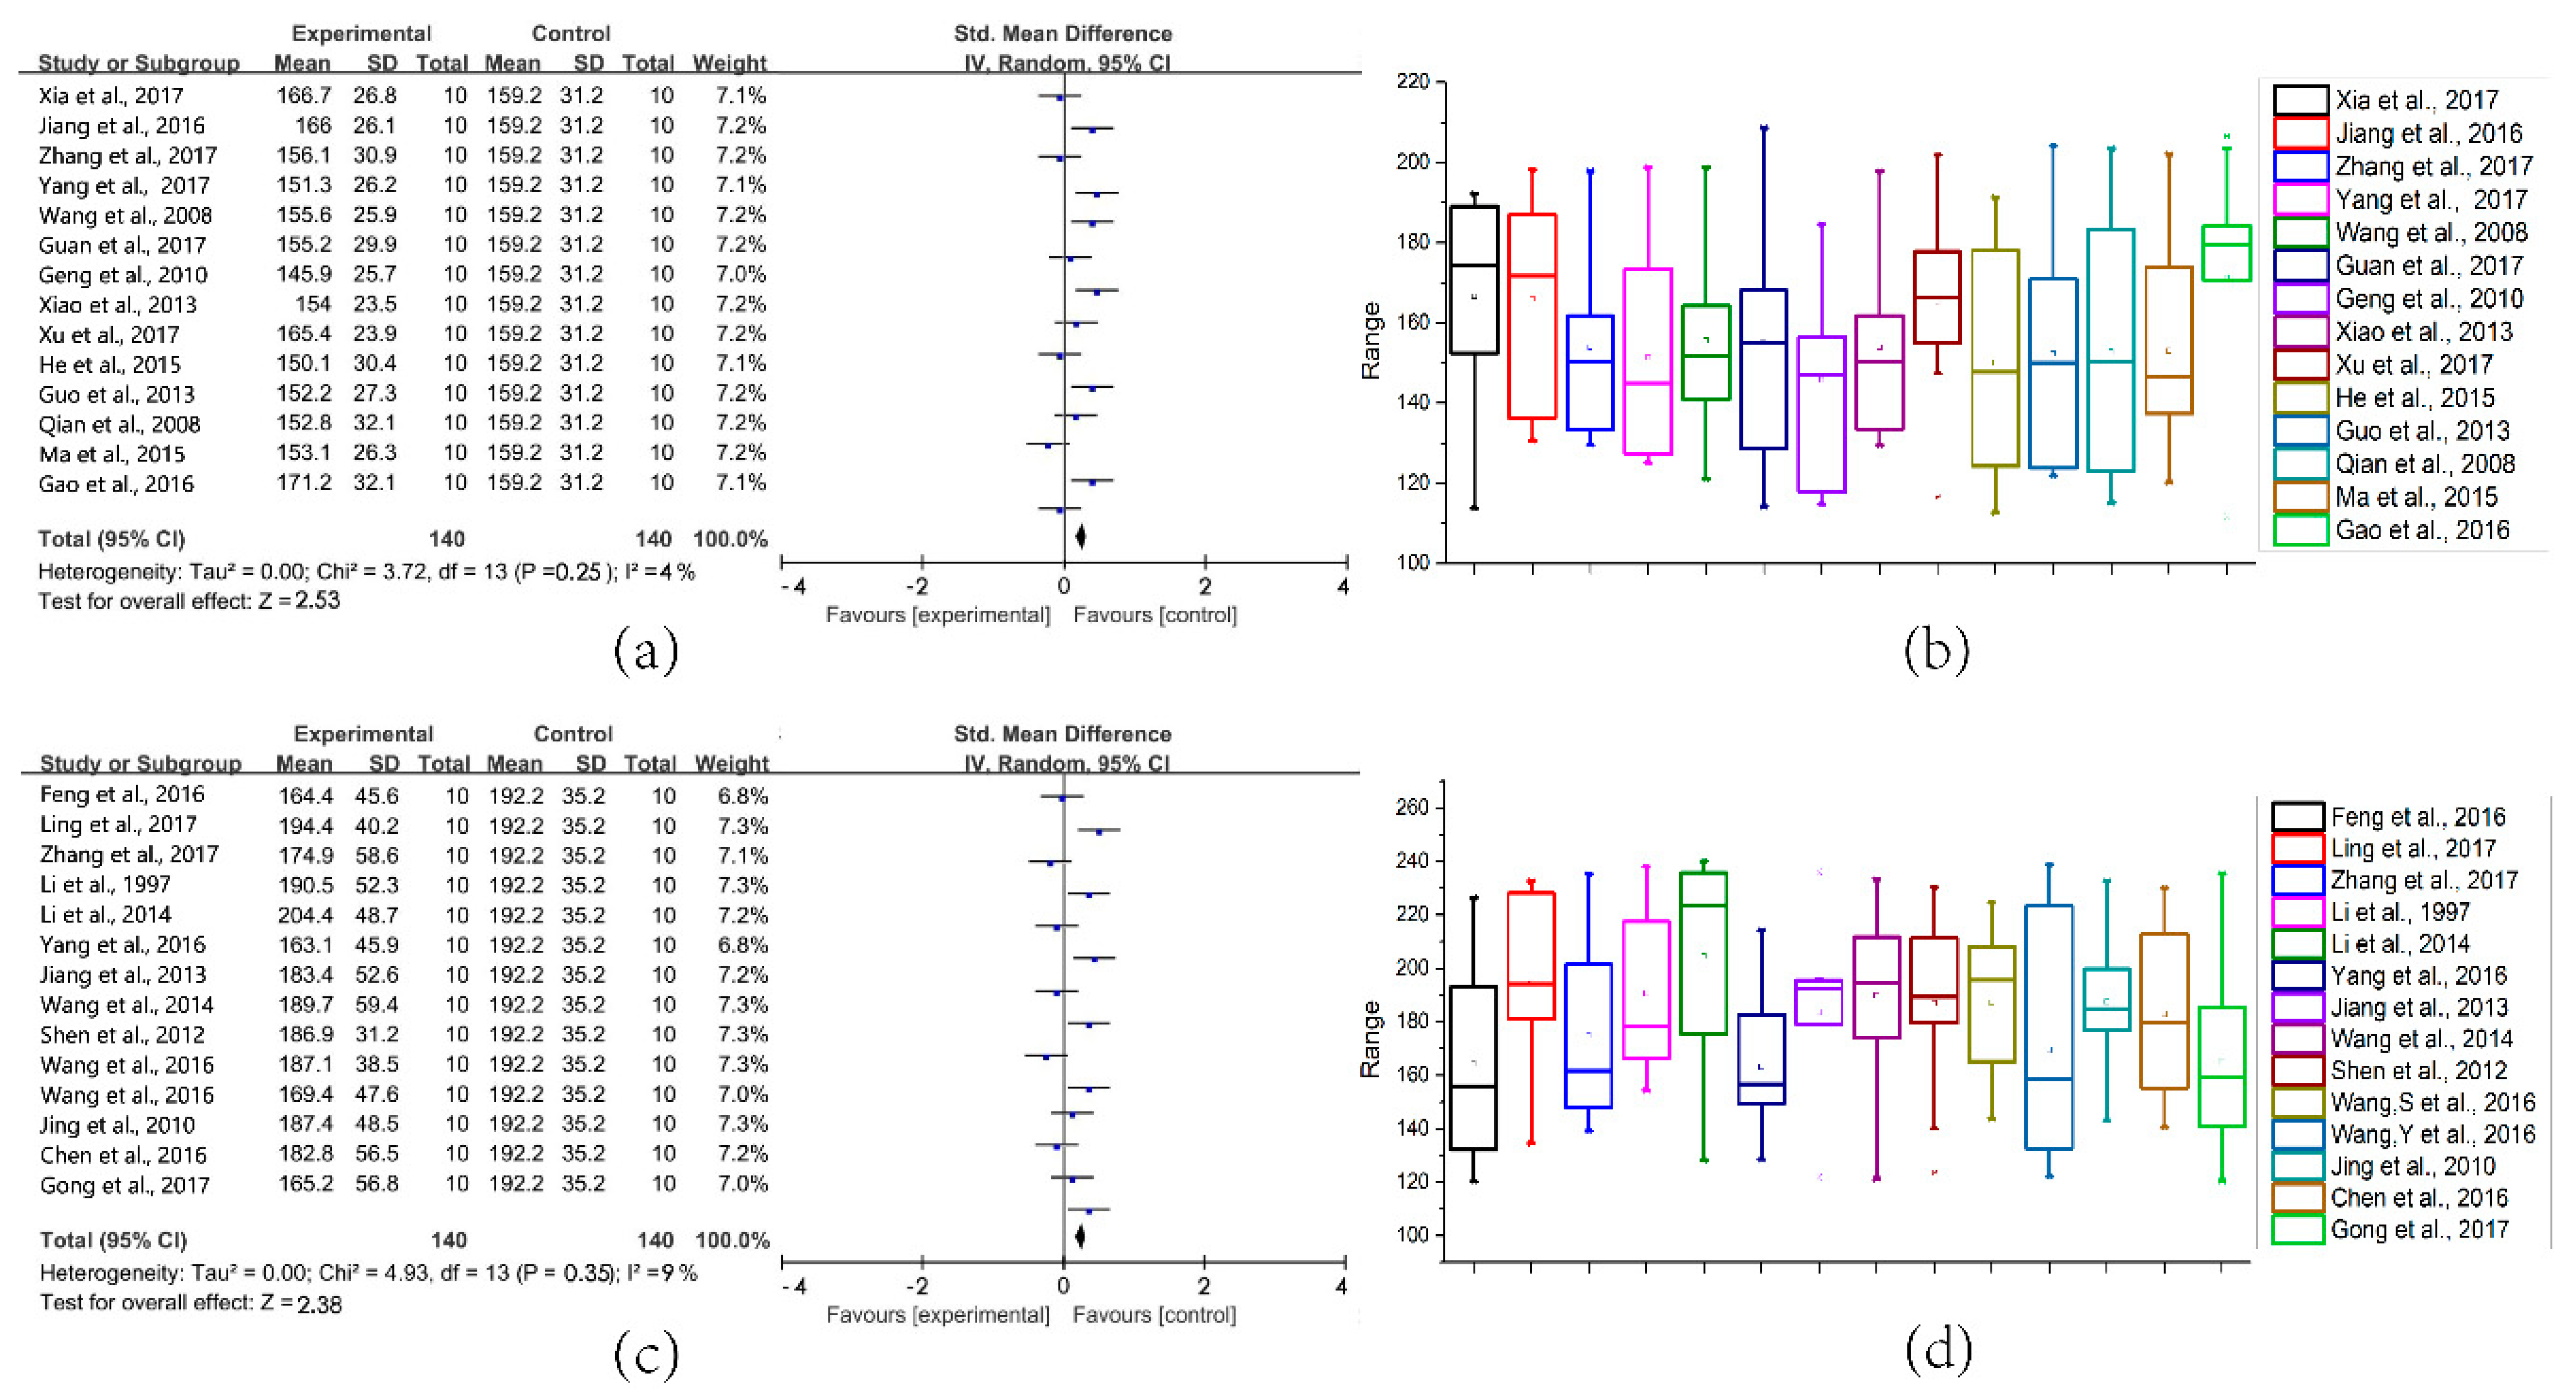
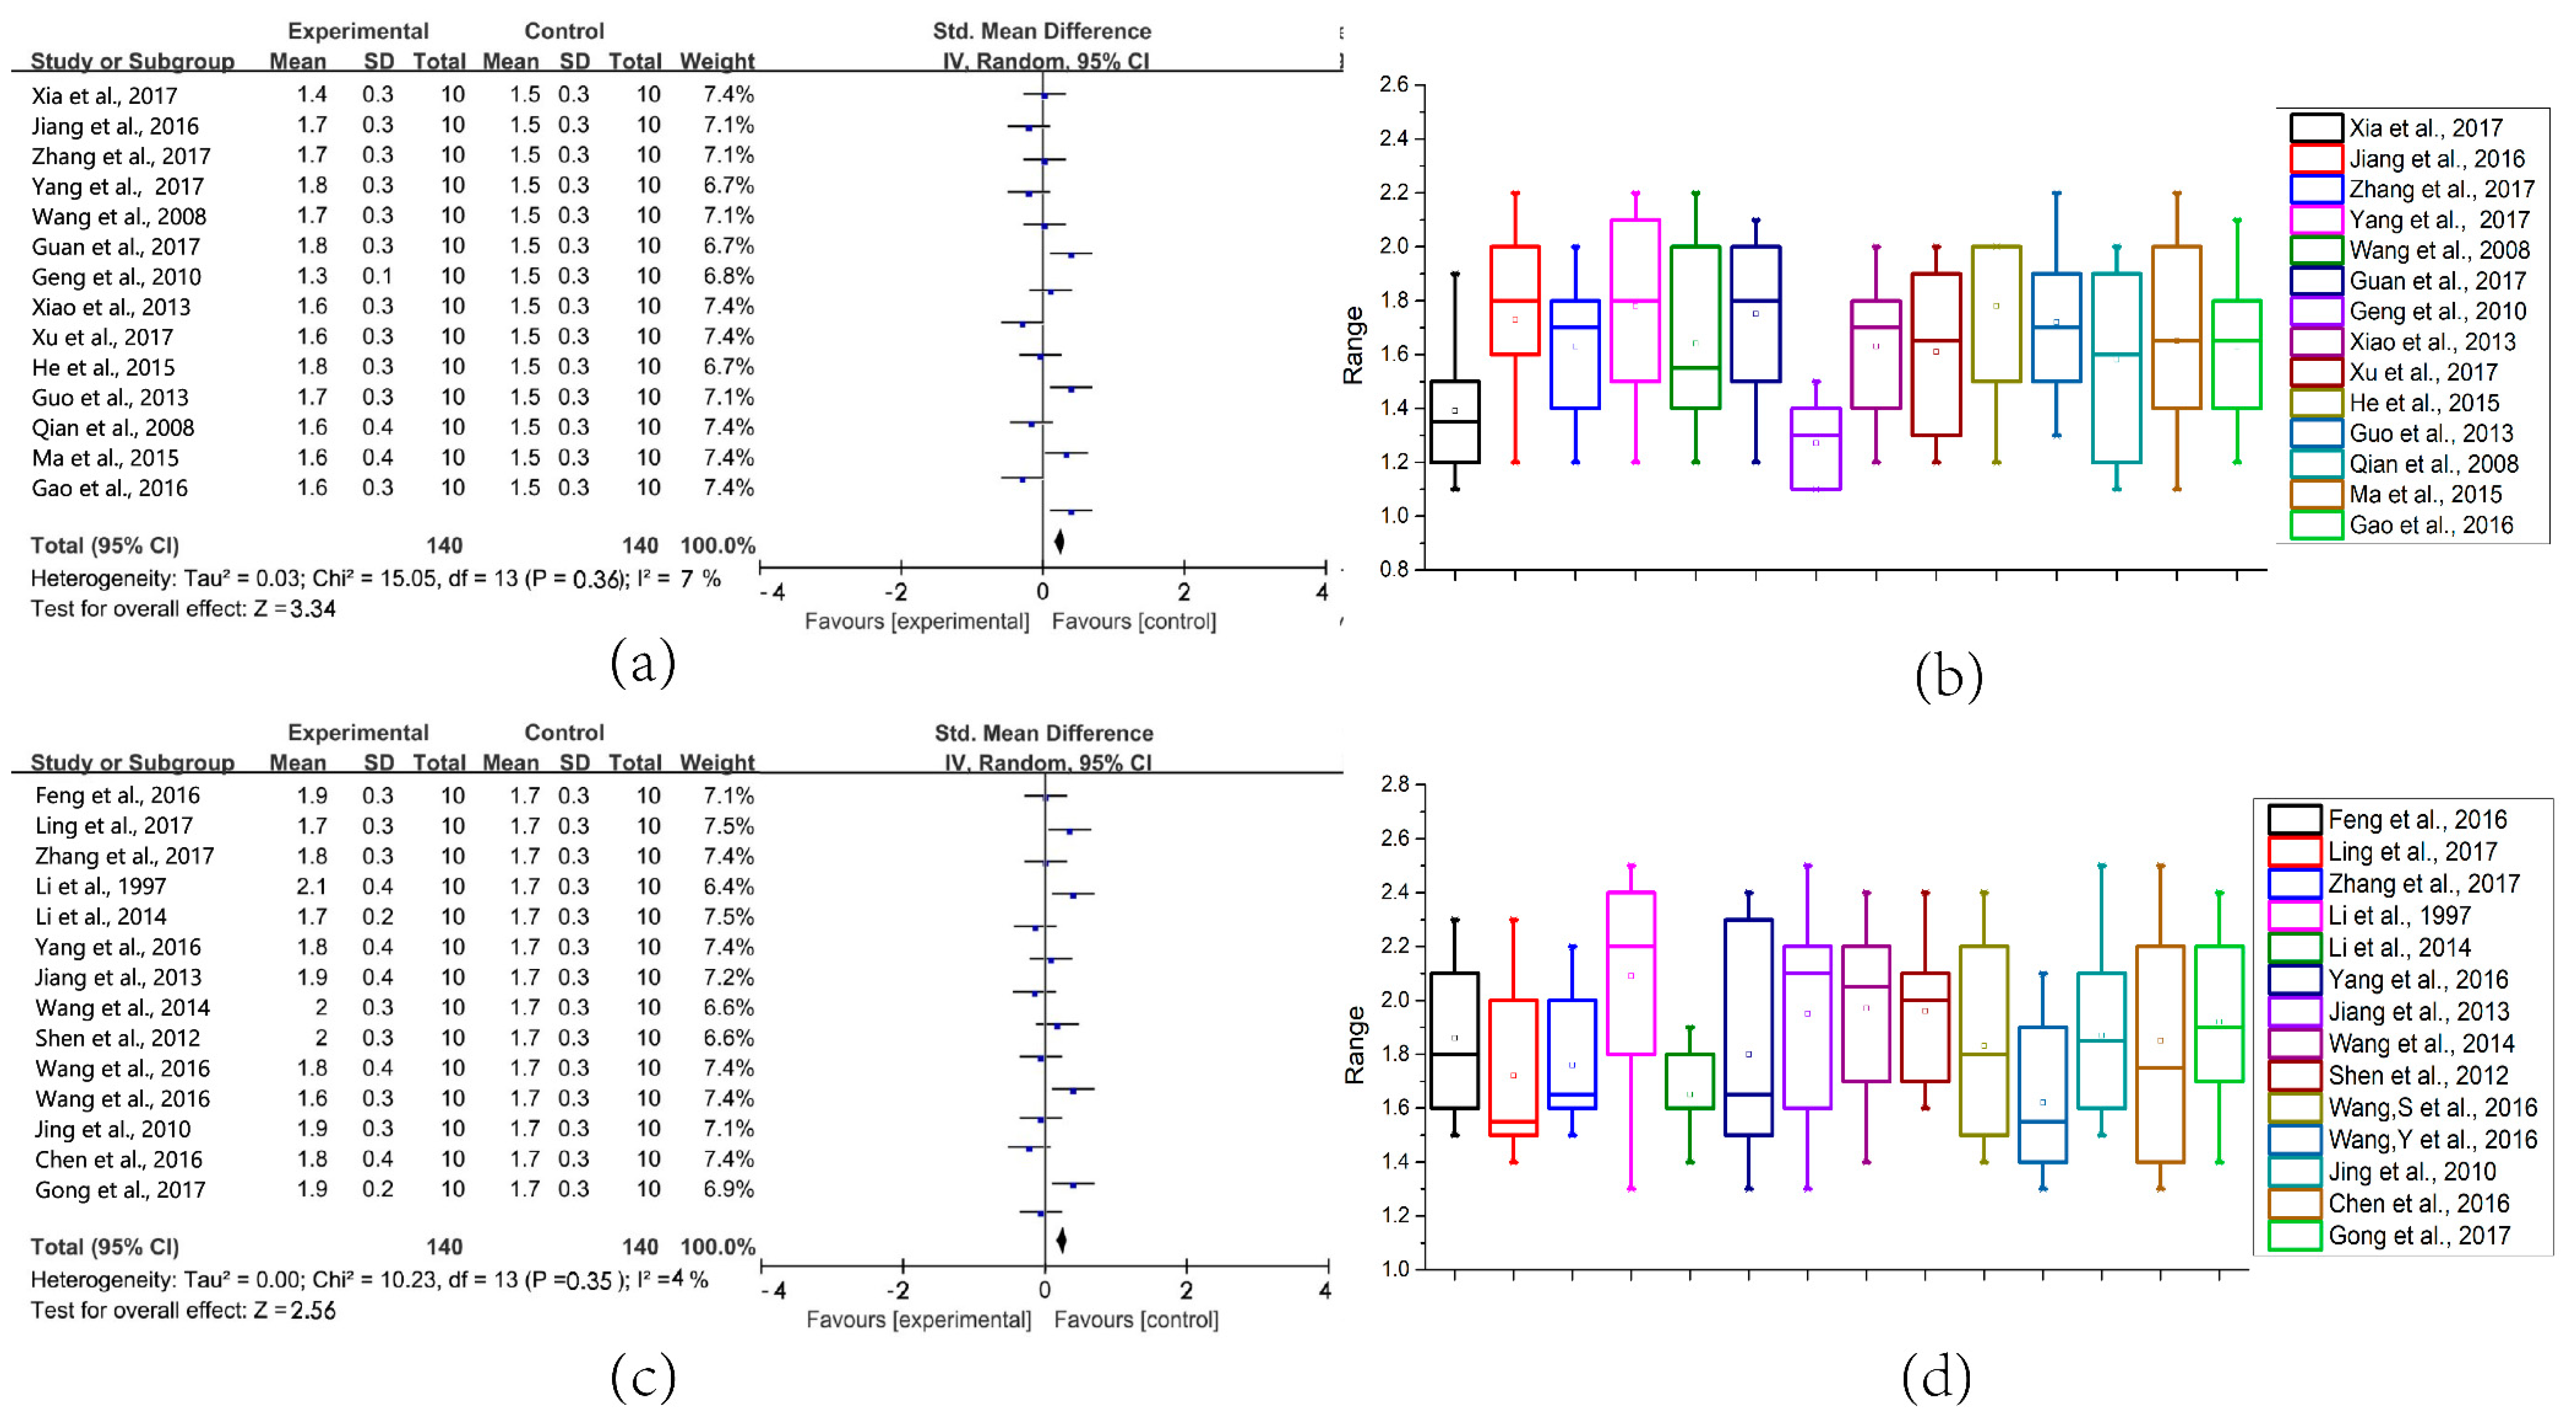
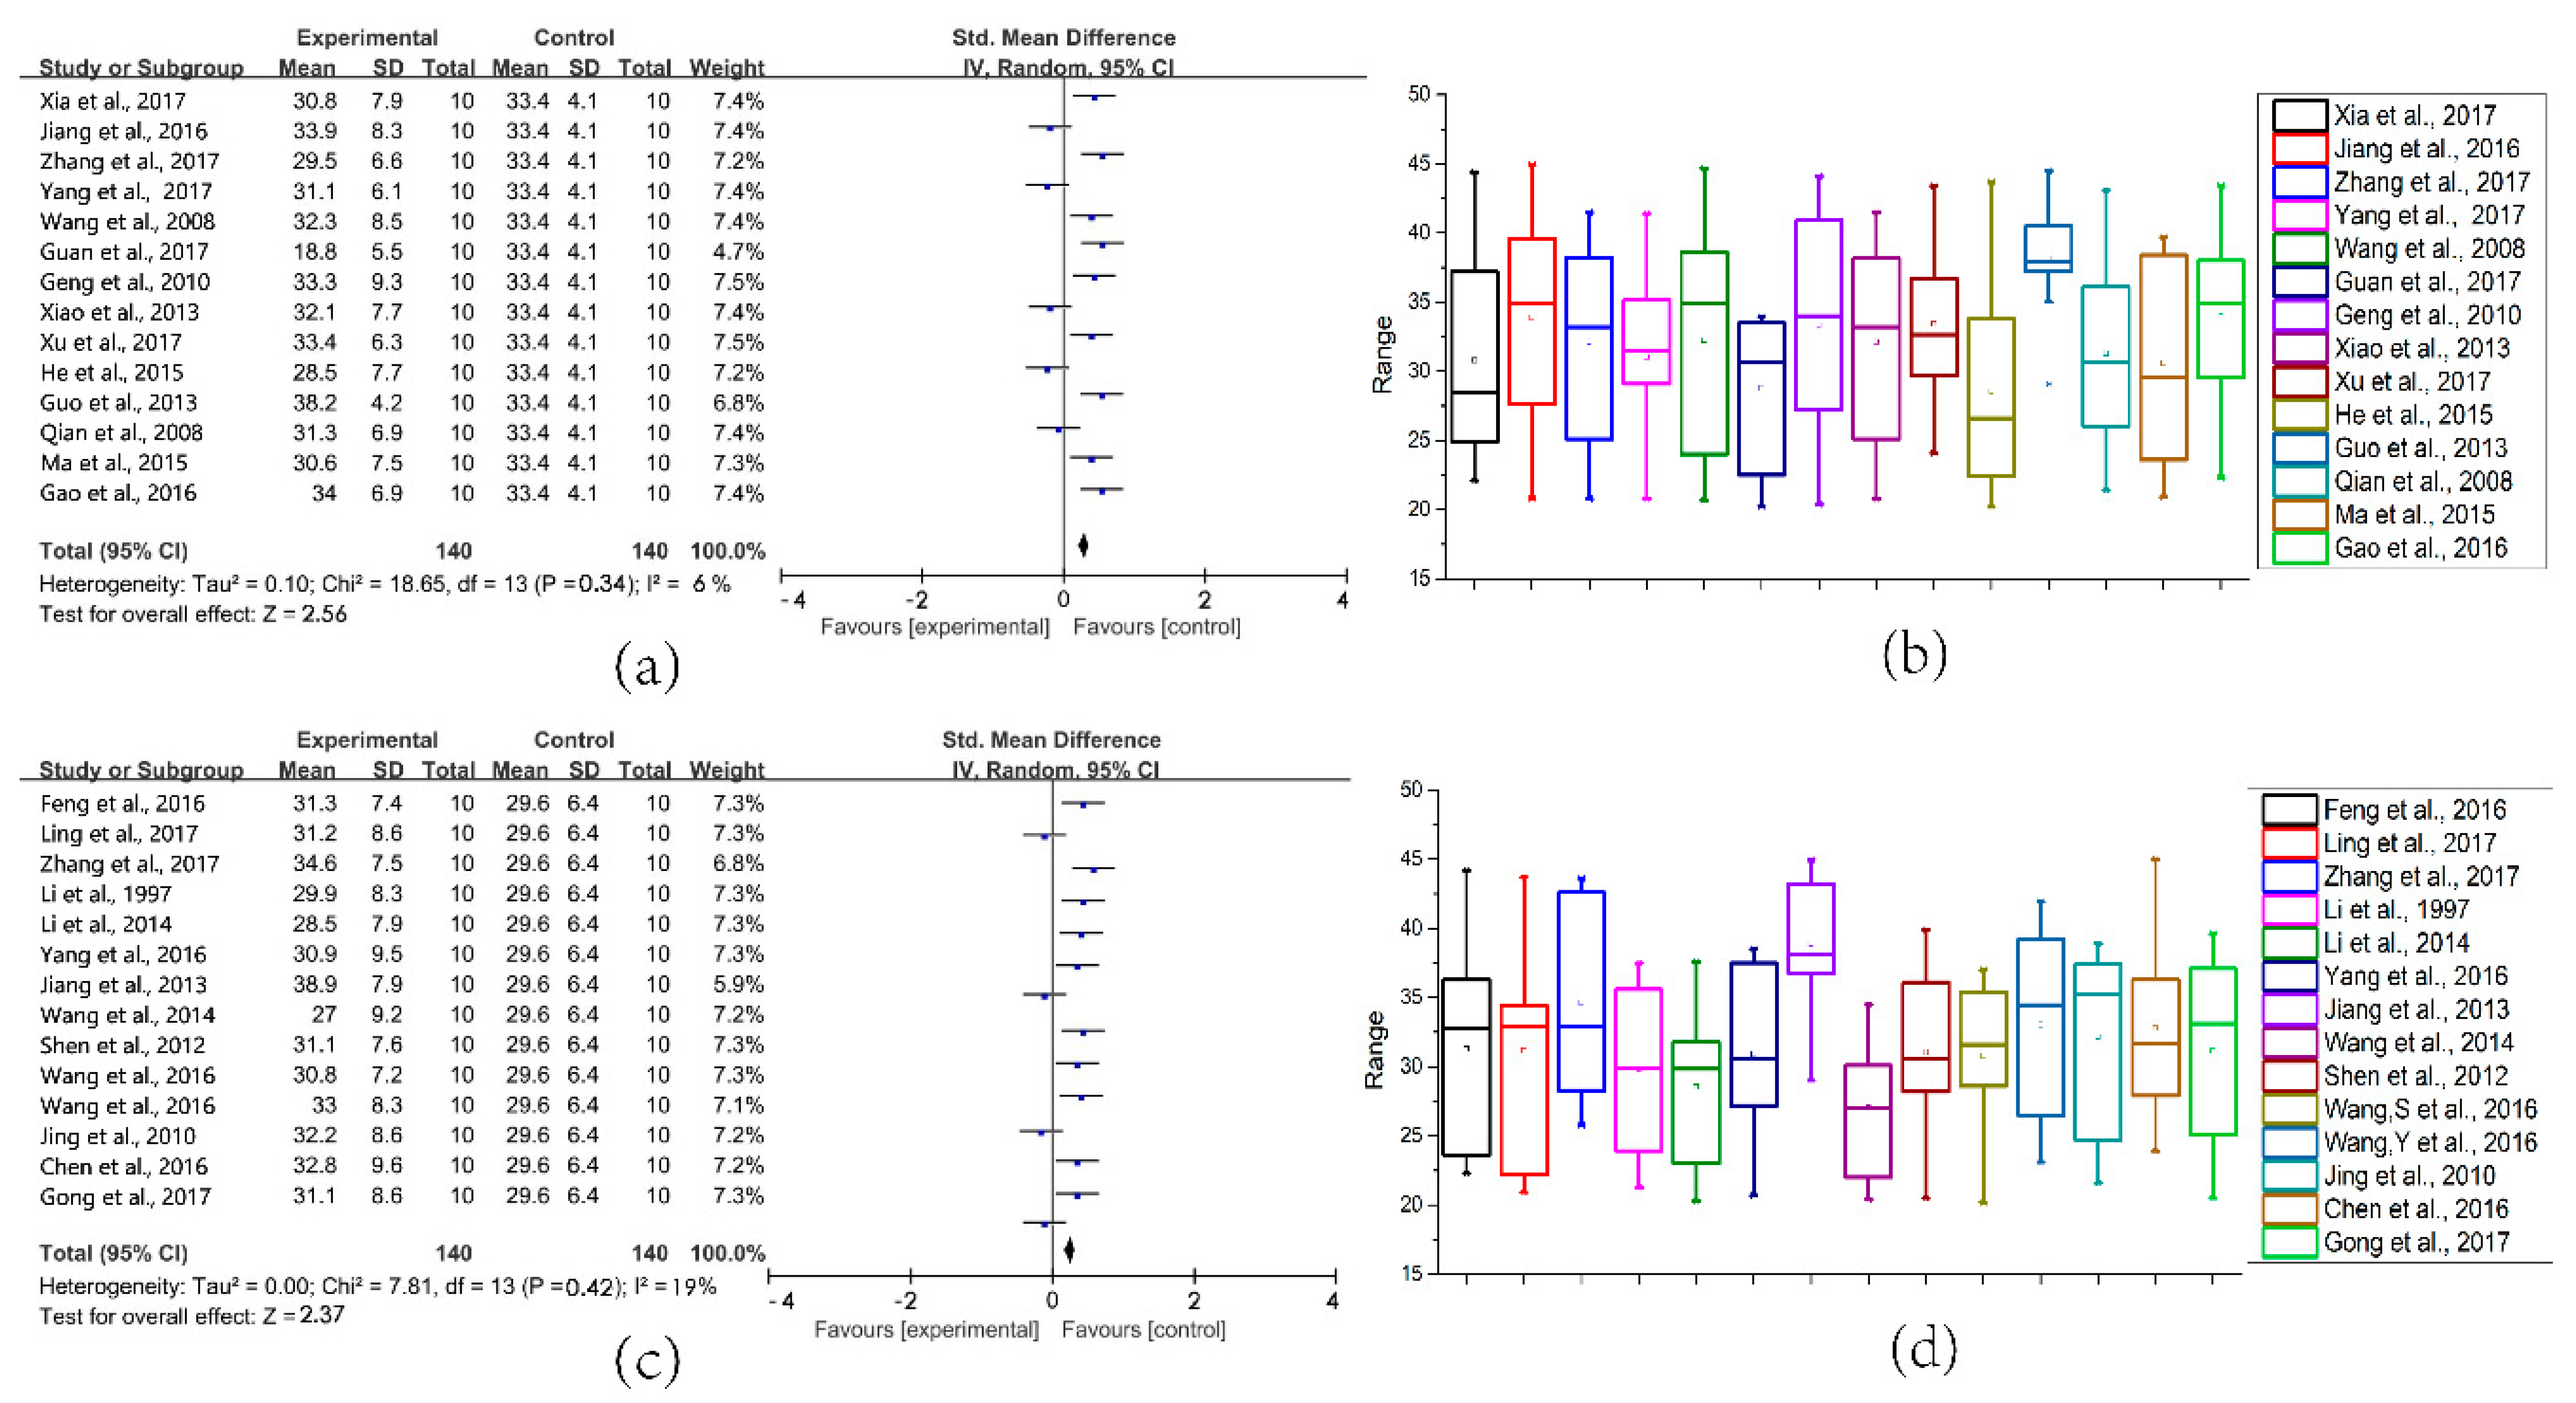
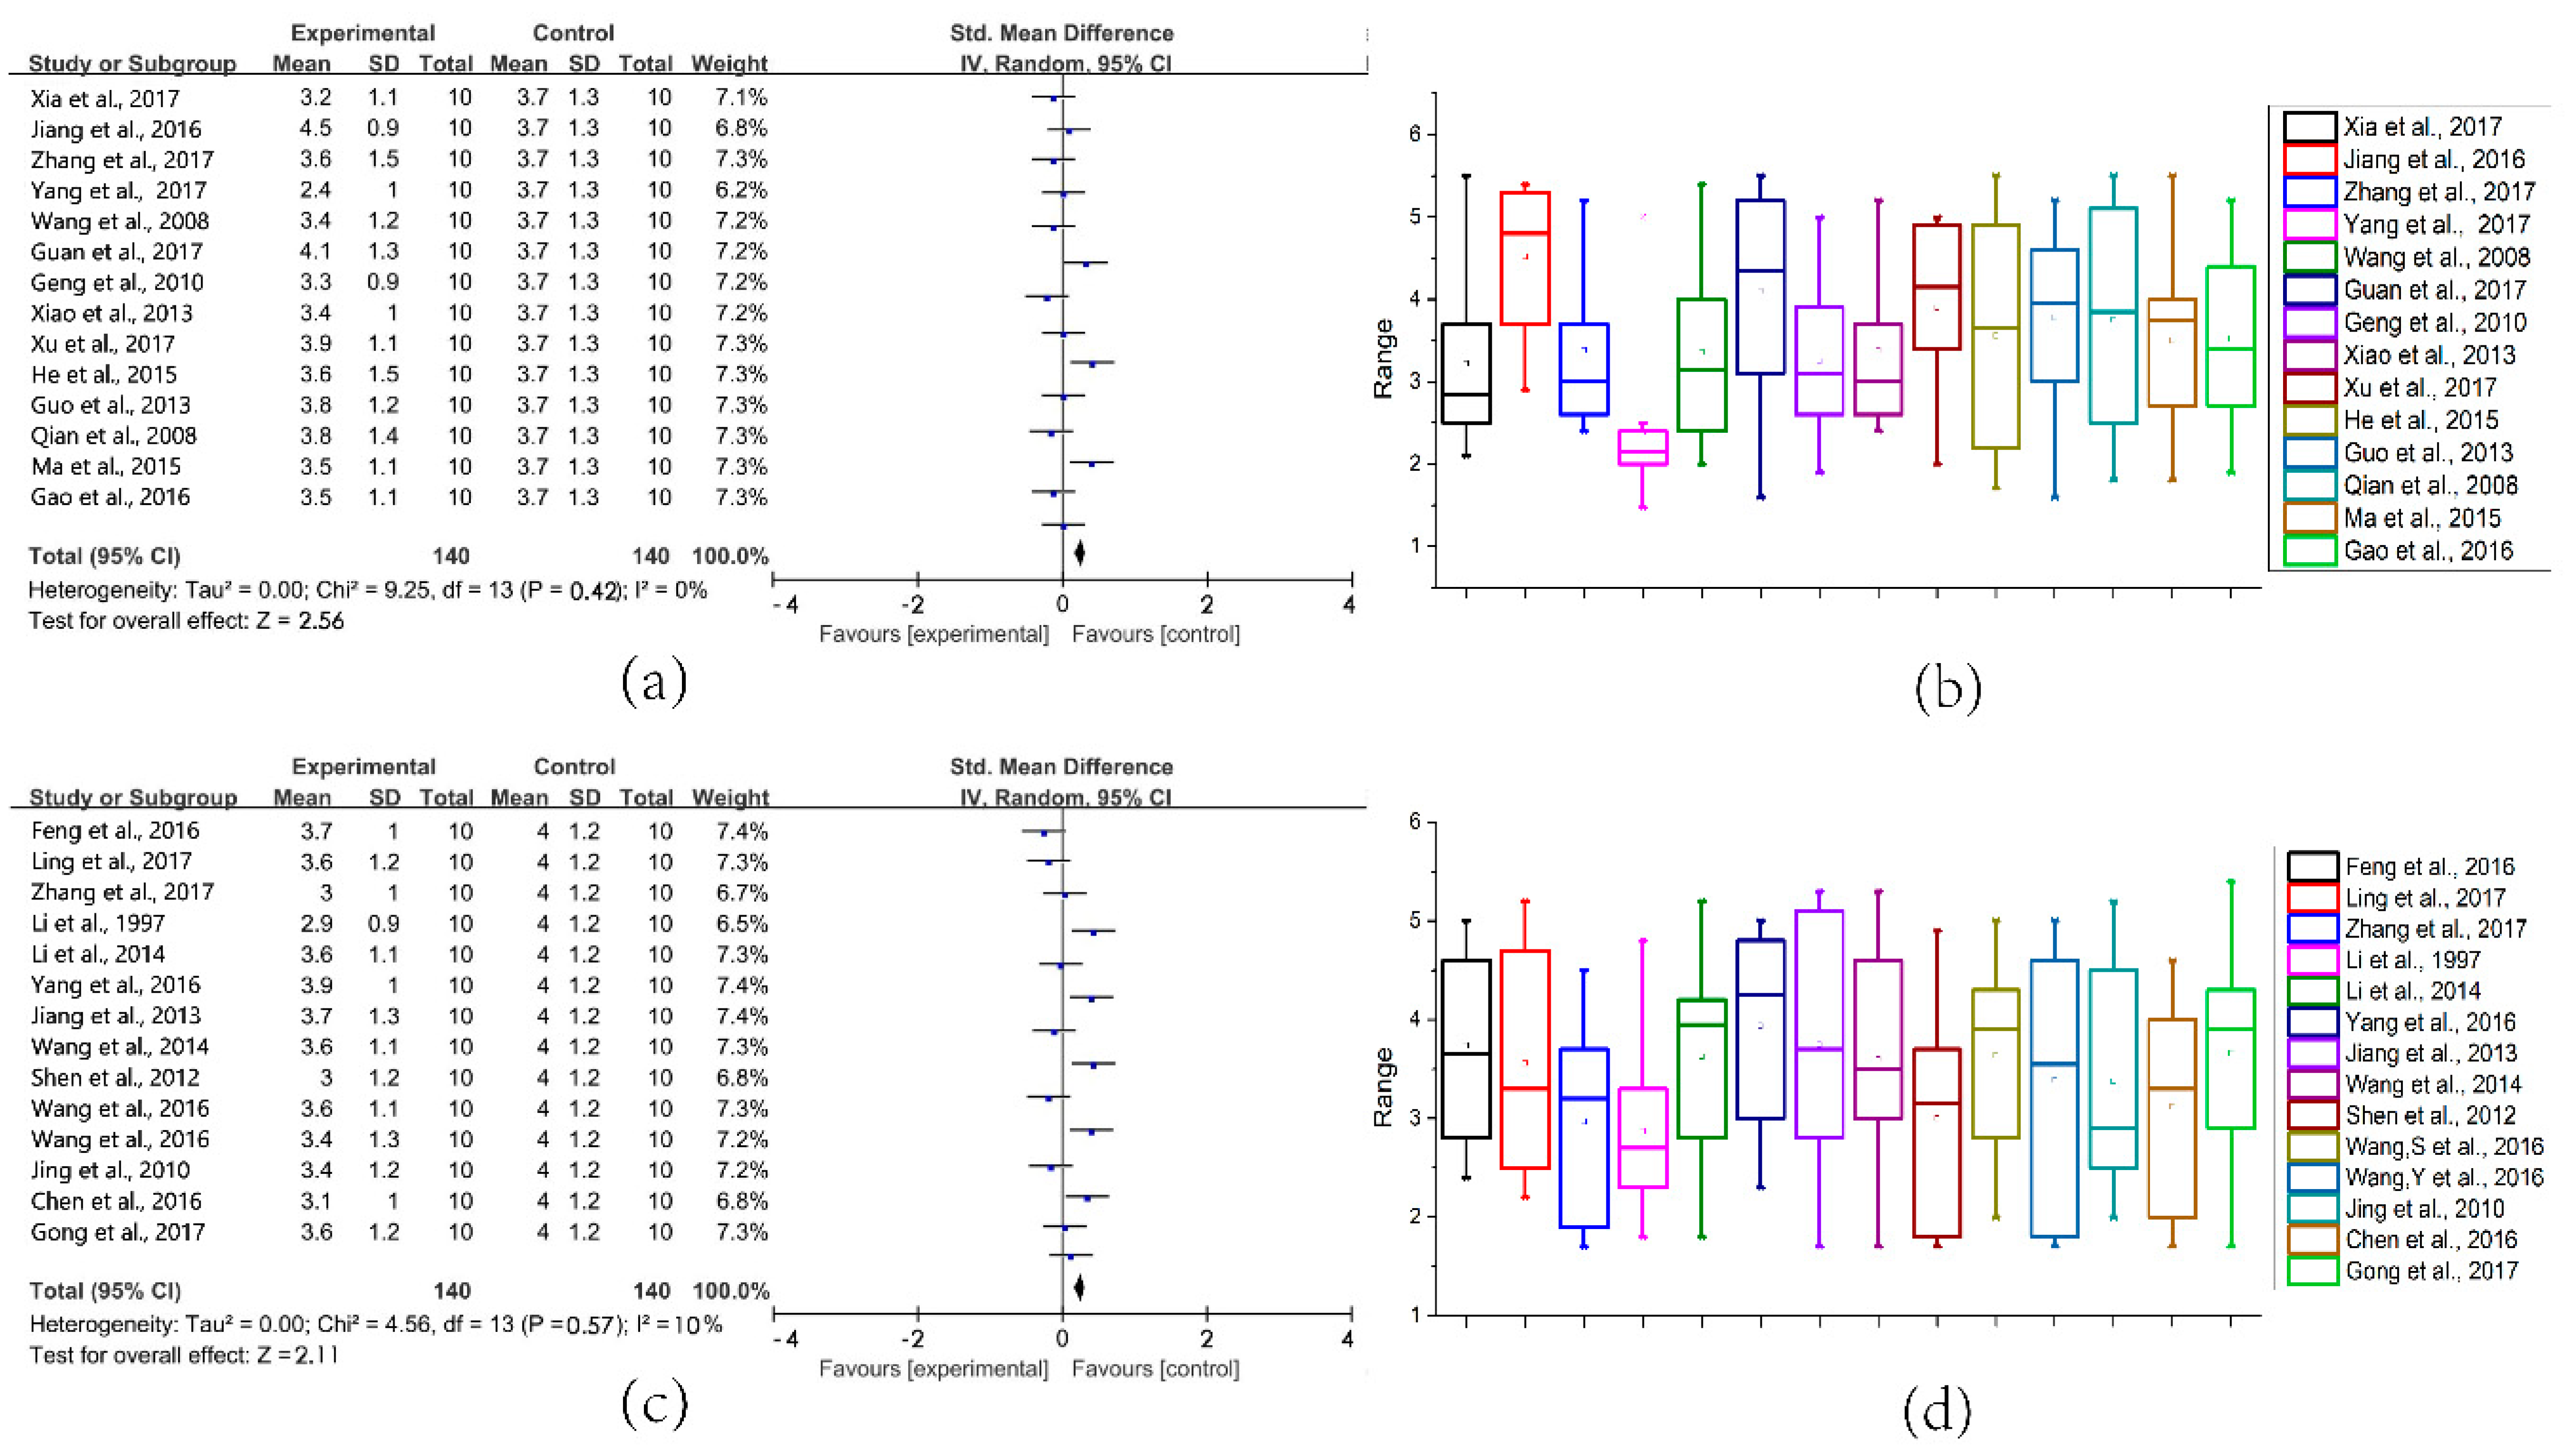
Data of debris flow in northwest and southwest China were selected to study the influence degree of six factors on the risk of debris flow, including 14 cases in the experimental group and 1 case in the control group. The influence degree of 6 factors after regrouping is shown in Figure 6, Figure 7, Figure 8, Figure 9, Figure 10 and Figure 11 and Table 8.
In the northwest region, p = 0.27 and I2 = 19% in the northwest of the forest map of MHD of debris flow. In the southwest region, p = 0.16 and I2 = 33%. Statistical heterogeneity was small. The meta-analysis results reveal a statistically significant difference between the experimental group and the control group. The influence degree of MHD on debris flow risk in northwest and southwest regions was analyzed through a comparison of the number of data points on the right side of the invalid vertical line in the forest map with the total number of experimental data points. The meta-analysis results of the other five influencing factors were analyzed by the same method. According to the box charts and corresponding forest charts of the experimental group in each region, the reasons for the influence or non-influence of the data were discussed.
It can be seen from Figure 6, Figure 7, Figure 8, Figure 9, Figure 10 and Figure 11 and Table 8 that the number of effective data points corresponding to each factor varies greatly. Combining the data points with the box graph data on the right, it can be seen that, due to the large difference in the size of debris flow in these studies, the size of debris flow directly affects the numerical size of DA and LMC, and also has a great influence on RLS. Therefore, data groups with a wide range of values span across invalid lines in meta-analysis. Among the analysis results of other factors less affected by debris flow size, the data set across the invalid line is significantly less than the above three factors. According to the forest maps of the influence of each factor on debris flow risk, statistical heterogeneity of analysis results after regional division is small. The results of meta-analysis showed that there were significant statistical differences (p > 0.1, I2 ≤ 50%) between the experimental group and the control group.

3.3. Summary of Results

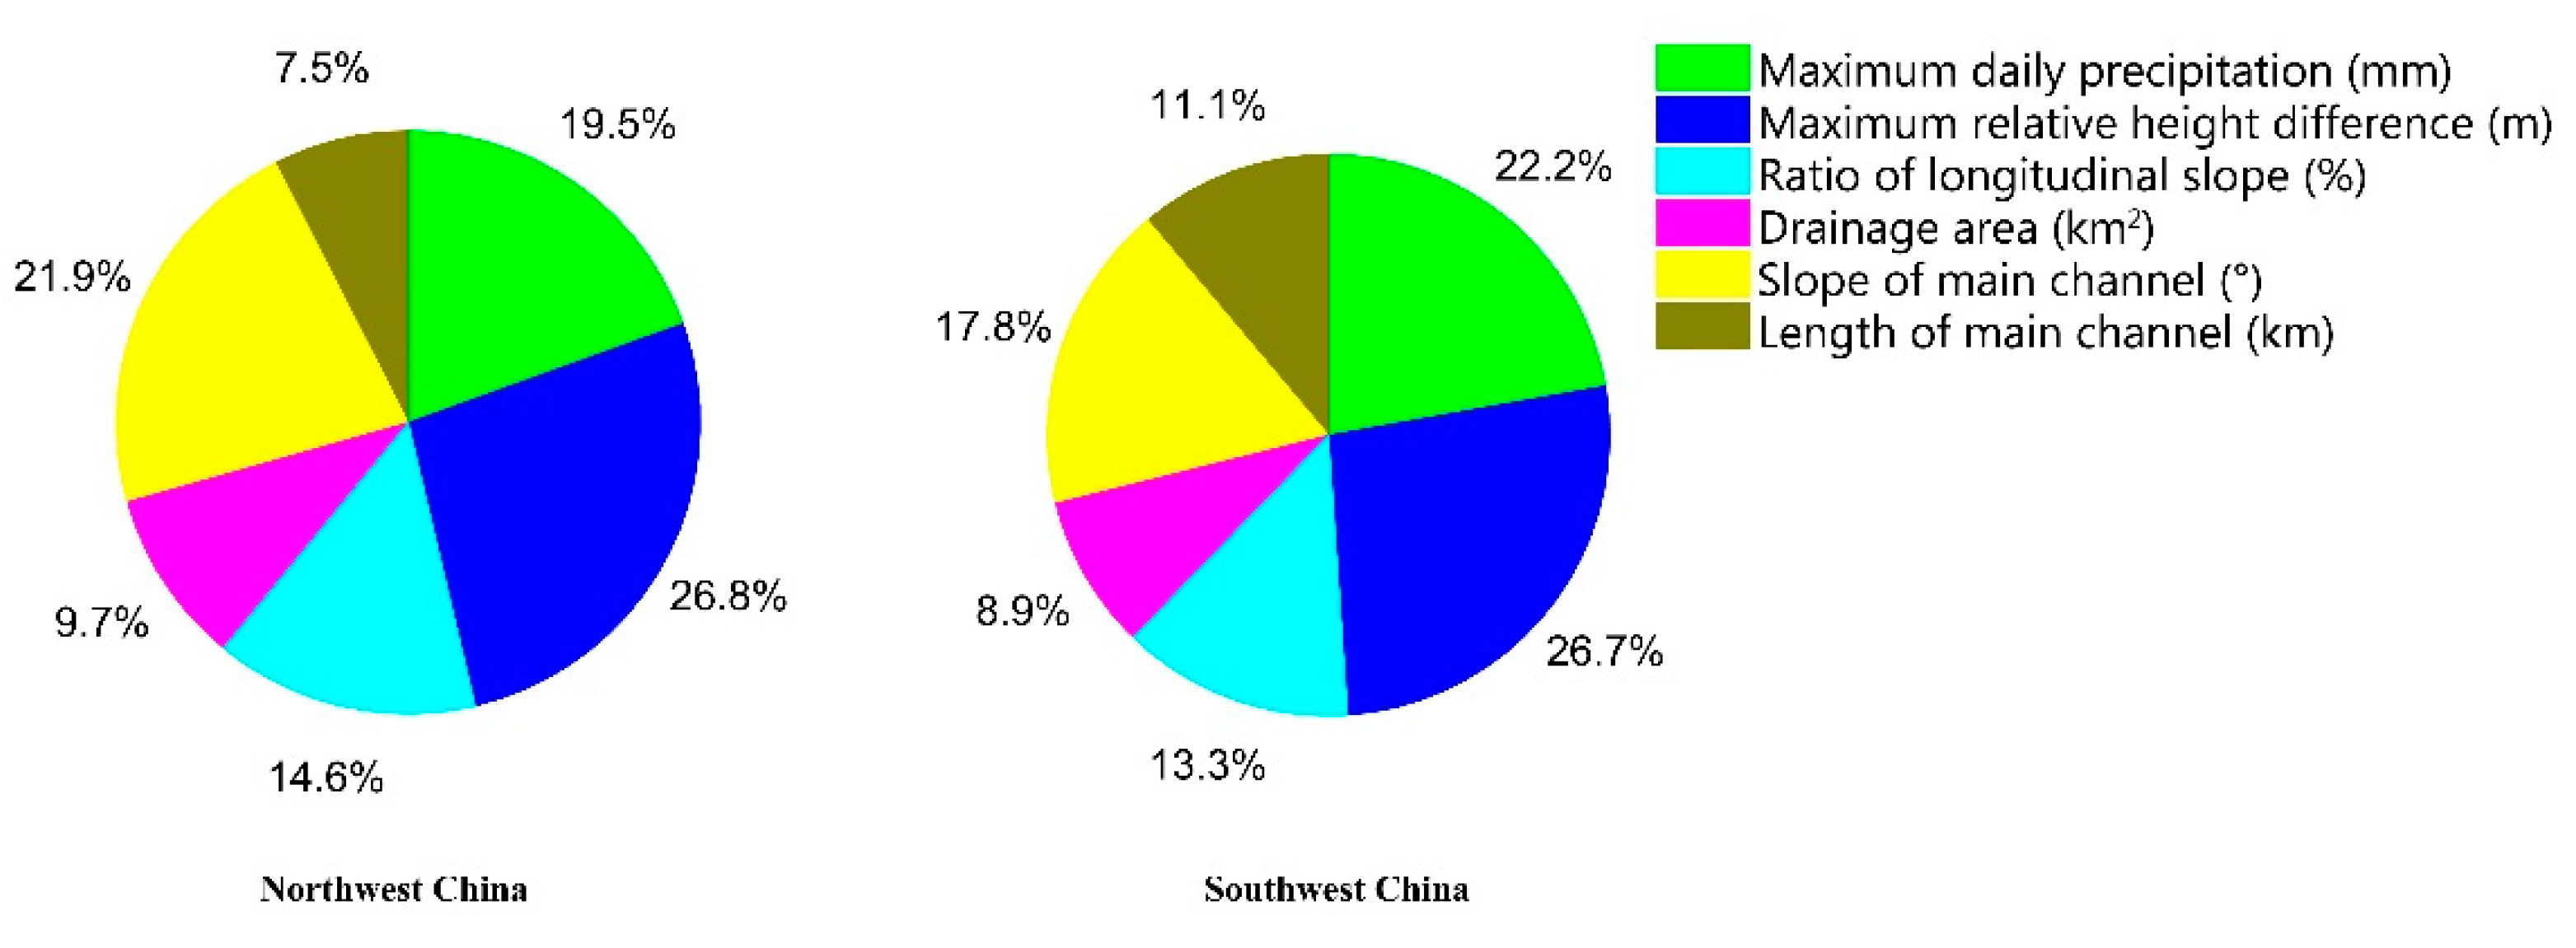
The influence degree of six factors on debris flow risk in northwest and southwest regions was analyzed through a comparison of the number of data points on the right side of the invalid vertical line in the forest map with the total number of experimental data points and weight of each experimental group. Through the above meta-analysis, the influences of various influencing factors on debris flow excitation in southwest and northwest China are obtained, as shown in Table 9 and Figure 12.
According to the order of the above debris flow influencing factors based on their influence degree on debris flow excitation in northwest China, the three factors with the highest influence degrees were as follows: MHD, SMC, and MDP. Among them, MHD accounts for the largest proportion in the influence degree of all factors, up to 26.8%. SMC accounts for 21.9%, MDP for 19.5%, RLS for 14.6%, DA for 9.7%, and LMC for 7.5%.
Similarly, according to the influence degree of debris flow in southwest China, the influencing factors are ranked, and the three factors with the highest influence degrees are MHD, MDP and SMC. It can be seen that the topographic, geological and structural factors and daily maximum precipitation in southwestern China play a dominant role in the occurrence and spatial distribution of debris flows. Among them, MHD accounts for the largest proportion in the influence degree of all factors, up to 26.7%. MDP accounts for 22.2%, SMC for 17.8%, RLS for 13.3%, LMC for 11.1%, and DA for 8.9%. The final relative importance of each factors in northwest China is as follows, maximum relative height difference > slope of main channel > maximum daily precipitation > ratio of longitudinal slope > drainage area > length of main channel. Additionally, in southwest China the relative importance is as follows: maximum relative height difference > maximum daily precipitation > slope of main channel > ratio of longitudinal slope > length of main channel > drainage area.

4. Discussion

The application of meta-analysis to the screening of debris flow risk factors is a new undertaking. According to the order of the above debris flow influencing factors based on their influence degree on debris flow excitation in northwest China, MDP accounts for the largest proportion in terms of the influence degree of all factors, up to 26.8%. This finding indicates that topographic and tectonic factors play a major role in the occurrence and spatial distribution of debris flows in northwest China. This result is ascribed to the extensive distribution of weak rocks in northwest China, including a large number of structural fault zones, the significant influence of neotectonic movement, extremely developed fold faults, and poor integrity. The northwest area is mountainous, and the new and old diluvial fans develop in the mountain pass, which provides the source foundation for debris flow. Similarly, depending on the influence degree of debris flow in southwest China, MHD accounts for the largest proportion in the influence degree of all factors, up to 26.7%. This result is due to the complex terrain in southwest China, which includes five geomorphic units, including plateau, plain, mountain, hill, and basin. Therefore, the range of elevation variation is large, and the huge fluctuation of the terrain makes for an unstable geomorphic structure, providing certain potential energy for debris flow materials and laying a foundation for the occurrence of geological disasters. Steep slopes and the availability of loose debris in these areas provide suitable topographic conditions and source materials for debris flows [43].
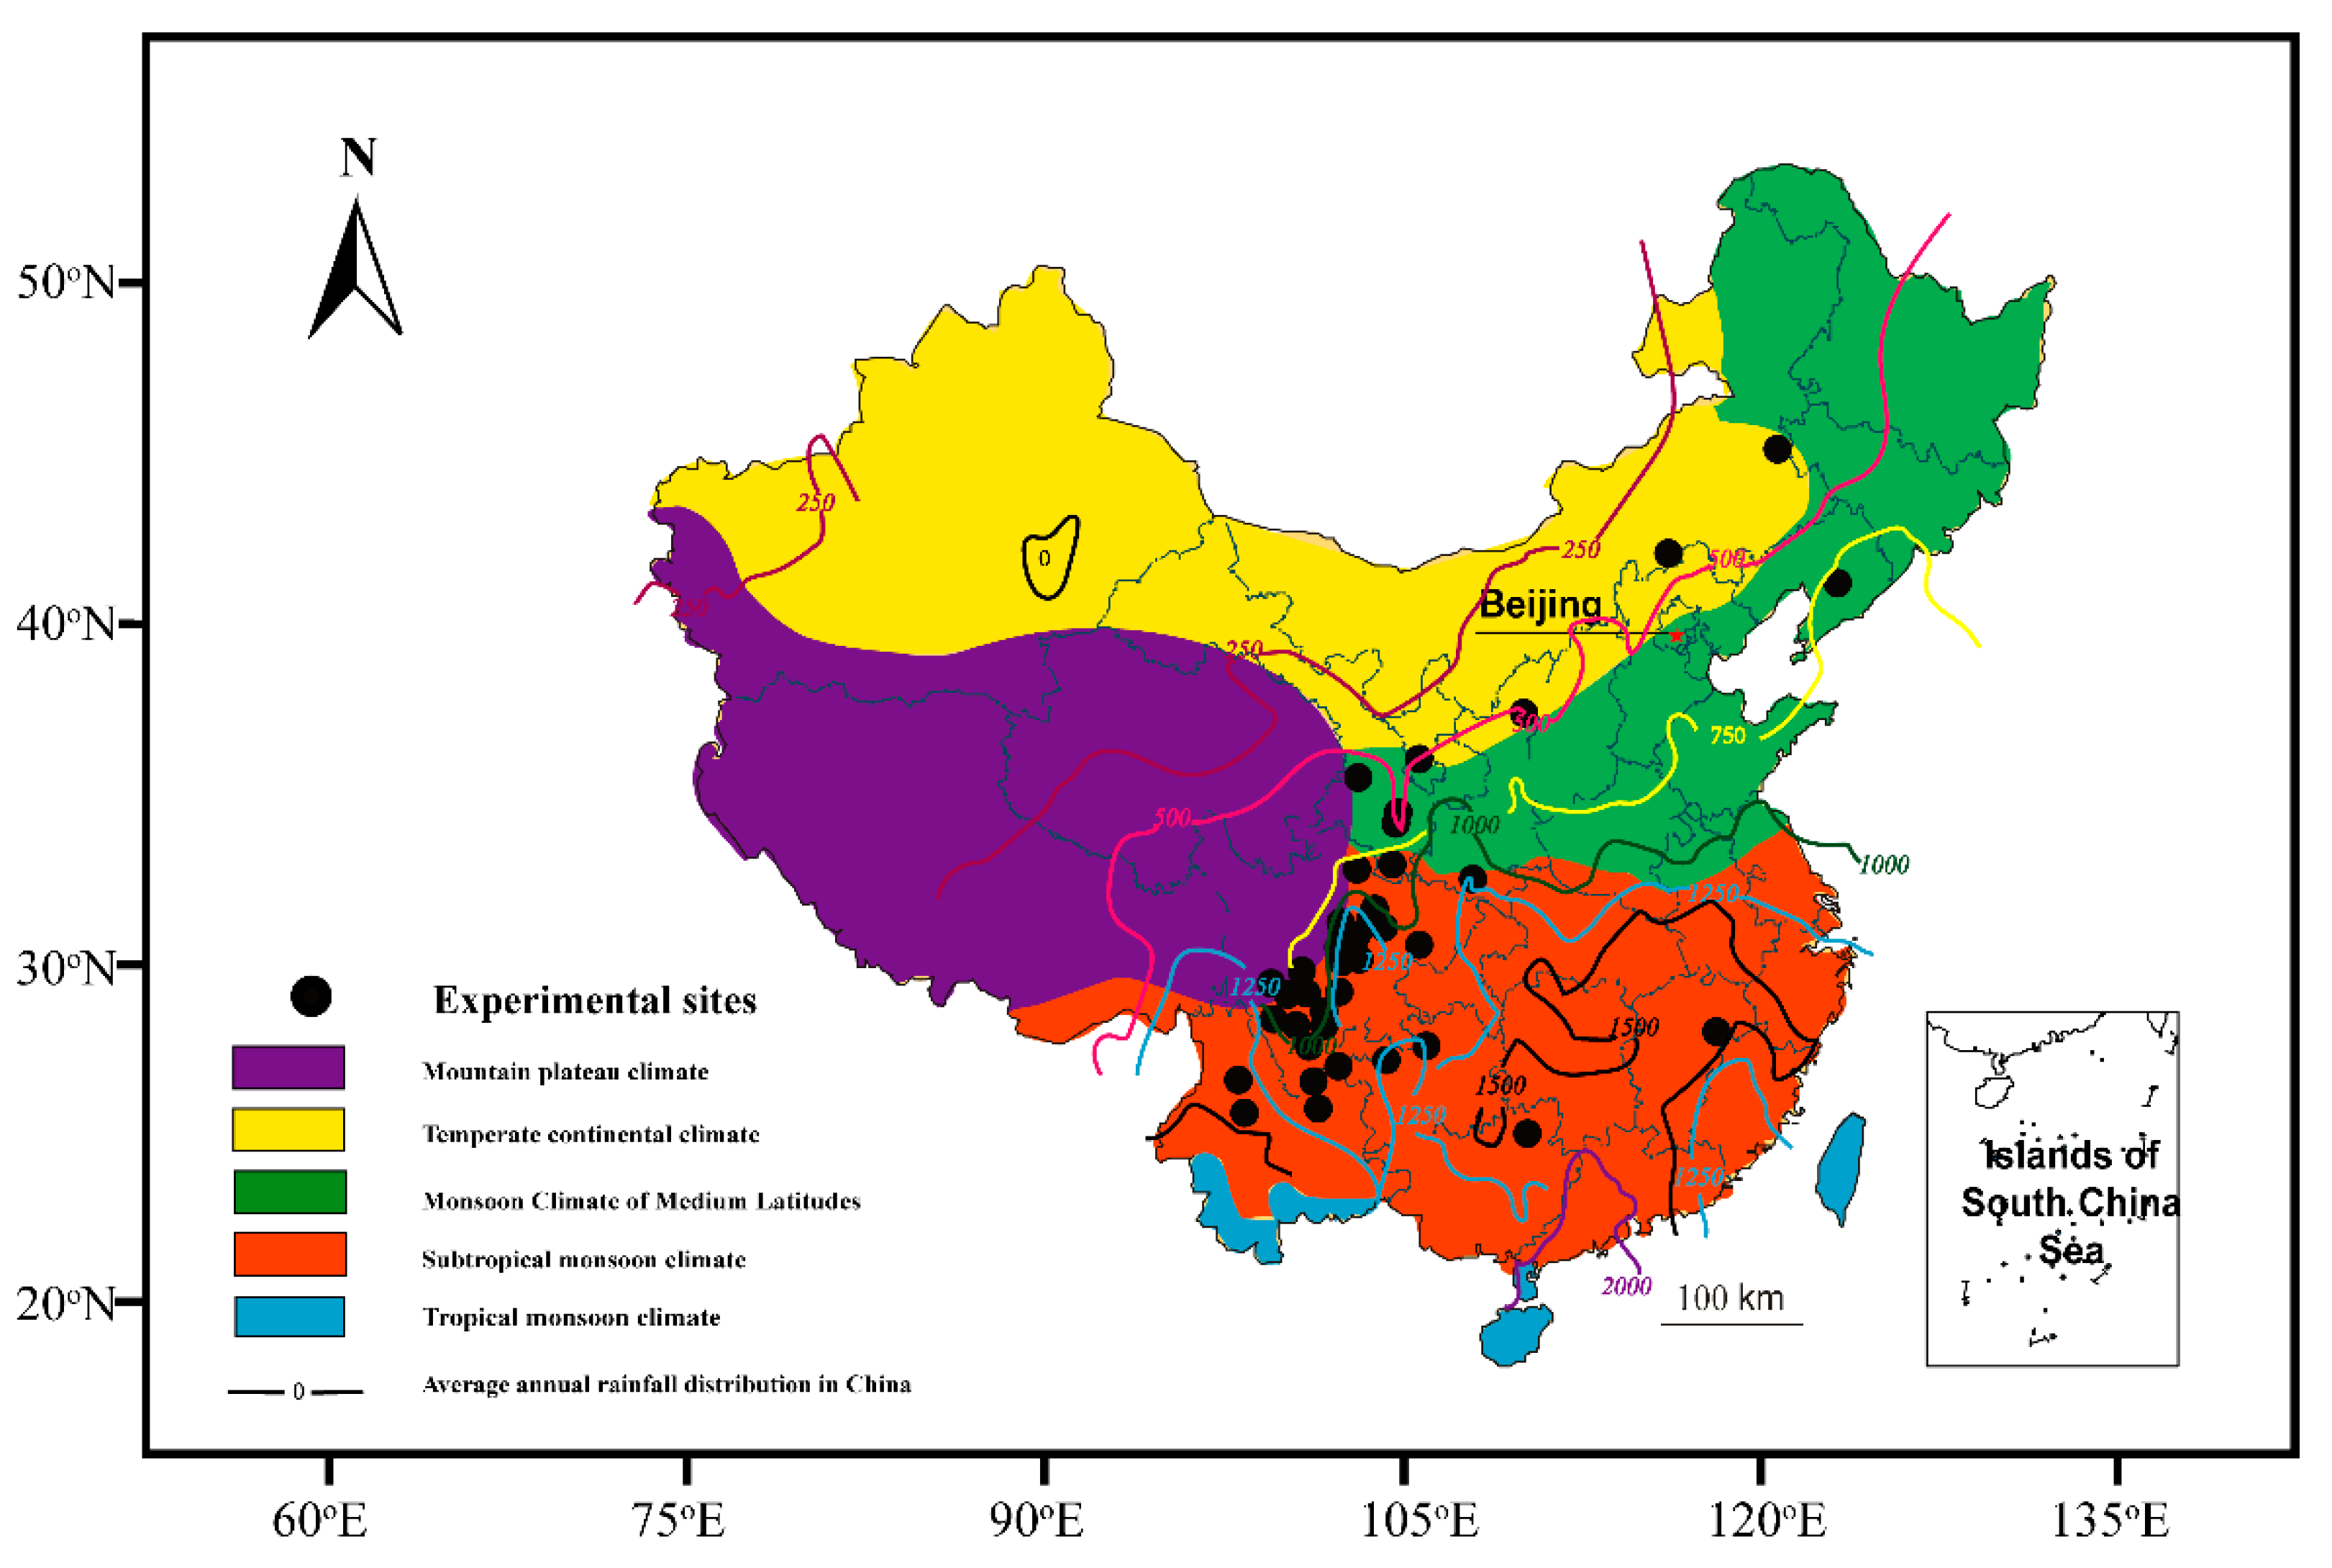
Maximum daily precipitation has a greater impact on debris flow in southwest China than in Northwest China. Water is the fluid component of debris flow. Rainfall, as the excitation condition of debris flow, has roughly the same influence on the risk of debris flow in the two regions. As shown in Figure 13, southwest China has a special climate with significant regional differences in performance. The climate varies greatly along a vertical direction, the difference between the dry season and the rainy season is obvious, and the precipitation in summer is concentrated and abundant. Due to the different climates of the two regions, the southwest region has more rainfall than the northwest region, which makes the impact of rainfall on the risk of debris flow in the southwest region greater. The main motivating factor of rainstorm debris flow is rainfall. Therefore, sufficient rainfall is required, and the rainfall that triggers debris flow is often instantaneous rainstorm and persistent rainfall. This makes the data span of some experimental groups larger, which makes the group straddle invalid lines in the forest map, thus affecting the analysis results. In addition, it is also related to the existence of multiple rainstorm debris flows in the debris flow samples in northwest China.
Potential advantages of meta-analysis include an increase in power, an improvement in precision, the ability to answer questions not posed by individual studies, and the opportunity to settle controversies arising from conflicting claims. However, they also have the potential to mislead seriously, particularly if specific study designs, within-study biases, variation across studies, and reporting biases are not carefully considered [31]. Moreover, like any tool, statistical methods can be misused. Meta-analyses have received a mixed reception from the outset. Meta-analysis results are credible when a systematic approach is used to prepare a review that minimizes biases and explicitly addresses the issues of the completeness of the evidence identified, the quality of component studies, and the composability of studies [45]. As the statistical principle of meta-analysis has obvious and quantifiable numerical characteristics for the required data, many other debris flow risk factors, such as vegetation coverage and human activities, cannot be analyzed. On a global scale, from an examination of the historical data and previous literature, debris flow susceptibility appears to depend on debris flow formation conditions, such as the watershed area, channel gradient, surface loose material, and rainfall character [46,47]. This is consistent with our results. The results obtained from meta-analysis are similar to the current widely recognized “2 major factors plus 14 minor factors” method proposed by Liu Xilin [43] in the domestic industry. Liu’s ranking of the six factors studied in this paper is DA > LMC > MHD > MDP > SMC > RLS. The reason for the difference in the relative importance of DA and LMC is that the communication survey method used by Liu in the analysis of risk factors did not classify the areas of experts involved in the survey, and it is more inclined to evaluate the destruction ability of debris flow than the assessment of debris flow susceptibility. These results are mainly affected by human factors, such as the selection of sample and sample area. To reduce this error, the following improvements can be made:
  • When selecting research samples, try to select samples from areas with similar geological environments or similar geographical locations to the area under evaluation.
  • In the selection of evaluation factors, risk factors with the characteristics of the region must be first removed, then the risk factors with more universal, quantifiable, and obvious digital characteristics can be selected.
  • When the effects of several risk factors are roughly equal, meta-analysis can be conducted for these risk factors after sample expansion.
  • Find a better way to eliminate the size impact, so that other debris flow risk factors have more obvious digital characteristics, and then can carry out meta-analysis.
Choosing appropriate risk factors is the objective premise of risk assessment. Landslides can be caused by a variety of reasons like intense or prolonged rainfall, earthquakes, geomorphology, slope variations and human activities [48]. Meta-analysis can also be used to provide a reliable basis for the selection of factors for the risk assessment of landslides. Furthermore, coal spontaneous combustion (CSC) causes huge economic losses and casualties, with the toxic and harmful gases produced during coal combustion not only polluting the working environment, but also causing great damage to the ecological environment. The CSC risk assessment needs to carry out a comprehensive assessment from the prediction, detection and determination of the “dangerous area” in a coal mine (i.e., the area most susceptible to fire hazards) [49]. In addition, it is of great importance to select appropriate factors; meta-analysis can also be used to determine a more appropriate selection. The occurrence mechanism of rockburst is complex and there are many influencing factors. The selection of criteria is the key step in the prediction process [50]. The method of factor analysis can be carried out by referring to the steps in the Section 2.2 Procedures in this paper. In future applications in these areas, the methods mentioned above to reduce errors due to human factors also need to be taken into account.

5. Conclusions

With debris flow in China taken as an example, this study collected and collated a large number of data relating to debris flow. It also selected six factors from various factors affecting debris flow for meta-analysis and compared the results of the analysis. This study provides a reliable basis for the selection of debris flow factors. The conclusions are as follows:
  • In this study, meta-analysis was applied to the study on the relative importance of debris flow risk factors, and the analysis results were accurate, which can provide a reliable basis for the selection of debris flow risk factors in debris flow risk assessment.
  • The proportion of each influencing factor in northwest China is as follows, MHD accounts for 26.8%, SMC for 21.9%, MDP for 19.5%, RLS for 14.6%, DA for 9.7%, and LMC for 7.5%. Additionally, in southwest China, MHD accounts for 26.7%, MDP accounts for 22.2%, SMC for 17.8%, RLS for 13.3%, LMC for 11.1%, and DA for 8.9%. The MHD provides the dynamic condition for the generation of debris flow, which undoubtedly becomes the factor with the greatest impact on the debris flow in southwest and northwest China. It is suggested that this factor should be taken as a necessary factor in risk assessment. Given that debris flow occurs in different regions, the selection of risk factors is closely related to the region where the debris flow occurs. When screening risk factors, it is suggested to select the factors with the highest influence degree according to the influence degree in the meta-analysis results, and then select other influential factors with their own characteristics in the risk evaluation area.
  • The application of meta-analysis to the screening of debris flow risk factors is a new attempt. However, other influencing factors, such as vegetation, human activities, etc., lack obvious numerical and quantifiable features and cannot be analyzed. There are still some problems to be further explored, for example, how to quantify and digitize these factors for meta-analysis, and how to avoid problems caused by human factors (such as sample selection and sample size) effectively.
  • The advantages of meta-analysis are obvious. In the future, meta-analysis can be applied to disaster risk assessment of landslide and CSC, rockburst prediction and other factors requiring artificial selection. The methods mentioned above to reduce errors due to human factors also need to be taken into account.

Author Contributions

Data curation, Y.W., Y.X. and H.W.; Formal analysis, Y.W. and T.Z.; Resources, L.N., M.Z. and Y.X.; Supervision, L.N. and M.Z.; Writing—original draft, Y.W.; Writing—review and editing, Y.W. All authors have read and agreed to the published version of the manuscript.

Funding

This work was supported by the National Science Foundation of China (Grant No.41572254 41502322, 41702300), the Science and technology development project of Jilin Province, China (Grant No.20180520073JH), and the Jilin University Outstanding Youth Foundation.

Conflicts of Interest

The authors declare that they have no conflict of interest.

References

  1. Santi, P.M.; Hewitt, K.; Van Dine, D.F.; Barillas Cruz, E. Debris-flow impact, vulnerability, and response. Nat. Hazards 2010, 56, 371–402. [Google Scholar] [CrossRef]
  2. Yu, M.; Huang, Y.; Deng, W.; Cheng, H. Forecasting landslide mobility using an SPH model and ring shear strength tests: A case study. Nat. Hazards Earth Syst. Sci. 2018, 18, 3343–3353. [Google Scholar] [CrossRef] [Green Version]
  3. Dilley, M.; Chen, R.S.; Deichmann, U.; Lerner-Lam, A.L.; Arnold, M.; Agwe, J.; Buys, P.; Kjekstad, O.; Lyon, B.; Yetman, G. Natural Disaster Hotspots: A Global Risk Analysis; The World Bank: Washington, DC, USA, 2005. [Google Scholar]
  4. Dowling, C.A.; Santi, P.M. Debris flows and their toll on human life: A global analysis of debris-flow fatalities from 1950 to 2011. Nat. Hazards 2013, 71, 203–227. [Google Scholar] [CrossRef]
  5. Cui, P.; Liu, S.J.; Tan, W.P. Progress of debris flow forecast in China. J. Nat. Disasters 2000, 9, 10–15. [Google Scholar]
  6. Ni, H.; Zheng, W.; Li, Z.; Ba, R. Recent catastrophic debris flows in Luding county, SW China: Geological hazards, rainfall analysis and dynamic characteristics. Nat. Hazards 2010, 55, 523–542. [Google Scholar] [CrossRef]
  7. Kang, Z.; Lee, C.; Law, K.; Ma, A. Debris Flow Research in China; Science Press: Beijing, China, 2004. [Google Scholar]
  8. Brayshaw, D.; Hassan, M.A. Debris flow initiation and sediment recharge in gullies. Geomorphology 2009, 109, 122–131. [Google Scholar] [CrossRef]
  9. Gao, Y.; Sun, D.A.; Zhu, Z.; Xu, Y. Hydromechanical behavior of unsaturated soil with different initial densities over a wide suction range. Acta Geotech. 2018, 14, 417–428. [Google Scholar] [CrossRef]
  10. Liu, X. Size of a debris flow deposition: Model experiment approach. Environ. Geol. Berl. 1996, 28, 70–77. [Google Scholar] [CrossRef]
  11. Kreibich, H.; Thaler, T.; Glade, T.; Molinari, D. Preface: Damage of natural hazards: Assessment and mitigation. Nat. Hazards Earth Syst. Sci. 2019, 19, 551–554. [Google Scholar] [CrossRef] [Green Version]
  12. Kreibich, H.; Bubeck, P.; Van Vliet, M.; De Moel, H. A review of damage-reducing measures to manage fluvial flood risks in a changing climate. Mitig. Adapt. Strateg. Glob. Chang. 2015, 20, 967–989. [Google Scholar] [CrossRef] [Green Version]
  13. Jiang, Z. A simple discriminant plan of rainstorm debris flow valley in south-west mountain area. J. Nat. Disasters 1992, 3, 1–10. [Google Scholar] [CrossRef]
  14. Zhang, G.; Xu, J.; Bi, B. Relations of landslide and debris flow hazards to environmental factors. Chin. J. Appl. Ecol. 2009, 20, 653–658. [Google Scholar] [CrossRef]
  15. Chen, Y.; Qiao, J.; Peng, Z.; Xie, K.; Yu, H. Screening of debris flow risk factors and risk evaluation based on rank correlation. Rock Soil Mech. 2013, 34, 1409–1415. [Google Scholar] [CrossRef]
  16. Liang, Z.; Wang, C.; Han, S.; Ullah Jan Khan, K.; Liu, Y. Classification and susceptibility assessment of debris flow based on a semi-quantitative method combination of the fuzzy C-means algorithm, factor analysis and efficacy coefficient. Nat. Hazards Earth Syst. Sci. 2020, 20, 1287–1304. [Google Scholar] [CrossRef]
  17. Reichenbach, P.; Rossi, M.; Malamud, B.D.; Mihir, M.; Guzzetti, F. A review of statistically-based landslide susceptibility models. Earth Sci. Rev. 2018, 180, 60–91. [Google Scholar] [CrossRef]
  18. Chandrasekaran, M.; Kim, K.; Krishnamoorthy, R.; Walitang, D.; Sundaram, S.; Joe, M.M.; Selvakumar, G.; Hu, S.; Oh, S.-H.; Sa, T. Mycorrhizal Symbiotic Efficiency on C-3 and C-4 Plants under Salinity Stress—A meta-analysis. Front. Microbiol. 2016, 7. [Google Scholar] [CrossRef] [PubMed]
  19. Temple, J.L.; Hostler, D.; Martin-Gill, C.; Moore, C.G.; Weiss, P.M.; Sequeira, D.J.; Condle, J.P.; Lang, E.S.; Higgins, J.S.; Patterson, P.D. Systematic Review and Meta-analysis of the Effects of Caffeine in Fatigued Shift Workers: Implications for Emergency Medical Services Personnel. Prehosp. Emerg. Care 2018, 22, 37–46. [Google Scholar] [CrossRef] [PubMed] [Green Version]
  20. Schuetz, P.; Wirz, Y.; Sager, R.; Christ-Crain, M.; Stolz, D.; Tamm, M.; Bouadma, L.; Luyt, C.E.; Wolff, M.; Chastre, J.; et al. Effect of procalcitonin-guided antibiotic treatment on mortality in acute respiratory infections: A patient level meta-analysis. Lancet Infect. Dis. 2018, 18, 95–107. [Google Scholar] [CrossRef] [Green Version]
  21. Li, Q.; Li, H.; Zhang, L.; Zhang, S.; Chen, Y. Mulching improves yield and water-use efficiency of potato cropping in China: A meta-analysis. Field Crop. Res. 2018, 221, 50–60. [Google Scholar] [CrossRef]
  22. Brustolin, M.C.; Nagelkerken, I.; Fonseca, G. Large-scale distribution patterns of mangrove nematodes: A global meta-analysis. Ecol. Evol. 2018, 8, 4734–4742. [Google Scholar] [CrossRef]
  23. Hedges, L.V. The meta-analysis of respones ratios in exprimental ecology. Ecology 1999, 80, 1150–1156. [Google Scholar] [CrossRef]
  24. Lajeunesse, M.J. Facilitating systematic reviews, data extraction and meta-analysis with the metagear package for R. Methods Ecol. Evol. 2016, 7, 323–330. [Google Scholar] [CrossRef]
  25. Ma, Z.; Chen, H.Y.H. Effects of species diversity on fine root productivity in diverse ecosystems: A global meta-analysis. Global Ecol. Biogeogr. 2016, 25, 1387–1396. [Google Scholar] [CrossRef]
  26. Zhou, X.; Zhou, L.; Nie, Y.; Fu, Y.; Du, Z.; Shao, J.; Zheng, Z.; Wang, X. Similar responses of soil carbon storage to drought and irrigation in terrestrial ecosystems but with contrasting mechanisms: A meta-analysis. Agric. Ecosyst. Environ. 2016, 228, 70–81. [Google Scholar] [CrossRef]
  27. Abdelraheem, A.; Liu, F.; Song, M.; Zhang, J.F. A meta-analysis of quantitative trait loci for abiotic and biotic stress resistance in tetraploid cotton. Mol. Genet. Genom. 2017, 292, 1221–1235. [Google Scholar] [CrossRef]
  28. Xu, W.; Yuan, W. Responses of microbial biomass carbon and nitrogen to experimental warming: A meta-analysis. Soil Biol. Biochem. 2017, 115, 265–274. [Google Scholar] [CrossRef]
  29. Hong, S.; Park, S.; Park, L.W.; Jeon, M.; Chang, H. An analysis of security systems for electronic information for establishing secure internet of things environments: Focusing on research trends in the security field in South Korea. Future Gener. Comput. Syst. 2018, 82, 769–782. [Google Scholar] [CrossRef]
  30. Marttunen, M.; Belton, V.; Lienert, J. Are objectives hierarchy related biases observed in practice? A meta-analysis of environmental and energy applications of Multi-Criteria Decision Analysis. Eur. J. Oper. Res. 2018, 265, 178–194. [Google Scholar] [CrossRef] [Green Version]
  31. Higgins, J.P.; Green, S. Cochrane Handbook for Systematic Reviews of Interventions. Cochrane Collab. 2008, 2, 81–94. [Google Scholar]
  32. Egger, M.; Smith, G.D.; Phillips, A.N. Meta-analysis: Principles and procedures. BMJ Br. Med. J. 1998, 315, 1533–1537. [Google Scholar] [CrossRef] [Green Version]
  33. Cochran, W.G. The Combination of Estimates from Different Experiments. Biometrics 1954, 10, 101–129. [Google Scholar] [CrossRef]
  34. Higgins, J.P.T.; Thompson, S.G.; Deeks, J.J.; Altman, D.G. Measuring inconsistency in meta-analyses. BMJ 2003, 327, 557–560. [Google Scholar] [CrossRef] [PubMed] [Green Version]
  35. Higgins, J.P.T.; Thompson, S.G. Quantifying heterogeneity in a meta-analysis. Stat. Med. 2002, 21, 1539–1558. [Google Scholar] [CrossRef] [PubMed]
  36. Gregoretti, C.; Degetto, M.; Bernard, M.; Boreggio, M. The Debris Flow Occurred at Ru Secco Creek, Venetian Dolomites, on 4 August 2015: Analysis of the Phenomenon, Its Characteristics and Reproduction by Models. Front. Earth Sci. 2018, 6. [Google Scholar] [CrossRef] [Green Version]
  37. Reid, M.E.; Coe, J.A.; Brien, D.L. Forecasting inundation from debris flows that grow volumetrically during travel, with application to the Oregon Coast Range, USA. Geomorphology 2016, 273, 396–411. [Google Scholar] [CrossRef] [Green Version]
  38. Bogaard, T.A.; Greco, R. Landslide hydrology: From hydrology to pore pressure. Wiley Interdiscip. Rev. Water 2016, 3, 439–459. [Google Scholar] [CrossRef]
  39. Li, F.; Ma, D.; Ma, Y. Characteristics, causes and risk assessment of debris flow in mage gully. Soil Water Conserv. China 2011, 2, 62–64. [Google Scholar]
  40. Heng, Y.W.Z. Formation analysis and characteristic estimation of the debris flow disaster of Shuiqing gully, Heqing, Yunnan on August 12, 2016. Chin. J. Geol. Hazard Control 2017, 28, 27–33. [Google Scholar]
  41. Su, X.Q.; Zhu, J.; Shen, N. Characteristics and hazard assessment of debris flow in Shenjia Gully of Luding County, Sichuan Province. Chin. J. Geol. Hazard Control 2008, 19, 27–31. [Google Scholar]
  42. Jiang, F. Risk assessment of debris flow in zilogou, daocheng county. Guilin Univ. Technol. 2013, 1617, 955–959. [Google Scholar]
  43. Liu, X.-L.; Tang, C.; Ni, H.-Y.; Zhao, Y. Geomorphologic analysis and physico-dynamic characteristics of Zhatai-Gully debris flows in SW China. J. Mt. Sci. 2016, 13, 137–145. [Google Scholar] [CrossRef]
  44. Wang, D.; Chen, L.; Ding, Y. The change trend in rainfall, wet days of China in recent 40 years and the correlation between the change trend and the change of globe temperature. J. Trop. Meteorol. 2006, 22, 283–289. [Google Scholar]
  45. Egger, M.; Smith, G.D.; Sterne, J.A.C. Uses and abuses of meta-analysis. Clin. Med. 2001, 1, 478–484. [Google Scholar] [CrossRef] [PubMed]
  46. Winter, M.G.; Dent, J.; Macgregor, F.; Dempsey, P.; Motion, A.; Shackman, L. Debris flow, rainfall and climate change in Scotland. Q. J. Eng. Geol. Hydrogeol. 2010, 43, 429–446. [Google Scholar] [CrossRef]
  47. Stoffel, M.; Mendlik, T.; Schneuwly-Bollschweiler, M.; Gobiet, A. Possible impacts of climate change on debris-flow activity in the Swiss Alps. Clim. Chang. 2013, 122, 141–155. [Google Scholar] [CrossRef] [Green Version]
  48. Pachuau, L. Zonation of Landslide Susceptibility and Risk Assessment in Serchhip town, Mizoram. J. Indian Soc. Remote Sens. 2019, 47, 1587–1597. [Google Scholar] [CrossRef]
  49. Kong, B.; Li, Z.; Yang, Y.; Liu, Z.; Yan, D. A review on the mechanism, risk evaluation, and prevention of coal spontaneous combustion in China. Environ. Sci. Pollut. Res. Int. 2017, 24, 23453–23470. [Google Scholar] [CrossRef]
  50. Wang, H.; Nie, L.; Xu, Y.; Lv, Y.; He, Y.; Du, C.; Zhang, T.; Wang, Y. Comprehensive Prediction and Discriminant Model for Rockburst Intensity Based on Improved Variable Fuzzy Sets Approach. Appl. Sci. 2019, 9. [Google Scholar] [CrossRef] [Green Version]
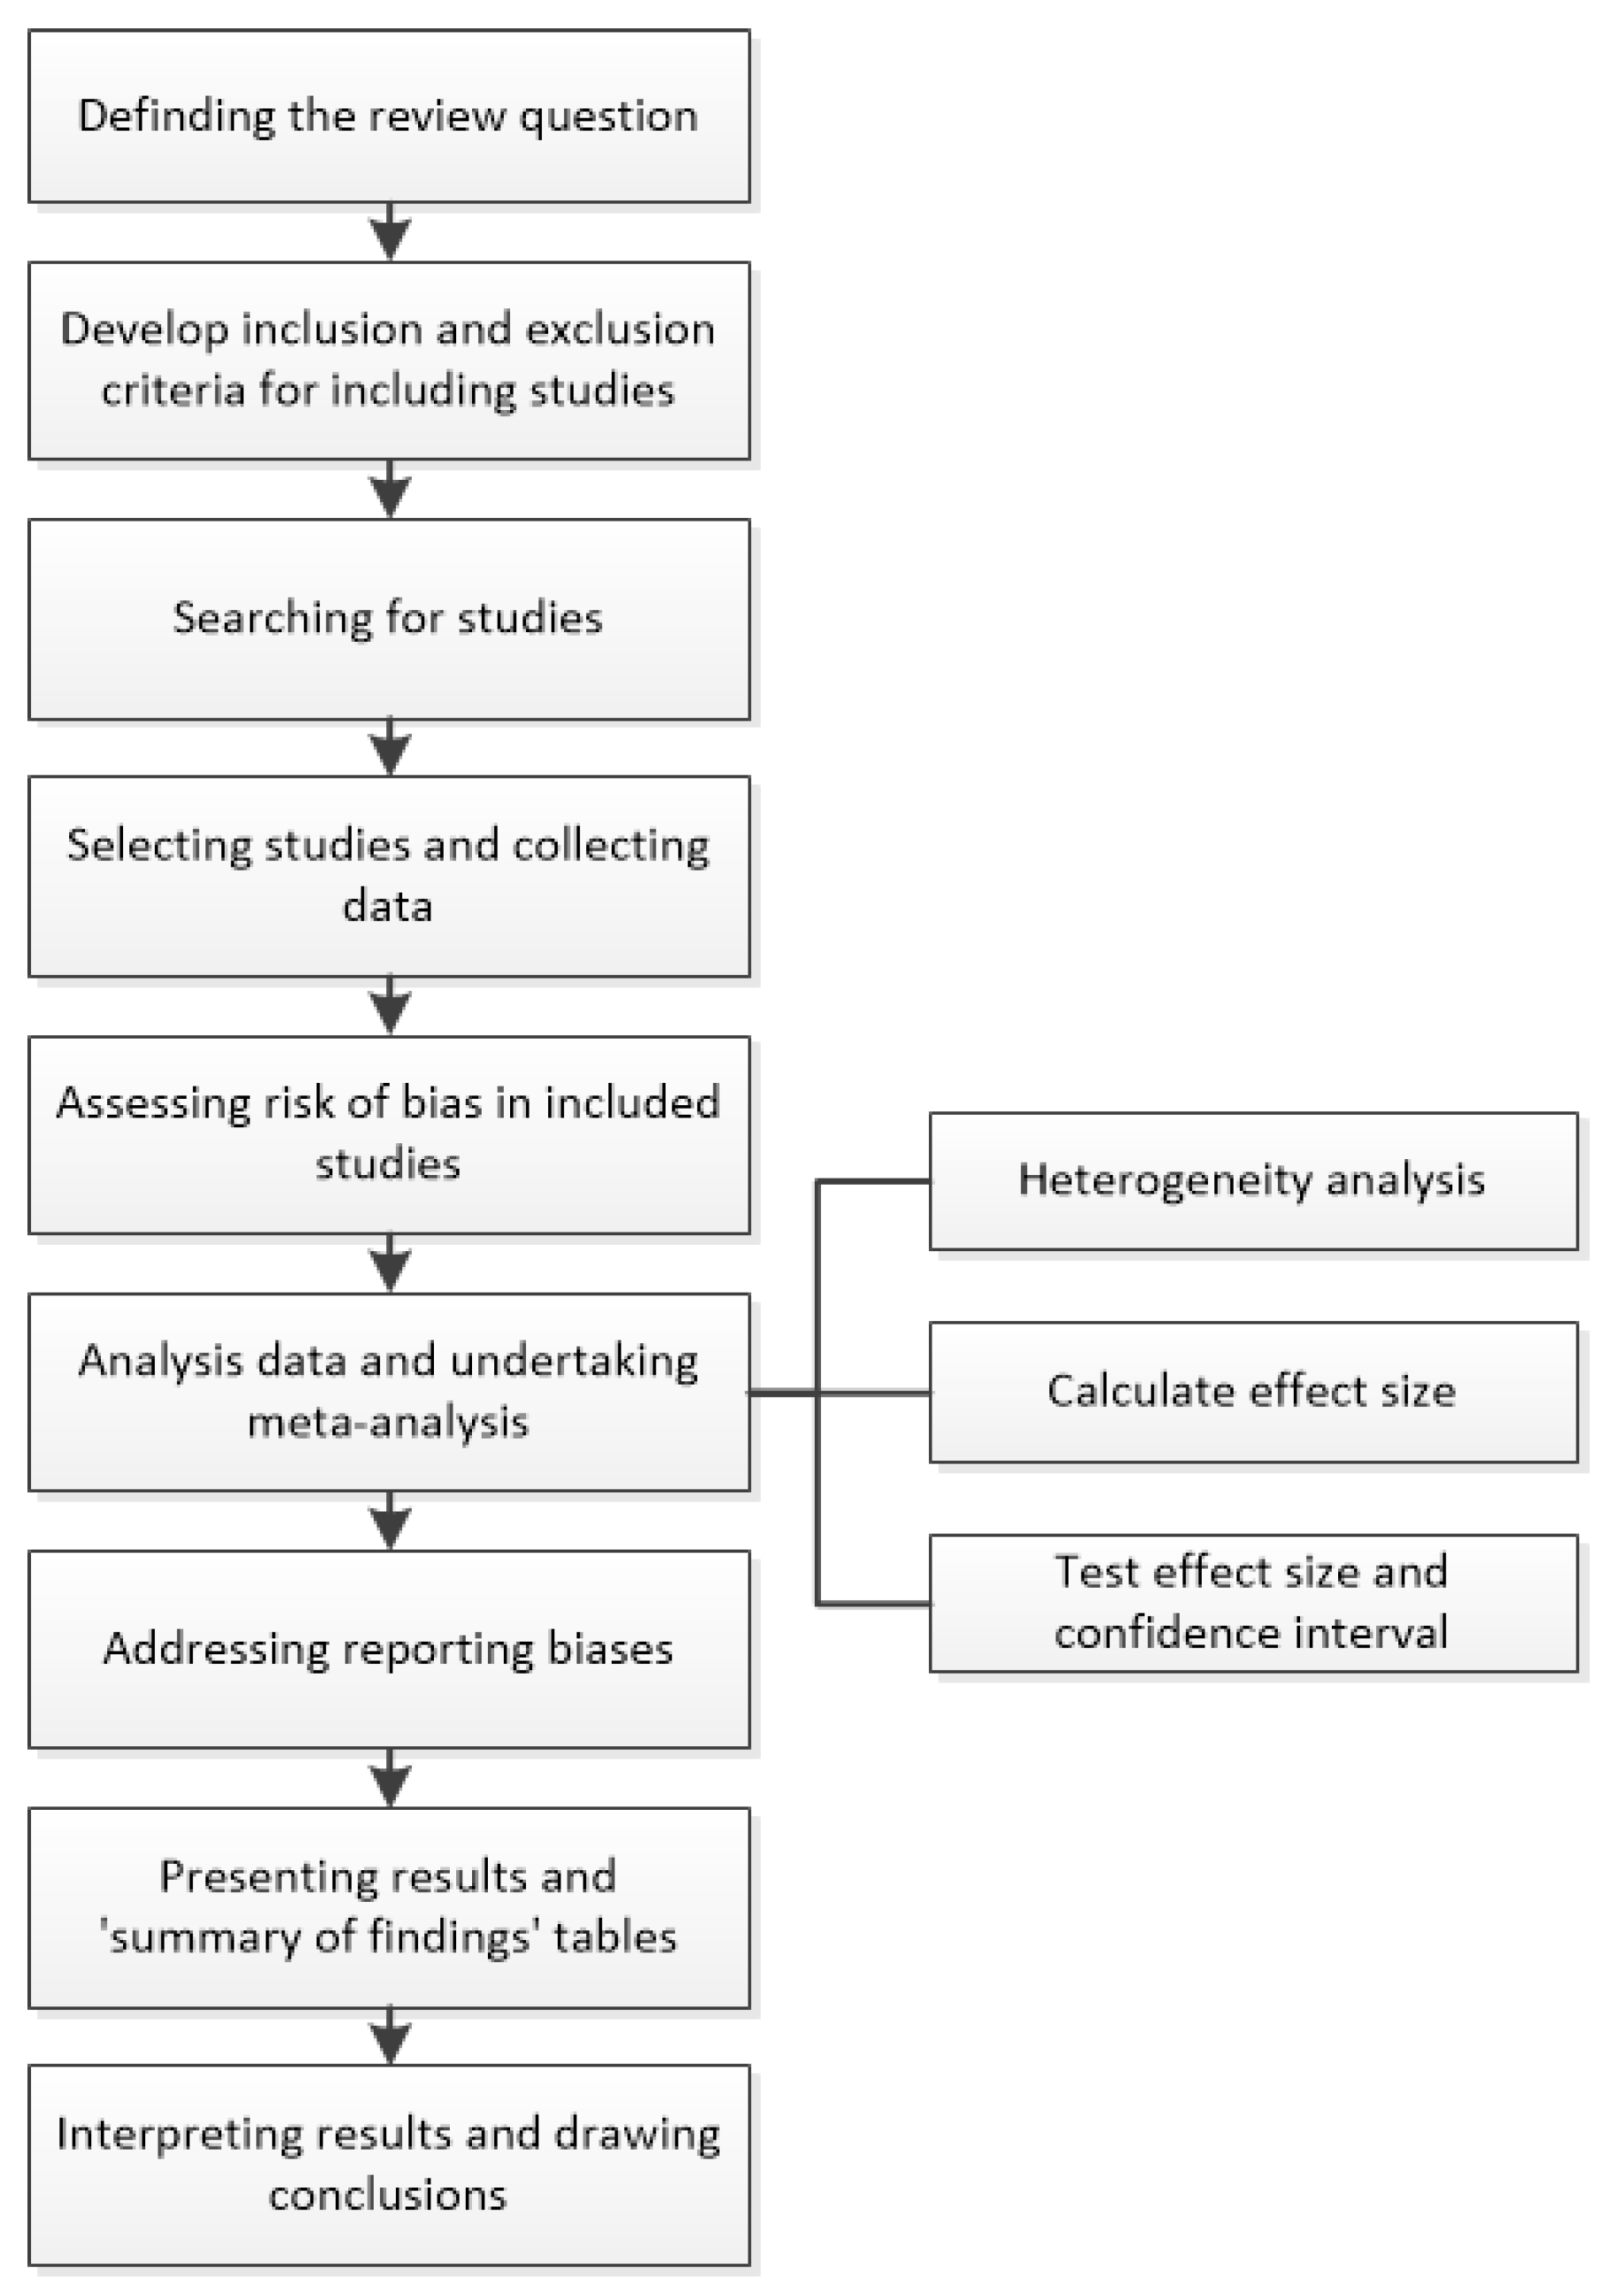
Figure 1. The procedure of meta-analysis [31].
Sustainability 12 06841 g001
Figure 2. The procedure and the results of the study search and selection.
Sustainability 12 06841 g002
Figure 3. Forest map of the influence of maximum daily precipitation on debris flow in China.
Sustainability 12 06841 g003
Figure 4. Funnel map of the influence of maximum daily precipitation on debris flow in China.
Sustainability 12 06841 g004
Figure 5. Locations of debris flow disasters in the literature included in this meta-analysis.
Sustainability 12 06841 g005
Figure 6. (a) Forest map of the influence of maximum relative height difference (MHD) on debris flow in northwest China; (b) box chart of MHD in northwest China; (c) forest map of the influence of MHD on debris flow in southwest China; (d) box chart of MHD in southwest China. (Note: Among the parameters, the top four items are Q statistic test parameters, and the last item is on the test parameters for I2. p > 0.1, there was no heterogeneity. I2 ≤ 50%, no heterogeneity exists.).
Sustainability 12 06841 g006
Figure 7. (a) Forest map of the influence of MDP on debris flow in northwest China; (b) box chart of MDP in northwest China; (c) forest map of the influence of MDP on debris flow in southwest China; (d) box chart of MDP in southwest China.
Sustainability 12 06841 g007
Figure 8. (a) Forest map of the influence of ratio of longitudinal slope (RLS) on debris flow in northwest China; (b) box chart of RLS in northwest China; (c) forest map of the influence of RLS on debris flow in southwest China; (d) box chart of RLS in southwest China.
Sustainability 12 06841 g008
Figure 9. (a) Forest map of the influence of drainage area (DA) on debris flow in northwest China; (b) box chart of DA in northwest China; (c) forest map of the influence of DA on debris flow in southwest China; (d) box chart of DA in southwest China.
Sustainability 12 06841 g009
Figure 10. (a) Forest map of the influence of slope of main channel (SMC) on debris flow in northwest China; (b) box chart of SMC in northwest China; (c) forest map of the influence of SMC on debris flow in southwest China; (d) box chart of SMC in southwest China.
Sustainability 12 06841 g010
Figure 11. (a) Forest map of the influence of length of main channel (LMC) on debris flow in northwest China; (b) box chart of LMC in northwest China; (c) forest map of the influence of LMC on debris flow in southwest China; (d) box chart of LMC in southwest China.
Sustainability 12 06841 g011
Figure 12. Influence degree of debris flow factors on risk of debris flow.
Sustainability 12 06841 g012
Figure 13. Climatic regions and distribution of average annual rainfall in China [44].
Sustainability 12 06841 g013
Table 1. The results of the study selection.
StudyTypeLocationNumber of GulliesNumber of Factors
Wang et al., 2014Channelized debris flowSouthwest910
Chen et al., 2016Channelized debris flowNorthwest27
Guan et al., 2017Channelized debris flowSouthwest910
Shen et al., 2012Channelized debris flowSouthwest77
Zhang J.D., 2017Rainstorm debris flowSouthwest17
Jing et al., 2010Channelized debris flowSouthwest110
Geng et al., 2010Channelized debris flowSouthwest110
Gong et al., 2017Rainstorm debris flowSouthwest33
Liang et al., 2016Channelized debris flowSouthwest18
Tian et al., 2014Channelized debris flowNorthwest17
Yang et al., 2009Channelized debris flowNorthwest18
Li et al., 2014Channelized debris flowSouthwest24
Gao et al., 2016Channelized debris flowNorthwest28
Yang et al., 2016Channelized debris flowSouthwest37
Zhang et al., 2017Channelized debris flowNorthwest17
Cao et al., 2016Channelized debris flowSouthwest35
Tie et al., 2008Channelized debris flowSouthwest17
Jiang et al., 2016Channelized debris flowNorthwest17
Yang et al., 2017Channelized debris flowSouthwest14
Su et al., 2008Channelized debris flowSouthwest17
Zhao J.T., 2016Rainstorm debris flowNorthwest1010
Wang et al., 2008Channelized debris flowSouthwest17
Jiang et al., 2013Channelized debris flowSouthwest111
Mu et al., 2012Channelized debris flowSouthwest1710
Luo et al., 2011Channelized debris flowSouthwest17
Xia et al., 2017Channelized debris flowNorthwest14
Guo et al., 2017Channelized debris flowNorthwest16
He et al., 2015Channelized debris flowSouthwest37
Jiang et al., 2017Channelized debris flowSouthwest110
Feng et al., 2016Channelized debris flowSouthwest110
Xu S.Q., 2016Channelized debris flowNorthwest14
Li et al., 2011Channelized debris flowSouthwest57
Xu et al., 2017Channelized debris flowSouthwest111
Li et al., 2005Channelized debris flowSouthwest68
Liu et al., 2011Channelized debris flowSouthwest57
Zhi et al., 2010Channelized debris flowSouthwest17
Zhao et al., 2016Rainstorm debris flowSouthwest17
Zhang et al., 2011Channelized debris flowSouthwest14
Guo et al., 2013Channelized debris flowNorthwest316
Liu et al., 2010Channelized debris flowSouthwest17
Tang et al., 2011Channelized debris flowSouthwest17
Ling et al., 2017Channelized debris flowNorthwest117
Jin et al., 2016Channelized debris flowNorthwest17
Wang et al., 2017Channelized debris flowSouthwest27
Table 2. Influencing factors for the control group.
Experimental GroupMDP (mm)MHD (m)RLS (%)DA (km2)SMC (°)LMC (km)
Tianjiagou (1)84.7369.7205.51.126.81.9
Tianjiagou (2)60.1339.1126.81.236.13.5
Tianjiagou (3)99.5433.7121.11.831.55.6
Huachi (1)69.0329.1174.61.431.42.9
Huachi (2) 92.1428.9141.61.739.74.6
Honghegou (1)96.8432.8132.61.933.34.6
Honghegou (2)81.3449.4196.71.239.45.5
Meijiagou (1)101.1393.3194.81.629.22.1
Meijiagou (2)100.2337.2149.01.734.13.4
Meijiagou (3)58.8443.6149.21.332.32.6
E84.3395.7159.21.533.43.7
SD16.648.131.20.34.11.3
Table 3. Influencing factors for the experimental group.
Experimental GroupMDP (mm)MHD (m)RLS (%)DA (km2)SMC (°)LMC (km)
Shuijinggou (1)59.3353.0127.01.231.52.1
Shuijinggou (2)78.6340.1131.31.820.85.0
Shuijinggou (3)93.9390.8183.72.141.42.4
Shangzhuogou (1)89.2340.0198.81.932.62.1
Shangzhuogou (2)72.2318.4173.52.222.22.5
Shangzhuogou (3)63.1360.0125.21.829.12.3
Sanyanyugou (1)102.8400.4141.91.535.82.0
Sanyanyugou (2)103.9339.5147.91.335.22.2
Sanyanyugou (3)75.5440.2127.31.831.51.8
Sanyanyugou (4)68.3321.9156.22.230.51.5
E80.7360.4151.31.831.12.4
SD16.038.726.20.46.11.0
Table 4. Influencing factors of control group in southwest China.
Experimental GroupMDP (mm)MHD (m)RLS (%)DA (km2)SMC (°)LMC (km)
Shenjiagou (1)92.6461.5190.52.038.15.1
Shenjiagou (2)106.2331.2216.71.520.22.5
Shenjiagou (3)88.9458.1128.71.537.93.0
Guandigou (1)73.4414.6222.61.837.25.4
Guandigou (2)119.0347.5199.81.926.24.5
Qinglinggou (1)92.3437.1238.41.329.93.7
Qinglinggou (2)118.8444.8221.82.327.85.2
Qinglinggou (3)118.1469.4150.21.725.22.3
Yijiagou (1)70.6335.9189.41.631.25.2
Yijiagou (2)93.3361.1164.31.422.93.0
E97.3406.1192.21.729.74.0
SD17.856.135.20.36.41.2
Table 5. Influencing factors for the experimental group in southwest China.
Experimental GroupMDP (mm)MHD (m)RLS (%)DA (km2)SMC (°)LMC (km)
Ziluogou (1)106.3408.9195.92.138.72.8
Ziluogou (2)118.3380.3195.51.345.03.7
Ziluogou (3)84.2361.4194.62.044.11.7
Dongxianggou (1)109.1440.3192.42.237.52.3
Dongxianggou (2)79.7385.5236.12.243.23.3
Laogangou (1)106.3328.6184.41.637.54.5
Laogangou (2)116.7389.1141.71.329.05.3
Shuzhenggou (1)97.3331.2192.52.236.25.1
Shuzhenggou (2)105.8353.7121.92.541.05.1
Shuzhenggou (3)105.8464.3179.02.136.83.7
E103.0384.3183.42.038.93.8
SD12.644.231.50.44.71.2
Table 6. Expected value (E) and standard deviation (SD) of risk factors in northwest China.
GroupMDPMHDRLSDASMCLMC
ESDESDESDESDESDESD
Experimental group 182.810.8375.046.7166.726.81.40.330.87.93.21.1
Experimental group 274.412.7396.040.4166.026.11.70.333.98.34.50.9
Experimental group 384.812.8403.337.5156.130.91.70.329.56.63.61.5
Experimental group 480.716.0360.438.7151.326.21.80.331.16.12.41.0
Experimental group 588.413.9359.244.2155.625.91.70.332.38.53.41.2
Experimental group 677.614.0388.742.0155.229.91.80.328.85.54.11.3
Experimental group 776.311.3381.137.7145.925.71.30.133.38.33.30.9
Experimental group 886.410.9361.652.8154.023.51.60.332.17.73.41.0
Experimental group 975.910.2382.545.7165.423.91.60.333.46.33.91.1
Experimental group 1089.614.3355.533.2150.130.41.80.328.57.73.61.5
Experimental group 1174.912.2363.241.4152.227.31.70.338.24.23.81.2
Experimental group 1285.512.0365.137.8152.832.11.60.431.36.93.81.4
Experimental group 1380.615.2384.235.5153.126.31.60.430.67.53.51.1
Experimental group 1482.015.0392.137.5171.232.11.60.334.06.93.51.1
Control group84.316.6395.748.1159.231.21.50.333.44.13.71.3
Table 7. Expected value (E) and standard deviation (SD) of risk factors in southwest China.
GroupMDPMHDRLSDASMCLMC
ESDESDESDESDESDESD
Experimental group 196.514.1417.851.4164.438.71.90.331.37.63.71.0
Experimental group 293.717.0421.437.9194.433.61.70.331.27.33.61.2
Experimental group 3100.819.2398.838.4174.935.31.80.334.67.33.01.0
Experimental group 4100.511.2403.560.0190.529.52.10.429.95.72.90.9
Experimental group 599.316.9384.940.4204.440.31.70.228.55.53.61.1
Experimental group 698.914.1413.542.1163.125.31.80.430.96.13.91.0
Experimental group 7102.912.6384.344.2183.431.51.90.438.94.73.71.3
Experimental group 886.812.7398.445.8189.734.02.00.327.05.13.61.1
Experimental group 995.818.5397.240.4186.933.92.00.331.16.03.01.2
Experimental group 1086.914.6414.953.4187.129.41.80.430.85.53.61.1
Experimental group 1186.120.7427.631.6169.445.21.60.333.06.83.41.3
Experimental group 1294.214.4414.347.8187.424.31.90.332.26.63.41.2
Experimental group 1396.614.6405.245.6182.831.91.80.432.86.43.11.0
Experimental group 1484.013.0362.531.1165.233.51.90.331.16.73.61.2
Control group97.317.8406.156.1192.235.21.70.329.66.44.01.2
Table 8. The meta-analysis results of debris flow factors.
GrouppI2 (%)ZValid Point
MDPNorthwest China0.4142.798
Southwest China0.2292.310
MHDNorthwest China0.27192.9211
Southwest China0.16332.612
RLSNorthwest China0.2542.536
Southwest China0.3592.386
DANorthwest China0.3673.344
Southwest China0.3542.564
SMCNorthwest China0.3462.569
Southwest China0.42192.378
LMCNorthwest China0.4202.563
Southwest China0.57102.115
Table 9. Influence degree of debris flow factors.
Proportion of Influence Degree (%)MDPMHDRLSDASMCLMC
Northwest China19.526.814.69.721.97.5
Southwest China22.226.713.38.917.811.1