Abstract
A promising route to attain a reliable impact reduction of supply chain materials is based on considering circular economy approaches, such as material recycling strategies. This work aimed to evaluate potential benefits of recycling scenarios for steel, copper, aluminium and plastic materials to the battery manufacturing stage. Focused on this aim, the life cycle assessment (LCA) and the environmental externalities methodologies were applied to two battery study cases: lithium manganese oxide and vanadium redox flow (VRFB) batteries, based on a cradle-to-gate LCA approach. In general, the results provided an insight into the raw material handling route. Environmental impacts were diminished by more than 20% in almost all the indicators, due to the lower consumption of virgin materials related to the implemented recyclability route. Particularly, VRFB exhibited better recyclability ratio than the Li-ion battery. For the former, the key components were the periphery ones attaining around 70% of impact reduction by recycling steel. Components of the power subsystem were also relevant, reaching around 40% of environmental impact reduction by recycling plastic. The results also foresaw opportunities for membranes, key components of VRFB materials. Based on findings, recycling strategies may improve the total circularity performance and economic viability of the studied systems.
1. Introduction
Sustainable development of battery performance lies not only in finding novel materials, but also in minimising resource consumption. It is predicted that some metals, such as copper required for electrodes, will manifest some kind of scarcity by increasing their prices and, consequently, the supply situation could be much improved if the recycling is promoted [1]. In this sense, a promising route to attain reliable environmental impact and cost reduction of supply chain materials is based on considering circular economy approaches [2]. This concept is already applied to other energy systems and manufacturing processes, where the reuse of energy flows [3], materials employing waste converted into by-products [4] or energy [5] are deeply analysed, to avoid virgin material consumptions.
Some insights regarding the environmental issues of battery recycling are already provided but, results are mostly based on different reference scenarios, which make it difficult to perform comparisons. Rydh and Karlström [6] focused on analysing nickel–cadmium batteries manufacturing using raw and recycled material. They concluded that batteries manufactured with recycled cadmium and nickel require 46% and 75% less primary energy, respectively, compared with extraction and refining of raw metal. Unterreiner et al. [7] analysed the ecological impacts of LiFePO4 (LFP) and vanadium redox flow battery (VRFB) by applying scenarios of reusable materials. This analysis determined materials, which were responsible for the environmental burden. Particularly, it corresponded to copper, gallium and iron(III)phosphate for the Li-ion batteries (LIB), whereas polyvinyl chloride (PVC) and polytetrafluoroethylene (PTFE) were identified in the VRFB. Additionally, Wang and Wu [8] focused on recycling and treatment of spent LiFePO4 batteries in China. They concluded that it is necessary to promote strategies for optimising the recycling mode, increasing the precious metals recovery efficiency and decreasing the chemical reagents consumption although the end-of-life (EOL) treatment are challenging. Song et al. [9] were mostly focused on the cathode and anode materials in LIB to calculate the relative criticality of the raw materials. They identified that the lithium batteries recyclability can be around 40%, considering critical materials and limitation on recycling infrastructure. Weber et al. [10] evaluated the potential of environmental impact reduction due to recycling perspective for VRFB and lithium−iron-phosphate-based cathode with lithium-titanate anode (LFP-LTO). They identified higher recyclability for VRFB compared to the lithium-based batteries, considering the recycling routes for steel and copper.
Focusing on these results, it is evident that future research efforts should be addressed to increasing the efficiency of resource use, considering the recyclability potential from the earlier design stages of batteries. This type of action might contribute to identifying opportunities for innovation and boosting adequate and sustainable battery manufacturing.
Fractions of plastic, copper and steel are relevant in this type of energy storage technology, in addition to there being distinguished industrial recycling processes for these type of materials, with recycling efficiency in the range of 56–81% [11]. Aluminium and graphite battery components are also relevant, and they can be also counted among materials with available industrial recycling processes. Nevertheless, recycling of the graphitic anode is limited, owing to its lower recovery value [12]. Based on the available published literature, there is a need to conduct an exhaustive evaluation of the environmental burden associated with this type of materials and circular economy strategies. In this vein, the applicability of material recycling strategies during battery manufacturing provides solutions for attaining a long-term material supply too, as they are foreseen to minimise impacts related to the battery EOL, not only in terms of cost, but also in terms of environmental burden [12,13]. In addition, recycling may generally contribute to minimising costs due to the reduction of raw material manufacturing, but the cost-related impacts of battery recycling scenarios have not been covered in detail yet [7,9,10].
According to a previous published work from authors [14], lithium-ion (Li-ion) and redox flow batteries (RFB) constitute the ones with more potential development opportunities on the battery market, based on the ongoing evolution of batteries, their technological maturity, market roll-out level and related costs, [14,15,16]. In this vein, a deeper comparative analysis of the two batteries was carried out in this work, while considering the evaluation of recycling scenarios for steel, copper, aluminium and plastic materials to the battery manufacturing stage.
In this work, these two batteries were compared in terms of environmental burden distributed per material type and components attributed to the consumption of both virgin and secondary materials, depending on two recyclability scenarios related to plastic, steel, copper and aluminium fractions used in the battery manufacturing process. In particular, a detailed assessment of the active materials lithium manganese oxide and vanadium pentoxide was not included in the analysis, due to the limited and existing life cycle inventory (LCI) reported in the literature. Concerning electrolyte recovery, some considerations have been taken into account in this study. As stated by Weber et al. [10], VRFB electrolyte is foreseen to exhibit minimal issues of degradation and, therefore, it can be possibly entirely reuse. Although the recovery of lithium salt is important, this analysis was out of the scope of the published work, which has been focused on widely used recycling processes, whereas emerging technologies [12,17,18] have been excluded.
For the rest of components, the effect by the comparison of cases (i.e., with and without secondary fractions of the four selected materials) quantifies impacts related to the same amount of resources, except for plastic, steel, aluminium and copper.
2. Methodology
The methodological approach presented in this work has been divided into three main core actions:
- (i)
- To establish recyclability scenarios for plastic, steel, copper and aluminium fractions in the two batteries studied, based on available data.
- (ii)
- To perform a reliable and consistent life cycle model on the life cycle assessment (LCA) methodology, to evaluate the recyclability scenarios.
- (iii)
- To compare the environmental impacts of the two batteries in monetary terms quantified by external environmental costs (externalities), i.e., the monetarization of environmental impacts.
A detailed description of the methodological approach, as well as main assumptions carried out to their development, is presented in this section.
2.1. Recyclability Scenarios
To assess impacts related to the use of recycled materials (plastic, copper, aluminium and steel) into the batteries value chain, two different scenarios have been assessed for each battery type: scenario A, based on virgin materials, and scenario B, defined by a fraction of virgin and secondary or recycled materials. For the latter, the fraction of secondary materials was done according to the maximum recycled efficiency attributed to these materials (see Section 2.2.3).
In this approach, it was considered that the recycled materials have the same inherent properties of the virgin material according to a semi-closed loop recycling process. The allocation procedure assumed for the recycling processes was the substitution method or avoided burden method. By this approach, the subtraction of primary or virgin material by the use of a fraction of secondary or recycled materials leads to lowering the environmental impacts. In this light, the amount of secondary or recycled materials was quantified for each battery technology, based on the effective recycling efficiency for plastic, copper, aluminium and steel. To keep the same total amount of materials required in both scenarios, some primary material was also needed in scenario B. The main results of the assessed scenarios are described and discussed in the following sections.
2.1.1. Scenario A (Baseline)
Scenario A corresponded to model the worst-case, where virgin (primary) materials are only considered as input, and the benefits of recycling are ignored. In this case, the LCA modelling of batteries was based on the use of virgin materials.
2.1.2. Scenario B (Recyclability Routes)
Scenario B was defined a simplified approach to model the recycling scenarios. In scenario B, the LCA modelling of the battery manufacturing included the fraction of materials produced by secondary or recycled sources involving the impact of recycling treatment and the fraction of virgin material (i.e., the remaining input). Accordingly, it consisted of an optimal study-case, which assesses the influence of aluminium, copper, steel and plastic recycled materials in battery manufacturing.
2.2. LCA Modelling
The life cycle assessment (LCA) is the methodology used to evaluate the potential recycling of the metals mentioned above. This methodology is supported by the recognised standards ISO 14,040:2006 [19] and 14,044:2006 [20], which includes four interrelated phases: goal and scope definition, inventory analysis, impact assessment and interpretation (see Figure 1)
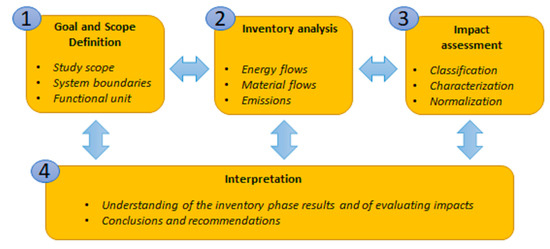
Figure 1.
Principal phases of the life cycle assessment (LCA) environmental model.
2.2.1. Goal and Scope Definition
The main objective of this analysis was to assess the environmental performance associated with the two batteries, lithium manganese oxide (LMO) and VRFB, considering recyclability opportunities during the manufacturing stage and using a cradle-to-gate perspective. This approach aimed to identify key aspects related to a certain production phase [21,22] and accordingly, it was selected to provide a high degree of precision to the analysis of the manufacturing stage, based on the environmental LCA point of view. Within this approach, a detailed analysis of the key components in terms of materials consumption and environmental impact was included.
As can be seen in Figure 2, this study was focused on the evaluation of battery manufacturing under a life cycle perspective from a cradle to gate approach. System boundaries corresponded to the analysis of the battery components manufacturing and energy consumption for the assembling. The raw material mining and conditioning for the components manufacturing were also considered. Based on previous work [14], the component production stage exhibited a greater environmental impact compared with the assembly stage in most impact categories. Accordingly, this study excludes the energy consumption for assembling. Due to this, the research aimed to assess the resources in the manufacturing stage, the system was focused on electrodes, electrolyte, separator and case or cell container, which are the components of the battery (see Figure 2).
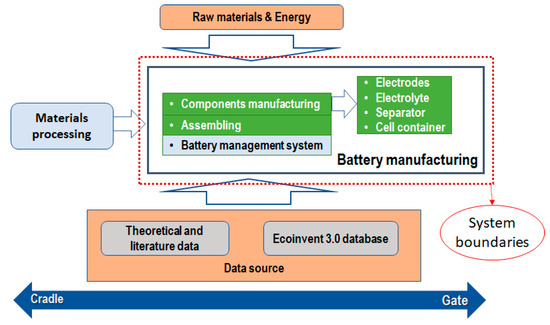
Figure 2.
System boundaries defined for the LCA.
The functional unit is defined for this study as 1 kWh of storage energy. In addition, the timescale was considered as 20 years. All inputs and outputs related to the different product value chains were managed and correlated consistently based on these two references.
2.2.2. Inventory Analysis
LCI involves all the inputs and outputs (energy and material) considering the functional unit, timescale and system boundaries previously established. In this work, LCI was mainly generated from in-house databases, based on results previously published by authors [14] and complemented by an exhaustive review of available data in the literature and Ecoinvent 3.4 database [23]. To attain normalised information in respect to the functional unit and timescale, the information for each battery was collected in terms of (i) battery characteristics and (ii) battery composition (gathered as weight per cent distribution) and energy requirements for assembling.
Data considered for the LCI are based on the general characterisation of the main battery components. The LCI for the LMO battery is based on the SUBAT report [24] and LCI for VRFB was compiled from Rydh [25]. Both references were considered appropriate to guarantee the quality and relevance of the comparative analysis, as well as for evaluating the recyclability opportunities of the two systems. LCI data from these works has also been used in different published LCA and life cycle costing (LCC) studies [26,27,28].
To quantify the impacts associated with recycled materials, information concerning recycling efficiencies for aluminium copper, steel and plastic was collected and based on current industrial recycling processes, such as those reported by Rigamonti et al. [11], Based on this study, the maximum recycling efficiency was considered as 81.45% for steel, 55.71% for plastic and 79.33% for copper. Since there was a lack information for copper recyclability efficiency, recyclability for copper was a assumed as aluminium.
2.2.3. Impact Assessment
The environmental analysis was developed with SimaPro 8 software, version Analyst 8.5.0.0, and ReCiPe 2016 v1.1 midpoint method (Hierarchist version) as the selected method of evaluation. The midpoint approach is considered more comprehensive to cover possible environmental interventions, which defines the environmental mechanism throughout the quantification of the impacts at the intermittent stages of the cause-effect chain.
Specifically, the ReCiPe midpoint method is one of the most recent and harmonised methods available in life cycle impact assessment. This approach makes it possible to calculate eighteen midpoint impact categories or environmental indicators, which are shown in Table 1. Among them, special attention is paid to toxicity and ecotoxicity categories (kg 1,4-DCB), global warming potential (kg CO2 eq), as well as mineral resource scarcity (kg Cu eq) and fossil resource scarcity (kg oil eq). This selection is supported by results attained from other relevant LCA studies performed on Li-ion batteries and VRFB [10,22,29], as well as on other battery types [30].

Table 1.
Environmental impact indicators studied.
2.3. External Environmental Costs (Externalities)
LCC is a tool that evaluates the costs of an asset throughout its life cycle (acquisition, use, maintenance and EOL). An environmental approach of the LCC analysis, also named an environmental (ELCC) methodology, also allows for estimating the external costs or indirect costs, which relates the environmental impact into monetary data. To quantify all environmental impact as a global value, this research applied the calculation of environmental externalities (indirect cost) to estimate the cost of the recyclability scenarios considered in this work.
The external costs are equivalent monetary values of indirect damages that are not explicitly captured in the marketplace, including, for instance, the monetary value of climate change mitigation [31,32]. Environmental externalities are linked to the product, service or works during its life cycle (such as the cost of emissions of greenhouse gases or other pollutant emissions, and other climate change mitigation costs).
For determining externality costs, different weighting methodologies exist. All of them have in common a framework based on analysing the cause-effect chain of the environmental impacts. The cause-effect chain starts with the environmental impacts obtained from the LCI used to apply the LCA. Then, a monetary weight is given to each environmental indicator (EI) by applying the corresponding external cost factor (ECF), as in Equation (1).
EI is the environmental indicator referred to the reference unit selected to the LCA under consideration (for example, kg CO2 eq as the unit for the global warming potential (GWP) indicator); ECF is the external cost factor related to EI under analysis in EUR/(unit of the EI) and, thereby the external cost (EC) is obtained in EUR.
In this work, the external cost factors accounted for different environmental impacts were taken from available data in the literature related to 2015 prices [33,34]. Values were updated to 2019 prices by applying the inflation rate of 3%. Table 2 summarises the updated cost factors.
Table 2.
External cost factors to monetarism environmental impacts.
3. Results and Discussion
3.1. Battery Characteristics
A summary of main battery characteristics considered in the calculations is shown in Table 3. Values depicted in this table represented the average values of data found in the literature.
Table 3.
Average characteristics of the selected batteries based on the literature.
As mentioned before, the functional unit used in this study is stablished in 1 kWh of stored energy. Therefore, the characteristics in Table 3 were used in order to homogenize the quantity of materials and energy required to the battery manufacturing using the LMO and VRFB inventories. This is necessary in order to scale the inventory of both batteries to the functional unit chosen.
In this sense, raw data from the literature was gathered as g of material per 100 g of battery. Then, the LCI was referred to the functional unit (kWh of stored energy), considering the time scale (20 years) using Equation (2).
The LCI results are shown in Table 4 and Table 5. Materials included in these tables corresponded to the total amount of materials accounted for the battery manufacturing, according to the cradle to gate perspective applied in this research. As it can be seen from Table 4 and Table 5, the battery manufacturing stage comprised materials used for electrodes, electrolyte, separator and case manufacturing, as well as energy assembling.
Table 4.
Life cycle inventory (LCI) results for LiMn2O4 battery.
Table 5.
LCI results for vanadium redox flow battery (VRFB).
For LMO, the amount of materials has been obtained by the information available in the literature [24], which was also published in recognised journals [22,26]. For VRFB, the LCI includes the material and energy requirements based on a previous work published by Rydh [25]. This latter work contains detailed information in terms of battery materials. It has even been used as the LCI reference for VRFB in another more recently published work by Arbabzadeh et al. [27].
3.2. Distribution of Recycled Materials
Based on the considerations described in Section 2, materials evaluated for the recyclability scenarios were basically ferrous and non-ferrous metals and plastics (i.e., steel, aluminium, copper and plastic). In terms of consumption of the four previously mentioned materials, i.e., plastic, copper, steel and aluminium, the lithium battery composition is aluminium-dominant, whereas steel is the more relevant material for VRFB. Table 6 shows materials considered for each battery type and corresponding components. In Table 7, the amount of materials corresponding for both virgin and secondary fractions in scenario B are showed.
Table 6.
Battery materials for recyclability scenarios by components.
Table 7.
Amount of materials considered for the recyclability scenario B.
A comparison of the materials to be recycled to the total weight of the battery components suggests that LMO potential material reduction is three times the one of VRFB. This effect is due to the fact that electrolyte represents 84% of the total weight for VRFB, whereas it is only 15% for LMO. On the contrary, if the two batteries are compared in terms of the amount of plastic, copper, steel and aluminium in batteries, similar conditions are identified between batteries. Taking into account scenario B (see Figure 3), which involves secondary and virgin fraction of the four materials in batteries, it is estimated that the percentages of both fractions are similar in the two batteries. The recycled fraction is estimated by the effective recycling efficiency, as reported in Section 2, and is assumed to be the same for the materials in both batteries.
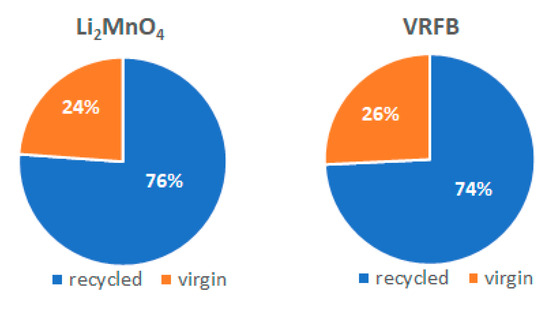
Figure 3.
Fraction of recycled materials for both types of batteries. Data are referred to the total weight of materials considered for the recycling scenarios.
A more detailed analysis per materials in given in Figure 4. This figure shows the distribution of materials according to the recycling scenarios. Fractions of aluminium, copper, plastic and steel are represented in terms of total amount of materials given in Table 7. Figure 4A depicts fractions considering total amount of materials assumed as virgin materials (Scenario A) whereas Figure 4B represents the materials considering the recycled and virgin fractions (Scenario B). Aluminium and copper corresponds to the main materials consumed for the lithium battery, whereas steel and plastic are the most relevant materials identified for the redox battery, as depicted in Figure 4A.
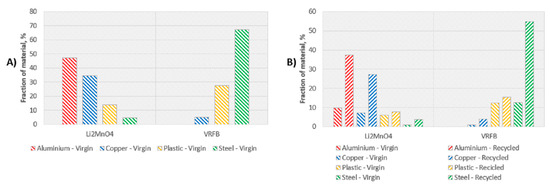
Figure 4.
Distribution of materials modelled in the recyclability scenarios for LiMn2O4 and VRFB: (A) left: percentage of aluminium, copper, plastic and steel as virgin materials, (B) right: percentage of aluminium, copper, plastic and steel considering virgin and secondary fractions.
Applying the effective recycling efficiency, an important reduction of environmental impact related to manufacturing is expected, with a reduction of 79% for virgin copper/aluminium in LMO battery and 81% for virgin steel in VRFB (see Table 7 and Figure 4B). It has been proved that battery recycling provides not only environmental but also economic benefits for sustainable production processes and, therefore, the potential recyclability of their components is a key issue to evaluate. In this sense, Tang et al. [40] carried out a social-economic-environmental impact assessment of recycling retired EV batteries considering different reward-penalty scenarios. The study concluded that a relatively high minimum recycling rate is beneficial to reduce the policy implementation cost and the environmental burden of untreated batteries.
3.3. Comparative LCA of the Two Batteries
Figure 5 shows the main results obtained in the analysis for both batteries (LMO and VRFB) and results for scenarios A and B as percentage normalised to the maximum value in each indicator attained for the eighteen midpoint environmental categories.
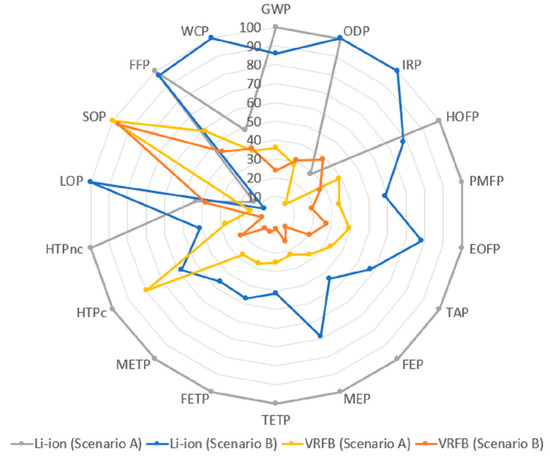
Figure 5.
Environmental impact results for both types of batteries and scenarios considered.
As can be observed in Figure 5, better environmental performance is identified for the VRFB scenarios in most indicators, considering either the use of primary or virgin materials (Scenario A) or recycled/virgin fractions (Scenario B). This result is aligned with Weber et al. [10], where recyclability scenarios based on the studied materials also provided significantly higher environmental benefits for VRFB manufacturing than for an LMO battery. Furthermore, it can be seen from Figure 5 that the LMO battery (Scenario A and B) depicted the highest impacts for almost all the impact categories, except for mineral resource scarcity. This latter indicator is the only case where the conventional VRFB battery attained the greatest value. As mentioned in Section 2, the methodological approach applied in this work does not consider recyclability scenarios for the critical materials in the LCA modelling, as this work is only focused on assessing scenarios for materials with mature and widely extended recycling technologies (copper, plastic, steel and aluminium). This result addresses a very important issue related to the material availability of the vanadium compared to lithium, and, therefore, it is expected to be modelled in detail in further research.
The results have also demonstrated that a share of recycled materials contributes to minimising the environmental impact for most of the indicators. This is in agreement with other studies, such as that performed by Unterreiner et al. [7], who concluded that it is possible to reduce between 15 to 50% of the ecological footprint of three different batteries based on lead, lithium and vanadium, applying recycling strategies. Therefore, it can be concluded that the benefits of avoiding extracting raw materials are high enough to overcome the additional impacts associated with the recycling treatment processes of the materials.
Figure 6 shows the impact reduction attained per indicator identified in this study as the more relevant ones. They are the toxicity and ecotoxicity categories (kg 1,4-DCB), global warming potential (kg CO2 eq), as well as mineral resource scarcity (kg Cu eq) and fossil resource scarcity (kg oil eq).
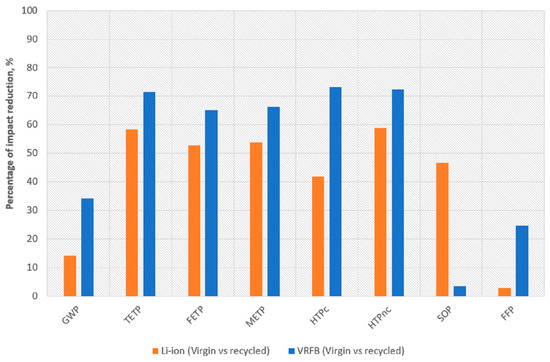
Figure 6.
Percentage impact reduction attained per battery type for selected indicators.
It is seen that the toxicity and ecotoxicity categories (terrestrial ecotoxicity (TETP), freshwater ecotoxicity (FETP), marine ecotoxicity (METP), human carcinogenic toxicity (HTPc), human non-carcinogenic toxicity (HTPnc)) generally achieved values above 50% for the two batteries, reaching even values above 65% in case of VRFB. These categories are quite sensitive to the effect on the soil, water or air of some metals such as zinc, chromium or copper that are present in the batteries. Consequently, recycling actions decrease their environmental concern notably. These results are aligned with previous studies, which reported the toxicity relevance of mining and other industrial activities of raw metals and metal compounds, as well as the landfilling of the batteries [41] and the necessity to increase waste treatments and battery material recycling [42]. Chen et al. [43] stated the relevance of remanufacturing and repurposing of batteries to enlarge their lifetime, but, finally, recycling is the way to close the loop by returning materials to the value chain. In addition to the relevance described for batteries, this approach is also important for those components based on high-quality materials.
A more detailed analysis is given for the other indicators where higher differences among the two batteries were identified. In this vein, it was carried out the network analysis with a node cut-off of 8% to identify main contributors (i.e., the key materials) of the obtained results for the impact category explored.
In particular, GWP for the LMO was mostly minimised by the lower aluminium consumption for manufacturing the electrodes in the recycling scenario. This result correlates as expected by data shown in Figure 5. For LMO, aluminium had a more significant virgin and recycled fractions for the modelled recycling scenarios (see Figure 4A,B). A similar analysis was done for the other three categories. Concerning mineral resource scarcity (SOP), the lower fraction of virgin metals used for the electrodes (mainly copper) has contributed to the attained credits. It can be noticed the rather low benefit attributed to VRFB. Based on the network, SOP is affected by vanadium a critical raw material. As mentioned in Section 2.1, this material was not assessed in terms of recyclability. Due to vanadium related impact, this material is expected to be studied in more detail in future work. Regarding fossil resource scarcity (FFP), the benefits achieved for Li-ion battery are related to the reduction of plastics consumption for the separator and steel used for the case.
Concerning VRFB, benefits for GWP were attributed to steel consumption reduction for manufacturing of peripherical components (pumps, motors, racks and bolts). Similar to the results attained for the LMO, values obtained for VRFB correlated as expected by data shown in Figure 4. In this case, steel had the predominant virgin and recycled fractions for the modelled recycling scenarios (see Figure 4A,B). Similar effects were identified for the other two indicators (SOP and FFP).
3.4. Comparative Cost Analysis of the Recyclability Scenarios
As indicated in Section 2, it is relevant to assess the cause-effect chain of the environmental impacts by providing a monetary weight to each environmental impact. Needs for this type of analysis are based on the relevance that related technological costs exhibit, as drivers to advance on sustainable manufacturing processes [44,45]. Accordingly, the environmental externalities of the two batteries were quantified by applying considerations described in Section 2. Results shown in Table 8 correspond to the monetisation of all the environmental impacts caused during the manufacturing of each battery, according to each scenario.
Table 8.
Externality results for lithium manganese oxide (LMO) and VRFB manufacturing during the battery lifetime of 20 years.
It should be emphasised that the environmental prices given for ecotoxicity, like those for human toxicity, involve greater uncertainty than those for the other indicators based on data available in the literature [33,34]. Accordingly, the results were given based on the total impact categories and by excluding toxicity and ecotoxicity categories (case without Tox./Ecot.).
The total cost of the externalities associated with the modelled recycling scenarios follows a similar tendency to the one observed by the comparative LCA (see Figure 5). For LMO, the modelled recyclability scenario provided a reduction of around 27% of the initial impacts, considering pure raw materials. For VRFB, the best option that corresponds to Scenario B represents a potential reduction of almost 26% of the environmental impact in the manufacturing stage, based on virgin materials. For the later, the more influential categories are terrestrial acidification (TAP), fine particulate matter formation (PMFP), land use (LOP) and GWP, in that order of relevance.
Figure 7 represents the relative distribution of the most relevant environmental categories for the best condition (VRFB, Scenario B). It is determined that terrestrial acidification is mostly affected by the use of sulphuric acid for the electrolyte based on the network analysis carried out with a node cut-off of 15%. As mentioned in Section 2.1, recyclability was not considered for this material in the modelled scenario, so it is identified as a key material to consider in further work. Opportunities to reuse might significantly minimise the global manufacturing impact.
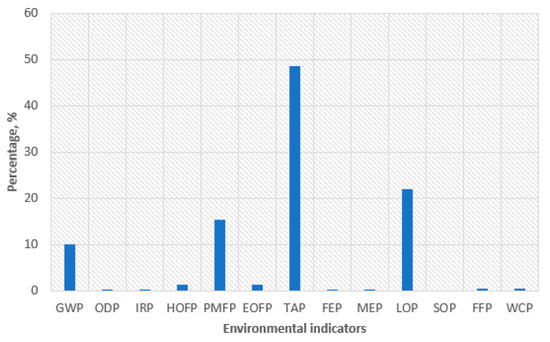
Figure 7.
Relative distribution of externalities cost attained to VRFB (Scenario B) and selected indicators.
3.5. Assessment of VRFB Recyclability
Due to better environmental performance attained for the VRFB (see Figure 5), it is interesting to attain a deeper assessment of this system. In this sense, a comparison of both VRFB scenarios is presented in Figure 8 in terms of the normalised percentage for the 18 indicators studied. It is observed that there is a significant reduction of environmental impacts in almost all indicators when recyclability case is considered. The benefits associated with recycled materials were in agreement with Weber et al. [10], where a reduction of the battery environmental burden was also identified for the manufacturing process by incorporating recycling. The results support that greater environmental benefits can be obtained when the recycling efficiency is increased, for instance, by avoiding the need for new mineral extraction or impacts related to specific EOL scenarios. Therefore, it is important to promote the reuse or recycling of the materials.
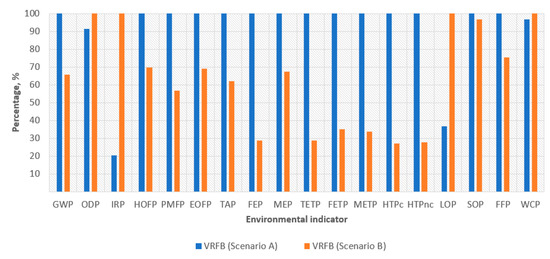
Figure 8.
Environmental performance of the VRFB using virgin material versus recyclability study case.
The percentage of reduction through the 18 indicators increases by 70% registered in the HTPnc, which indicates that the recyclability benefits depends on the indicator analysed.
3.6. VRFB Environmental Impact by Components
Figure 9 explores the environmental burden attributed to the VRFB components according to both scenarios considered. In general terms, the main battery components—defined as (i) electrodes, (ii) electrolyte and (iii) periphery components (i.e., pumps, motors, racks and bolts)—depicted the highest environmental burden in almost all the 18 indicators. If analysing the effect of the reduction of primary material, it is identified that environmental impact decreased considerably in terms of components constituted by steel for periphery components in most indicators.
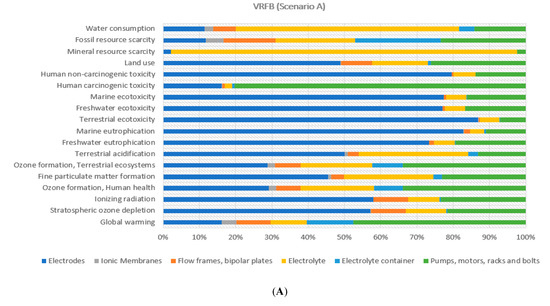
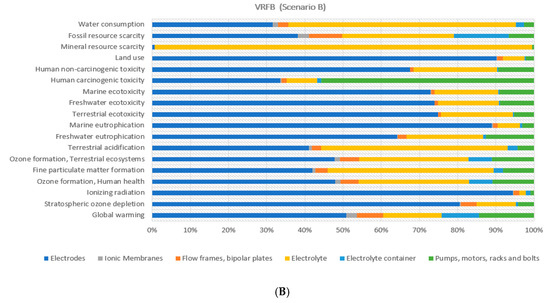
Figure 9.
Environmental percentage distribution of the VRFB components (Scenarios A and B).
As mentioned in Section 3.3, this result correlates as expected by data showed in Figure 4. Accordingly, for electrodes, copper has the main effect. On the contrary, an increment of the environmental burden is attained to the electrolyte, since the recyclability routes for sulphuric acid and vanadium pentoxide were not considered in the LCA modelling, due to a lack of data in the literature.
Regarding the plastics, present in the flow frames and electrolyte container, it could be observed a similar impact reduction behaviour in the 55% of the indicators, but at a lower decreasing rate, due to the less significant fraction of this material compared to steel also affected by the effective recycling efficiency of around 56% (see Figure 4). The comparison of the benefits attained by the use of a recycled fraction of steel, copper and plastic materials (see Figure 9) indicated that the recyclability scenarios of steel and copper provided an impact reduction above 50% for electrodes and periphery components in most indicators, whereas it was rather lower for membranes, flow frames, bipolar plates and electrolyte container based on differences of recycled fractions mostly used for each component (see Figure 4).
3.7. VRFB Environmental Impact by Battery Materials
Based on the previous section, it has been recognised that the best scenario corresponds to the evaluation of VRFB recyclability (Scenario B). In this section, a deeper analysis per materials was done to explore more insight on the environmental burden of the VRFB component. This type of assessment makes it possible to identify the key materials where new strategies for the recyclability optimisation can be carried out or conduct actions on the no recycled materials to improve their environmental behaviour. In this vein, the global warming indicator has been taken as an example for scenario B.
To identify key materials, network analysis has been carried out with a node cut-off of 5% to show the main contributors of the obtained results for the impact category explored. As the impact depends on the category to be analysed, the GWP indicator is taken as an example to elucidate more insight the environmental burden attained to each battery component.
According to this scenario, it has been reduced by around 70% the impact on the GWP indicator. As mentioned in previous sections, credits are mostly related to the reduction of virgin steel (modelled as low-alloyed steel) for the periphery battery components. Similarly, it is recognised that copper used for the electrodes, as well as plastics used for both the flow frames and the electrolyte container, are also key materials on the benefits, but in a lower contribution by the proportion of material used (see Figure 5). Therefore, actions on those materials or battery components are required to reduce their consumption.
These results are aligned with those obtained by Rydh [25], who compared VRFB and lead-acid batteries for stationary energy storage from the life cycle point of view. The results demonstrated that the greatest environmental impact of the vanadium battery was originated from the production of steel and polypropylene.
Further research is expected to be done to identify opportunities focused on minimising impact attributed to the electrolyte composition. As defined in the aim of this work, all impacts due to sulphuric acid and vanadium consumption were not evaluated in this research. Nevertheless, actions on reducing consumption of these materials are foreseen to minimise the global impact of the system.
4. Conclusions
This study analysed from the life cycle perspective the environmental effect of material recycling in two different battery types (LMO and VRFB), intending to identify gaps and opportunities for innovation during the design phase and the EOL. This analysis revealed the need for considering material recyclability for promoting circularity and battery eco-design. On the one hand, the main results confirmed that the use of recycled materials provoked a descent in all environmental indicators associated with both battery types, especially in terms of toxicity and ecotoxicity for VRFB. These environmental categories achieved an impact reduction higher than 50% by the implementation of recycling strategies. Consequently, the future recyclability of each battery component might be considered for the selection of materials during the battery design and manufacturing stage.
On the other hand, the results have elucidated key components and materials where new strategies for the recyclability optimisation can be carried out, or where manufacturing new materials should be considered to improve the environmental behaviour of the batteries. Focusing on the VRFB components, the periphery components and the electrodes depicted the most significant impact in almost all the eighteen indicators by the comparison of effects with fractions recycled for copper, steel and plastic. Consequently, strategies focused on the reduction of raw steel and copper significantly lowered impacts (environmental and externalities) related to periphery components and electrodes. VRFB results also have indicated that sulphuric acid and vanadium pentoxide had a substantial impact in some environmental indicators. Despite not being assessed in this work, the results attained here suggested that potential benefits on manufacturing impact reduction are expected by considering them in circular economy strategies. Therefore, boosting their adequate and sustainable management and recyclability during the design phase and EOL strategies might be foreseen as potential actions to improve the overall environmental performance of this type of battery.
Author Contributions
M.C.D.-R., V.J.F., T.G.-A., A.M.L.-S., and G.F.; Formal analysis, M.C.D.-R. and V.J.F.; Methodology, M.C.D.-R., T.G.-A., and A.M.L.-S.; Resources, M.C.D.-R.; Writing—original draft, M.C.D.-R. and V.J.F.; Writing—review & editing, M.C.D.-R., V.J.F., T.G.-A., A.M.L.-S., and G.F. All authors have read and agreed to the published version of the manuscript.
Funding
This work was performed in the framework of the BAoBaB project (Blue Acid/Base Battery: Storage and recovery of renewable electrical energy by reversible salt water dissociation). The BAoBaB project has received funding from the European Union’s Horizon 2020 Research and Innovation program under Grant Agreement no. 731187 (www.baobabproject.eu).
Conflicts of Interest
The authors declare no conflict of interest.
Abbreviations
| eq | equivalents |
| EI | Environmental indicator |
| EC | External cost |
| ECF | External cost factor |
| ELCC | Environmental life cycle costing |
| EOFP | Ozone formation, terrestrial ecosystems |
| EOL | End-of-life |
| ESS | Energy storage system |
| FEP | Freshwater eutrophication |
| FETP | Freshwater ecotoxicity |
| FFP | Fossil resource scarcity |
| GWP | Global warming |
| HOFP | Ozone formation, human health |
| HTPc | Human carcinogenic toxicity |
| HTPnc | Human non-carcinogenic toxicity |
| IRP | Ionising radiation |
| LCA | Life cycle assessment |
| LCC | Life cycle costing |
| LCI | Life cycle inventory |
| LIB | Li-ion batteries |
| LMO | Lithium manganese oxide |
| LOP | Land use |
| MEP | Marine eutrophication |
| METP | Marine ecotoxicity |
| ODP | Stratospheric ozone depletion |
| PMFP | Fine particulate matter formation |
| PTFE | Polytetrafluoroethylene |
| PVC | Polyvinyl chloride |
| RFB | Redox flow battery |
| SOP | Mineral resource scarcity |
| TAP | Terrestrial acidification |
| TETP | Terrestrial ecotoxicity |
| VRFB | Vanadium redox flow battery |
| WCP | Water consumption |
References and Notes
- Sverdrup, H.U.; Olafsdottir, A.H.; Ragnarsdottir, K.V. On the long-term sustainability of copper, zinc and lead supply, using a system dynamics model. Resour. Conserv. Recycl. X 2019, 4, 100007. [Google Scholar] [CrossRef]
- Cong, L.; Zhao, F.; Sutherland, J.W. Integration of dismantling operations into a value recovery plan for circular economy. J. Clean. Prod. 2017, 149, 378–386. [Google Scholar] [CrossRef]
- Royo, P.; Ferreira, V.J.; Ure, Z.; Gledhill, S.; López-Sabirón, A.M.; Ferreira, G. Multiple-Criteria Decision Analysis and characterisation of phase change materials for waste heat recovery at high temperature for sustainable energy-intensive industry. Mater. Des. 2020, 186. [Google Scholar] [CrossRef]
- Opatokun, S.A.; Lopez-Sabiron, A.; Ferreira, G.; Strezov, V. Life Cycle Analysis of Energy Production from Food Waste through Anaerobic Digestion, Pyrolysis and Integrated Energy System. Sustainability 2017, 9, 1804. [Google Scholar] [CrossRef]
- López-Sabirón, A.M.; Fleiger, K.; Schäfer, S.; Antoñanzas, J.; Irazustabarrena, A.; Aranda-Usón, A.; Ferreira, G.A. Refuse derived fuel (RDF) plasma torch gasification as a feasible route to produce low environmental impact syngas for the cement industry. Waste Manag. Res. 2015, 33, 715–722. [Google Scholar] [CrossRef]
- Rydh, C.J.; Karlström, M. Life cycle inventory of recycling portable nickel–cadmium batteries. Resour. Conserv. Recycl. 2002, 34, 289–309. [Google Scholar] [CrossRef]
- Unterreiner, L.; Jülch, V.; Reith, S. Recycling of Battery Technologies—Ecological Impact Analysis Using Life Cycle Assessment (LCA). Energy Procedia 2016, 99, 229–234. [Google Scholar] [CrossRef]
- Wang, W.; Wu, Y. An overview of recycling and treatment of spent LiFePO4 batteries in China. Resour. Conserv. Recycl. 2017, 127, 233–243. [Google Scholar] [CrossRef]
- Song, J.; Yan, W.; Cao, H.; Song, Q.; Ding, H.; Lv, Z.; Zhang, Y.; Sun, Z. Material flow analysis on critical raw materials of lithium-ion batteries in China. J. Clean. Prod. 2019, 215, 570–581. [Google Scholar] [CrossRef]
- Weber, S.; Peters, J.F.; Baumann, M.; Weil, M. Life Cycle Assessment of a Vanadium Redox Flow Battery. Environ. Sci. Technol. 2018, 52, 10864–10873. [Google Scholar] [CrossRef]
- Rigamonti, L.; Grosso, M.; Sunseri, M.C. Influence of assumptions about selection and recycling efficiencies on the LCA of integrated waste management systems. Int. J. Life Cycle Assess. 2009, 14, 411–419. [Google Scholar] [CrossRef]
- Harper, G.; Sommerville, R.; Kendrick, E.; Driscoll, L.; Slater, P.; Stolkin, R.; Walton, A.; Christensen, P.; Heidrich, O.; Lambert, S.; et al. Recycling lithium-ion batteries from electric vehicles. Nature 2019, 575, 75–86. [Google Scholar] [CrossRef] [PubMed]
- IRENA Electricity Storage and Renewables: Costs and Markets to 2030; International Renewable Energy Agency: Abu Dhabi, UAE, 2017; ISBN 978-92-9260-038-9.
- Díaz-Ramírez, M.C.; Ferreira, V.J.; García-Armingol, T.; López-Sabirón, A.M.; Ferreira, G. Environmental Assessment of Electrochemical Energy Storage Device Manufacturing to Identify Drivers for Attaining Goals of Sustainable Materials 4.0. Sustainability 2020, 12, 342. [Google Scholar] [CrossRef]
- Brief produced for the European Commission DG Environment by the Science Communication Unit, UWE, Bristol. Towards the battery of the future. Future Brief 20. Science for Environment Polic. 2018. Available online: https://ec.europa.eu/environment/integration/research/newsalert/pdf/towards_the_battery_of_the_future_FB20_en.pdf (accessed on 22 August 2020).
- IRENA Battery Storage Report. 2015.
- Sato, F.E.; Nakata, T. Recoverability Analysis of Critical Materials from Electric Vehicle Lithium-Ion Batteries through a Dynamic Fleet-Based Approach for Japan. Sustainability 2020, 12, 147. [Google Scholar] [CrossRef]
- Li, L.; Zhang, X.; Li, M.; Chen, R.; Wu, F.; Amine, K.; Lu, J. The Recycling of Spent Lithium-Ion Batteries: A Review of Current Processes and Technologies. Electrochem. Energy Rev. 2018, 1, 461–482. [Google Scholar] [CrossRef]
- International Organization for Standardization. ISO 14040:2006—Environmental Management—Life Cycle Assessment—Principles and Framework; International Organization for Standardization: Geneva, Switzerland, 2006. [Google Scholar]
- International Organization for Standardization. ISO 14044:2006. Environmental Management—Life Cycle Assessment—Requirements and Guidelines; International Organization for Standardization: Geneva, Switzerland, 2006. [Google Scholar]
- Sullivan, J.L.; Gaines, L. Status of life cycle inventories for batteries. Energy Convers. Manag. 2012, 58, 134–148. [Google Scholar] [CrossRef]
- Hiremath, M.; Derendorf, K.; Vogt, T. Comparative Life Cycle Assessment of Battery Storage Systems for Stationary Applications. Environ. Sci. Technol. 2015, 49, 4825–4833. [Google Scholar] [CrossRef]
- Wernet, G.; Bauer, C.; Steubing, B.; Reinhard, J.; Moreno-Ruiz, E.; Weidema, B. The ecoinvent database version 3 (part I): Overview and methodology. Int. J. Life Cycle Assess. 2016, 21, 1218–1230. [Google Scholar] [CrossRef]
- SUBAT-SSPI-CT-2003-502490 Deliverable D 34 – Final report. Available online: https://battery-electric.com/subatdocs/WP6-031.pdf (accessed on 22 August 2020).
- Rydh, C.J. Environmental assessment of vanadium redox and lead-acid batteries for stationary energy storage. J. Power Sources 1999, 80, 21–29. [Google Scholar] [CrossRef]
- Van den Bossche, P.; Vergels, F.; Van Mierlo, J.; Matheys, J.; Van Autenboer, W. SUBAT: An assessment of sustainable battery technology. J. Power Sources 2006, 162, 913–919. [Google Scholar] [CrossRef]
- Arbabzadeh, M.; Johnson, J.X.; De Kleine, R.; Keoleian, G.A. Vanadium redox flow batteries to reach greenhouse gas emissions targets in an off-grid configuration. Appl. Energy 2015, 146, 397–408. [Google Scholar] [CrossRef]
- Baumann, M.; Peters, J.F.; Weil, M.; Grunwald, A. CO2 Footprint and Life-Cycle Costs of Electrochemical Energy Storage for Stationary Grid Applications. Energy Technol. 2017, 5, 1071–1083. [Google Scholar] [CrossRef]
- Zackrisson, M.; Fransson, K.; Hildenbrand, J.; Lampic, G.; O’Dwyer, C. Life cycle assessment of lithium-air battery cells. J. Clean. Prod. 2016, 135, 299–311. [Google Scholar] [CrossRef]
- Deng, Y.; Li, J.; Li, T.; Zhang, J.; Yang, F.; Yuan, C. Life cycle assessment of high capacity molybdenum disulfide lithium-ion battery for electric vehicles. Energy 2017, 123, 77–88. [Google Scholar] [CrossRef]
- Albuquerque, T.L.M.; Mattos, C.A.; Scur, G.; Kissimoto, K. Life cycle costing and externalities to analyze circular economy strategy: Comparison between aluminum packaging and tinplate. J. Clean. Prod. 2019, 234, 477–486. [Google Scholar] [CrossRef]
- Gluch, P.; Baumann, H. The life cycle costing (LCC) approach: A conceptual discussion of its usefulness for environmental decision-making. Build. Environ. 2004, 39, 571–580. [Google Scholar] [CrossRef]
- De Nocker, L.; Debacker, W. Annex: Monetisation of the MMG Method; OVAM: Mechelen, Belgium, 2018. [Google Scholar]
- De Bruyn, S.; Bijleveld, M.; de Graaff, L.; Schep, E.; Schroten, A.; Vergeer, R.; Ahdour, S. Environmental Prices Handbook EU28 Version; CE Delft: Delft, The Netherlands, 2018; pp. 1–175. Available online: https://www.cedelft.eu/en/publications/2191/environmental-prices-handbook-eu28-version (accessed on 22 August 2020).
- Chen, H.; Cong, N.; Yang, W.; Tan, C.; Li, Y.; Ding, Y. Progress in electrical energy storage system: A critical review. Prog. Nat. Sci. 2009, 19, 291–312. [Google Scholar] [CrossRef]
- Rydh, C.J.; Sandén, B.A. Energy analysis of batteries in photovoltaic systems. Part II: Energy return factors and overall battery efficiencies. Energy Convers. Manag. 2005, 46, 1980–2000. [Google Scholar] [CrossRef]
- Ponce de León, C.; Frías-Ferrer, A.; González-García, J.; Szánto, D.A.; Walsh, F.C. Redox flow cells for energy conversion. J. Power Sources 2006, 160, 716–732. [Google Scholar] [CrossRef]
- Du Pasquier, A.; Plitz, I.; Menocal, S.; Amatucci, G. A comparative study of Li-ion battery, supercapacitor and nonaqueous asymmetric hybrid devices for automotive applications. J. Power Sources 2003, 115, 171–178. [Google Scholar] [CrossRef]
- Kondoh, J.; Ishii, I.; Yamaguchi, H.; Murata, A.; Otani, K.; Sakuta, K.; Higuchi, N.; Sekine, S.; Kamimoto, M. Electrical energy storage systems for energy networks. Energy Convers. Manag. 2000, 41, 1863–1874. [Google Scholar] [CrossRef]
- Tang, Y.; Zhang, Q.; Li, Y.; Li, H.; Pan, X.; Mclellan, B. The social-economic-environmental impacts of recycling retired EV batteries under reward-penalty mechanism. Appl. Energy 2019, 251. [Google Scholar] [CrossRef]
- Dehghani-Sanij, A.R.; Tharumalingam, E.; Dusseault, M.B.; Fraser, R. Study of energy storage systems and environmental challenges of batteries. Renew. Sustain. Energy Rev. 2019, 104, 192–208. [Google Scholar] [CrossRef]
- Li, Y.; Xi, G. The dissolution mechanism of cathodic active materials of spent Zn–Mn batteries in HCl. J. Hazard. Mater. 2005, 127, 244–248. [Google Scholar] [CrossRef] [PubMed]
- Chen, M.; Ma, X.; Chen, B.; Arsenault, R.; Karlson, P.; Simon, N.; Wang, Y. Recycling End-of-Life Electric Vehicle Lithium-Ion Batteries. Joule 2019, 3, 2622–2646. [Google Scholar] [CrossRef]
- Minke, C.; Dorantes Ledesma, M.A. Impact of cell design and maintenance strategy on life cycle costs of vanadium redox flow batteries. J. Energy Storage 2019, 21, 571–580. [Google Scholar] [CrossRef]
- Lockhart, E.; Li, X.; Booth, S.; Salasovich, J.; Olis, D.; Elsworth, J.; Lisell, L. Comparative Study of Techno-Economics of Lithium-Ion and Lead-Acid Batteries in Micro-Grids in Sub-Saharan Africa; National Renewable Energy Lab.(NREL): Golden, CO, USA, 2019. [Google Scholar]
© 2020 by the authors. Licensee MDPI, Basel, Switzerland. This article is an open access article distributed under the terms and conditions of the Creative Commons Attribution (CC BY) license (http://creativecommons.org/licenses/by/4.0/).