Article

Evaluation of Alternative Home-Produced Concrete Strength with Economic Analysis

Department of Civil and Environmental Engineering, University of New Haven, West Haven, CT 06516, USA
*
Author to whom correspondence should be addressed.
Sustainability 2020, 12(17), 6746; https://doi.org/10.3390/su12176746
Submission received: 8 June 2020 / Revised: 14 August 2020 / Accepted: 18 August 2020 / Published: 20 August 2020
(This article belongs to the Special Issue Economic Feasibility for Sustainability)

Abstract

:
Ready-mix concrete is not always affordable because it is less economical for small projects. This study shows an effort to introduce alternative home-produced concrete for small paving areas such as sidewalks, backyards, or fixing the existing concrete and discusses the economic evaluation of the alternative concrete for home purpose. The materials being used in this study are available locally or are easily purchased. The primary objective of the study is to analyze the compressive strength and conduct economic analysis of alternative home-produced concrete with different mix designs. Wood ash, fly ash, and recycled aggregate concretes are the alternative concrete types discussed in this study. Fly ash can replace Portland cement up to 30% without losing significant compressive strength of the concrete. Furthermore, fly ash is less expensive than Portland cement and can reduce the cost of concrete by saving approximately 15%. Wood ash can be used up to 25% in concrete without losing considerable strength which saves approximately 13% of cement cost. The use of recycled concrete aggregates saves only about 1% CO2 emission compared to regular concrete while fly ash saves more than 28.5% and wood ash saves almost 24.5%. They can replace natural aggregates up to 100%, but there is only a 5% saving. In addition, an equivalent cost of USD 13.47 for one cubic yard of concrete could be saved by using 30% fly ash concrete when considering reduced emitted CO2eq from the material production.

1. Introduction

Fly ash is both environmentally friendly and less expensive than cement. The disposal of fly ash and wood ash can be another problem at the end of use as well. However, both can be a good alternative to replace cement. Fly ash and granulated blast-furnace slag are among materials which develop great cementitious properties when mixed with water. High dosage levels of fly ash, about 40% to 60%, can be used in structural applications, producing concrete with good mechanical properties and durability [1]. Besides concrete, fly ash is used up to almost 50% in other construction materials such as blocks and bricks. Fly ash itself is being used in different engineering applications such as structural fill, soil stabilization procedures, as an alternative filler material for aggregates, highways and roads sub-bases, and grout filling [2].
Recently, renewable fuel such as wood-chips, sawdust, hard chips, and wood bark are used in power generation plants, which results in a rise in timber waste such as wood ash. Around 70% of wood ash is dumped in the ground during the common land-filling process [3,4,5], and it is an expensive process. In modern era there should be better solutions for wood waste rather than disposal. Recently, compressive strength tests have been performed by partially replacing the cement with wood ash in the production of concrete. The test outcome shows acceptable structural grade concrete. This research helps in managing wood ash. Thus, wood ash can be used as a construction material with cement to decrease the cost of production of cement.
The use of waste wood ash in concrete (5, 10, 15, 20, 25, and 30%) by weight influences significantly the strength of concrete which decreases with the increase in wood ash content and it increases with time because of pozzolanic actions [6]. Depending on the type of wood ash or wood species, the chemical compositions change. Thus, it is the main factor to be considered while producing wood ash concrete. Some other factors such as combustion technology and combustion temperature can be used for its quality and quantity performance [4].
Recycled aggregates are particles of stones attached with old cement mortar produced by crushing demolished concrete waste, however recycled concrete aggregate (RCA) helps not only sustainability but also has a practical economic consideration in the construction industry. Recent studies show that pozzolanic materials such as fly ash, blast furnace slag, wood ash and silica fume contain silica in a reactive form which can be a partial replacement for cement and are also environment-friendly as well as economical [7]. About 50% of fly ash is currently in use in various construction materials, such as concrete, fly ash bricks, etc. It explains the fact that about 7% of the world’s total CO2 comes mainly from manufacturing plants which produce cement [2].
Many studies have been focusing on alternative concrete strength as shown in Table 1. Each study used different types of ashes from different sources to replace cement and analyzed compressive strength at different water/cement ratios. As shown in the table, a higher water cement ratio reduces the compressive strength of the concrete. This was proved by Teixeira’s study [8] on the valorization of wood/fly ash on concrete. According to his study, the mechanical strength of concrete is dependent on the percentage of cement replacement and the curing time. In general, wood/fly ash addition decreases the compressive strength. In addition, a loss on ignition (LOI) study [9] shows that the concretes made with high-LOI (8%) fly ash can be successfully produced for structural concrete. The study presented the experimental results of properties of concrete incorporating fly ash with LOIs of 5% and 8%.
The objectives of the study are to introduce a home-produced concrete for small projects such as sidewalks, backyards, or fixing existing concrete economically. Bringing concrete from a concrete plant or local stores is not always affordable, not only it is expensive, but it takes time as well. Hiring local contractors to fix very small areas around homes is not always efficient. The materials being used in this study are available locally, especially wood ash. Wood is burned at homes in most parts of Connecticut, so wood ash can be used as an alternative to replace cement which will help with the reduction of cement in home-produced concretes.
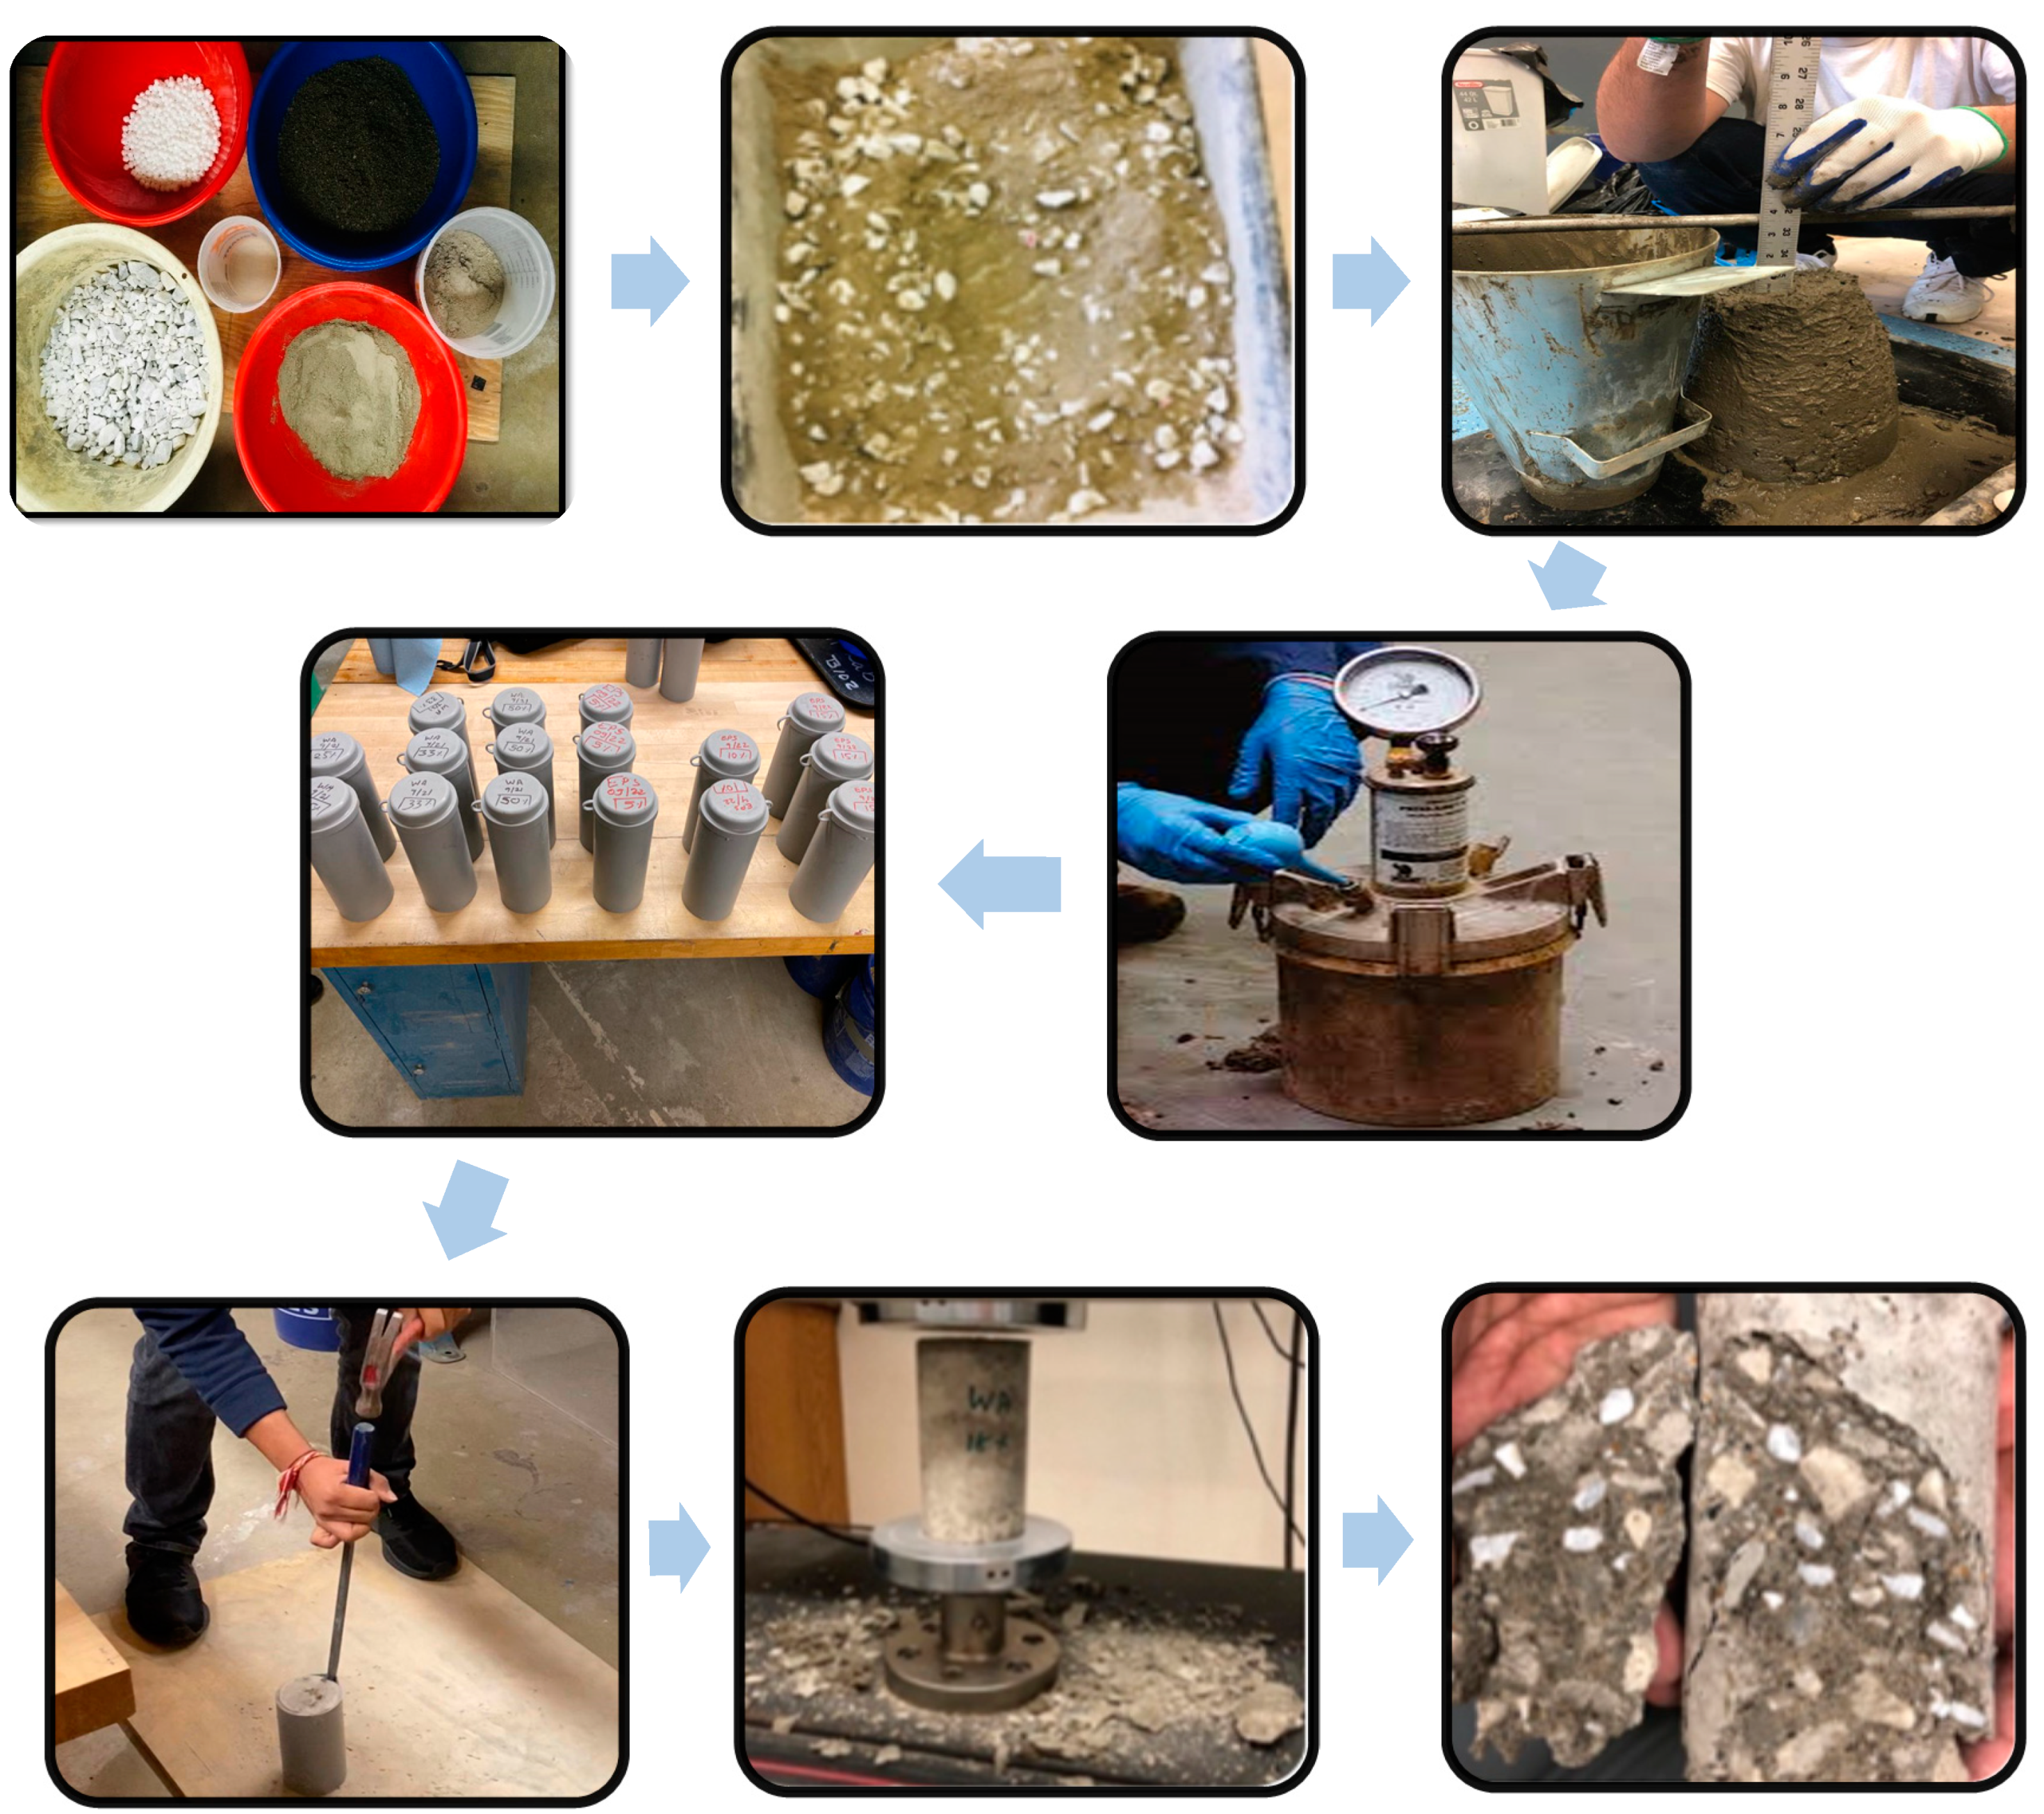
The study focuses on methods to analyze the compressive strength and conduct economic analysis of alternative concrete with sustainable materials using different mix designs. The concrete mix designs will have different percentages of fly ash, wood ash and recycled concrete aggregates. Other admixtures will not be added. The material to be investigated is a conventional mixture in which the Portland cement will be replaced by Class C Fly ash, wood ash and regular natural aggregates will be replaced by recycled concrete aggregates. In order to achieve the objectives, four trials of fly ash concrete mix having 30%, 50%, 75%, and 100% fly ash, were mixed. Four trials of wood ash concrete mix with 18%, 25%, 33%, and 50% wood ash and four mix designs were prepared for concrete with recycled concrete aggregates with 30%, 50%, 80%, and 100%, respectively. All three types of concrete were tested for 7 and 28 days. The target strength of the concrete was 2500 psi as a minimum strength.

2. Alternative Concrete

2.1. Fly Ash

Two types of ash are produced during coal burning at power plants, fly ash and bottom ash. Fly ash is the type of ash which has very fine material carried in the form of gas called flue gas. This type of ash is collected in a special type of bags, called baghouses and then stored in silos. The second type of ash is the bigger or heavier particles which are collected at the bottom of the boiler after the coal burning and combustion. Annually about 63 million tons of fly ash is produced in about 720 coal burning power plants in the U.S. [14]. Approximately 31 million tons are not being used and are discarded to landfills. One small portion of the produced fly ash, about 12 million tons, is being recycled and can be reused in the concrete industry. The rest of the fly ash, 20 million tons, is used for other different purposes, such as stabilization of soil, concrete compacted by rollers, stabilization of road bases, etc. [15].
Fly ash is made up of the combination of crystalline and glassy phases [14]. The biggest part of fly ash is made up of glassy spheres of which there are two major types, hollow and solid, which mostly consists of 60 to 90% of the overall mass of fly ash, the remaining parts consist different phases of crystalline. Because of these phases being together, fly ash becomes a complex material to be characterized and classified under certain terms and conditions.
The physical properties and chemical composition of fly ash are good enough to be used as a replacement for cement in concrete. Fly ash has almost the same physical properties and chemical composition as Portland cement. The specific gravity of fly ash is close to that of cement.
The American Society for Testing and Materials (ASTM) Class C and F are two types of fly ash used in concrete. Class C is typically generated from the burning of lignite coals while Class F is generated from the burning of bituminous coals. Class C type fly ash was chosen for the study. Class C fly ashes tend to have finer particles and fewer cenospheres; thus, their densities tend to be higher, in the range of 2.4 to 2.8 Mg/m3. Class C fly ashes generally have a high proportion of particles finer than 10 μm, which favorably influences concrete workability. The cementitious properties of Class C fly ash can influence cement hydration to a greater extent than Class F [14].

2.2. Wood Ash

Wood is burned at homes in most parts of the Northeast in the U.S., so wood ash can be used as an alternative way to replace cement which will help with the reduction of cement in home-produced concrete. Cement is one of the construction materials the production of which causes global warming. It is necessary to provide adequate and environmentally friendly materials for infrastructure. To encourage sustainable development, the use of other different waste materials such as fly ash and wood ash have been considered to decrease the use of cement. Another way to encourage sustainable development is the use of recycled concrete aggregates. Concrete, one of the most popular construction materials, involves the use of cement, the production of which causes 7.4% of carbon dioxide emissions of the world [16].
Wood ash is a by-product obtained from burning woody materials such as different kinds of hardwoods, chips, saw dust, etc. for home heating systems, fireplaces or industrial power plants. Naik (1999) [17] used wood ashes from different mills and determined their physical and chemical properties. The chemical and physical properties of wood ash play a significant role in the determination of their beneficial uses in replacement of cement. Naik (2003) [18] chose five different sources of wood ash from Rothschild, Wisconsin, in the United States and named them as W1-W5.
The raw wood ash is first sieved through 150 μm to remove large particles and then wood ash is used to replace cement in the mortar by 0%, 18%, 25%, 33% and 50% for the study. The density of wood ash is lower than cement, thus the volume of concrete showed variation with the use of same quantity of cement and wood ash.
Maple and Oak (hardwood) are common fuel sources for fireplaces in New England in the U.S. and it is easy to obtain the hardwood ash since there is a fireplace in most of the single houses in New England. The unit weight of the ash used for the study was determined to be 525.4 kg/m3 which is similar to the W1 type wood ash (545 kg/m3) in Naik’s study [18].

2.3. Recycled Aggregate Concrete

The concrete rubble for the study was obtained from Yale University Science Building crane tower’s foundation at no cost, which was recently demolished although the recycled aggregates are sold in a local store. The concrete rubble was crushed by a hammer into small pieces and transported to the university lab. After sieve analysis, 2000 pounds of recycled concrete aggregates were obtained and used as a replacement for natural aggregates in the mix designs.
Natural river sand was used as the fine aggregates. Fine aggregates were dried and graded accordance to The American Society for Testing and Materials (ASTM) D75 [19]. The fineness modulus of the sand and coarse aggregate was noted to be 3.01 and 5.13. Table 2 and Table 3 show coarse and fine aggregate sieve analysis data, respectively. Locally supplied potable water was used as mixing water. No other chemicals were used in the mix.

3. Mix Design

After analyzing the materials properties, mix designs were prepared for three different alternative concretes (fly ash concrete, wood ash concrete and recycled aggregate concrete) based on the American Concrete Institute (ACI) Standard [20]. Proportion calculation was developed based on the weight of the materials. Cylinders of 3 × 6 inches were used and then cured in laboratory standard room conditions for 7 and 28 days and tested for the compressive strength. A concrete compressive strength of 2500 psi (17 MPa) was assumed to be a minimum strength for home project [21].
There were four trials of each alternative concrete mix design and five specimens were casted for each trial. Thus, a total of 20 specimens were casted and tested. Each trial consisted of 5 specimens (2 for 7-day, 2 for 28-day testing, and 1 for extra) to make an average value in the test. Five specimens for regular concrete were also casted and tested as a reference concrete.

3.1. Mixing, Forming, Curing and Testing

Prior to mixing, sieve analysis, unit weight measurements and moisture content measurements were completed for the both coarse and fine aggregates as shown in Table 4. Moisture content in the coarse aggregates was less the than moisture content of the fine aggregates. The unit weight for both fine and coarse aggregates was between the limits of 95 and 105 lb/ft3.
Concrete specimens were made in plastic molds with a size of 3 by 6 inches. The molds met the requirements of ASTM C470/C470M. Molds were made as per the ASTM Standard Practice for Making and Curing Concrete Test Specimens in the Field [22]. The slump test was completed for all trials meeting the requirements of ASTM C143 [23] and the air content test was done as per the requirements of ASTM C231 [24]. The alternative concrete mixtures made for the investigation purpose had good slumps from 3.25 to 3.75 inches (82.55 to 95.25 mm) which are within the design requirements of 3 to 4 inches (76.2 to 101.6 mm). Air content ranged from 1.8 to 2.0%. The water/cement ratio of concrete used was 0.75 for all types of alternative concrete.
All the apparatus used for the tests met the standard dimensions stated in the relevant ASTM standards. The air meter used for air content test was a Model 2786C, manufactured by Humboldt Manufacturing Co. For the curing of concrete test specimens, standard practice was followed. These test specimens were kept in normal room temperature 82° ± 5 °F and tested at ages of 7 and 28 days. Tests conducted on materials and concrete as per ASTM standard are described in Table 5. Figure 1 shows the mixing, forming, curing and testing of concrete as per ASTM standards.

3.2. Fly Ash Concrete

Four mix designs were prepared with 30, 50, 75 and 100% fly ash replacing cement for concrete in each mix design, respectively (Table 6). All the mix designs were prepared based on the American Concrete Institute (ACI) Specification 211.1-91 [20]. Sieve analysis, unit of aggregates measurements, moisture contents measurements, slump test and air content measurements were also performed.

3.3. Wood Ash Concrete

After the sieving of wood ash, it was introduced to the concrete mix in various proportions of 0%, 18%, 25%, 33% and 50% by total weight of cement. About 25% replacement of cement with wood ash was considered as appropriate. Table 7 demonstrates the mix proportion of the concrete.

3.4. Recycled Aggregate Concrete (RAC)

Proportion calculation was developed based on the weight of the materials. The target compressive strength was 2500 psi (17 MPa). To achieve this compressive strength, different percentages of natural aggregates were replaced with recycled concrete aggregates that were obtained from the mix design. The mixes had the same water to cement (W/C) ratio of 0.75, and the quantities of materials such as fine aggregates, coarse aggregates, and water were achieved by the mix design calculation described in Table 8. Various percentages (30%, 50%, 80%, and 100%) of regular concrete aggregate were replaced by recycled aggregate. Five samples for regular concrete (normal concrete with zero percentage of RAC) were made including one extra specimen, and the 20 specimens were made with various portions of recycled aggregate.

4. Results and Discussion

4.1. Compressive Strength

The target strength was 2500 psi (17 MPa) as a minimum strength to be used for small home projects. 2500 psi concrete can be useful for driveways, walkways, sidewalk, or crack repair. The ACI 318 Standard indicates a minimum specified compressive strength of 2500 psi for structural concrete. Simply stated, no structural concrete can be specified with a strength less than 2500 psi. As a reference, concrete compressive strength can vary from 2500 psi for residential concrete to 5000 psi (35 MPa) and higher in commercial structures. Some applications use higher strength, greater than 10,000 psi (70 MPa) [21].
Concrete compression tests were conducted based on the standard ASTM C39/C39M-18 [24]. An INSTRON compressive strength machine (3380 series) with a capacity up to 100 kN (22,500 lbf) was used for testing the compressive strength of the cylinders. 
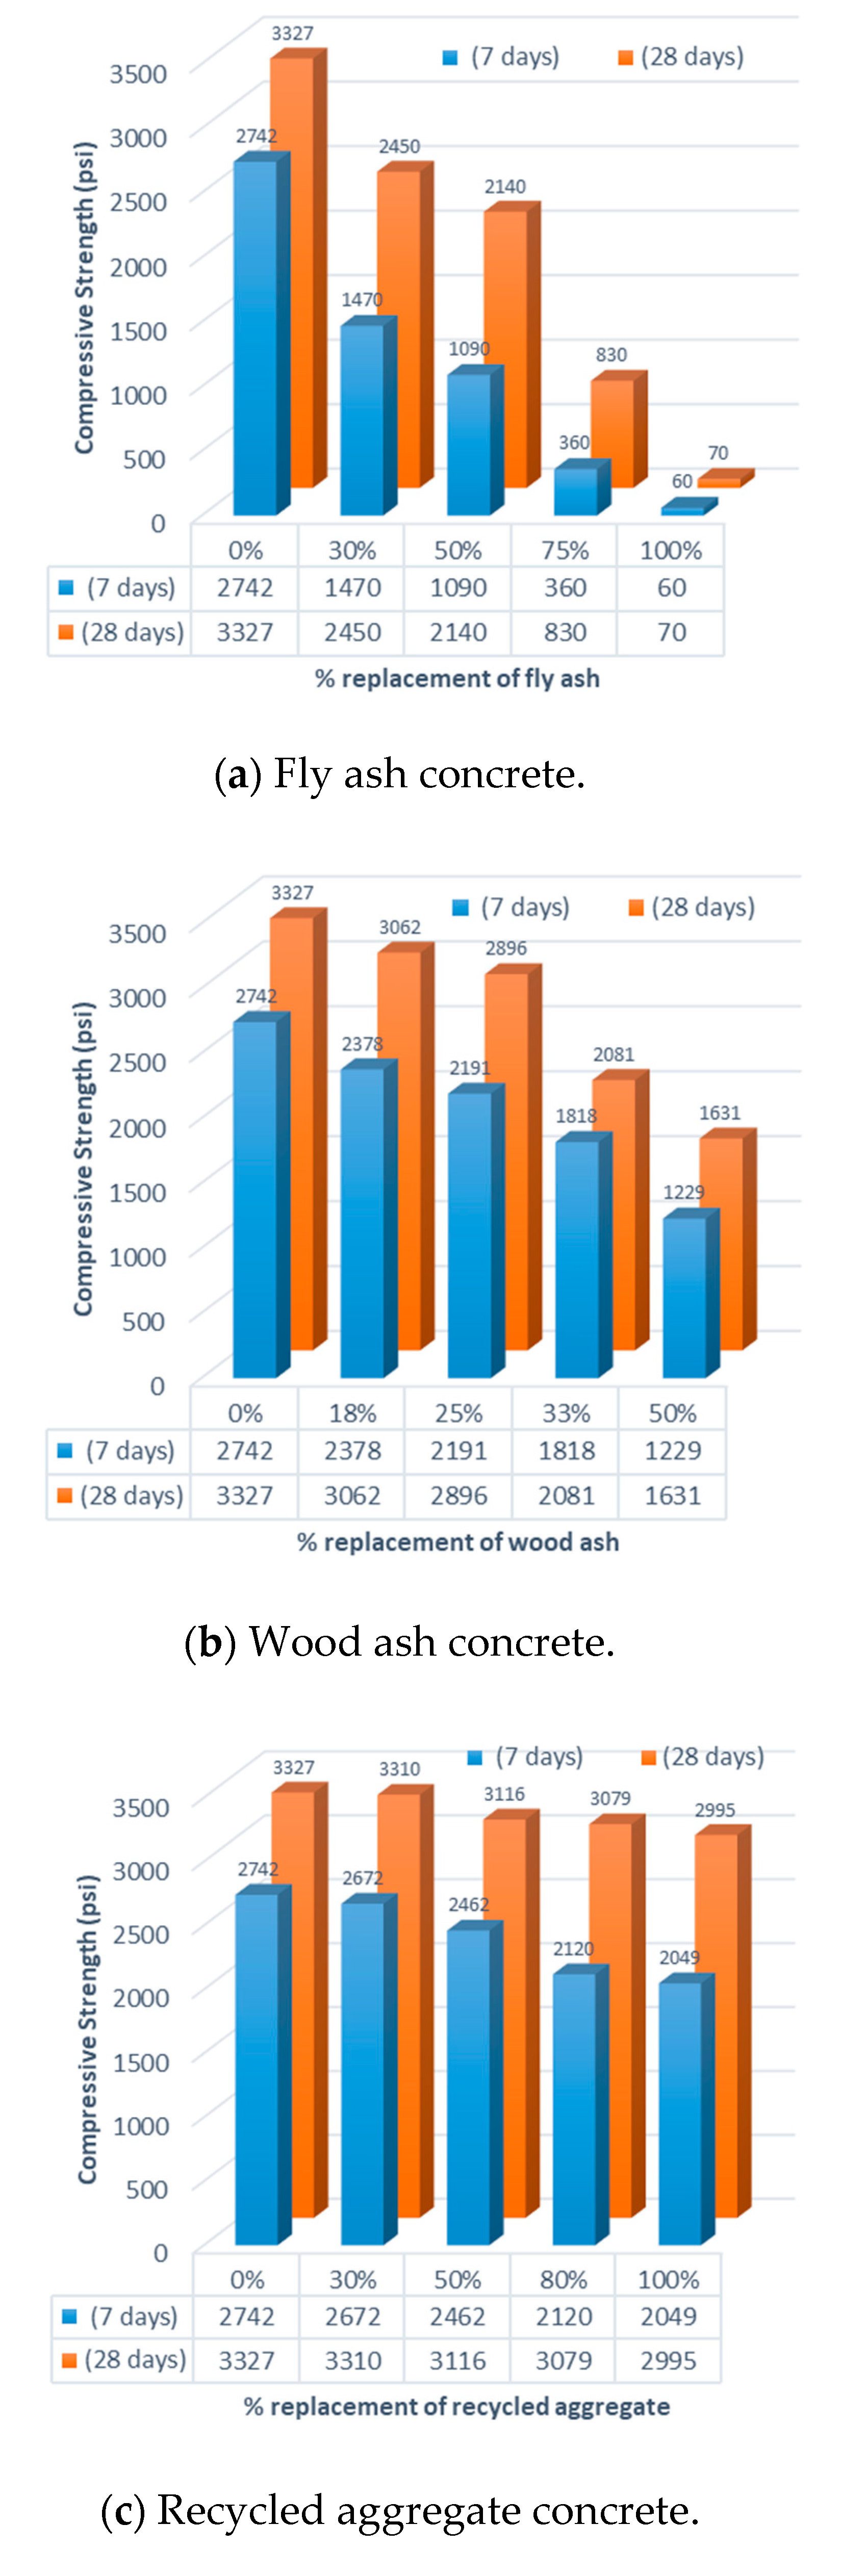
Figure 2 summarizes the compressive strength between regular concrete and concrete containing different proportions of fly ash, recycled aggregate and wood ash for 7 and 28 days, respectively. The standard deviation of concrete compressive strength measured in testing varied from 1 to 448 psi. The average of standard deviation for 28-day testing was 121.8 psi.
As shown in Figure 2, the strength of concrete with fly ash is dependent on the percentage of cement replacement and the curing time. With 30% replacement, the 26% concrete strength dropped down compared to the strength of 0% fly ash replacement in 28-day testing. The concrete strength became meaningless by replacing fly ash over 50%. The strength of 30% fly ash concrete is just 50 psi lower than the target strength of 2500 psi in 28-day testing. The 7-day strength was approximately 50–60% of the 28-day concrete strength for 30% and 50%.
With 50% replacement by wood ash, the strength became lower than half of 0% replacement in 28-day testing. When a target strength is considered, the wood ash replacement percentage must be approximately 30% or less. This is very similar to fly ash concrete. The concrete strength becomes meaningless when replacing wood ash over 33% in 28-day testing. The 7-day strength was approximately 75–77% of the 28-day concrete strength for 18% and 25%.
Recycled aggregate concrete shows a much lower decrease in strength compared to other two alternative concretes. When 100% recycled aggregate is replaced, the 28-day strength decreased only 10% while the 7-day strength decreased 25%. The concrete strength with 100% was still almost 3000 psi for 28-day.
The strengths of the (alternative) concrete depend on the target strength of the proposed (design) concrete. For example, Kalra [2] shows the average strength of 25% wood ash concrete with a water–cement ratio (w/c) of 0.45 is 4018 psi while the average strength of 20% wood ash concrete with a w/c of 0.49 is 6817 psi. In the case of Smith’s fly ash concrete [27], the fly ash concrete strength with a w/c of 0.42 was measured to be about 5200 psi. A study with 30% coal ash concrete [28] shows 3200 psi with a w/c of 0.58. A higher w/c ratio (0.75) was used in this study to reduce the cost of cement and the proposed strength was 2500 psi (17 MPa).
Ramadevi and Chitra [29] found in their study that there was no big difference in strength between concrete with natural aggregates and concrete with 30% recycled concrete aggregates. Safiuddin et al. [30] stated in his research paper that the hardened properties of recycled concrete aggregates significantly depend on its source, type, content, gradation, and physical properties. As a general principle, up to 30% (on a weight basis) of natural aggregates may be replaced by recycled concrete aggregates without significantly affecting the hardened properties of concrete.

4.2. Cost Analysis

Cost of materials is the major concern in the construction industry, and construction materials can have negative impacts on the environment frequently. By using recycled concrete aggregate as an alternative for natural aggregate—fly ash and wood ash as alternatives for cement in the construction industry—the cost of materials can be reduced to produce concrete product. The following information was analyzed during this study.
As per mix designs during this research study, the ratios and prices of coarse and fine aggregates and water were assumed to be constant. The only factor affecting the cost of concrete was the use of cement, wood ash, fly ash and recycled aggregate. A bag of 94-lb Portland cement Type I can be purchased at a local store at a price of 13.8 cents per pound [31]. The cost of fly ash is 1.75 cents per pound for fly ash while wood ash can be purchased for 1.2 cents per pound [32] although the wood ash can be obtained for free from each house’s fireplace. The official recycled concrete aggregate cost is not available but a local aggregate suppliers, State Crushing, Inc. [33], lists it for sale and the cost varies from USD 16 to USD 18 per cubic yard since it depends on the purchase amount. If a ½ cubic yard of recycled aggregate is purchased, it costs USD 13 when cheapest. The price varies very frequently. However, the recycled concrete aggregates could be obtained for free from many places. The one used in this study was obtained from Yale University Science Building crane tower’s footing without any cost and they were crushed manually. The price of coarse and fine aggregates has been obtained from a Connecticut-based gravel and sand supplier, Lombardi Gravel and Excavation [34], and their cost range is from USD 16 to USD 19 per ton. Water per 1000 gallons in Connecticut is about USD 9 per thousand gallons for residential class [35].
There are many other significant factors in cost analysis such as transportation, tax, delivery fee, and labor cost. However, there is high uncertainty that could be considered in the analysis since those factors are depend on the size of project, location of project, seasonal variation, market variation and so on. Thus, the cost analysis for this study is focused on materials.
The cost analysis was performed for regular concrete and other alternative concretes in Table 9, Table 10 and Table 11. The cost comparison was made for 1 cubic yard of concrete with regular concrete, 30 and 50% fly ash concrete, 25% wood ash concrete, and 100% recycled aggregate concrete. Based on the achieved costs per cubic yard, the fly ash concrete with 30% fly ash was 15.2% cheaper than regular concrete although the strength was 50 psi lower than the target strength of 2500 psi. Fly ash concrete with 50% fly ash can save 26.4%, however, the strength did satisfy the minimum of 2500 psi. Regular concrete was 14.9% more expensive than the wood ash concrete with 25% wood ash. When wood ash was provided for free, there was an additional 2% saving as shown in Table 10.
The use of recycled concrete aggregates could replace natural aggregates up to 100% but there was no significant saving (5.6%), however, when the recycled aggregate was considered to be free then it reduced 19% of cost compared to regular concrete.
If Ready-mix concrete is ordered for 1 cubic yard concrete project, it costs much more. Although it depends on project location, the order price was about USD 175 to pour ready-mix concrete for a short load of less than 10 cubic yards [36]. In addition, Quikrete (premixed concrete) would be an option for a home project. The typical strength of Quikrete is 3000 to 5000 psi so it fully satisfies any kind of home project. A 60-lb bag of 4 ksi Quikrete is USD 3.35 in a local recycling plant [37] and it costs about USD 180 for a 1 cubic yard concrete project (Table 11). This is much higher than other concretes discussed above. Table 12 shows the normalized cost for each concrete type. As shown in the table, Quikrete and Ready-mix concrete were twice as expensive as regular concrete while all other alternative concretes were cheaper than the regular concrete. However, transportation and labor costs are not considered in the analysis and this may change the results significantly.

4.3. Regional Factor

The concrete material for aggregates varies depending on suppliers’ locations. The U.S. Geological Survey (USGA) mineral year book [
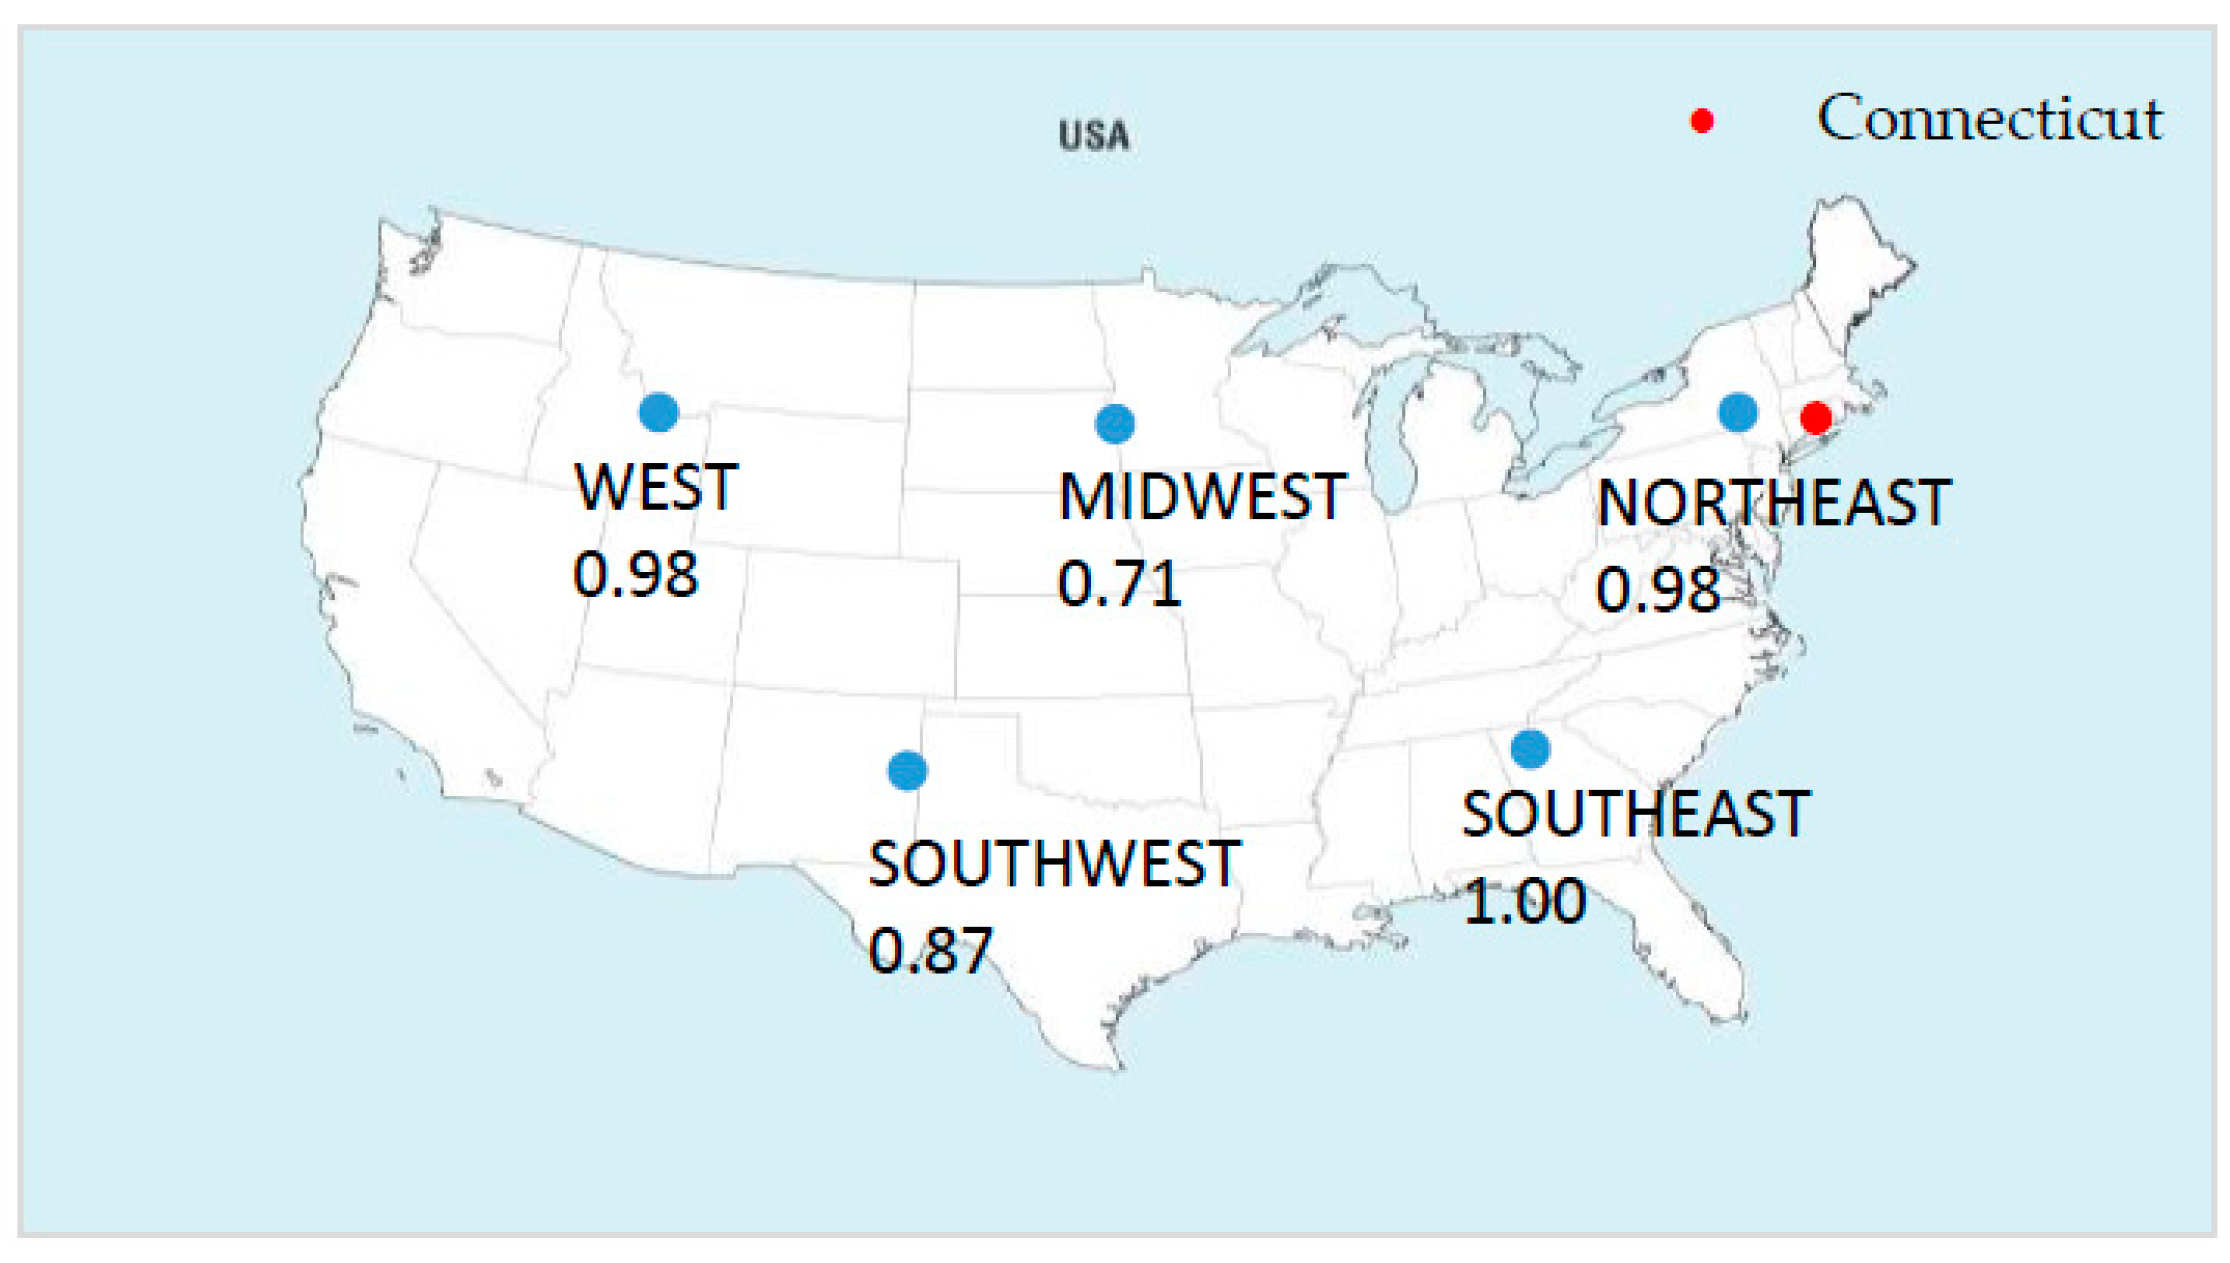
38] lists the average value and quantity of construction sand and gravel sold or used by producers in the U.S. by state. The value shown in the report typically reflects wholesalers for large consumers and is not appropriate to be used for this study directly since this study focuses on home produced concrete for a small consumer. Thus, the regional cost analysis was conducted by normalizing the value based on the assumption that the value is correlated linearly to the local retailer prices of construction materials in Connecticut. The most recent report of the USGA reflects the data from 2017 and Figure 3 shows the averaged the normalization factor compared to Connecticut.
The lowest normalized aggregate cost reported by the report is South Dakota in Midwest and the value is determined to be 0.49 times the price in Connecticut, while Hawaii is 2.1 times more expensive than Connecticut. The normalized Midwest aggregate price for Connecticut ranges from 0.49 (South Dakota) to 0.9 (Ohio). Other than the Midwest and Southwest, the values are very similar to Connecticut. Using the Midwest normalization factor of 0.71 for aggregates, the cost for fly ash decreases to USD 56.28 (additional USD 9 saving) from Table 10. Water price is of minimal impact and was not considered in the regional factor calculation. Cement price is lower in a typical store, such as Lowes or Home Depot and the price is similar nationwide. The regional factors for fly ash, wood ash, and recycled aggregates were not considered because of limited information and sources for other regions.

4.4. Carbon Emission Factors (Global Warming Potentials)

A tremendous amount of concrete is being used in the construction industry which makes the cost of construction so high. The vast amount of construction demolition waste from old concrete structures can be reused as alternative concrete by the construction industry. It is motivated not only by environmental protection, but also by the conservation of natural aggregate resources, the storage of waste disposal land, and the increasing cost of waste treatment before disposal. In China, it was estimated approximately 15.5 million tons of construction waste annually [39].
Carbon dioxide has been considered the main threat which causes global warming. Many possible attempts have been made to reduce the emissions of CO2 by replacing the vast usage of cement with other alternative cementitious materials. Among all those materials, fly ash and wood ash are an effort to reduce the cement content in concrete. Moreover, the use of ash in concrete industry reduces the scarcity of land-filling and waste management.
Thus, environmental effects of alternative concrete were also evaluated and part of the Life Cycle Assessment (LCA) methodology in terms of CO2 emission factor (or Global Warming Potential, GWP) was performed. Greenhouse Gas (GHG) emission factors such as CO2 equivalents for concrete material production have been developed by the Portland Cement Association (PCA), US Census Bureau, the U.S. Geological Survey (USGS), and many individual researchers and universities [27,40,41,42,43,44,45,46]. There is a notable range among each study and the emission factors used for this study are appropriately derived from selected studies. The emitted CO2 equivalents for the materials are then converted to the corresponding common fuel quantity such as gasoline (gal) and followed by multiplying by the 2020 market cost for regular gasoline in the U.S. According to The Environmental Protection Agency (EPA) data—Greenshouse Gases Equivalencies [47], the common conversion factor is 8887 g of CO2 emissions per gallon of gasoline consumed. This indicates that the heat content of the fuel per gallon can be multiplied by the kg CO2 per heat content of the fuel to obtain the number of grams of CO2 emitted per gallon of gasoline combusted. Table 13 displays the emission factors with the associated direct cost saving calculation. The averaged regular gasoline price in Connecticut was USD 2.196 [48] as of August 9, 2020.
As shown in Table 13, the total CO2eq for 30% fly ash concrete was 299.9 lb, while the regular concrete emits 419.9 lb for 1 cubic yard of concrete. This converts to equivalent gasoline and an equivalent indirect cost of USD 13.47 that could be saved by using 30% fly ash concrete. The lowest gasoline price as of August 2020 is USD 1.82 in Mississippi while the highest one is USD 3.24 in Hawaii. When this price range is considered, the equivalent saving could be from USD 11.17 to USD 19.88 for fly ash. The figures used in the study data do not include transportation associated costs for purchasing purposes since there are many unknowns such as distance from house to store, store to manufacturing factory, vehicle type and the gas efficiency of a vehicle, and so on.
The recycled aggregate had 25 times less carbon GWP than new aggregates, however, the aggregates have 99.7% less GWP than cement. This shows that reducing the cement content of the concrete is the most significant measure to be sustainable and environmentally friendly in the concrete industry. It is also very interesting that fly ash had almost 17 times higher GWP than wood ash, yet the concrete produced using 30% fly ash had lower total GWP since less cement was required using fly ash to produce a similar strength. In addition, recycled aggregate concrete saves only about 1% CO2 emission compared to regular concrete while fly ash saves more than 28.5% and wood ash saves almost 24.5%.

5. Conclusions

As an effort to find an alternative for cement in home-produced concrete and sustainable development, this study attempted to find appropriate mix design proportions for the replacement of cement with wood ash, fly ash and the use of recycled concrete aggregates. A concrete compressive strength of 2500 psi was assumed to be a minimum strength for home projects. The following conclusions were derived from the study:
  • The fly ash concrete studied in this research is a good alternative to the regular Portland cement concrete used in various constructions. With 30% replacement, the concrete strength decreases about 26% compared to the strength of 0% fly ash replacement for 28-day testing. The strength of 30% fly ash concrete is just 50 psi lower than the target strength of 2500 psi.
  • In order to have a minimum concrete strength of 2500 psi, the wood ash replacement percentage must be approximately 30% or less.
  • No significant difference of compressive strength was found of the concrete mixture made with up to 100% replacement of natural aggregates with recycled concrete aggregates for 28-day testing. This result might be the use of high-quality strength recycled concrete aggregates in the mixture. When 100% recycled aggregates are replaced, the 28-day strength decreases only 10%. The concrete strength with 100% is still almost 3000 psi for 28-day strength.
  • Fly ash concrete with 30% fly ash is 15.2% cheaper than regular concrete although the strength is 50 psi lower than the target strength of 2500 psi. Fly ash concrete with 50% fly ash can save 26.4%, however the target strength was not satisfied.
  • Regular concrete is 14.9% more expensive than the wood ash concrete with 25% wood ash. When wood ash is provided for free, there is an additional 2% saving.
  • Quikrete and Ready-mix concrete are twice as expensive as regular concrete while all other alternative concrete is cheaper than the regular concrete.
  • There is additional USD 9 saving in consideration of regional factors for the Midwest for 1 cubic yard 30% fly ash concrete.
  • An equivalent indirect cost of USD 13.47 could be saved by using 30% fly ash concrete when considering reduced emitted CO2eq from the material production.
  • Including other factors in the cost analysis such as transportation, tax, delivery fee and labor cost would provide a much more accurate cost analysis.

Author Contributions

This paper is the result of joint work by all authors. M.R.S. worked on fly ash concrete, M.B. worked on wood ash concrete, Q.K. worked on recycled aggregate concrete. M.R.S. and M.B. wrote the original draft together. B.C. supervised all research processes and reviewed and edited the final version of the manuscript. All authors have read and agreed to the published version of the manuscript.

Funding

This research received no external.

Conflicts of Interest

The authors declare no conflict of interest

References

  1. Thomas, M. Optimizing the Use of Fly Ash in Concrete. Available online: https://www.cement.org/docs/default-source/fc_concrete_technology/is548-optimizing-the-use-of-fly-ash-concrete.pdf (accessed on 22 July 2020).
  2. Kalra, T.; Rana, R. A Review of Fly Ash Concrete. Int. J. Latest Res. Eng. Comput. 2015, 3, 7–10. [Google Scholar]
  3. Campbell, A. Recycling and disposing of wood ash. TAPPI J. 1990, 73, 141–146. [Google Scholar]
  4. Etiegni, L.; Campbell, A. Physical and chemical characteristics of wood ash. Bioresour. Technol. 1991, 37, 173–178. [Google Scholar] [CrossRef]
  5. Wiegand, P.; Unwin, J. Alternative management of pulp and paper industry solid wastes. TAPPI J. 1993, 7, 91–97. [Google Scholar]
  6. Udoeyo, F.F.; Inyang, H.; Young, D.T.; Oparadu, E.E. Potential of wood waste ash as an additive in concrete. J. Mater. Civ. Eng. 2016, 18. [Google Scholar] [CrossRef]
  7. Neville, A. Properties of Concrete: Standard Updated to 2002; Person/Prentice Hall: Harlow, UK, 2009. [Google Scholar]
  8. Texixeira, E.; Camose, A.; Brankco, F. Valorisation of wood fly ash on concrete. Resour. Conserv. Recycl. 2019, 145, 292–310. [Google Scholar] [CrossRef]
  9. Chen, H.-J.; Shih, N.-H.; Wu, C.-H.; Lin, S.-K. Effects of the Loss on Ignition of Fly Ash on the Properties of High-Volume Fly Ash Concrete. Sustainability 2019, 11, 2704. [Google Scholar] [CrossRef] [Green Version]
  10. Rajamma, R.; Ball, R.; Tarelho, L.; Allen, G.; Labrincha, J.; Ferreira, V. Characterization and use of biomass fly ash in cement-based materials. J. Hazard. Mater. 2009, 172, 1049–1060. [Google Scholar] [CrossRef]
  11. Chowdhury, S.; Maniar, A.; Suganya, O. Strength development in concrete with wood ash blended cement and use of soft computing models to predict strength parameters. J. Adv. Res. 2014, 6, 907–913. [Google Scholar] [CrossRef] [Green Version]
  12. Kara, P.; Korjakins, A.; Stokmanis-Blaus, V. Evaluation of properties of concrete incorporating ash as mineral admixtures. Constr. Sci. 2012, 13, 17–25. [Google Scholar] [CrossRef] [Green Version]
  13. Tkaczewska, E.; Małolepszy, J. Hydration of coal-biomass fly ash cement. Constr. Build. Mater. 2009, 23, 2694–2700. [Google Scholar] [CrossRef]
  14. ACI Committee 232. Report on the Use of Fly Ash in Concrete; American Concrete Institute: Farmington Hills, MI, USA, 2003. [Google Scholar]
  15. Jeffery, S.; Khayat, K.; Arezoumandi, M.; Drury, J.; Sadati, S.; Smith, A.; Steele, A. Recycled Concrete Aggregate (RCA) for Infrastructure Elements; Final Report TRyy1317; Missouri Department of Transportation Construction and Materials: Jefferson City, MO, USA, 2014. [Google Scholar]
  16. Sanjuan, M.A.; Andrade, C.; Mora, P.; Zaragoza, A. Carbon Dioxide Uptake by Cement-based Materials: A Spanish Case Study. Appl. Sci. 2020, 10, 339. [Google Scholar] [CrossRef] [Green Version]
  17. Naik, T. Tests of Wood Ash as a Potential Source for Construction Materials; Report CBU-1999-09; Department of Civil Engineering and Mechanics, University of Wisconsin-Milwaukee: Milwaukee, WI, USA, 1999. [Google Scholar]
  18. Naik, T.; Kraus, R.; Siddique, R. Controlled Low-Strength Materials containing mixtures of coal ash and a new pozzolanic material. ACI Mater. J. 2003, 100, 208–215. [Google Scholar]
  19. ASTM-International. ASTM D75/D75M-14, Standard Practice for Sampling Aggregates; ASTM International: West Conshohocken, PA, USA, 2017. [Google Scholar]
  20. ACI Committee 211. Standard Practice for Selecting Proportions for Normal, Heavyweight, and Mass Concrete (Reapproved 2009); American Concrete Institute: Farmington Hills, MI, USA, 2002. [Google Scholar]
  21. Neville, G. Concrete Manual Based on the 2015 IBC and ACI 318-14: Concrete Quality and Field Practice; International Code Council: Farmington Hills, MI, USA, 2015. [Google Scholar]
  22. ASTM-International. ASTM C31/C31M-18, Standard Practice for Making and Curing Concrete Test Specimens in the Field; ASTM International: West Conshohocken, PA, USA, 2018. [Google Scholar]
  23. ASTM-International. ASTM C143/C143M15a, Standard Test Method for Slump of Hydraulic-Cement Concrete; ASTM International: West Conshohocken, PA, USA, 2015. [Google Scholar]
  24. ASTM-International. ASTM C231/C231M17a, Standard Test Method for Air Content of Freshly Mixed Concrete by the Pressure Method ASTM International; ASTM International: West Conshohocken, PA, USA, 2017. [Google Scholar]
  25. ASTM-International. ASTM C39/C39M–18, Standard Test Method for Compressive Strength of Cylindrical Concrete Specimens; ASTM International: West Conshohocken, PA, USA, 2018. [Google Scholar]
  26. ASTM-International. ASTM C138/C138M-17a, Standard Test Method for Density (Unit Weight), Yield, and Air Content (Gravimetric) of Concrete; ASTM International: West Conshohocken, PA, USA, 2017. [Google Scholar]
  27. Smith, S.; Durham, S. A cradle to gate LCA framework for emissions and energy reduction in concrete pavement mixture design. Int. J. Sustain. Built Environ. 2016, 5, 23–33. [Google Scholar] [CrossRef] [Green Version]
  28. Ibeto, C.; Obiefuna, C.; Ugwu, K. Environmental effects of concretes produced from partial replacement of cement and sand with coal ash. Int. J. Environ. Sci. Technol. 2020, 17, 2967–2976. [Google Scholar] [CrossRef]
  29. Ramadevi, K.; Chitra, R. Concrete using recycled aggregates. Int. J. Civ. Eng. Technol. 2017, 8, 413–419. [Google Scholar]
  30. Safiuddin, U.; Alengaram, J.; Rahman, M.; Salam, A.; Jumaat, Z. Use of Recycled Concrete Aggregate in Concrete. J. Civ. Eng. Manag. 2013, 19, 796–810. [Google Scholar] [CrossRef]
  31. Lowes. Lowes: Sakrete 94-lb I/Ii Cement. Available online: https://www.lowes.com/pd/Sakrete-94-lb-I-Ii-Cement/4747085 (accessed on 22 July 2020).
  32. Sathe, I. Evaluating the Feasibility of Using Corn Ash and Wood Ash in Concrete in Florida. Master’s Thesis, University of Florida, Gainesville, FL, USA, 2017. [Google Scholar]
  33. State Crushing, INC. Call for Delivery—Pricing Based on Material & Location. Available online: https://statecrushing.com/pricing (accessed on 22 July 2020).
  34. Lombardi Gravel and Excavation, LLC. Lombardi Gravel & Excavation Price Sheet. Available online: https://www.lombardigravel.com/price-sheet (accessed on 22 July 2020).
  35. Connecticut Water. Facts about Connecticut Water Rates. Available online: https://www.ctwater.com/media/2016/s-1-pa-associate-rate-schedules-2018-cwc-09-2018-new-header.pdf (accessed on 22 July 2020).
  36. HomeGuide. How Much Does It Cost to Deliver Concrete per Yard? Available online: https://homeguide.com/costs/concrete-prices#:~:text=The%20average%20cost%20of%20concrete,slab%20runs%20%241%2C060%20to%20%241%2C270 (accessed on 22 July 2020).
  37. The HomeDepot. Quikrete 60 lb. Concrete Mix. Available online: https://www.homedepot.com/p/Quikrete-60-lb-Concrete-Mix-110160/100318478 (accessed on 22 July 2020).
  38. U.S. Geological Survey. Sand and Gravel (Construction). Available online: https://www.usgs.gov/media/files/construction-sand-and-gravel-2017-tables-only-release (accessed on 2 August 2020).
  39. Chaocan, Z.; Cong, L.; Geng, D.; Xiaozhen, L.; Zhiwu, L.; Liqin, L. Mechanical properties of recycled concrete with demolished waste concrete aggregate and clay brick aggregate. Results Phys. 2018, 9, 1317–1322. [Google Scholar] [CrossRef]
  40. Latawiec, R.; Woyciechowski, P.; Kowalski, K. Sustainable Concrete Performance—CO2 Emission. Environments 2018, 5, 27. [Google Scholar] [CrossRef] [Green Version]
  41. Colangelo, F.; Forcina, A.; Farina, I.; Petrillo, A. Life Cycle Assessment (LCA) of Different Kinds of Concrete Containing Waste for Sustainable Construction. Buildings 2018, 8, 70. [Google Scholar] [CrossRef] [Green Version]
  42. Özkan, A.; Günkaya, Z.; Tok, G.; Karacasulu, L.; Metesoy, M.; Banar, M.; Kara, A. Life Cycle Assessment and Life Cycle Cost Analysis of Magnesia Spinel Brick Production. Sustainability 2016, 8, 662. [Google Scholar] [CrossRef] [Green Version]
  43. City of Winnipeg. Emission Factors in kg CO2-Equivalent per Unit. Available online: https://www.winnipeg.ca/finance/findata/matmgt/documents/2012/682-2012/682-2012_Appendix_H-WSTP_South_End_Plant_Process_Selection_Report/Appendix%207.pdf (accessed on 2 August 2020).
  44. Meddah, M. Recycled aggregates in concrete production: Engineering properties and environmental impact. MATEC Web Conf. 2017, 101. [Google Scholar] [CrossRef]
  45. Liu, M.; Zhang, Y.; Wang, Y. Influence of environment conditions on carbon emission of fly ash concrete. Mater. Res. Innov. 2015, 19. [Google Scholar] [CrossRef]
  46. Bhattacharya, S.; Albina, D.; Abdul Salam, P. Emission factors of wood and charcoal-fired cookstoves. Biomass Bioenergy 2002, 23, 453–469. [Google Scholar] [CrossRef]
  47. United States Environmental Protection Agency. Greenshouse Gases Equivalencies Calculator—Calculations and References. Available online: https://www.epa.gov/energy/greenhouse-gases-equivalencies-calculator-calculations-and-references (accessed on 2 August 2020).
  48. AAA Gas Prices. State Gas Price Averages. Available online: https://gasprices.aaa.com/state-gas-price-averages/ (accessed on 9 August 2020).
Figure 1. Mixing, forming, curing and testing of concrete specimens as per ASTM standards.
Sustainability 12 06746 g001
Figure 2. Compressive strength of alternative concretes.
Sustainability 12 06746 g002
Figure 3. Regional factor for aggregate in the U.S. (Connecticut = 1.0).
Sustainability 12 06746 g003
Table 1. Strength of concrete with ash.
Ash TypeW/CCement Replacement %Compressive StrengthReference
MPapsi
Forest Residues0.55941.56019[10]
0.551043.36280
0.602032.54714
0.653022.63278
Wood0.45033.04786[11]
531.14511
1030.74453
1532.34685
1830.14366
2027.74018
Wood0.49057.08267[12]
2047.06817
3042.06092
4039.05656
Coal-Bio0.50044.76483[13]
2030.94482
4020.83017
Table 2. Coarse Aggregate Sieve Analysis.
SieveRetained (lbs)RetainedAccumulative Percent RetainedPercent Passing
1 ½ in. (37.5 mm)00.00%0.00%100.00%
1 in. (25 mm)0.5977.11%7.11%92.89%
¾ in. (19 mm)2.65331.60%38.71%61.29%
½ in. (12.5 mm)2.50029.78%68.48%31.52%
⅜ in. (9.5 mm)2.56430.54%99.02%0.98%
#4 (4.75 mm)0.0570.68%99.70%0.30%
Pan0.0250.30%100.00%0.00%
Sample Weight8.396Fineness Modulus5.13
Note: 1 lb = 0.454 kg.
Table 3. Fine Aggregate Sieve Analysis.
SieveRetained (lbs)RetainedAccumulative Percent RetainedPercent Passing
#40.0030.15%0.15%100.0
#80.33516.80%16.95%99.8
#160.50925.49%42.44%99.7
#300.42521.31%63.75%99.8
#500.38119.08%82.82%99.8
#1000.24212.09%94.92%99.9
Pan0.1045.08%100.00%
Sample Weight1.997Fineness Modulus3.01
Table 4. Tests conducted on materials before mixing.
MaterialsUnit Weight (lb/ft3)Fineness ModulusMoisture Content (%)
Normal Aggregates100.025.130.02
Fine Aggregates95.103.015.81
Recycled Concrete Aggregate95.005.324.00
Note: 100 lb/ft3 = 1601.85 kg/m3.
Table 5. Test conducted on materials and concrete as per The American Society for Testing and Materials (ASTM) standard.
PropertyTest MethodDescription
Compressive StrengthASTM C39 [25]Standard test method for compressive strength
Air ContentASTM C231 [24]Standard test method for
air content of freshly mixed concrete by pressure method
SlumpASTM C143 [23]Standard test method for workability
Unit WeightASTM C138 [26]Standard test method for density
Table 6. Mix proportion of fly ash concrete.
Materials% Replacement of Fly Ash
First Trial (30%)Second Trial (50%)Third Trial (75%)Fourth Trial (100%)
W/C Ratio0.750.750.750.75
Cement (lbs)303.33216.67108.330
Coarse Aggregates (lbs)1755.761755.761755.761755.76
Fine Aggregates (lbs)1583.241583.241583.241583.24
Fly Ash Class C (lbs)130.00216.67238.06433.33
Water (lbs)237.67237.67237.67237.67
Note: 1 lb = 0.454 kg.
Table 7. Mix proportion of wood ash concrete.
Materials% Replacement of Wood Ash
First Trial (18%)Second Trial (25%)Third Trial (33%)Fourth Trial (50%)
W/C Ratio0.750.750.750.75
Cement (lbs)355.33325.00290.33216.67
Coarse Aggregates (lbs)1755.761755.761755.761755.76
Fine Aggregates (lbs)1583.241583.241583.241583.24
Wood ash (WA) (lbs)78.000108.33143.00216.67
Water (lbs)237.67237.67237.67237.67
Note: 1 lb = 0.454 kg.
Table 8. Mix proportion of recycled aggregate concrete.
Materials% Replacement of Recycle Aggregates
First Trial (30%)Second Trial (50%)Third Trial (75%)Fourth Trial (100%)
W/C Ratio0.750.750.750.75
Cement (lbs)433433433433
Normal Aggregates (lbs)12318773510
Fine Aggregates (lbs)1578157815781578
Recycled Aggregate Concrete (lbs)542790414461717
Note: 1 lb = 0.454 kg.
Table 9. Cost comparison of regular concrete and recycled aggregate concrete per USD ($)/yd3.
MaterialUnit Cost ($/lb)Regular Concrete100% Recycled Aggregate
Quantity (lbs/yd3)Total Cost ($/yd3)Quantity (lbs/yd3)Total Cost ($/yd3)
Water$0.0010 237.67$0.24 237.67$0.24
Cement$0.1380 433.33$56.33 433.33$56.33
Coarse Aggregate$0.0098 1755.76$16.68 0
Fine Aggregate$0.0090 1583.24$13.46 1583.24$13.46
Recycled Aggregate$0.0066 1755.76$11.59
Total cost $86.47 $81.62
Table 10. Cost comparison of fly ash concrete and wood ash concrete per USD ($)/yd3.
MaterialUnit Cost ($/lb)30% Fly Ash50% Fly Ash25% Wood Ash
Quantity (lbs/yd3)Cost ($/yd3)Quantity (lbs/yd3)Cost ($/yd3)Quantity (lbs/yd3)Cost ($/yd3)
Water$0.0010 237.67$0.24 237.67$0.24237.67$0.24
Cement$0.1380 303.33$41.86 216.76$29.91325.00$44.85
Coarse Aggregate$0.0098 1755.76$17.211755.76$17.211755.76$17.21
Fine Aggregate$0.0090 1583.24$14.25 1583.24$14.251583.24$14.25
Fly Ash$0.0175 130.00$2.28 216.67$3.79
Wood Ash$0.0120 108.33$1.30
Total cost $75.83 $65.40 $77.84
Table 11. Cost comparison of Quikrete and Ready-mix concrete per USD ($)/yd3.
TypeUnit CostQuantityCost per yd3
Quikrete$0.0558/lb3240 lbs/yd3$180.79
Ready-mix$175/yd31 yd3$175.00
Notes: 1 lb = 453.59 g and 1 lb/yd3 = 0.593 kg/m3; 1 yd = 0.914 m and 1 yd3 = 0.765 m3.
Table 12. Normalization of material cost.
Concrete TypeCost per $/yd3Normalization
Quickrete180.792.09
Ready-mix175.002.02
Regular concrete86.471.00
100% RCA with purchase81.620.94
25% Wood ash77.840.90
25% Wood ash *76.540.89
30% Fly ash75.830.88
100% RCA *70.030.81
* denotes a free material case.
Table 13. Emitted CO2eq and cost savings on alternative concrete input materials for 1 cubic yard.
MaterialCO2 Emission Factor
(lb CO2eq/lb Mat.)
Regular Concrete (lb)100% Recycled Aggregate Concrete (lb)30% Fly Ash Concrete (lb)25%Wood Ash Concrete (lb)
Tap Water0.0003 [45]0.080.080.080.08
Cement0.9497 [27]411.53411.53288.07308.65
Coarse Aggregate0.0025 [27]4.34 4.344.34
Fine Aggregate0.0025 [27]3.923.923.923.92
Recycled Aggregate0.0001 [46] 0.21
Fly Ash0.0270 [47] 3.51
Wood Ash0.0016 [48] 0.17
Total CO2eq (lb) 419.87415.73299.92317.16
Equivalent Gasoline (gal) 21.4821.2615.3416.22
Corresponding Cost ($) 47.1646.6933.6935.62
Equivalent Saving ($) 0.000.4613.4711.54
Note: the Connecticut gasoline price of USD 2.196 (as of August 9, 2020) and the conversion factor of 8887 g (19.55 lb) of CO2 emissions per gallon of gasoline consumed were applied.

