Article

Sustainable Perspective of Low-Lime Stabilized Fly Ashes for Geotechnical Applications: PROMETHEE-Based Optimization Approach

1
Department of Civil Engineering, National Institute of Technology, Warangal, Telangana 506004, India
2
Department of Industrial Engineering, College of Engineering, King Saud University, Riyadh 11421, Saudi Arabia
3
Advanced Manufacturing Institute, King Saud University, Riyadh 11421, Saudi Arabia
*
Author to whom correspondence should be addressed.
Sustainability 2020, 12(16), 6649; https://doi.org/10.3390/su12166649
Submission received: 11 June 2020 / Revised: 4 August 2020 / Accepted: 13 August 2020 / Published: 17 August 2020

Abstract

:
In the present scenario of global green environmental and sustainable management, the disposal of large volumes of coal-based ashes (fly ashes) generate significant environmental stress. The aim is to exploit these fly ashes for bulk civil engineering applications to solve societal-environmental issues employing sustainable measures. In this study, the addition of lime and/or gypsum in improving the geotechnical properties (hydraulic conductivity, compressibility, unconfined compression strength, lime leachability, and California bearing ratio) of fly ashes was investigated. To assist the practicing engineers in selecting the right mix of lime and/or gypsum for a given amount of fly ash for a specific application, a multi-criteria approach was adopted. The possible alternatives investigated included untreated fly ash, fly ash treated with lime (1%, 2.5%, 5%, or 10%), and a variation in gypsum dosage (1% or 2.5%) in the presence of lime. Sensitivity analysis was performed to recognize and resolve the conflicting advantages and disadvantages when mixing lime and gypsum. The study revealed that to derive the potential benefits of fly ash, it is essential to combine the lime dosage with gypsum for pavement and liner applications where bulk quantities of fly ash are employed.

1. Introduction

Current sustainable energy policies reflect thermal power generation as a major mode of power generation that facilitates industrial development worldwide. A total of 7727.3 Mt of coal was produced worldwide in 2017 [1]. The production of large quantities of sustainable fly ash [2] necessitates adequate disposal facilities, owing to its negative environmental impact [3]. Additionally, the higher disposal costs associated with fly ashes necessitate its recycling for sustainable development. However, the bulk utilization of fly ashes in various civil engineering applications assists in solving sustainable societal and environmental needs, such as liner material for landfills, sub-base material for pavements, backfill material for embankments and retaining walls, substitute material for sand, aggregate, and cement, and other domestic purposes [4,5,6,7,8,9,10,11,12,13,14]. The various engineering properties that facilitate the utilization of fly ashes, especially in geotechnical applications, are elaborated on in Table 1.
As most fly ashes produced from harder, older, bituminous, and anthracite coals have very low lime content (Class F type), they require cementing agent(s) in the form of lime, gypsum, or cement to enhance their applicability for various civil engineering applications, as discussed in the above Table 1. The addition of lime will supplement a basic cementing agent to produce pozzolanic compounds over time by dissolving the silica-rich, glassy phases of fly ashes [23,24,25]. Because lime-fly ash reactions are time-dependent, the addition of gypsum is considered in order to increase the rate at which pozzolanic compounds are formed. When gypsum is added to lime-treated fly ashes, it provides both advantages and disadvantages; it retards the setting time and accelerates the strength [23,26].
The present study focused on the sustainable perspective of lime and/or gypsum addition on the enhancement of the geotechnical properties (hydraulic conductivity (HC), unconfined compression strength (UCS), compressibility characteristics (Cc), lime leachability (LL), and California bearing ratio (CBR)) of two different types of fly ashes. Both lime and gypsum, at varying dosages, were added to enhance the cementation effect. To assist practicing engineers in selecting the appropriate mix of fly ash, lime, and gypsum contents for specific civil engineering applications, a multi-criteria decision-making (MCDM) approach was adopted. An MCDM approach has been successfully applied in civil engineering applications pertaining to hydraulics [27,28,29], energy [30], solid waste [31,32], transportation [33], green building materials [34], and sustainable development [35].
In the current study, an MCDM approach [36,37,38] was employed to evaluate the different geotechnical properties of fly ashes, stabilized with lime and gypsum at different dosages, for targeted bulk applications. In the present approach, concepts pertaining to preference flow, sensitivity analyses, and graphical interactive analyses were formed to assist practicing engineers in ranking treatment strategies (i.e., determining the correct dosages of lime and gypsum) to establish the superiority of one treatment strategy over another.

2. Methodology

The adopted methodology was based on the variation of three factors: type of fly ash, lime dosage, and gypsum dosage (Table 2). The combined influence of each factor, at different levels of interaction, was investigated with regard to the response of the resultant geotechnical properties for specific liner and pavement applications.

2.1. Materials Used

This study used two low-lime fly ashes, named A and B (Table 3), sourced from thermal power plants in Neyvelli and Muddanur, which are towns in the states of Tamil Nadu and Andhra Pradesh in India, respectively. Analytical-reagent (AR) grade gypsum (CaSO4 2H2O) and AR grade hydrated lime (Ca(OH)2), supplied by Merck limited, India, were used in the present study. The specific surface area values (SSA) of fly ashes A and B were found to be 9.6 and 8.2 m2/gm, respectively [25]. Both fly ashes exhibited non-plastic behavior, with fly ash B having greater fines content compared to fly ash A. Mullite and Quartz phases were predominant in both fly ashes.

2.2. Experimental Testing Methodology

UCS tests were conducted in accordance with ASTM D2166 [39] on samples cured for 28 days. Table 4 shows the UCS values for the cured fly ashes A and B. CBR tests were conducted, in accordance with IS 2720 Part 16 [40] and ASTM D1883 [41], on samples cured for 14 days under controlled humidity conditions, and the results are presented in Table 4. Hydraulic conductivity tests were carried out, in accordance with ASTM D5856 [42], on samples cured for 28 days. Compressibility tests were carried out on standard, one-dimensional odometer consolidation tests, as per IS 2720 Part 15 [43] and ASTM D2435 [44]. The compression index values, corresponding to the loading increment from 25 to 50 kPa, are reported in Table 4. The experimental test setup and specimen-testing details are provided in Figure 1. An LL-testing procedure, developed by Moghal and Sivapullaiah [22], was employed in this study. The LL values of cured fly ashes, under 7 days of steady flow conditions, are reported in Table 4. A minimum of three tests were carried out (in triplicates) for each of the studied parameters (hydraulic conductivity; unconfined compressive strength test; California bearing ratio; lime leachability and one-dimensional oedometer fixed-ring consolidation test) as per ASTM standards, and the average values are reported in Table 4.

3. Experimental Results

The following sections address the fundamental governing mechanism responsible for the enhancement of the targeted properties and the PROMETHEE strategy adopted to choose the ideal mix of fly ash, lime, and gypsum for the selected fly ashes. Pozzolanic reactions of lime (as Ca(OH)2) resulted in the formation of gels, followed by crystallization, namely of calcium silicates, aluminates, and alumina silicates. Precipitation and even distribution of hydration products (Ca(OH)2, C-S-H, etc.) on the surfaces of fly ash contributed to the additional increase in the strength of the stabilized mix. The rate of formation of stabilized compounds, which increases with the curing period, resulted in the reduction of the LL ratio, defined as the ratio of lime leached to the total lime added. It has been demonstrated that the LL decreases with an increase in the lime content. Sulphate ions from gypsum reacted with the alumina phase of fly ash to produce (x CaO. y Al2O3. z CaSO4. w H2O), which enhanced the pozzolanic activity of lime-stabilized fly ashes with higher strength (refer to Table 4). Furthermore, the formation of C-S-H and C-A-S-H gels reduced the LL of fly ashes and increased the unconfined compressive strength and California bearing ratio behavior, as seen in Table 4. Additionally, the resultant denser matrix significantly reduced the hydraulic conductivity values and compression index values (refer to Table 4).

4. MCDM Model: Based on PROMETHEE and GAIA

For the application of the proposed model, the first step was to develop alternative strategies to enhance various geotechnical properties of fly ash. Initially, the untreated fly ashes were adopted for the geotechnical application and were subsequently treated with lime (1%, 2.5%, 5%, and 10%) and a variation in gypsum dosage (1% and 2.5%) in the presence of lime. Thus, a total of 26 (2 × 1 + 2 × 4 + 2 × 4 × 2) alternative strategies were adopted in the present study. For each alternative strategy, three samples were used, and for each sample, five performance measures were obtained. Thus, 390 performance results were obtained and are reported in Table 4. From the results, it is evident that no individual experiment was superior in terms of all five performance measures. The adopted MCDM model was based on PROMETHEE and geometrical analysis for interactive aid (GAIA), proposed by Brans and Mareschal [45]. PROMETHEE was adopted for the partial and complete ranking of the selected alternative treatment strategies; GAIA was used for the sensitivity and comparative analysis of experimental strategies.

4.1. PROMETHEE Partial Ranking

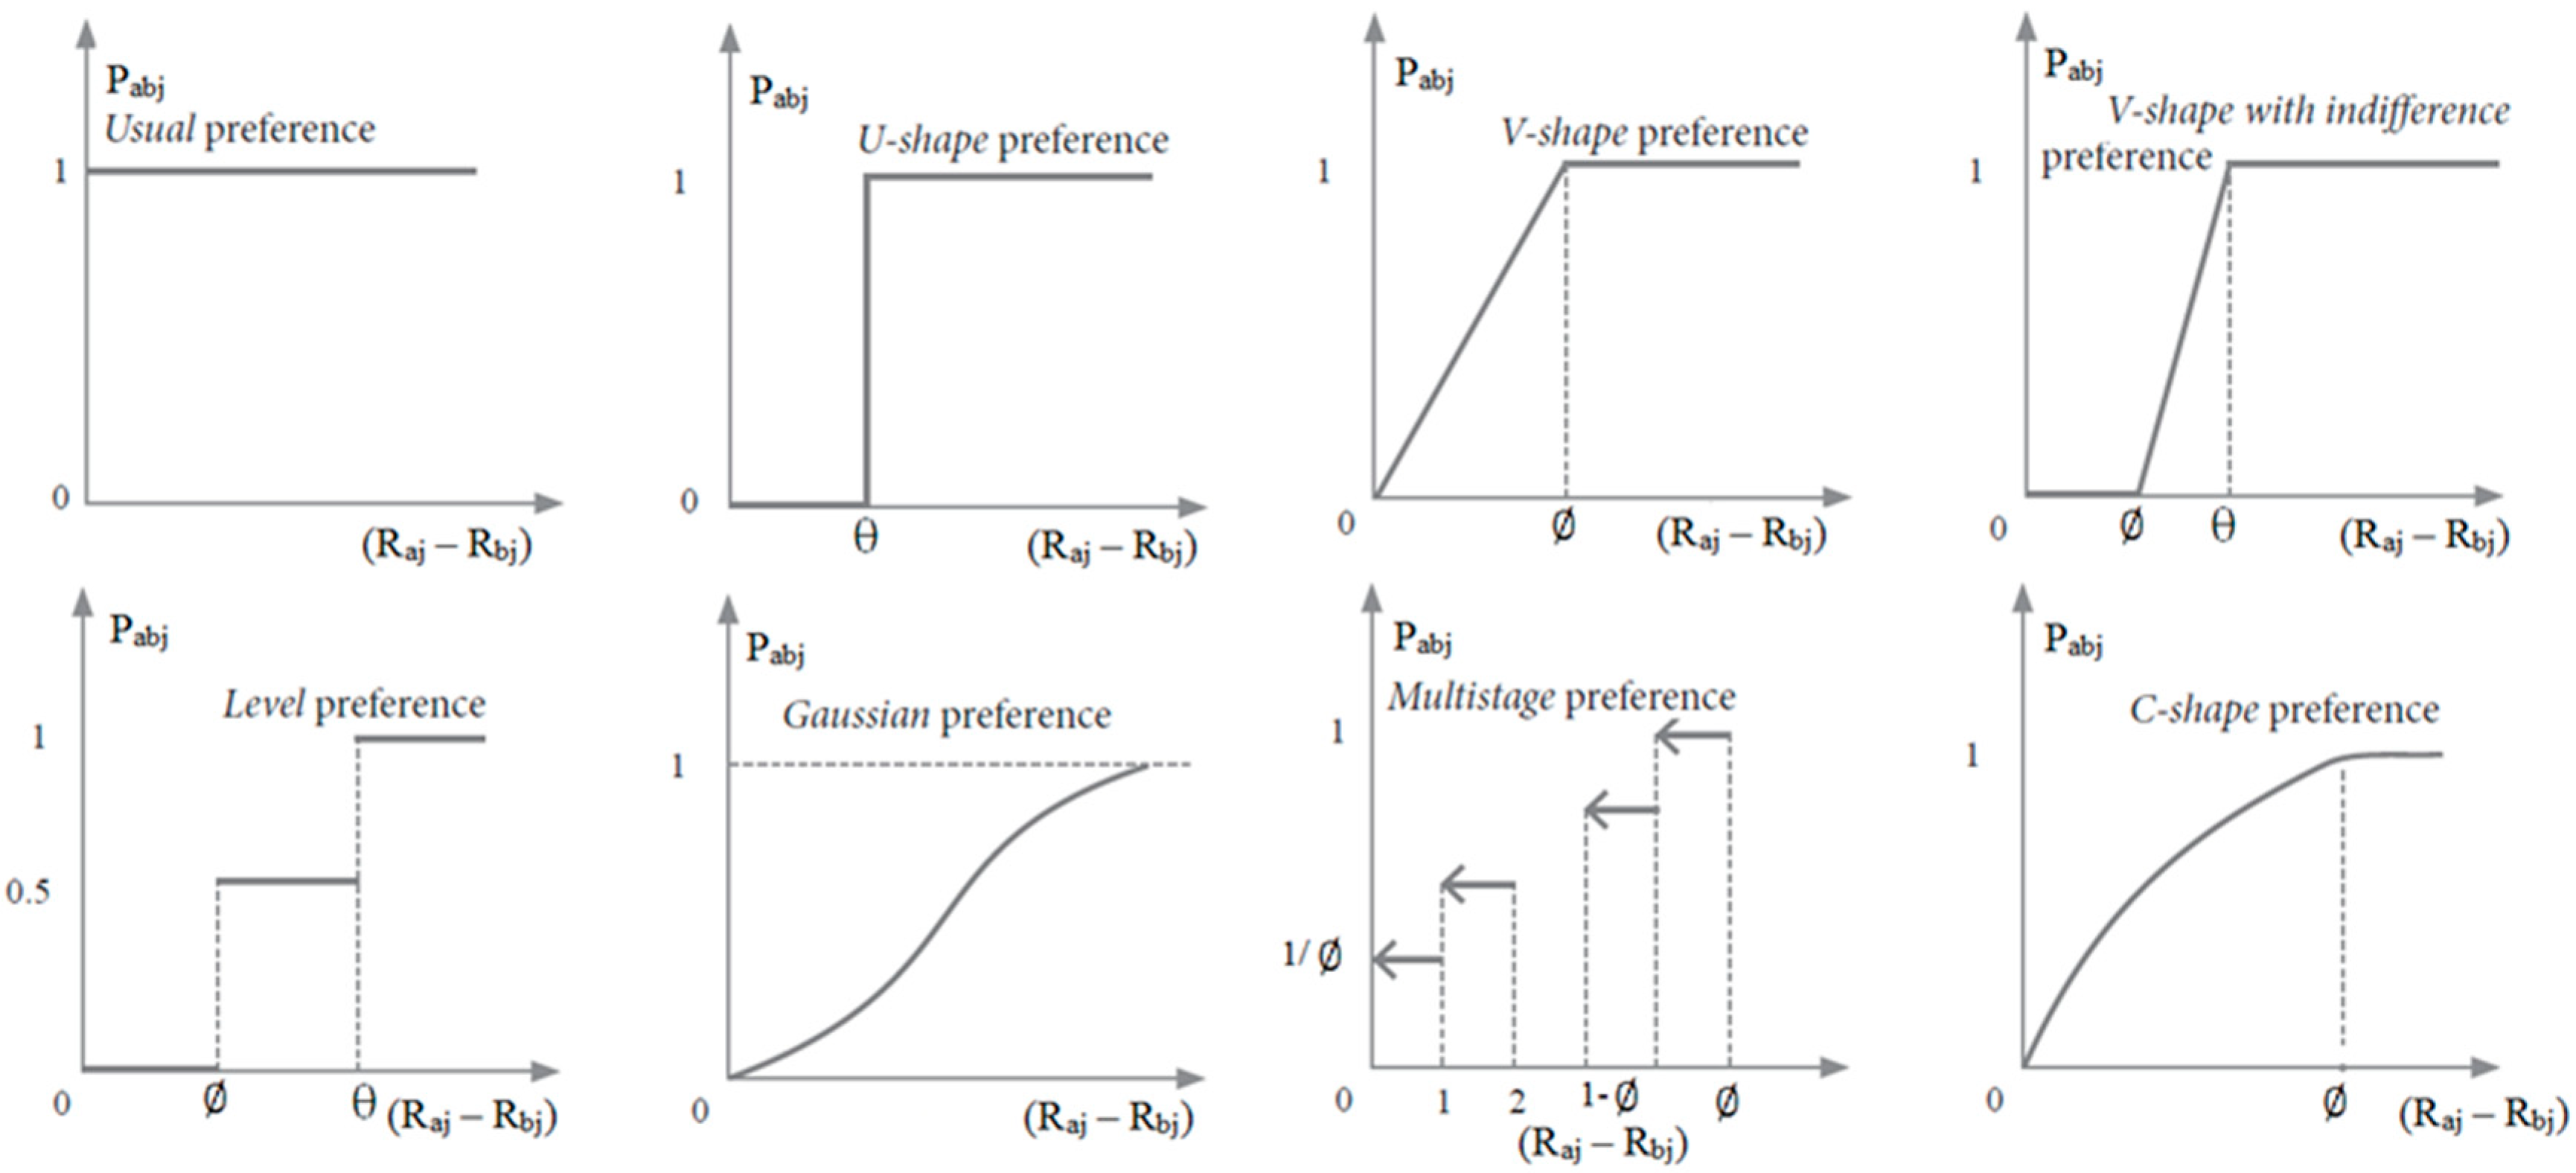
Ta and Tb denote the treatment strategies used to enhance various geotechnical properties for the given fly ash. The effectiveness of the treatment strategies was measured based on multiple performance measures, such as j ϵ performance measures. Raj and Rbj are the performance measures for treatment strategies Ta and Tb, respectively. In order to set a partial preference, a generalized preference function Pabj was defined for performance measure j, when alternative treatment strategies Ta and Tb were compared; Pabj fluctuates between zero and one (refer to Figure 2). The value of Pabj can be interpreted as follows:
  • Pabj ≈ one, indicates acceptable preference for strategy Ta over strategy Tb.
  • Pabj ≈ zero, indicates a weak preference for strategy Ta over strategy Tb.
  • Pabj = zero, indicates no preference for strategy Ta over strategy Tb for a given j performance measure.
  • Pabj = one, indicates a higher preference for strategy Ta over Tb.
Preference functions (Pabj) were adopted [45] based on the response measures (Raj and Rbj) and the permissible boundary to derive a full incompatibility (ϴ) and a full preference (Ø). The permissible boundary values ϴ and Ø were set by the decision-maker.
Subsequently, considering all “k” performance measures (j = 1 to k), the preference function value Pab for a pair of treatment strategies Ta and Tb was computed using Equation (1). In Equation (1), Wj is the weight assigned to each performance measure j; Pabj is a preference function allocated to a pair of treatment strategies Ta and Tb for each j. Pab fluctuates between zero and one.
P ab = j = 1 k ( W j   X   P abj ) j = 1 k W j  
However, in practice, more than two treatment strategies exist to enhance various geotechnical properties for the given coal-based fly ash. In this study, 26 treatment strategies were analyzed to find the superiority of a treatment strategy over the others; this is set by estimating two outranking flows (F+ and F-), expressed in Equations (2) and (3). Each outranking flow does not result in the same rank for each treatment strategy. Thus, their (F+ and F) intersection is induced to estimate partial ranking.
F + a = 1 n 1 1 n P ab   ( b a )  
F a   = 1 n 1 1 n P ba   ( b a )
Contrary to Pab, Pba is a preference function to estimate the dominance of treatment strategy Tb over Ta, and n is the number of treatment strategies. For “n” given treatment strategies, each is compared to n-1 other treatment strategies. Thus, the objective in partial ranking is to maximize outranking flows (F+) and to minimize outranking flows (F); these outranking flows express how Ta outranks the other n-1 treatment strategies. By determining positive (F+a and F+b) and negative (F−a and F−b) outranking flows for a pair of treatment strategies Ta and Tb, the dominance relationship can be inferred as shown below:
  • If F+a > F+b, the outranking relationship is D+ab (i.e., treatment strategy Ta is dominating Tb).
  • If F−a < F−b, the outranking relationship is D−ab (i.e., treatment strategy Ta is not dominating Tb).
  • If F+a = F+b, the outranking relationship is ED+ab (i.e., both treatment strategies Ta and Tb equally dominate (ED) the other “n − 2” treatment strategies).
  • If F-a = F-b, the outranking relationship is ED-ab (i.e., both treatment strategies Ta and Tb are equally dominated (ED) by the other “n − 2” treatment strategies).
Based on the above conditions, three PROMETHEE-based partial rankings were computed as follows to establish the preference relationship between Ta and Tb:
  • If (D+ab and D−ab)/(D+ab and ED−ab)/(ED+ab and D−ab) are true, it indicates that treatment strategy Ta has a higher preference over Tb.
  • If ED+ab and ED−ab are true, it indicates that treatment strategy Ta is no different to Tb.
  • If (D+ab and D−ba)/(D+ba and D−ab) are true, it indicates that treatment strategy Ta is in contrast to Tb. Specifically, on a set of geotechnical performance measures, Ta exhibits the best performance over Tb, which exhibits a low response and vice versa.
In order to determine the best treatment strategy, PROMETHEE partial ranking was extended to PROMETHEE complete ranking.

4.2. PROMETHEE Complete Ranking

For complete ranking, outranking flow Fa is set as the balance between two outranking flows F+ and F-, in reference to Equations (2) and (3); Fa is computed using Equation (4). Using PROMETHEE complete ranking, all treatment strategies are comparable.
{ F a   =   F + a     F a   F b   =   F + b     F b   }
Based on the outranking flows Fa and Fb (in reference to Equation (4)), PROMETHEE complete ranking is established between Ta and Tb as follows:
  • If Fa > Fb is true, it indicates that treatment strategy Ta is preferred over treatment strategy Tb.
  • If Fa = Fb is true, there is no difference between treatment strategies Ta and Tb.
  • If Fa < Fb is true, it indicates that there is no preference of treatment strategy Ta over treatment strategy Tb.

5. Application of PROMETHEE

From above Table 4, it is evident that no treatment strategy exhibits superiority in terms of all five performance measures. Using PROMETHEE, the outranking flows (F+, F, and F) were obtained for each treatment strategy, for two different types of applications (i.e., liner and pavement applications), as presented in the following Table 5. Using F+, F, and F, the treatment strategies ranking and superiority of each treatment strategy are presented in Figure 3, Figure 4, Figure 5 and Figure 6.
In Figure 3, the left-hand column corresponds to the F+ score and the right-hand column to the F score for each treatment strategy. These scores are oriented such that the best are projected upwards. For each treatment strategy, a representative line is drawn from its F+ to the corresponding F score. For any given two treatment strategies, if the representative lines are parallel, the treatment strategy representing the top line is preferred. However, if the two lines intersect, the corresponding treatment strategies are incomparable.
In Figure 3, treatment AL2G2 dominates the other treatments and corresponds to fly ash type A treated with lime (2.5%) and gypsum (2.5%) (Table 2 and Table 4). It also reveals that pure fly ash type A underperformed compared to other possible treatments. Similarly, both fly ashes with lime treatment alone underperformed compared to alternative treatments. Generally, the outranking scores (F+ and F) induce two different complete rankings. In order to circumvent this scenario, a complete ranking based on net flow “F” was obtained, as shown in Figure 4. The top half corresponds to F+ and the bottom half to F scores for each treatment.
Similarly, in the above Figure 4, it is evident that AL2G2 and AL3G2 (for example, as calculation case for AL3G2 refer in the Appendix A, to illustrate how to obtain the value of “F”) superseded the other treatment strategies, while A and AL2 were the least preferred. Simultaneously, using F+, F, and F, a preference network is drawn (refer to Figure 5) where the treatment strategy and its choice over other treatment strategies are denoted by the arrow →. Figure 5 also shows that treatment strategy AL2G2 was preferred over other treatment strategies, with A and AL2, once again, being least-preferred. It is interesting to note that treatment strategy B was preferred over A, AL1, AL2, and AL3. This is due to the fundamental differences in chemical and mineralogical compositions between the two fly ashes (refer to Table 3). The visual PROMETHEE and GAIA plane represents the conflicts between response measures and highlights the group of treatment strategies of remarkable performance (refer to Figure 6).
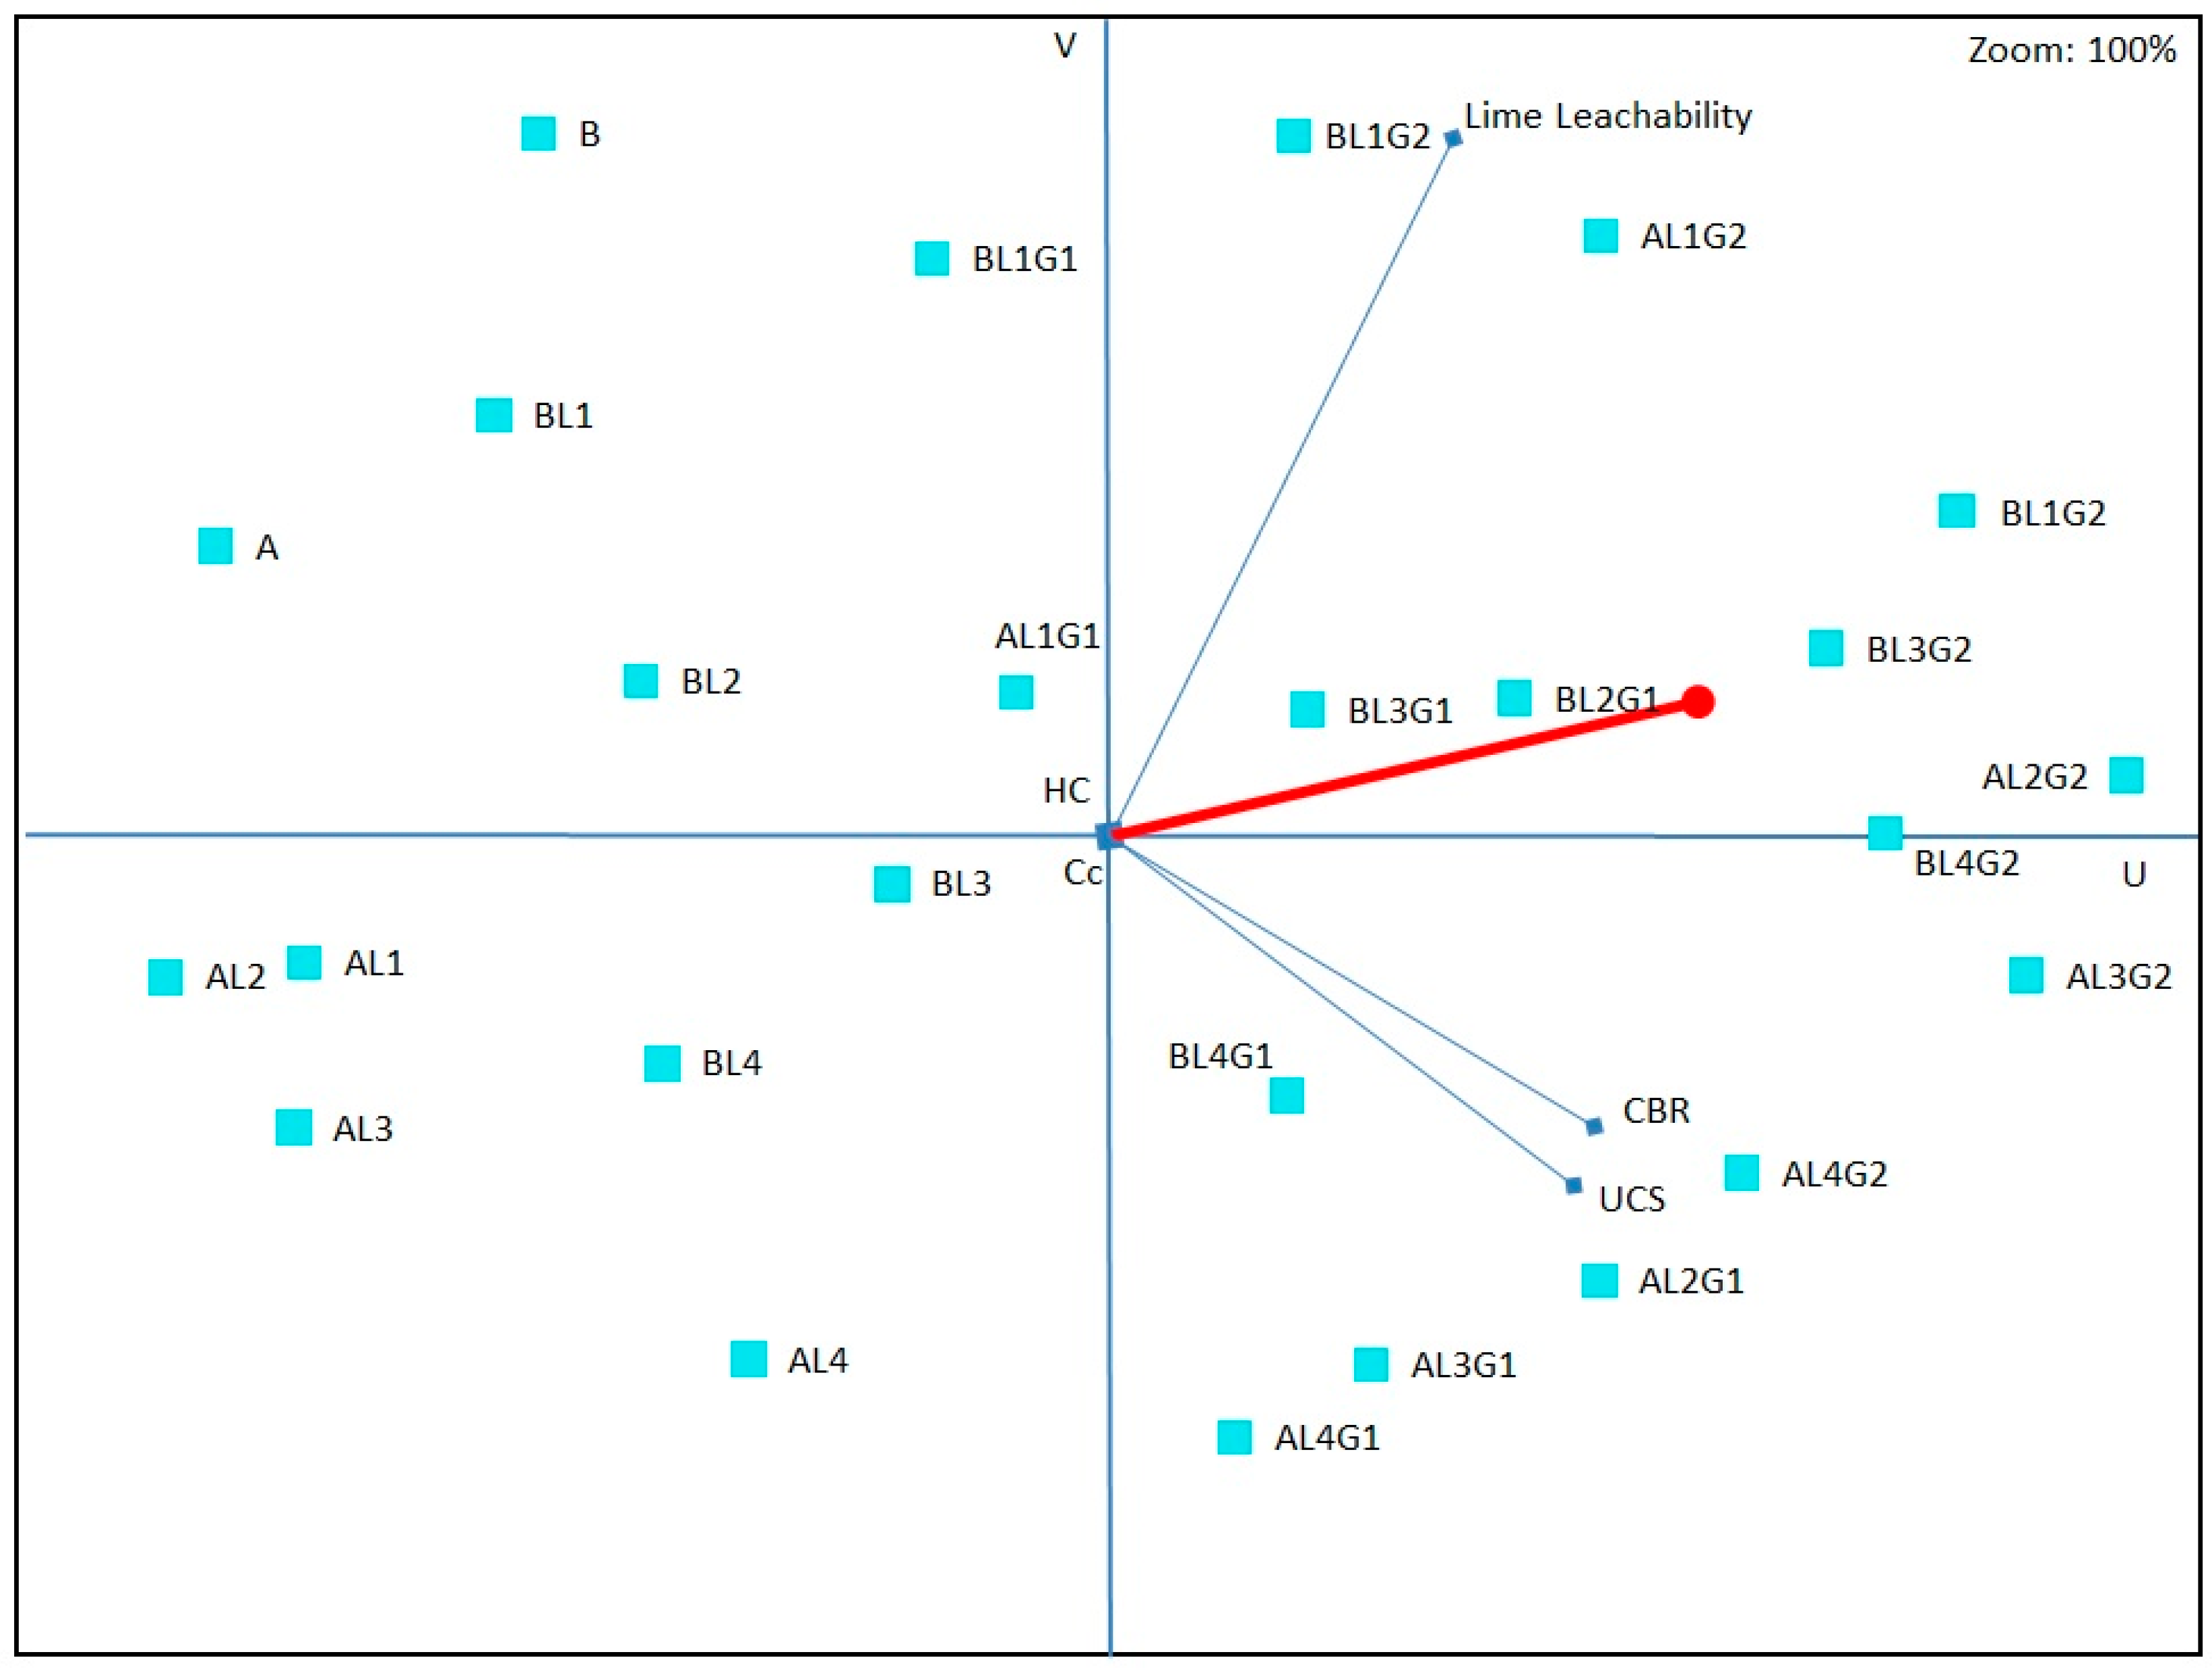
The GAIA plane is considered to be a geometrical interactive tool, used to assist decision-makers with sensitivity analyses. Treatment strategies are represented by blue squares in Figure 6, and treatment strategies with no difference appear close, while conflicting strategies are placed in different quadrants. The various geotechnical properties of fly ash measures, showing equal preference, lean in the same direction in the GAIA plane while conflicting response measures lean in the opposite direction. From Figure 6, it is clear that the fly ash without any additives or with only a lime dosage treatment are scored opposite to the fly ash with both a lime and gypsum treatment. Fly ash type A, treated with a lime dosage of 10% and gypsum dosage of 1%, scored better for response measures UCS and CBR against fly ash type B, which was also treated with a lime dosage of 10% but a gypsum dosage of 2.5%. Similarly, for the lime-leachability response measure, both fly ashes scored better when treated with a 1% lime and 2.5% gypsum dosage. However, for the HC and Cc response measures, only fly ash type A with a 1% lime and gypsum dosage scored better.
Sensitivity analysis was adopted to assign weights to each response measure. To perform sensitivity analyses on the experimental data (refer to Table 4), the Visual PROMETHEE-GAIA walking weights tool was used.

Sensitivity Analysis Using Walking Weights

Sensitivity analysis using walking weights was performed by assigning a set of weights to each response measure, as shown in Table 6. Set 1 represents an equal weight allocation for all response measures (Figure 7). Because fly ashes have the most potential to be used in liners and pavement material applications, a sensitivity analysis was carried out for these two specific applications by assigning due weights. The rationale behind weight allocation is application-specific, as seen in Table 6. For a liner material, the driving factor is “Hydraulic conductivity,” and it was assigned a higher weight compared to the other response measures (i.e., UCS, CBR, Cc and LL). Similarly, for the pavement application, the significant factor is the “California bearing ratio,” and it was duly assigned higher weightage over the other response measures.
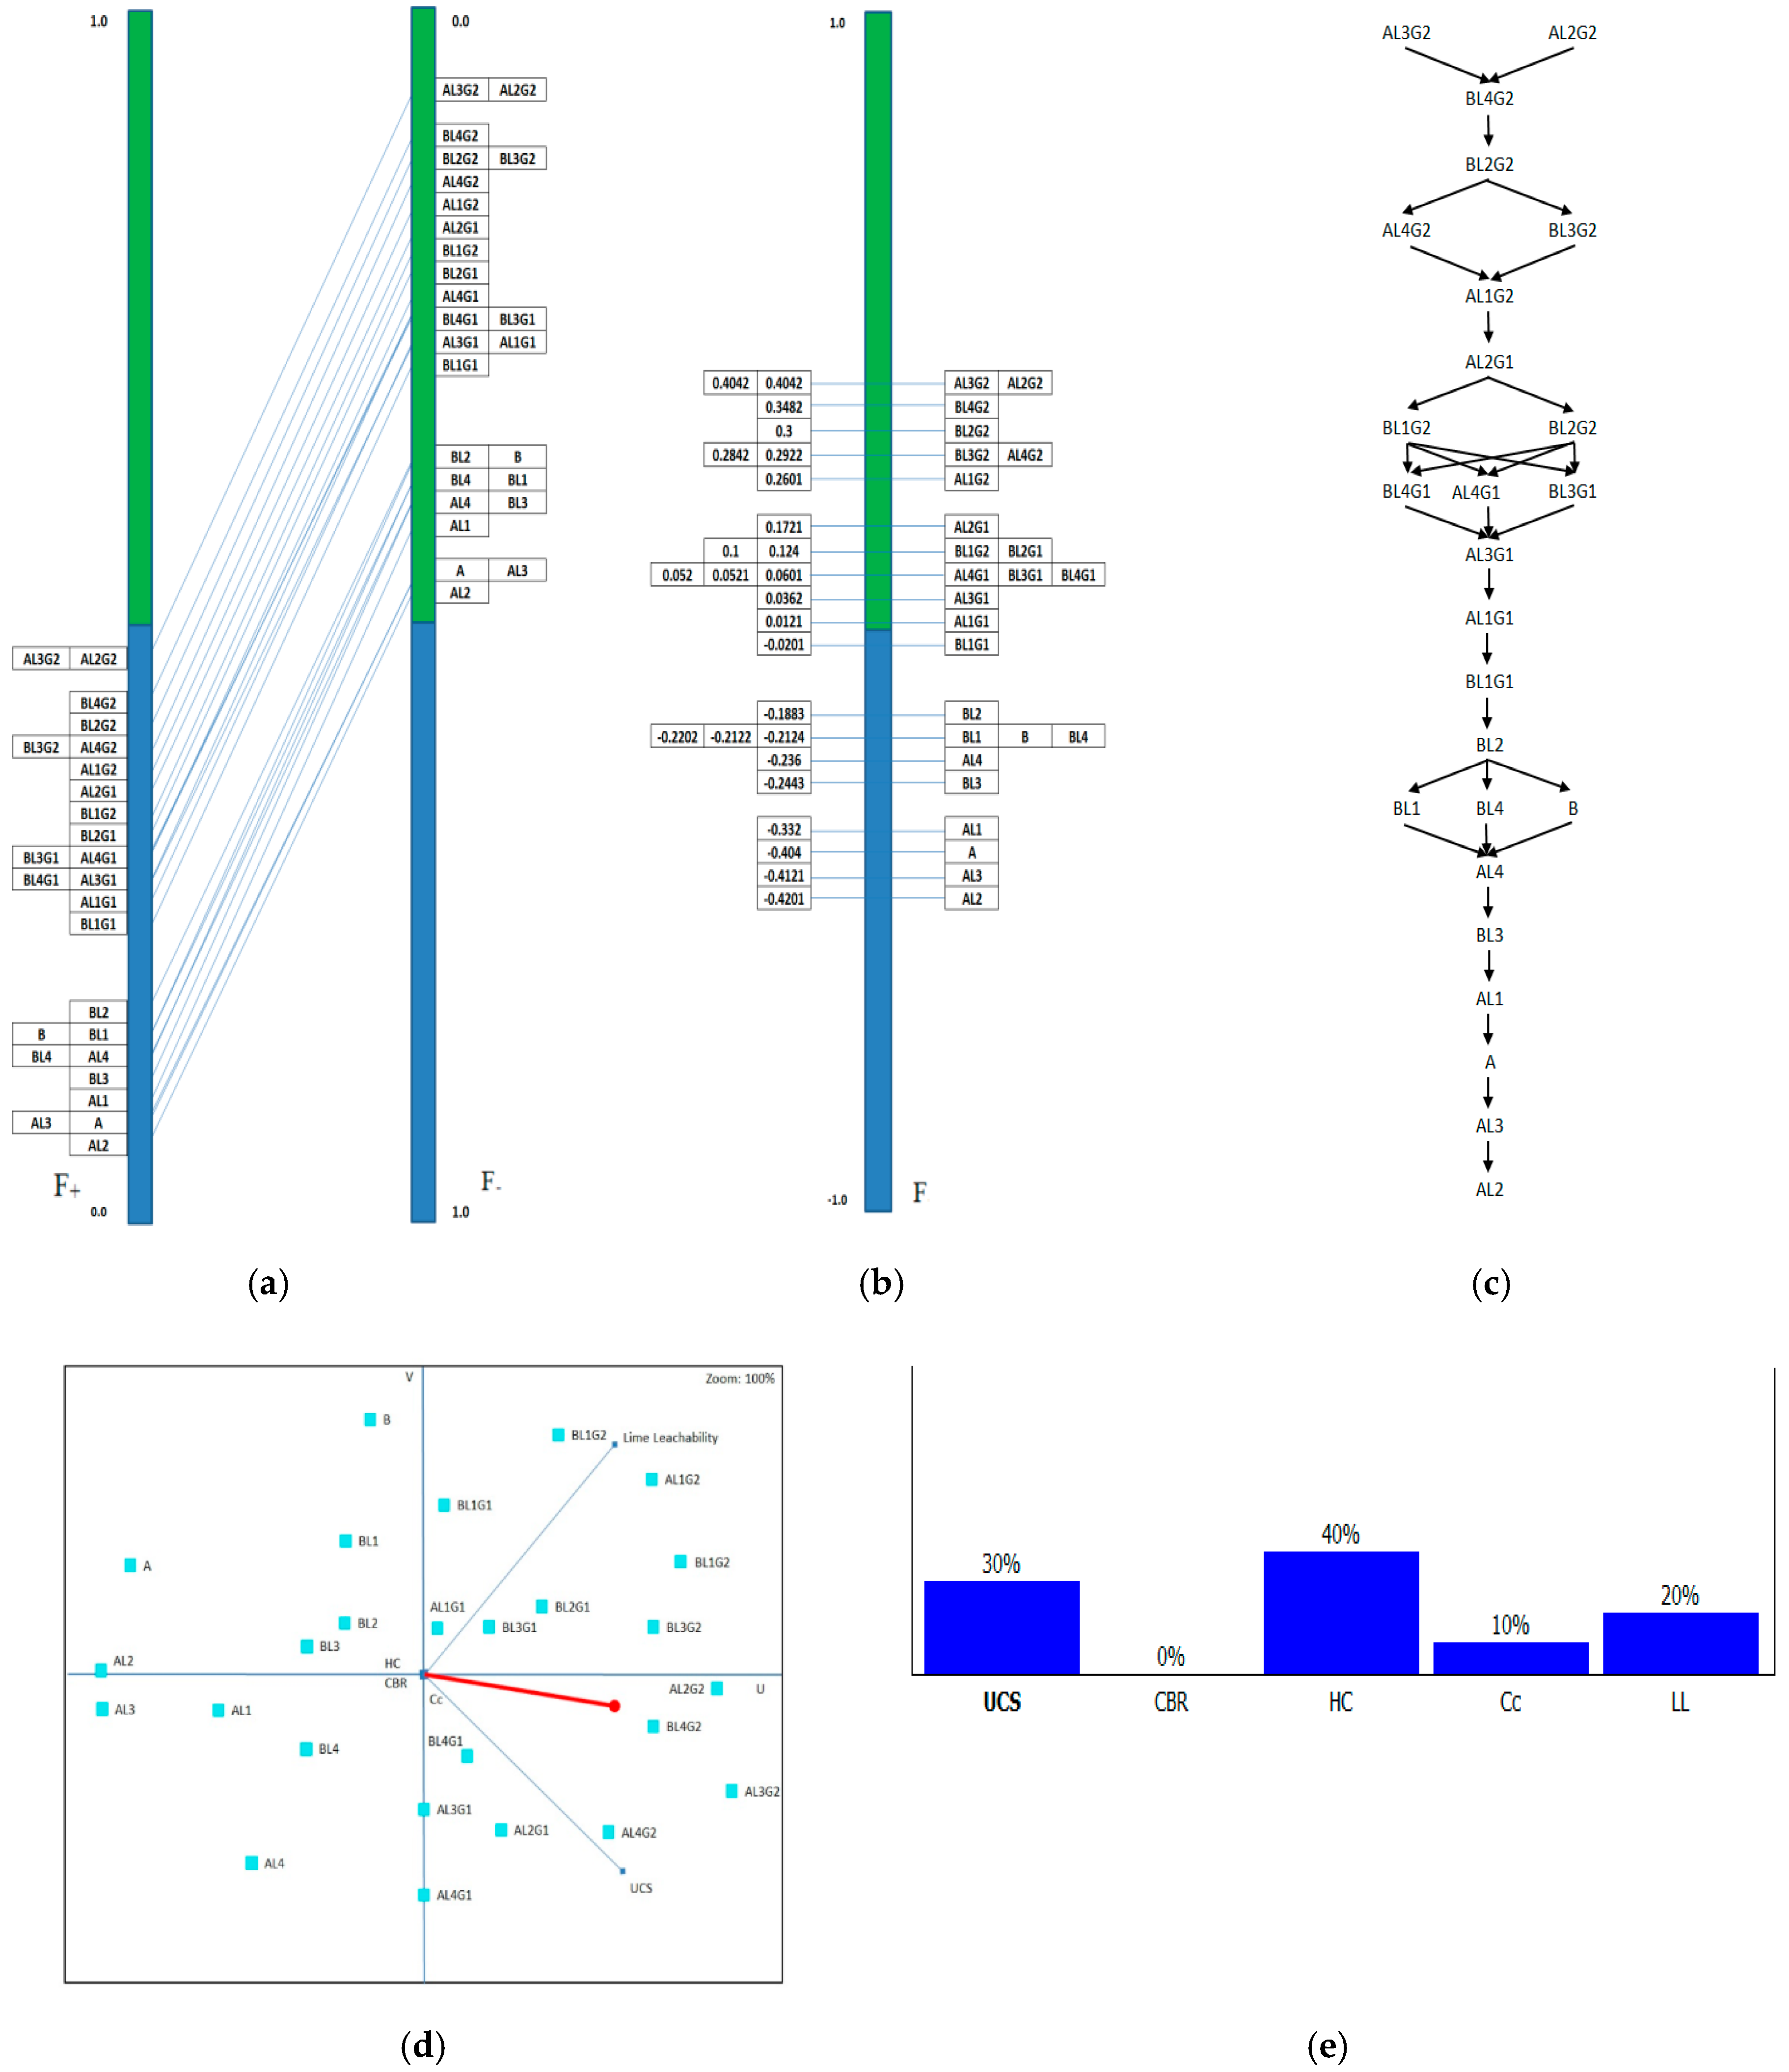
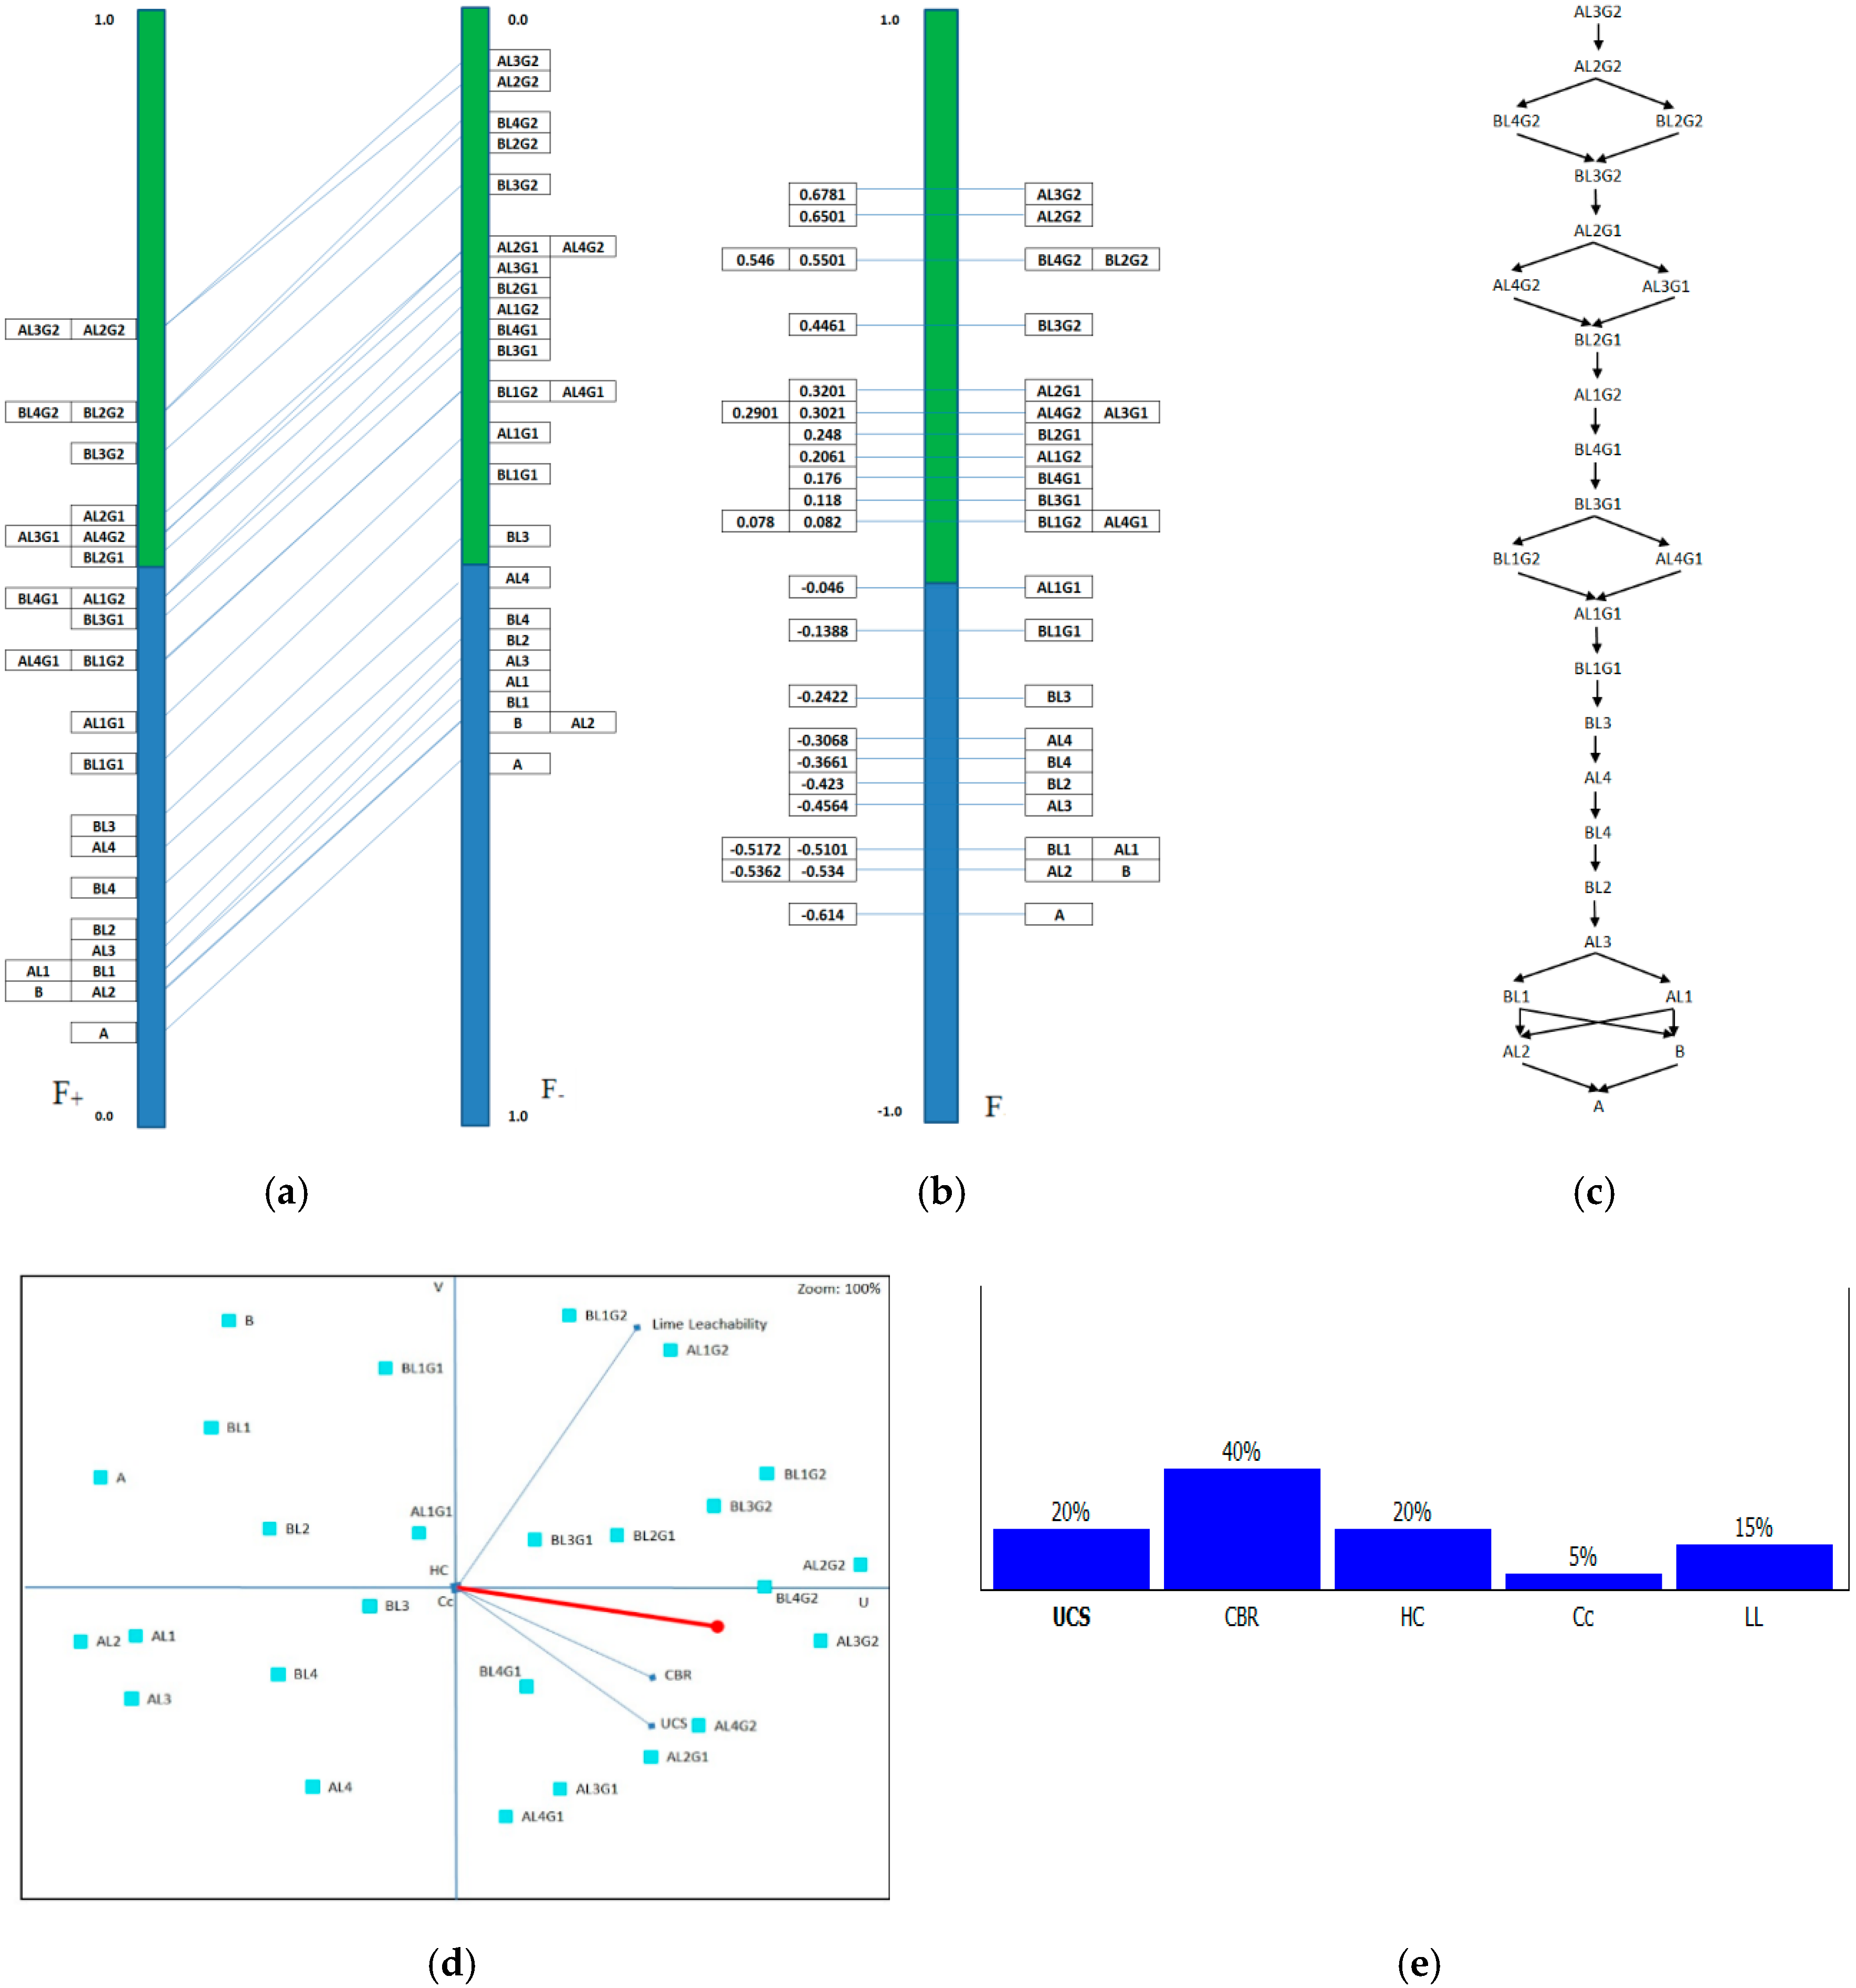
The sensitivity analysis was done relying on the assigned walking weights above (Set 2), using Visual PROMETHEE. The outcome of the sensitivity analysis for liner and pavement applications is presented in the following Figure 8 and Figure 9, respectively. Figure 8a–e represents the analysis corresponding to the ranking of treatment strategies, superiority of each treatment strategy, GAIA plane, and walking weights, respectively, for liner application. Based on the objectives of the response measures, shown in the above Table 6, a maximum of 40% weighting was set to response measure HC and a minimum of 0% to response measure CBR for this set. Hydraulic conductivity was considered a driving prerequisite for liner applications. Therefore, fly ash type A, treated with a 2.5% dosage of lime and 2.5% dosage of gypsum, was preferred over the alternatives (refer to Table 2). With regard to the lime-leachability values, both of the selected fly ashes responded alike to 1% lime content spiked with 2.5% gypsum. At higher lime contents, readily soluble amorphous lime, which is in excess to optimum lime requirements, simply leaches out of the fly ash-lime-gypsum matrix [22]. However, mix AL3G2 showed the maximum possible gain in unconfined compressive strength behavior. Similarly, Figure 9a–e represents the analyses corresponding to the ranking of treatment strategies, the superiority of each treatment strategy, graphical interactive plane, and walking weights, respectively, for pavement applications. In the case of pavement application (refer to Table 6), a maximum of 40% weighting and a minimum of 5% weighting was assigned to the response measures CBR and Cc, respectively. Mix AL3G2 satisfied the requirements for these conditions (refer to Table 2).

6. Conclusions

The present study investigated the effect of the addition of lime and/or gypsum on improving various geotechnical properties (Cc, HC, UCS, CBR, and LL) of Class F fly ashes. The objective was to assist practicing engineers in the selection of the most effective mix of fly ash type, lime, and gypsum dosage to satisfy various geotechnical properties for specific geotechnical applications. The MCDM model, based on PROMETHEE and GAIA, was adopted to select the best treatment strategy. Multiple treatment strategies were analyzed, based on variations in lime and gypsum dosages, and for each of these alternatives, response measures in the form of geotechnical properties were computed. This approach resulted in obtaining the treatment strategies ranking, superiority of each treatment strategy, and geometrical interactive plane. From these outcomes, it is evident that a group of treatment strategies exhibits similar preferences for given response measures. Thus, sensitivity analysis, based on walking weights, was executed to solve conflicts. In this study, untreated fly ash (A or B) and any fly ash type treated only with lime were found to be the least-preferred options. The proposed MCDM model, based on PROMETHEE and GAIA, works well to assist practicing engineers with identifying the fly ash type, with the appropriate mix of lime and gypsum. The following outcomes were established:
  • For liner applications, fly ash type A, treated with a 2.5% dosage of lime and 2.5% dosage of gypsum, is preferred.
  • For pavement applications, fly ash type A, treated with a 5% dosage of lime and a 2.5% dosage of gypsum, is preferred.
  • When equal walking weights were assigned to all response measures, irrespective of the nature of application, fly ash type A, treated with either a 2.5% or 5% dosage of lime and a 2.5% dosage of gypsum, should be the first choice.
In the eventuality of having fly ash B on-site, it should be treated with a 10% lime and 2.5% gypsum dosage for liner applications. Furthermore, treating it with a 2.5% lime and 2.5% gypsum dosage would meet the pavement application requirements.

Author Contributions

Conceptualization, A.A.B.M. and A.U.R.; methodology, A.A.B.M., A.U.R., and U.U.; formal analysis, A.A.B.M., A.U.R., K.V.V., and U.U.; investigation A.A.B.M., A.U.R., and K.V.V.; resources, A.A.B.M. and A.U.R.; writing—original draft preparation, A.A.B.M. and A.U.R.; writing—review and editing, A.A.B.M., A.U.R., K.V.V., and U.U.; supervision, A.A.B.M. and A.U.R.; funding acquisition, A.U.R. All authors have read and agreed to the published version of the manuscript.

Funding

Deanship of Scientific Research at King Saud University grant number-RG-1439-005.

Acknowledgments

The authors extend their appreciation to the Deanship of Scientific Research at King Saud University for funding this work through research group number RG-1439-005.

Conflicts of Interest

The authors declare no conflict of interest.

Appendix A. Example Calculation for AL3G2

  • Raj and Rbj are the performance measures for treatment strategies Ta and Tb, respectively;
  • Wj is the weight assigned to each performance measure j; and
  • Pabj is a preference function allocated to a pair of treatment strategies Ta and Tb for each j.
Thus, T11 (AL3G2) and T1 (A) denote the treatment strategies 11 and 1, respectively (refer Table 4); and there are five performance measures (i.e., j = 5). Thus, preference function value P11,1 for a pair of treatment strategies T11 and T1 is computed using Equation (1).
From Table 4, it is observed that for treatment strategies T11 and T1:
  • R11 1 = 6842 and R1 1 = 173.1 are the performance measures for j = 1;
  • R11 2 = 409.2 and R1 2 = 55.5 are the performance measures for j = 2;
  • R11 3 = 0.016 × 10⁻⁴ and R1 3 = 6.52 × 10⁻⁴ are the performance measures for j = 3;
  • R11 4 = 0.0023 and R1 4 = 0.0099 are the performance measures for j = 4;
  • R11 5 = 210 and R1 5 = 630 are the performance measures for j = 5, respectively.
V- shape preference function is allocated to the pair of treatment strategies T11 and T1 for each j; and Wj = 0.2 equal weight assigned to each j.
The value of P11 1 j can be interpreted as: P11 1 1 = one; P11 1 2 = one; P11 1 3 = zero; P11 1 4 ≈ one = 0.9905; and P11 1 5 = one. Thus, preference function value P11 1 for a pair of treatment strategies T11 and T1 is computed and is equal to 0.7981.
Similarly, P11 2 to P 11 26 is used to estimate outranking flow F+, expressed in Equation (2). Thus, the values are estimated as:
P11 2 = 0.7464; P11 3 = 0.7462; P11 4 = 7466; P11 5 = 7461; P11 6 = 0.7464; P11 7 = 0.5461; P11 8 = 0.6764; P11 9 = 0.3972; P11 10 = 0.7548; P11 12 = 0.7558; P11 13 = 0.5271; P11 14 = 0.5279; P11 15 = 0.5276; P11 16 = 0.5275; P11 17 = 0.5285; P11 18 = 0.5305; P11 19 = 0.3559; P11 20 = 0.2462; P11 21 = 0.3449; P11 22 = 0.2465; P11 23 = 0.2469; P11 24 = 0.2465; P11 25 = 0.7469; and P11 26 = 0.5495.
Therefore, the sum of all Pab (i.e., P11 1 to P11 26) for n = 26 is equal to 13.8125. Thus, the outranking flow F+, expressed using Equation (2): F+ = (1/(26 − 1)) × 13.8125 = 0.5525 for treatment strategy T11 (AL3G2).
Similarly, P1 11 to P 26, 11 estimated to estimate two outranking flow F-, expressed in Equation (3). The sum of all Pba (i.e., P1 11 to P26 11) for n = 26 is equal to 1.2. Thus, the outranking flow F- expressed as F = (1/(26 − 1)) × 1.2 = 0.048 for treatment strategy T11.
The complete outranking flow F11 is set as the balance between two outranking flows F+ and F, in reference to Equations (2) and (3); F11 is computed using Equation (4).
Thus, for treatment strategy T11, F1 is equal to (0.5525 − 0.048) = 0.5045 and this value can be seen in Figure 3 assigned to AL3G2.

References

  1. British Petroleum. Statistical Review of World Energy; Workbook, BP: London, UK, 2018. [Google Scholar]
  2. Cherian, C.; Siddiqua, S. Pulp and Paper Mill Fly Ash: A Review. Sustainability 2019, 11, 4394. [Google Scholar] [CrossRef] [Green Version]
  3. Ashfaq, M.; Heeralal, M.; Moghal, A.A.B. Characterization studies on coal gangue for sustainable geotechnics. Innov. Infrastruct. Solut. 2020, 5, 15. [Google Scholar] [CrossRef]
  4. Mehta, P.K. Influence of fly ash characteristics on the strength of portland-fly ash mixtures. Cem. Concr. Res. 1985, 15, 669–674. [Google Scholar] [CrossRef]
  5. Singh, S.R.; Panda, A.P. Utilization of fly ash in geotechnical construction. In Proceedings of the Indian Geotechnical Conference, Chennai, India, 14–16 December 1996; pp. 547–550. [Google Scholar]
  6. Palmer, B.G.; Edil, T.B.; Benson, C.H. Liners for waste containment constructed with class F and C fly ashes. J. Hazard. Mater. 2000, 76, 193–216. [Google Scholar] [CrossRef]
  7. Antiohos, S.; Tsimas, S. Activation of fly ash cementitious systems in the presence of quicklime: Part, I. Compressive strength and pozzolanic reaction rate. Cem. Concr. Res. 2004, 34, 769–779. [Google Scholar] [CrossRef]
  8. Kim, B.; Prezzi, M.; Salgado, R. Geotechnical Properties of Fly and Bottom Ash Mixtures for Use in Highway Embankments. J. Geotech. Geoenviron. Eng. 2005, 131, 914–924. [Google Scholar] [CrossRef]
  9. Kumar, A.; Walia, B.S.; Mohan, J. Compressive strength of fiber reinforced highly compressible clay. Constr. Build. Mater. 2006, 20, 1063–1068. [Google Scholar] [CrossRef]
  10. Sekhar, M.R.; Madhav, M.R.; Puppala, A.J.; Ghosh, A. Compressibility and Collapsibility Characteristics of Sedimented Fly Ash Beds. J. Mater. Civ. Eng. 2008, 20, 401–409. [Google Scholar] [CrossRef]
  11. Sivapullaiah, P.V.; Baig, M.A.A. Gypsum treated fly ash as a liner for waste disposal facilities. Waste Manag. 2011, 31, 359–369. [Google Scholar] [CrossRef] [PubMed]
  12. Moghal, A.A.B.; Sivapullaiah, P.V. Characterization of Lime and Gypsum Amended Class F Fly Ashes as Liner Materials. Geo Front. 2011, 1162–1171. [Google Scholar] [CrossRef]
  13. Moghal, A.A.B. A state-of-the-art review on the role of fly ashes in geotechnical and geoenvironmental applications. J. Mater. Civ. Eng. 2017, 29, 04017072. [Google Scholar] [CrossRef]
  14. Xu, P.; Zhao, Q.; Qiu, W.; Xue, Y.; Li, N. Microstructure and Strength of Alkali-Activated Bricks Containing Municipal Solid Waste Incineration (MSWI) Fly Ash Developed as Construction Materials. Sustainability 2019, 11, 1283. [Google Scholar] [CrossRef] [Green Version]
  15. DiGioia, A.M.; Nuzzo, W.L. Fly Ash as Structural Fill. J. Power Div. 1972, 98, 77–92. [Google Scholar]
  16. Edil, T.B.; Berthouex, P.M.; Vesperman, K.D. Fly Ash as a Potential Waste Liner; ASCE, Geotechnical Practice for Waste Disposal ’87, University of Michigan: Ann Arbor, MI, USA, 15–17 June 1987; pp. 447–461. [Google Scholar]
  17. Nhan, C.T.; Graydon, J.W.; Kirk, D.W. Utilizing coal fly ash as a landfill barrier material. Waste Manag. 1996, 16, 587–595. [Google Scholar] [CrossRef]
  18. Mollamahmutoğlu, M.; Yilmaz, Y. Potential use of fly ash and bentonite mixture as liner or cover at waste disposal areas. Environ. Earth Sci. 2001, 40, 1316–1324. [Google Scholar] [CrossRef]
  19. Rostami, H.; Brendley, W. Alkali Ash Material:  A Novel Fly Ash-Based Cement. Environ. Sci. Technol. 2003, 37, 3454–3457. [Google Scholar] [CrossRef]
  20. Zabielska-Adamska, K. Fly Ash as a Barrier Material. Geo Front. 2012, 947–956. [Google Scholar] [CrossRef]
  21. Moghal, A.A.B.; Sivapullaiah, P.V. Effect of Pozzolanic Reactivity on Compressibility Characteristics of Stabilised Low Lime Fly Ashes. Geotech. Geol. Eng. 2011, 29, 665–673. [Google Scholar] [CrossRef]
  22. Moghal, A.; Sivapullaiah, P. Role of lime leachability on the geotechnical behavior of fly ashes. Int. J. Geotech. Eng. 2012, 6, 43–51. [Google Scholar] [CrossRef]
  23. Sivapullaiah, P.V.; Moghal, A.A.B. CBR and strength behavior of class F fly ashes stabilized with lime and gypsum. Int. J. Geotech. Eng. 2011, 5, 121–130. [Google Scholar] [CrossRef]
  24. Ghosh, A.; Subbarao, C. Strength Characteristics of Class F Fly Ash Modified with Lime and Gypsum. J. Geotech. Geoenvironmental Eng. 2007, 133, 757–766. [Google Scholar] [CrossRef]
  25. Moghal, A.A.B. Geotechnical and Physico-Chemical Characterization of Low Lime Fly Ashes. Adv. Mater. Sci. Eng. 2013, 2013, 1–11. [Google Scholar] [CrossRef] [Green Version]
  26. Sivapullaiah, P.V.; Moghal, A.A.B. Role of Gypsum in the Strength Development of Fly Ashes with Lime. J. Mater. Civ. Eng. 2011, 23, 197–206. [Google Scholar] [CrossRef]
  27. Zavadskas, E.K.; Antuchevičienė, J.; Kapliński, O. Multi-criteria decision making in civil engineering: Part I—A state-of-the-art survey. Eng. Struct. Technol. 2015, 7, 103–113. [Google Scholar] [CrossRef]
  28. Zavadskas, E.K.; Antuchevičienė, J.; Kapliński, O. Multi-criteria decision making in civil engineering. Part II—Applications. Eng. Struct. Technol. 2015, 7, 151–167. [Google Scholar] [CrossRef]
  29. Rousta, B.A.; Araghinejad, S. Development of a Multi Criteria Decision Making Tool for a Water Resources Decision Support System. Water Resour. Manag. 2015, 29, 5713–5727. [Google Scholar] [CrossRef]
  30. Haralambopoulos, D.A.; Polatidis, H. Renewable energy projects: Structuring a multi-criteria group decision-making framework. Renew Energy 2003, 28, 961–973. [Google Scholar] [CrossRef]
  31. Fiorucci, P.; Minciardi, R.; Robba, M.; Sacile, R. Solid waste management in urban areas: Development and application of a decision support system. Resour. Conserv. Recycl. 2003, 37, 301–328. [Google Scholar] [CrossRef]
  32. Vego, G.; Kučar-Dragičević, S.; Koprivanac, N. Application of multi-criteria decision-making on strategic municipal solid waste management in Dalmatia, Croatia. Waste Manag. 2008, 28, 2192–2201. [Google Scholar] [CrossRef]
  33. Mardani, A.; Zavadskas, E.K.; Khalifah, Z.; Jusoh, A.; Md Nor, K. Multiple criteria decision-making techniques in transportation systems: A systematic review of the state of the art literature. Transport 2016, 31, 359–385. [Google Scholar] [CrossRef] [Green Version]
  34. Malindu, S.; Chamila, G.; David, L.; Guomin, Z.; Sujeeva, S.; Dennis, W. Sustainable criterion selection framework for green building materials—An optimisation based study of fly-ash Geopolymer concrete. Sustain. Mater. Technol. 2020, 25, e00178. [Google Scholar] [CrossRef]
  35. Xu, J.; Deng, Y.; Shi, Y.; Huang, Y. A bi-level optimization approach for sustainable development and carbon emissions reduction towards construction materials industry: A case study from China. Sustain. Cities Soc. 2020, 53, 101828. [Google Scholar] [CrossRef]
  36. Behzadian, M.; Kazemzadeh, R.B.; Albadvi, A.; Aghdasi, M. PROMETHEE: A comprehensive literature review on methodologies and applications. Eur. J. Oper. Res. 2010, 198–215. [Google Scholar] [CrossRef]
  37. Rehman, A.U.; Moghal, A.A.B. The Influence & Optimisation of Treatment Strategy in Enhancing Semi-Arid Soil Geotechnical Properties. Arab. J. Sci. Eng. 2018, 43, 5129–5141. [Google Scholar] [CrossRef]
  38. Moghal, A.A.B.; Rehman, A.U.; Chittoori, B. Optimizing Fiber Parameters Coupled with Chemical Treatment: Promethee Approach. In Proceedings of the Geotechnical Frontiers 2017: Geotechnical Materials, Modeling and Testing: Selected Papers from Sessions of Geotechnical Frontiers, Orlando, FL, USA, 12–15 March 2017; pp. 30–41. [Google Scholar] [CrossRef] [Green Version]
  39. ASTM D2166 A. Standard Test Method for Unconfined Compressive Strength of Cohesive Soil; ASTM: West Conshohocken, PA, USA, 2016. [Google Scholar]
  40. Indian Standards IS 2720-16: Methods of Test for Soils, Part 16: Laboratory Determination of CBR; Bureau of Indian Standards: New Delhi, India, 1987.
  41. D1883 A. Standard Test Method for California Bearing Ratio (CBR) of Laboratory-Compacted Soils; ASTM: West Conshohocken, PA, USA, 2016. [Google Scholar]
  42. D5856 A. Standard Test Method for Measurement of Hydraulic Conductivity of Porous Material Using a Rigid-Wall, Compaction-Mold Permeameter; ASTM International: West Conshohocken, PA, USA, 2015. [Google Scholar]
  43. Indian Standards IS 2720-15: Method of Test for Soils–Determination of Consolidation Properties; Bureau of Indian Standards: New Delhi, India, 1986.
  44. ASTM D2435 A Standard, Standard Test Methods for One-Dimensional Consolidation Properties of Soils Using Incremental Loading; ASTM International: West Conshohocken, PA, USA, 2004.
  45. Brans, J.P.; Mareschal, B. Promethee Methods. In Multiple Criteria Decision Analysis: State of the Art Surveys; Figueira, J., Greco, S., Ehrogott, M., Eds.; Springer: New York, NY, USA, 2005; Volume 200, pp. 163–186. [Google Scholar]
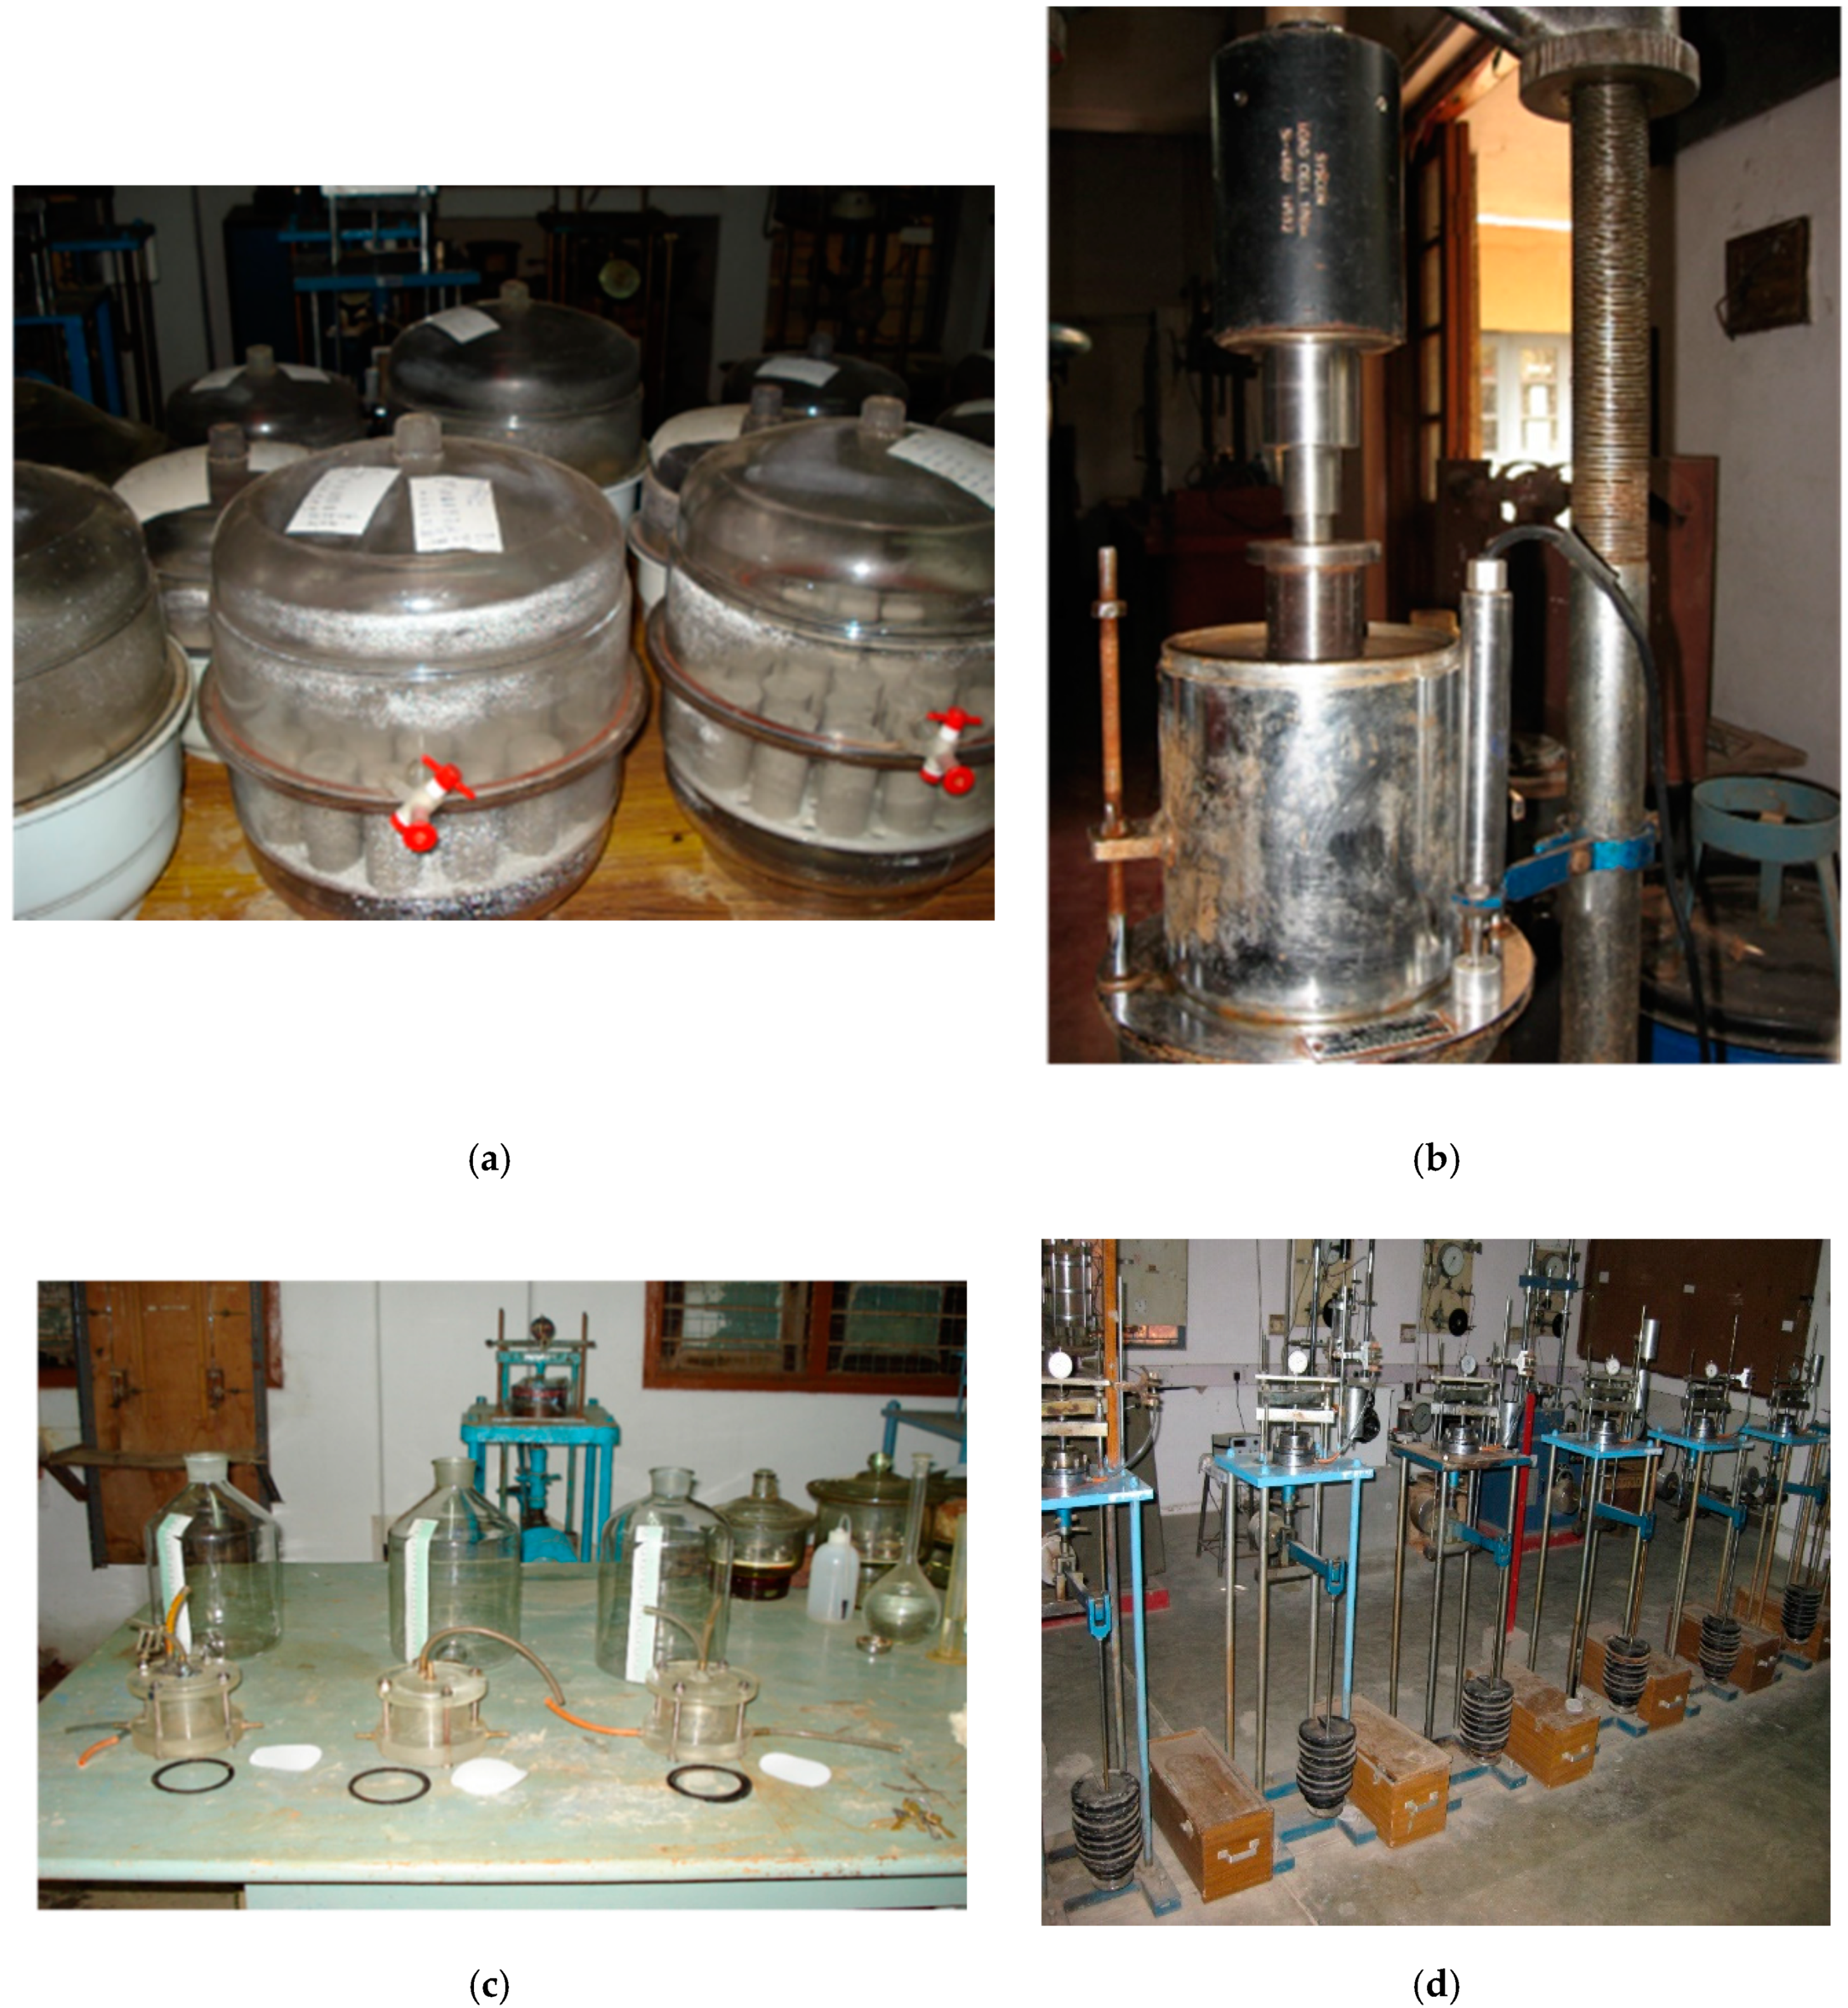
Figure 1. Details of the experimental test setup and specimen testing.; (a) Unconfined compression strength samples subjected to desiccator curing; (b) California bearing ratio test in progress; (c) Hydraulic conductivity test setup; (d) Consolidation test setup.
Sustainability 12 06649 g001
Figure 2. Preference Functions Pabj, based on Raj, Rbj, ϴ, and Ø.
Sustainability 12 06649 g002
Figure 3. Treatment strategies (partial ranking) based on F+ and F.
Sustainability 12 06649 g003
Figure 4. Treatment strategies (final ranking) based on flow F.
Sustainability 12 06649 g004
Figure 5. Preference network diagram based on the PROMETHEE approach.
Sustainability 12 06649 g005
Figure 6. Geometrical analysis based on the interactive aid (GAIA) plane.
Sustainability 12 06649 g006
Figure 7. The equal weight allocation for all response measures.
Sustainability 12 06649 g007
Figure 8. Response measure weight allocation for walking weight Set 2 for the liner application of fly ash: (a) Partial ranking of treatment strategies based on F+ and F; (b) Complete ranking of treatment strategies based on outranking flow F; (c) Preference network diagram based on the PROMETHEE approach; (d) Geometrical analysis for the interactive aid (GAIA) plane; and (e) Weight allocation for all response measures (refer to Table 6).
Sustainability 12 06649 g008
Figure 9. Response measure weight allocation for walking weight Set 2 for the pavement application of fly ash: (a) Partial ranking of treatment strategies based on F+ and F−; (b) Complete ranking of treatment strategies based on outranking flow F; (c) Preference network diagram based on the PROMETHEE approach; (d) Geometrical analysis for the interactive aid (GAIA) plane; and (e) Weight allocation for all response measures (refer to Table 6).
Sustainability 12 06649 g009
Table 1. Summary of the geotechnical properties of fly ashes and fly-ash-amended composites.
Type of Fly Ash and Properties Studied Potential Sustainable ApplicationsReference
Fly ash compacted under controlled test conditions indicated an increase in Φ from 30° to 40° (from DST and Triaxial shear test). Average Cc was 0.2.Satisfied embankment-fill material criteria.DiGioia and Nuzzo [15]
Class C fly ash and sand mixtures; 10% bentonite; HC increased by a factor of 1000.Satisfied liner material criteria for hazardous waste.Edil et al. [16]
Coal fly ash with lime dust and bentonite (7:2:1 ratio) decreased HC by a factor of 1000, compared to fly ash alone. Migration of heavy metals (Pb, Zn, and Fe) was estimated to be less than 0.10 m (under MSW landfill conditions) over 15 years of service. Satisfied landfill-barrier material criteria Nhan et al. [17]
Class C fly ash (20% by weight) with Class F fly ash reduced HC value by a factor of 100. Durability studies revealed HC value increased by a factor between 2 and 3 for wetting and drying cycles. Satisfied the requirements of liner for waste-containment facilities. Palmer et al. [6]
The average HC values of Class F fly ash with 30% bentonite reduced by a factor of 10,000. Significant increase in Φ (33° to 42°) and C (36 to 54 kN/m2) from a Triaxial shear test (CU) was observed. Satisfied the requirements of liner and cover materials for waste-disposal sites. Mollamahmutoğlu and Yilmaz [18]
UCS increased by a factor of 2.2 for alkali-activated Class F fly ash. Percentage weight loss decreased by a factor of 5, compared to PCC subjected to acid immersion (at specified curing periods). Satisfied the requirement of PCC used for construction purpose.Rostami and Brendley [19]
The HC value of Class F and bottom ashes decreased by a factor of 10 with an increase in Class F fly ash content. Satisfied the requirements of highway-embankment material. Kim et al. [8]
The Cc of sedimented class F fly ash deposits was relatively higher (by 3%) when compared to compacted conditions. Satisfied the requirements of sub-base material and lightweight infrastructure. Sekhar et al. [10]
With an increase in compaction energy, HC values of Class F fly ash decreased by a factor of 1000. At each compaction energy, a higher CBR value was observed for a water content equal to or slightly less than OMC. Satisfied the requirements of barrier material for landfill applications. Zabielska-Adamska [20]
The HC values of Class F fly ashes reduced by a factor of 1000 and the Cc value was reduced by a factor between 6 and 10 due to the addition of lime (at 10%) and gypsum (at 2.5%). Satisfied the liner material requirements. Moghal and Sivapullaiah [21]; Moghal and Sivapullaiah [22]
UCS values and the CBR of Class F fly ashes increased by a factor of 20 and 7.5, respectively, due to the addition of lime (at 2.5%) and gypsum (at 2.5%). Satisfied the requirements of sub-base material in road construction. Sivapullaiah and Moghal [23]
Note: In above Table 1, Φ: Angle of internal friction; DST: Direct shear test; Cc: Compression index; MSW: Municipal solid waste; C: Cohesion; HC: Hydraulic conductivity; OMC: Optimum moisture content; CU: Consolidated undrained test; PCC: Portland cement concrete; CBR: California bearing ratio; UCS: Unconfined compressive strength.
Table 2. Factors, levels, their objectives, notations, and treatment strategies adopted in the study.
FactorLevelsSelected Alternative Treatment Strategies for Different Factors and Their Corresponding Levels
Fly Ash TypeABAAL1AL2AL3AL4
Lime Dosage (%)L1L2L3L4AL1G1AL1G1AL2G1AL2G2AL3G1
Gypsum Dosage (%)G1 G2 AL3G2AL4G1AL4G2
ObjectiveLiner
Application
Pavement
Application
BBL1BL2BL3BL4
Response measures (Units)BL1G1BL1G1BL2G1BL2G2BL3G1
UCS (kPa)MaximizeMaximizeBL3G2BL4G1BL4G2
CBR (%)MaximizeMaximize
HC (cm/sec)MinimizeMaximize
Cc (kPa)MinimizeMinimize
LL (ppm)MinimizeMinimize
Note: In Above Table 2, UCS: Unconfined compression strength; CBR: California bearing ratio; Cc: Coefficient of Compressibility; HC: Hydraulic conductivity; LL: Lime leachability; A: Fly ash A; B: Fly ash B; L1, L2, L3, and L4 represent lime dosage at 1%, 2.5%, 5%, and 10%, respectively; G1 and G2 represent gypsum percentage of 1 and 2.5, respectively. For example, AL1G1 represents fly ash type A treated with lime dosage at 1% and gypsum dosage of 1%.
Table 3. Constituents of selected fly ashes.
Constituent% Based on Fly Ash TypeConstituent% Based on Fly Ash Type
ABAB
Sodium (Na2O)0.180.19Calcium (CaO)9.003.62
Potassium (K2O)0.210.27Ferric (Fe2O3)16.616.28
Titanium (TiO2)0.260.31Alumina (Al2O3)18.8127.65
Magnesium (MgO)1.410.34Silica (SiO2)50.9756.88
Loss on ignition2.554.46
Table 4. Multi-criteria response measures for each treatment strategy.
Strategy No.Treatment Strategy “j” Response Measures
UCS (kPa)CBR (%)HC (cm/s) × 10−4Cc (kPa)LL (ppm)
1A173.155.56.520.0099630
2AL1790.358.51.570.0082790
3AL2532631.220.0082860
4AL3689.379.30.690.0087910
5AL4128780.70.540.0071010
6AL1G11796.388.10.970.0055360
7AL1G22408120.20.610.004370
8AL2G145002180.0960.004440
9AL2G25181360.60.080.0038130
10AL3G13192276.40.020.0034510
11AL3G26842409.20.0160.0023210
12AL4G14137.5128.50.00110.0049650
13AL4G264351800.00070.0023370
14B391.643.74.960.0156270
15BL1765.247.43.810.0128390
16BL290557.91.010.0129480
17BL379487.12.010.0136610
18BL4119372.50.910.0109770
19BL1G1111280.70.970.0086260
20BL1G21204.71170.890.006680
21BL2G12204.3211.20.240.0063270
22BL2G23496.3320.70.10.0059110
23BL3G11950145.50.0670.0052330
24BL3G23790.4238.90.0280.0036160
25BL4G12642188.30.00210.0076440
26BL4G24987.3319.20.00010.0036180
Table 5. Treatment strategies and their ranking based on outranking flows.
RankTreatment
Strategy Due to Factor Combination
Outranking FlowRankTreatment
Strategy Due to Factor Combination
Outranking Flow
FF+FFF+F
1AL3G20.50450.55250.048014AL4G10.02420.31230.2880
2AL2G20.50440.55240.048015AL1G1−0.01180.29220.3041
3BL4G20.42640.51240.086016BL1G1−0.05060.26970.3203
4BL2G20.42210.51020.088117BL3−0.22870.18400.4127
5BL3G20.36040.48040.120018AL4−0.29040.14980.4401
6AL4G20.24850.42450.176019BL2−0.29100.15200.4430
7AL1G20.24830.42430.176020BL4-0.29640.15210.4484
8AL2G10.20830.40040.192021B−0.32090.13600.4569
9BL2G10.17610.38420.208122BL1−0.32860.13600.4646
10AL3G10.13640.36840.232023AL1−0.41370.09050.5042
11BL1G20.13610.36820.232124AL3−0.41940.08810.5075
12BL4G10.09600.34410.248225AL2−0.45610.07210.5282
13BL3G10.08820.34430.256126A−0.47230.06410.5364
Table 6. Criterion weights allocated for sensitivity analysis.
Criterion WeightUCS (%)CBR (%)HC (%) Cc (%)LL (%)
For liner applications ObjectiveMaxMaxMinMinMin
Set 1 *0.20.20.20.20.2
Set 20.30.00.40.10.2
For pavement application ObjectiveMaxMaxMaxMinMin
Set 1 *0.20.20.20.20.2
Set 20.20.40.20.050.15
Note: * Figure 3, Figure 4, Figure 5 and Figure 6 represent analyses executed, based on Set 1 weight allocation.