Towards Sustainable Collaborative Logistics Using Specialist Planning Algorithms and a Gain-Sharing Business Model: A UK Case Study


Abstract
1. Introduction
2. Background
2.1. Collaboration in Freight Logistics
2.1.1. Collaboration: Forms and Strategies
- Vertical collaboration, which concerns two or more organisations at different levels of the logistics chain.
- Horizontal collaboration, which concerns two or more competing organisations at the same level of the logistics network.
- Multilateral collaboration, which combines and sharing capabilities both vertically and horizontally.
- Centralised, involving decision-making at a common higher level by generating synchronized instructions at lower levels
- Decentralised, implying a consensus, agreement of objectives, indicators and equality rules between partners. This collaboration is usually achieved through communication and negotiation between the partners.
2.1.2. Collaboration: Barriers and Enablers
2.2. ICT to Support Sequence-Level Collaboration in Freight Logistics
3. Gain-Sharing Business Model
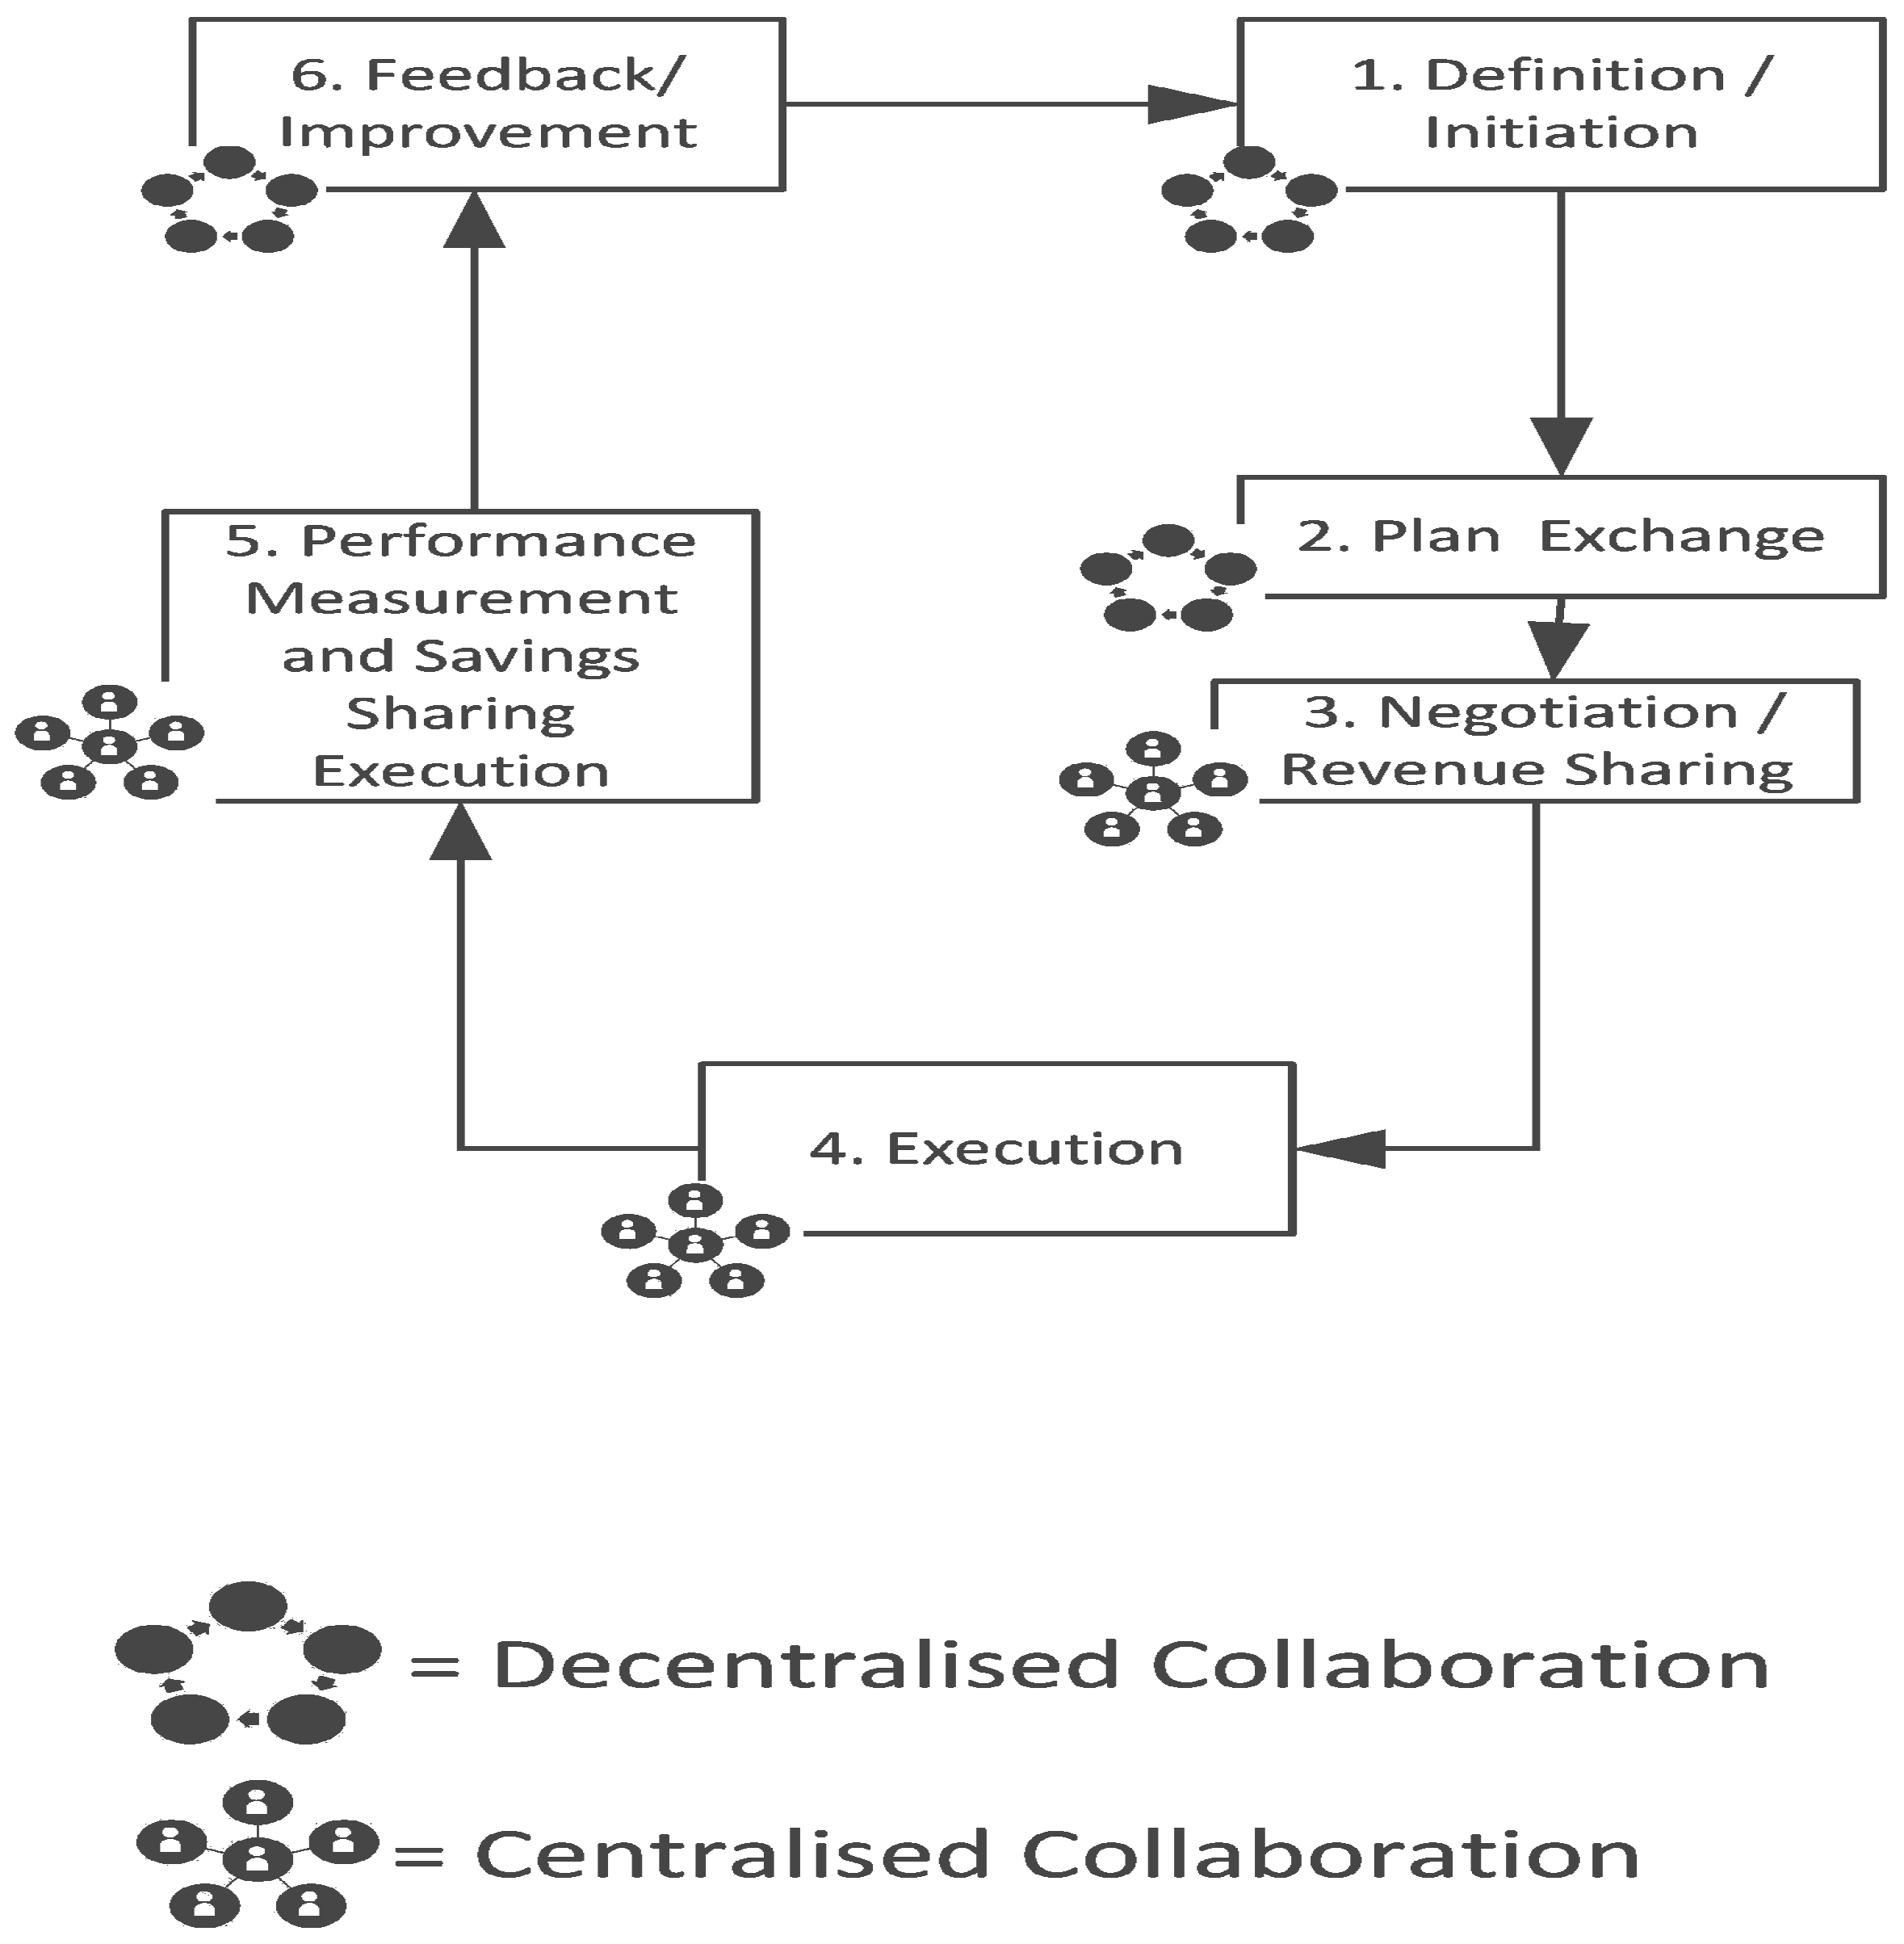
3.1. Definition of the Collaboration Process Using a Combined Coordination Structure
3.2. Overcoming Barriers and Boosting Enablers for Collaboration
- Implementing the use of a neutral trustee (28) to facilitate the collaboration process between competitors by managing and coordinating day to day operations, and to ensure the confidentiality of the members’ structured data [27] and compliance with competition law [16,23,24,25,26]. The barriers covered by these implementations are: (D), (E), (F), (G) and (J).
- Defining contractual agreements where partners negotiate to establish confidentiality policies, service level agreements, performance failure penalties, payment conditions, the coordination structure, the management of unexpected events and contract duration [11,16,24,28], fair mechanisms for the allocation of collaboration revenues [11,16,24,28], building trust and the setting of common goals [11,16]. The barriers covered by these implementations are: (B), (C), (H), (I) and (M).
- Raising awareness of the potential benefits of being part of the collaborative ecosystem (29) by creating, for instance, a virtualisation tool that allows interested parties to engage from the beginning. The barriers covered by these implementations are: (A) and (L).
- Issuing personal invitations to attend workshops and clinics to validate the virtualisation tool and provide feedback related to the proposed processes, especially to those stakeholders that the consortium has had previous experiences of collaboration [23,26]. The enablers covered by these implementations are: (C), (D), (E) and (G).
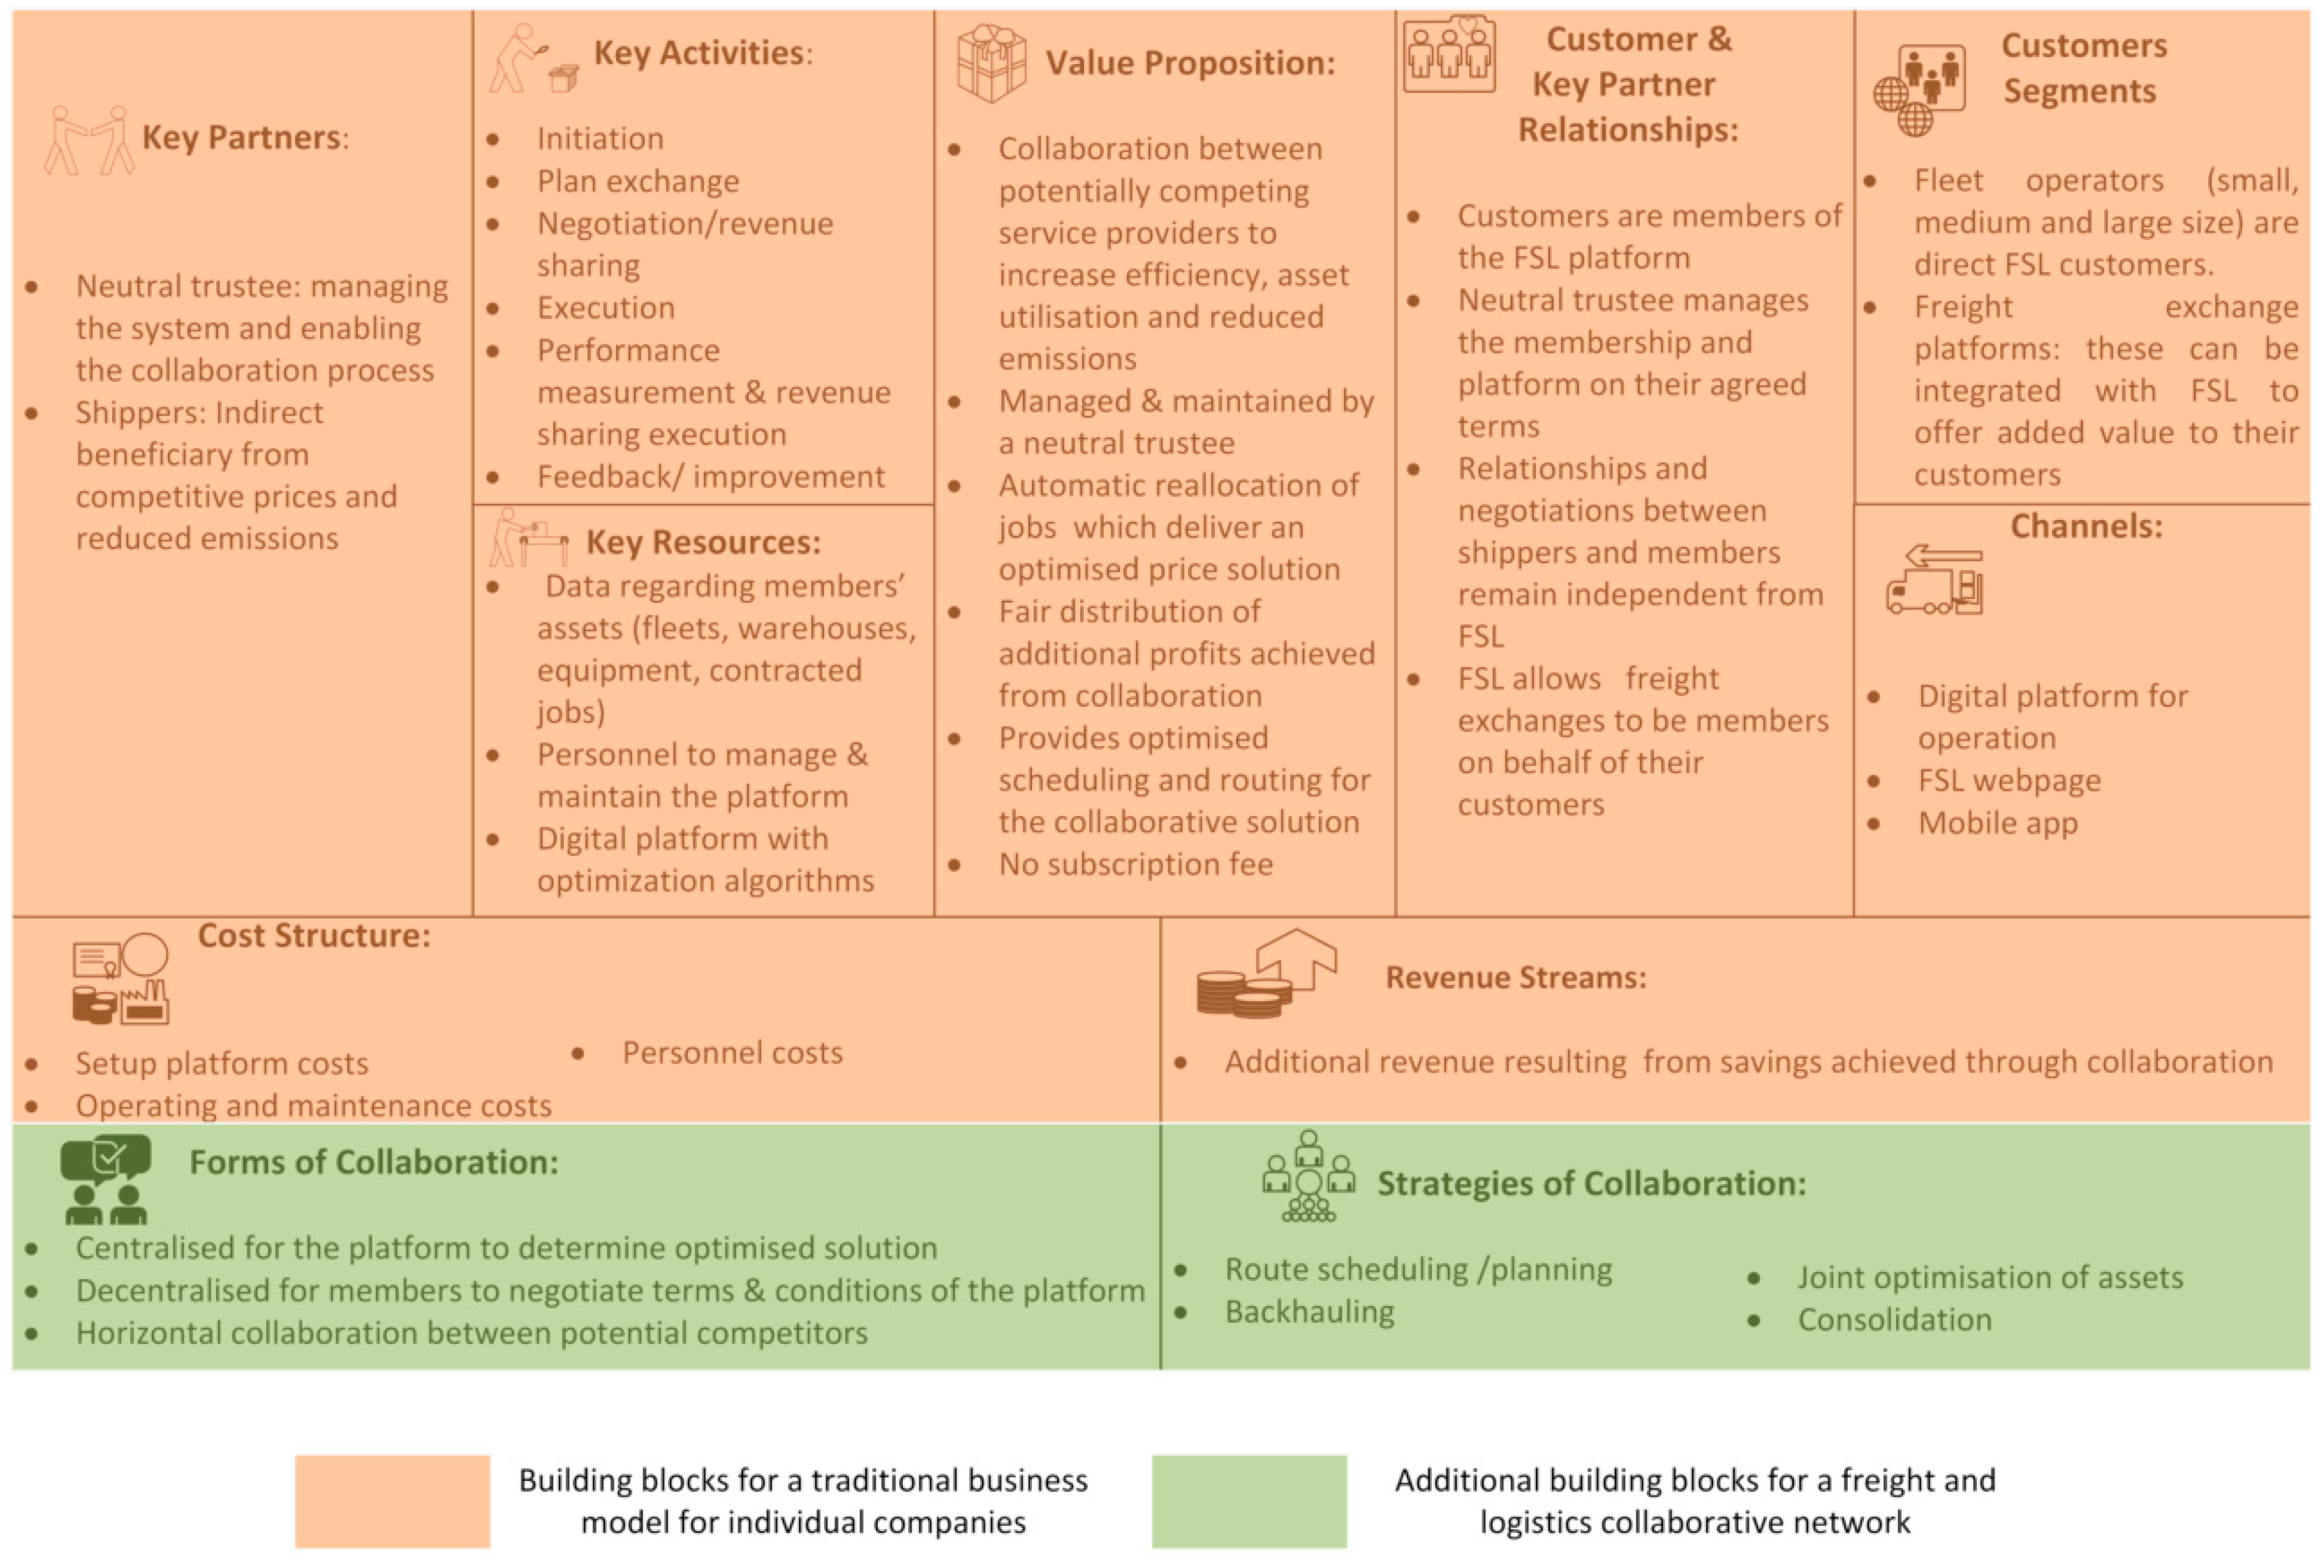
3.3. Definition of the Gain-Sharing Business Model
4. Special Planning Algorithms for Logistics Collaboration
- Vehicles that the member wishes to make available to the platform
- Jobs that the member wishes to have processed by the platform.
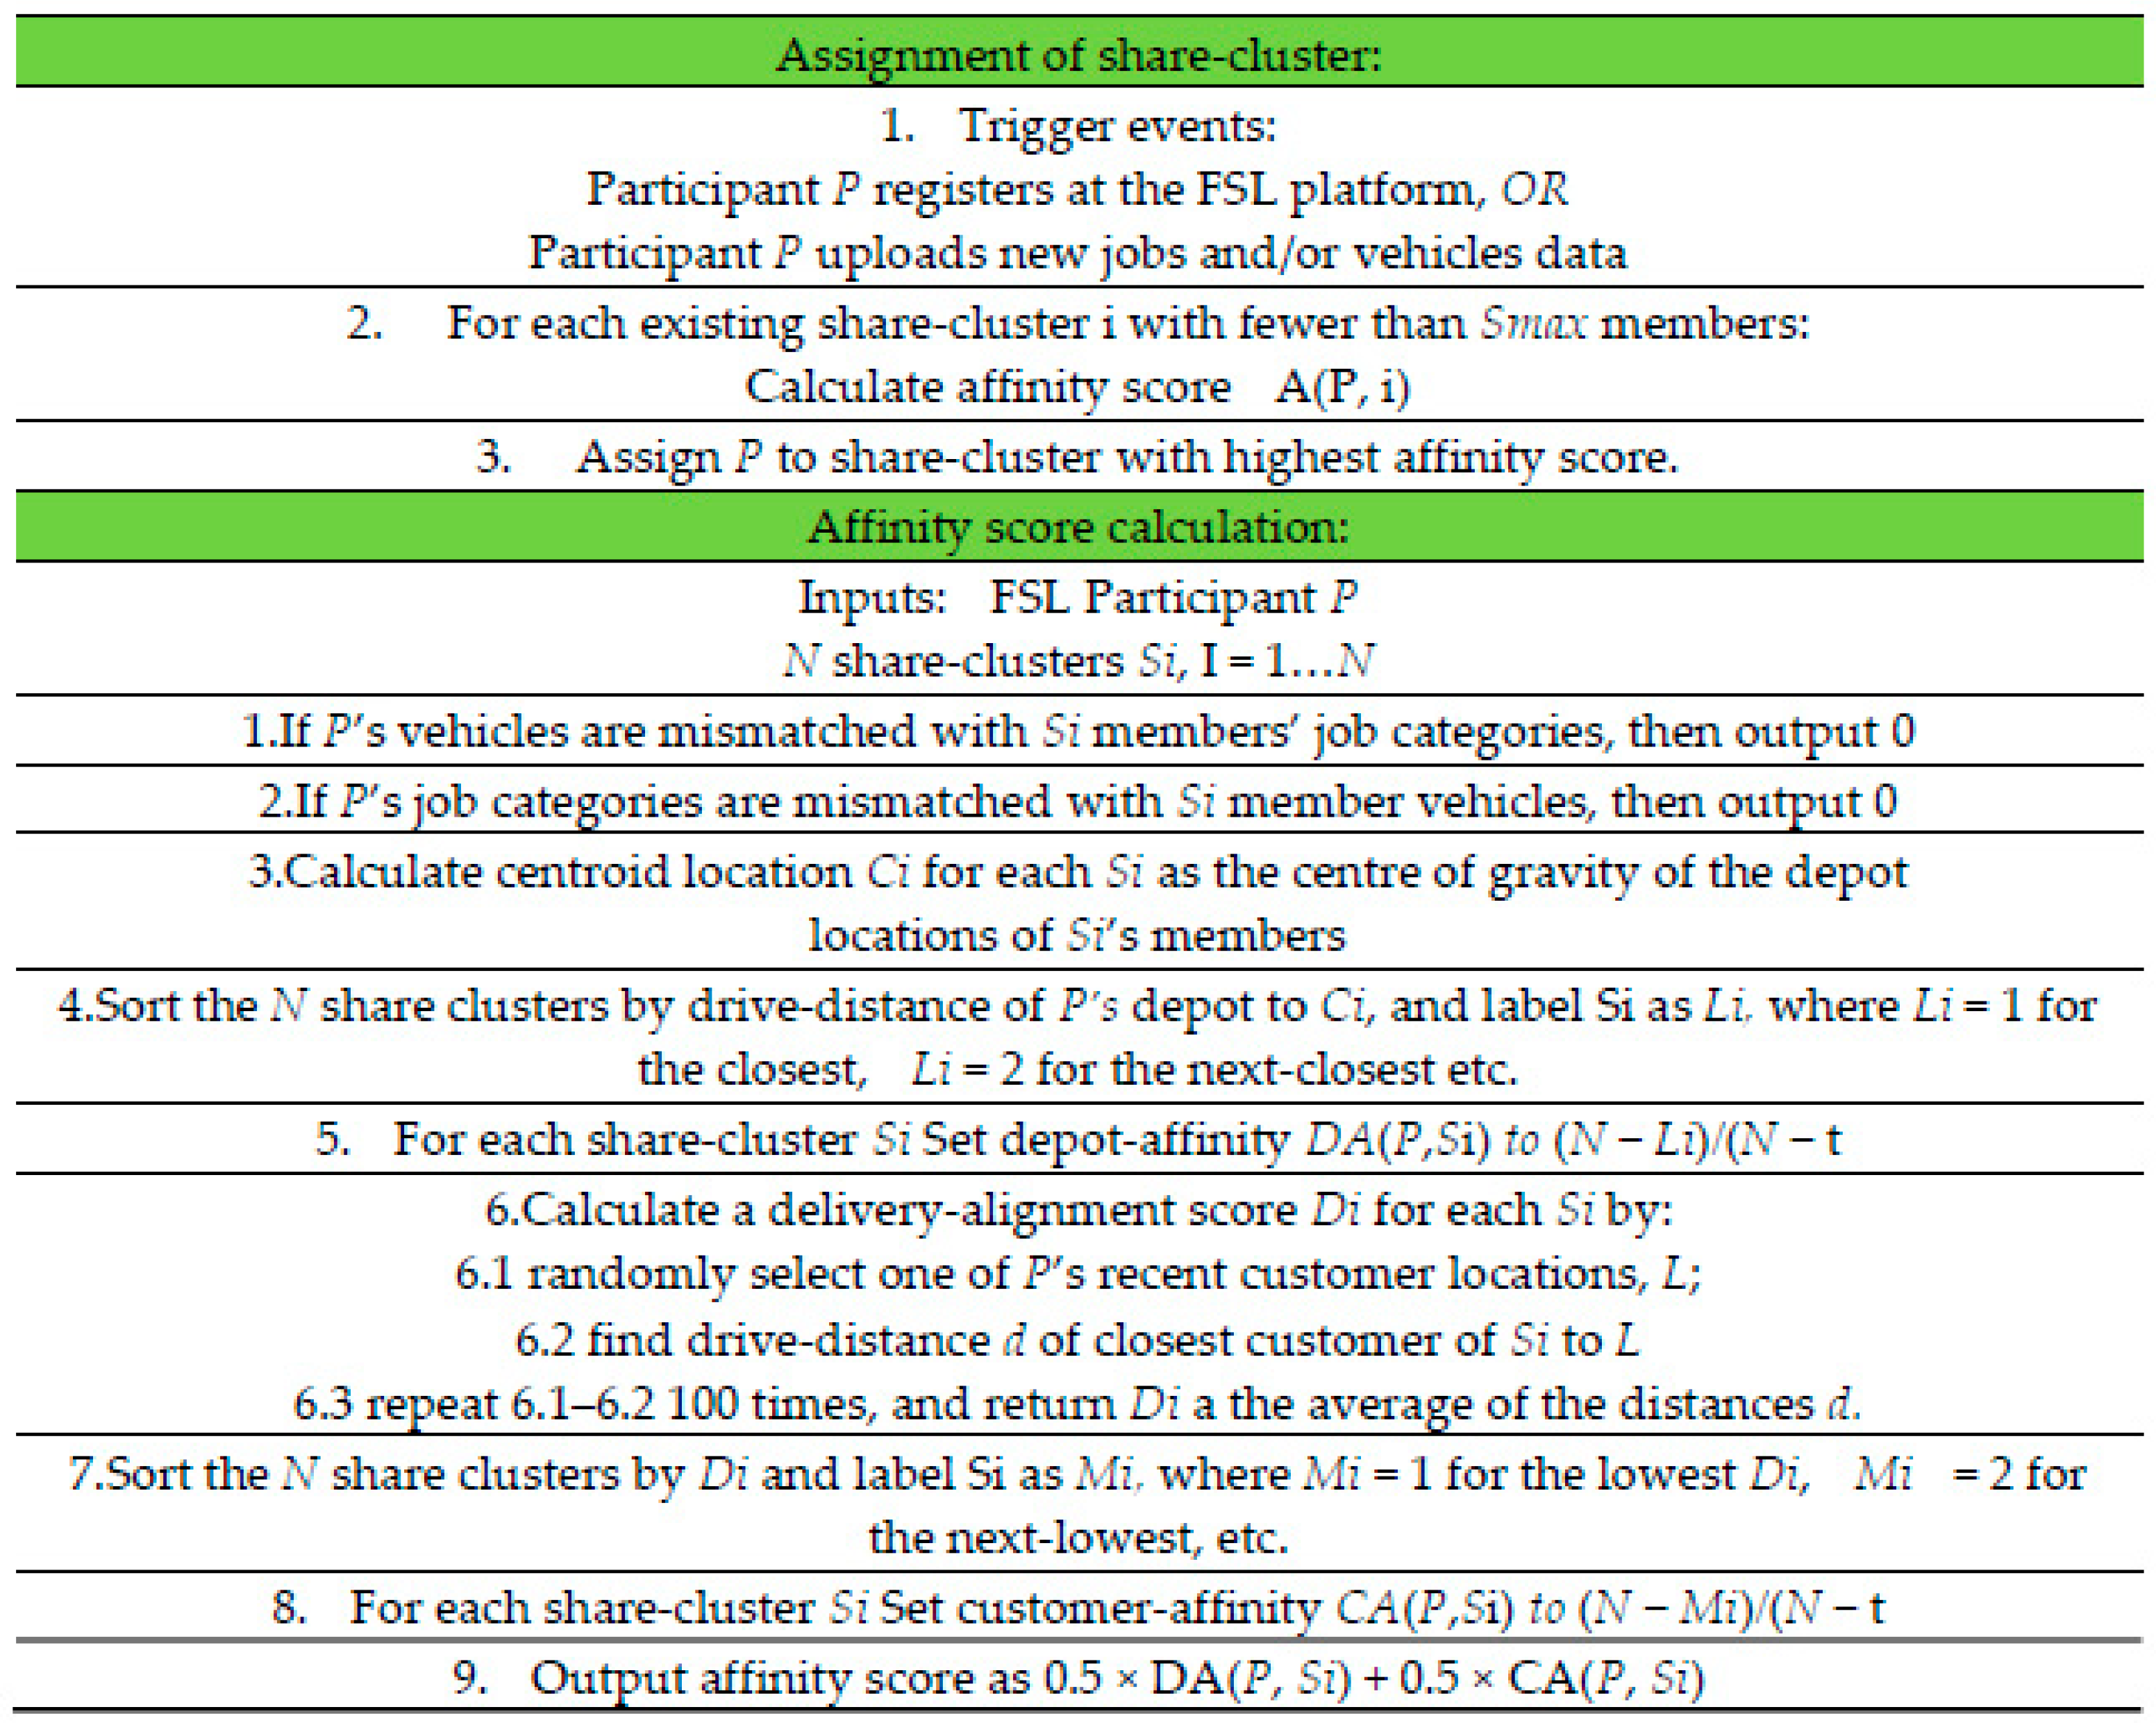
4.1. Share-Cluster Assignment Algorithm
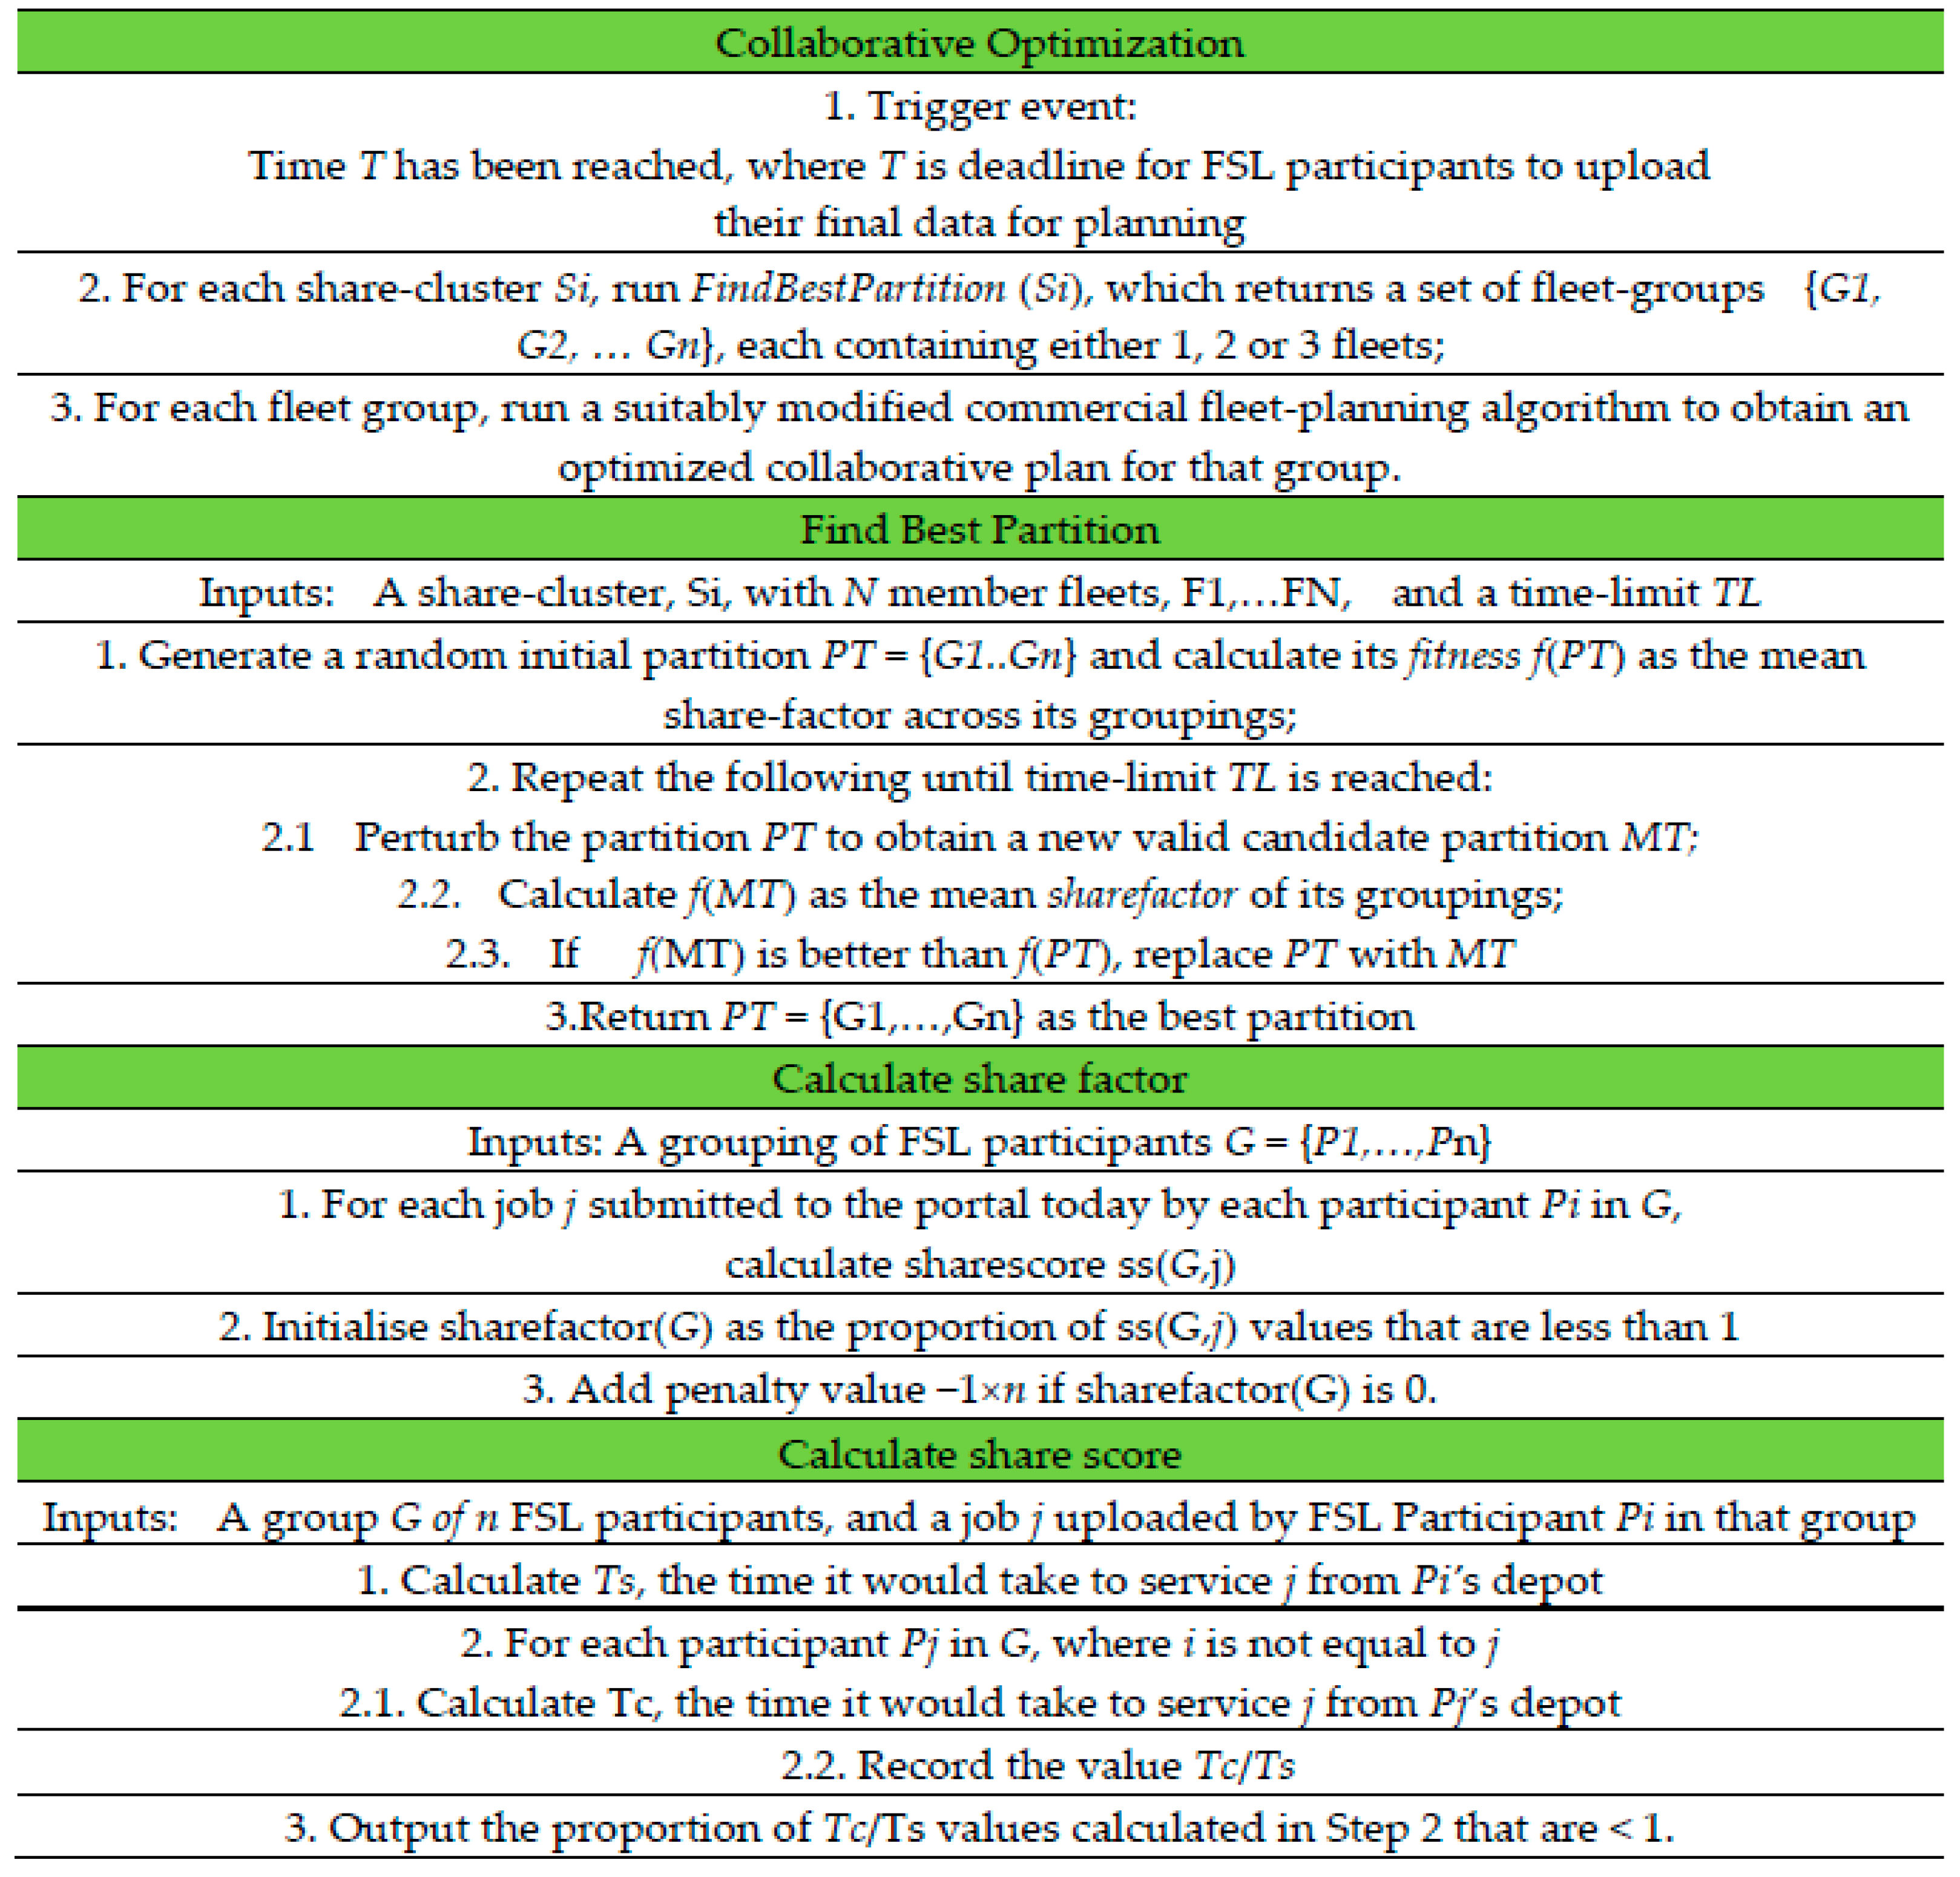
4.2. Collaborative Optimization Algorithm
- Costs: Cost-per-mile, potentially different for different vehicles; driver cost-per-hour (including any overtime); a fixed cost per vehicle; an ‘Opportunity Cost’ of not delivering a job, commonly supplied by users of fleet optimisation software which can be considered a penalty fee for a fulfilment failure.
- Times and associated constraints: driver shift times and working time constraints; time windows for pickup and delivery of each job; service times for pickup and delivery of each job; driver briefing time; realistic times for every journey and vehicle type.
- Capacity issues: weight and volume capacity of each vehicle, weight and volume of each job, ensuring vehicles are never overloaded.
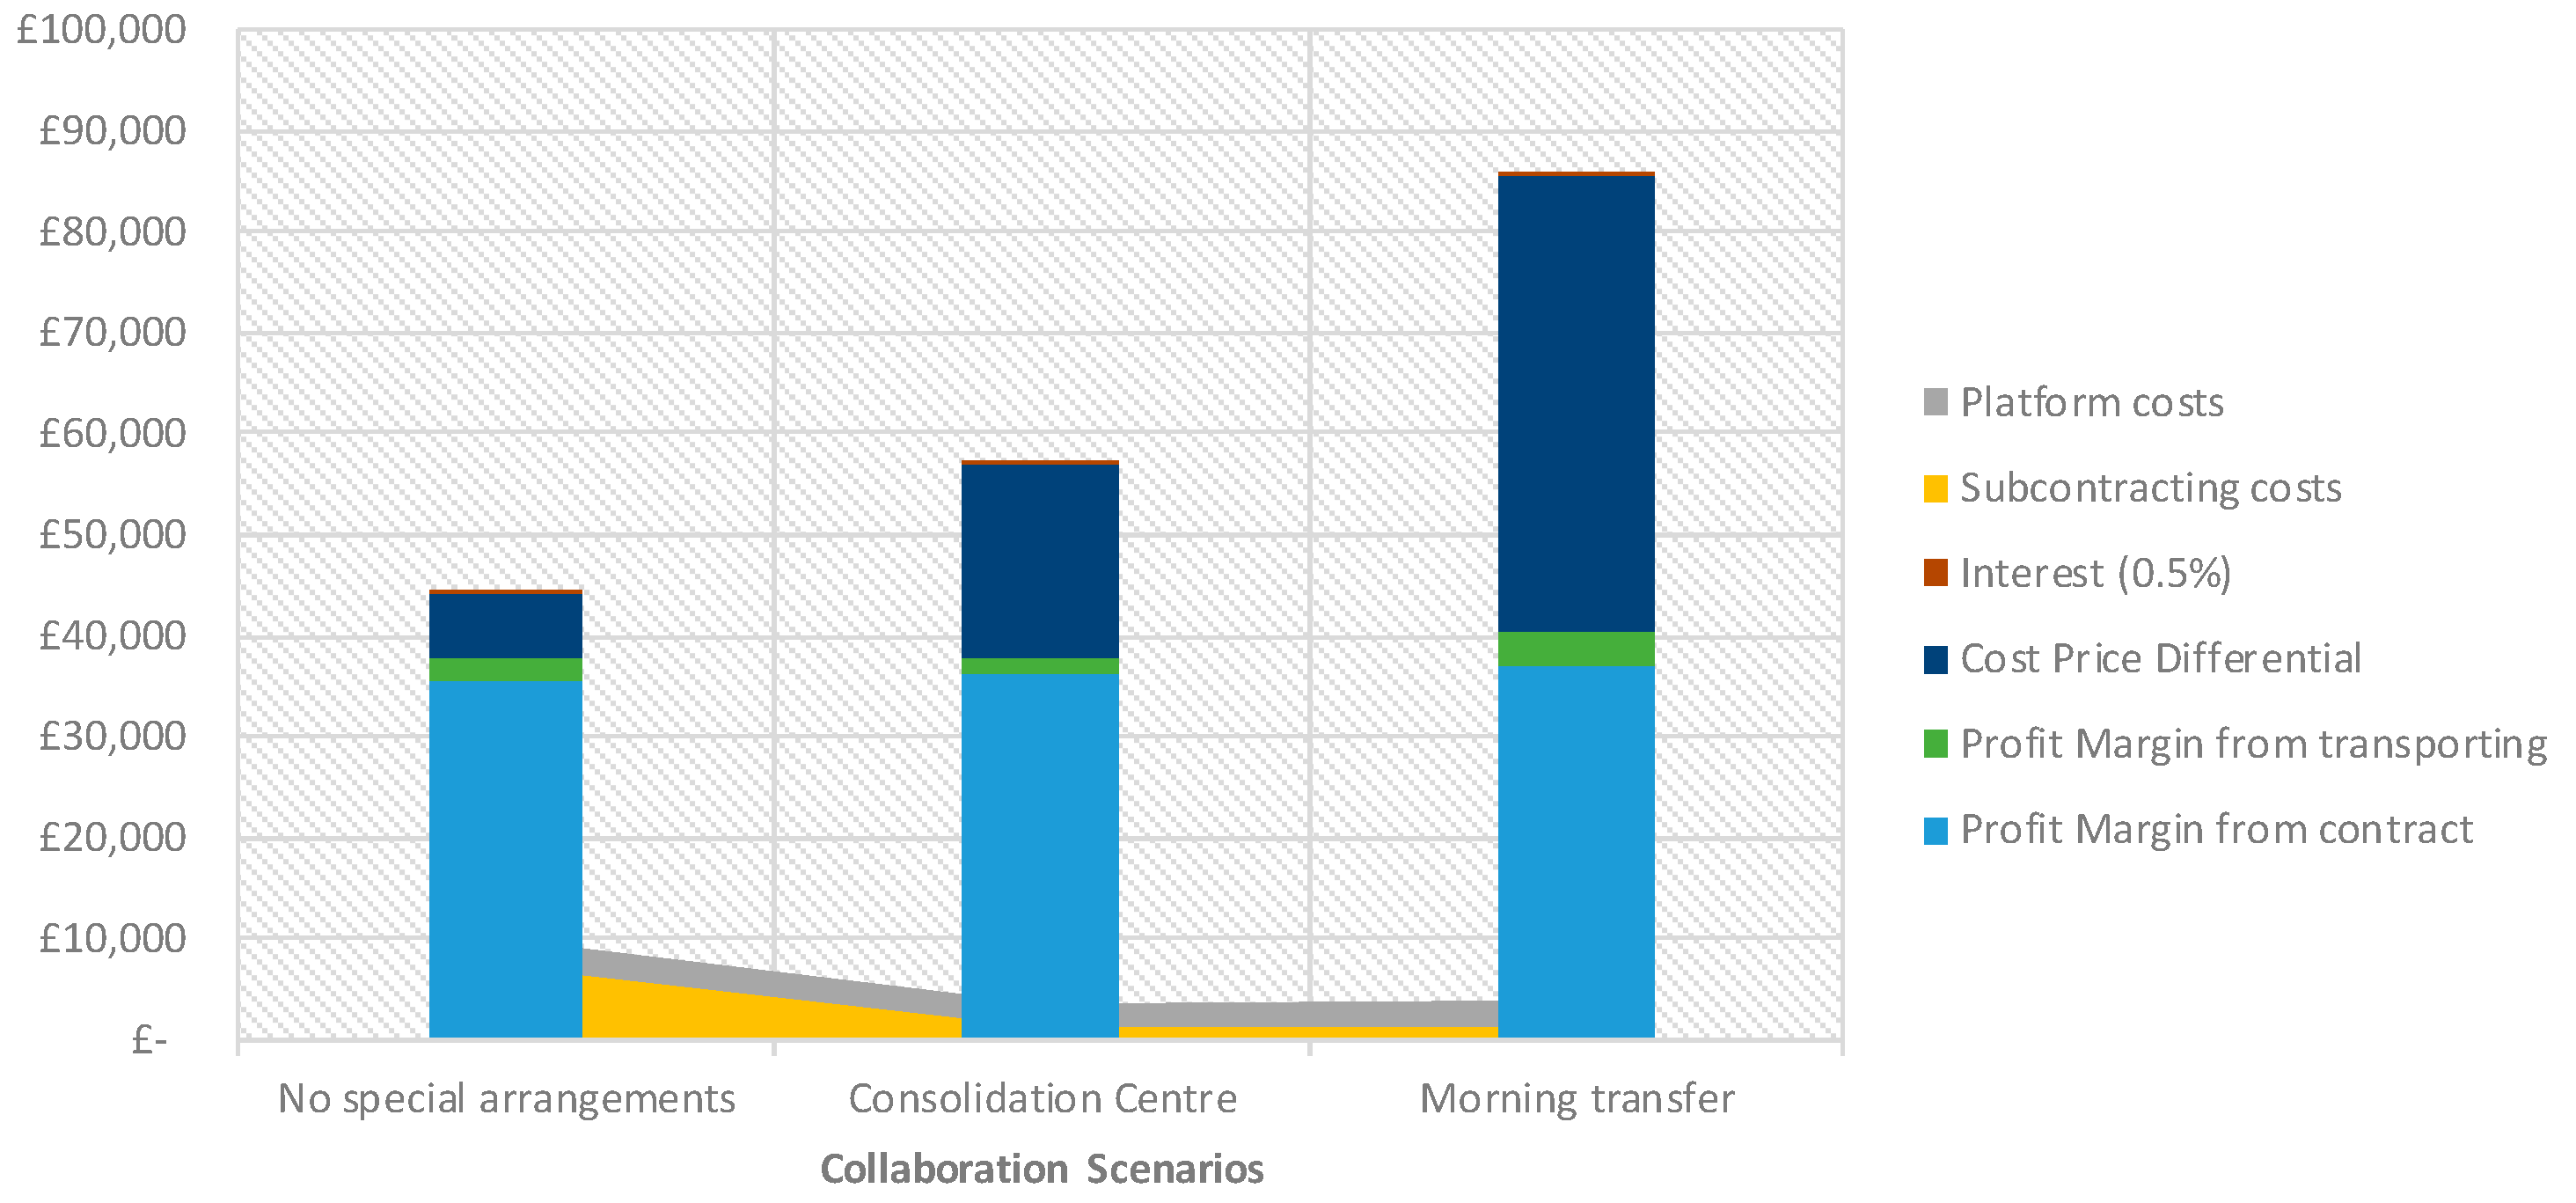
4.3. Sharing Scenarios
4.4. Validation
4.4.1. Efficiencies Achieved
4.4.2. Wider Socio-Economic and Environmental Benefits
5. Integration of the Gain-Sharing Business Model with the FSLP Algorithms
6. UK Case Study
6.1. Methods
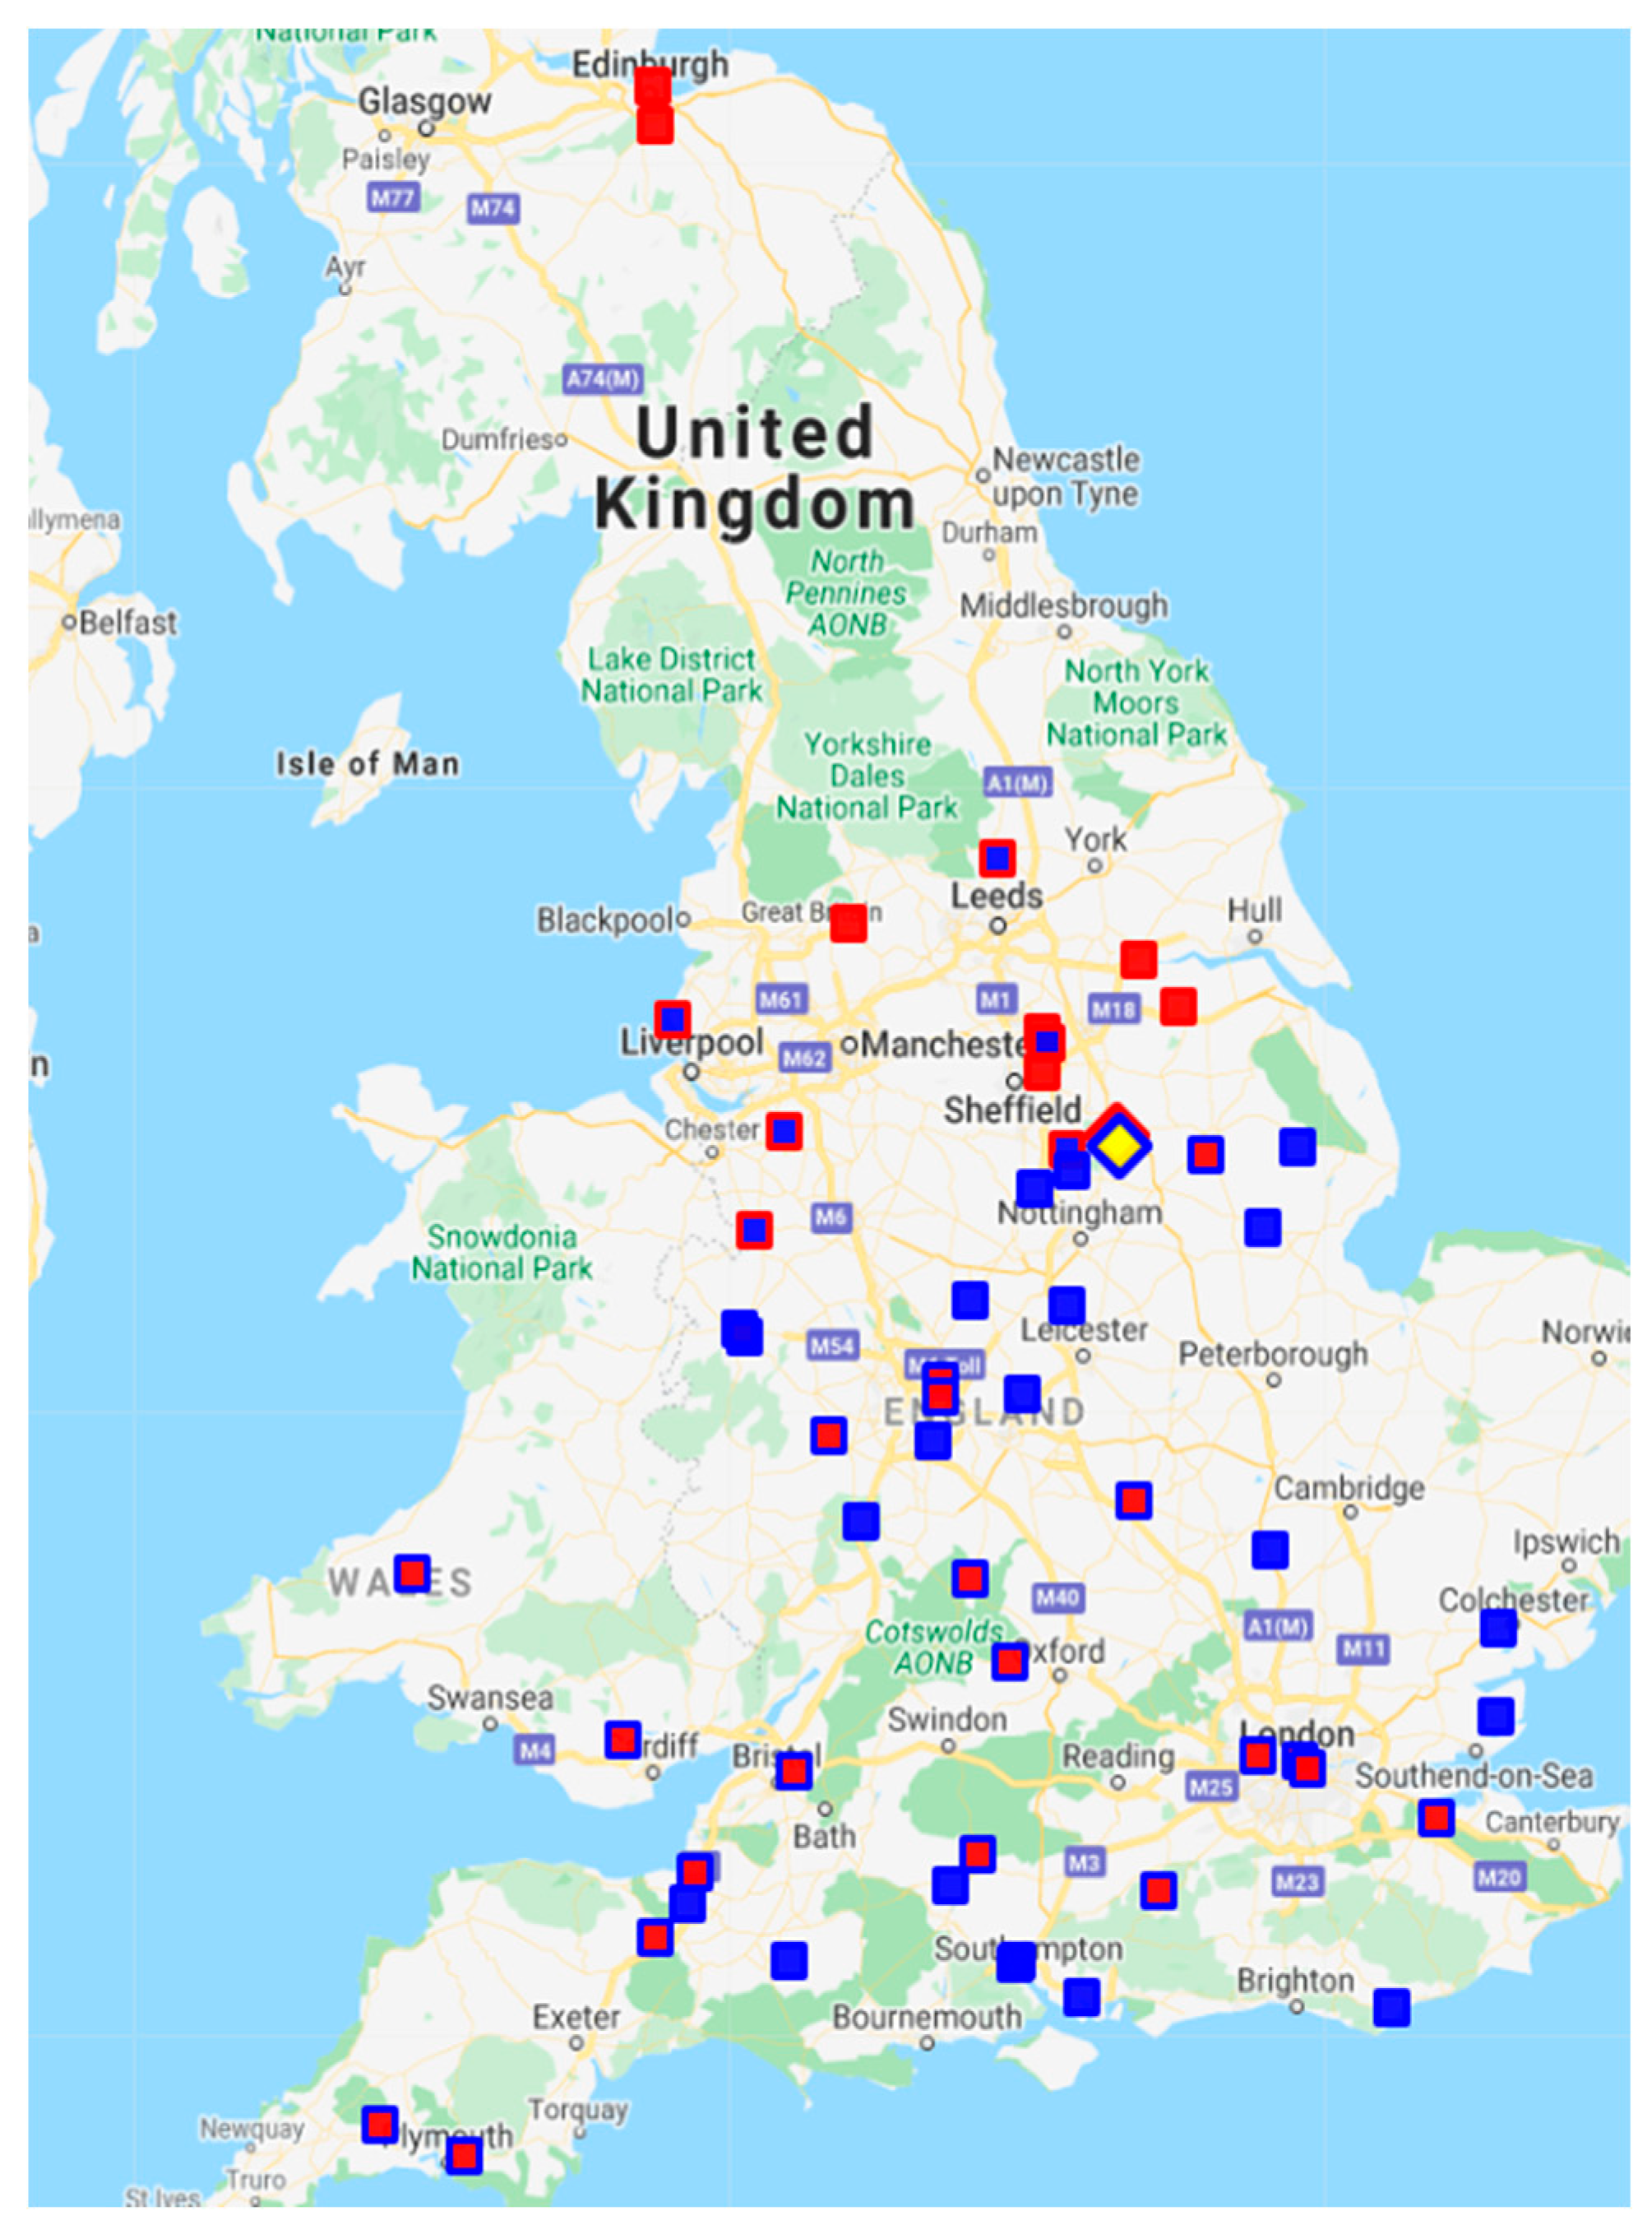
- To simulate the upload of the other fleets’ data, anonymised data from 400 realistic HGV fleets were sampled from a commercially owned historic database of fleet data across the UK. This represented a scenario where a modest ~0.5% of operators used the FSLP.
- A Fleet X depot was arbitrarily chosen, and fleet X data for that depot was uploaded to the FSLP.
- The FSLP algorithms, as described in Section 4.1 and Section 4.2 were then activated, resulting in fleet X becoming grouped with another operator, who we will refer to as ‘Freight Operator B’. The FSLP automatically generated a collaborative plan for fleets X and B, and then provided the mileage, costs and other Key Performance Indicators (KPIs) of that plan.
- In addition (via a special setting the FSLP back-end), the commercial fleet planning solver used in Step 3 (and referred to in Figure 5) was run to establish the corresponding mileage and costs in the case where fleets B and X worked alone.
- Finally, Steps 1–4 were repeated 100 times in order to obtain robust results across a range of scenarios.
6.2. Efficiencies Achieved
6.3. Wider Socio-Economic and Environmental Benefits
7. Conclusions
Supplementary Materials
Author Contributions
Funding
Acknowledgments
Conflicts of Interest
References
- Vargas, A.; Traill, A.; Fuster, C.; Corne, D. A New ‘Gain-Sharing’ Business Model to facilitate the Physical Internet via a Competitive, Collaborative Logistics Platform. In Proceedings of the 6th International Physical Internet Conference (IPIC). Towards a Smart Hyperconnected Era of Efficient and Sustainable Logistics, Supply Chains and Transportation, London, UK, 11–19 July 2019. [Google Scholar]
- WBCSD. Road Freight Lab: A Low Carbon Freight Report under WBCSD’s Low Carbon Technology Partnerships Initiative (LCTPi); World Business Council for Sustainable Development: Geneva, Switzerland, 2017. [Google Scholar]
- Cao, M.; Zhang, Q. Supply chain collaboration: Impact on collaborative advantage and firm performance. J. Oper. Manag. 2011, 29, 163–180. [Google Scholar] [CrossRef]
- Liao, S.H.; Kuo, F.I. The study of relationships between the collaboration for supply chain, supply chain capabilities and firm performance: A case of the Taiwans TFT-LCD industry. Int. J. Prod. Econ. 2014, 156, 295–304. [Google Scholar] [CrossRef]
- Alarcón, F. Desarrollo de una Arquitectura para la Definición del Proceso de Comprometer Pedidos en Contextos de Redes de Suministro Colaborativas. Aplicación a una Red Compuesta por Cadenas de Suministro en los Sectores Cerámico y del Mueble; Universidad Politecnica de Valencia: Valencia, Spain, 2005. [Google Scholar]
- Shutherland, J. Collaborative Transportation Management: A Solution to Current Transportation Crisis; CVCR: Bethlehem, Palestine, 2006. [Google Scholar]
- Osório, A.L.; Camarinha-Matos, L.M.; Afsarmanesh, H. Enterprise collaboration network for transport and logistics services. IFIP Adv. Inf. Commun. Technol. 2013, 408, 267–278. [Google Scholar]
- Gonzalez-Feliu, J.; Salanova, J.-M. Defining and Evaluating Collaborative Urban Freight Transportation Systems. Procedia Soc. Behav. Sci. 2012, 39, 172–183. [Google Scholar] [CrossRef]
- Camarinha-Matos, L.M.; Afsarmanesh, H.; Ollus, M. Ecolead and CNO base concepts. In Methods and Tools for Collaborative Networked Organizations; Springer: New York, NY, USA, 2008; pp. 3–32. [Google Scholar]
- Vargas, A.; Patel, S.; Patel, D. Towards a Business Model Framework to Increase Collaboration in the Freight Industry. Logistics 2018, 2, 22. [Google Scholar] [CrossRef]
- Peeta, S.; Hernandez, S. Modeling of Collaborative Less-Than Truckload Carrier Freight Networks. Ph.D. Thesis, Purdue University, West Lafayette, IN, USA, 2011. [Google Scholar]
- Gonzalez-Feliu, J.; Morana, J.; Grau, J.M.S.; Ma, T.Y. Design and scenario assessment for collaborative logistics and freight transport systems. Int. J. Transp. Econ. 2013, 40, 207–240. [Google Scholar]
- BESTUFSll. Quantification of Urban Freight Transport Effects I; Best Urban Freight Solutions (BESTUFS): Rijswijk, The Netherlands, 2007. [Google Scholar]
- Department for Transport. Domestic Road Freight Statistics United Kingdom 2016; Department for Transport: London, UK, 2017.
- Frost & Sullivan. Digitising Freight—One Truck at a Time; Frost & Sullivan: San Antonio, TX, USA, 2016. [Google Scholar]
- TRL. Freight Industry Collaboration Study; Department for Transport: London, UK, 2017.
- Caballini, C.; Sacone, S.; Saeednia, M. Planning truck carriers operations in a cooperative environment. IFAC Proc. Vol. 2014, 19, 5121–5126. [Google Scholar] [CrossRef]
- Okdinawati, L.; Simatupang, T.M.; Sunitiyoso, Y. Modelling Collaborative Transportation Management: Current State And Opportunities For Future Research. J. Oper. Supply Chain Manag. 2015, 8, 96. [Google Scholar] [CrossRef]
- Ribas Vila, I.; Companys Pascual, R. Estado del arte de la planificación colaborativa en la cadena de suministro: Contexto determinista e incierto. Intang. Cap. 2007, 3, 91–121. [Google Scholar]
- Dudek, G. Supply Chain Management and Collaborative Planning; Springer: Berlin/Heidelberg, Germany, 2009. [Google Scholar]
- Gonzalez-Feliu, J.; Morana, J. Collaborative transportation sharing: From theory to practice via a case study from France. In Technologies for Supporting Reasoning Communities and Collaborative Decision Making; IGI Global: Hershey, PA, USA, 2011; pp. 252–271. [Google Scholar]
- WBCSD. Road Freight Lab: Demonstrating the GHG Reduction Potential of Asset Sharing, Asset Optimisation and other Measures; World Business Council for Sustainable Development: Geneva, Switzerland, 2016. [Google Scholar]
- Fabbe-Costes, N. Systèmes D’Information Logistique et Transport; Techniques de l’Ingénieur: Paris, France, 2007. [Google Scholar]
- Audy, J.F.; Lehoux, N.; D’Amours, S.; Rönnqvist, M. A framework for an efficient implementation of logistics collaborations. Int. Trans. Oper. Res. 2012, 19, 633–657. [Google Scholar] [CrossRef]
- Greening, P.; Piecyk, M.; Palmer, A.; McKinnon, A. An Assessment of the Potential for Demand-Side Fuel Savings in the Heavy Goods Vehicle (HGV) Sector; Committee on Climate Change: London, UK, 2015. [Google Scholar]
- Jenks, C.; Jencks, C.; Navarrete, J.; Baker, T.; Delaney, E.; Hagood, M. Freight Data Sharing Guidebook; The National Academies Press: Washington, DC, USA, 2013. [Google Scholar]
- Eckartz, S.M.; Hofman, W.J.; Van Veenstra, A.F. A Decision Model for Data Sharing. In Proceedings of the 13th IFIPWG 8.5 International Conference, EGOV 2014, Dublin, Ireland, 1–3 September 2014; Volume 8653, pp. 253–264. [Google Scholar]
- Nadarajah, S.; Bookbinder, J.H. Less-Than-Truckload carrier collaboration problem: Modeling framework and solution approach. J. Heuristics 2013, 19, 917–942. [Google Scholar] [CrossRef]
- Kale, R.; Evers, P.T.; Dresner, M.E. Analyzing private communities on Internet-based collaborative transportation networks. Transp. Res. Part E Logist. Transp. Rev. 2007, 43, 21–38. [Google Scholar] [CrossRef]
- Gansterer, M.; Hartl, R.F. Collaborative vehicle routing: A survey. Eur. J. Oper. Res. 2018, 268, 1–12. [Google Scholar] [CrossRef]
- NexTrust. Collaboration in Logistics Is Achieving Breakthrough; NexTrust: Logistik, TX, USA, 2017. [Google Scholar]
- Peeters, K.; Bogens, M.; Stumm, P. NexTrust Deliverable 1.1 Report—Results of Identification Phase; NexTrust: Logistik, TX, USA, 2017. [Google Scholar]
- Bogens, M.; Stumm, P. NexTrust Deliverable 2.1 Report—Network Identification; NexTrust: Logistik, TX, USA, 2017. [Google Scholar]
- Serrano-Hernandez, A.; Juan, A.A.; Faulin, J.; Perez-Bernabeu, E. Horizontal collaboration in freight transport: Concepts, benefits and environmental challenges. SORT. Stat. Oper. Res. Trans. 2017, 41, 393–414. [Google Scholar]
- Haulage Exchange. Available online: https://haulageexchange.co.uk/freight-exchange/ (accessed on 12 August 2020).
- Teleroute. Available online: https://teleroute.com/en-en/freight-exchange/ (accessed on 12 August 2020).
- Pan, S.; Trentesaux, D.; Ballot, E.; Huang, G.Q. Horizontal collaborative transport: Survey of solutions and practical implementation issues. Int. J. Prod. Res. 2019, 57, 5340–5361. [Google Scholar] [CrossRef]
- Ankersmit, S.; Rezaei, J.; Tavasszy, L. The potential of horizontal collaboration in airport ground freight services. J. Air Transp. Manag. 2014, 40, 169–181. [Google Scholar] [CrossRef]
- Schulte, F.; Lalla-Ruiz, E.; González-Ramírez, R.G.; Voß, S. Reducing port-related empty truck emissions: A mathematical approach for truck appointments with collaboration. Transp. Res. Part E Logist. Transp. Rev. 2017, 105, 195–212. [Google Scholar] [CrossRef]
- Hingley, M.; Lindgreen, A.; Grant, D.B.; Kane, C. Using fourth-party logistics management to improve horizontal collaboration among grocery retailers. Supply Chain Manag. 2011, 16, 316–327. [Google Scholar] [CrossRef]
- Pan, S.; Ballot, E.; Fontane, F. The reduction of greenhouse gas emissions from freight transport by pooling supply chains. Int. J. Prod. Econ. 2013, 143, 86–94. [Google Scholar] [CrossRef]
- Solomon, M.M. Algorithms for the Vehicle Routing and Scheduling Problems With Time Window Constraints. Oper. Res. 1987, 22, 254–265. [Google Scholar] [CrossRef]
- Laporte, G. The vehicle routing problem: An overview of exact and approximate algorithms. Eur. J. Oper. Res. 1992, 59, 345–358. [Google Scholar] [CrossRef]
- Floudas, C.A.; Lin, X. Mixed integer linear programming in process scheduling: Modeling, algorithms, and applications. Ann. Oper. Res. 2005, 139, 131–162. [Google Scholar] [CrossRef]
- De, A.; Mogale, D.G.; Zhang, M.; Pratap, S.; Kumar, S.K.; Huang, G.Q. Multi-period multi-echelon inventory transportation problem considering stakeholders behavioural tendencies. Int. J. Prod. Econ. 2020, 225, 107566. [Google Scholar] [CrossRef]
- Blum, C.; Roli, A. Metaheuristics in Combinatorial Optimization: Overview and Conceptual Comparison. ACM Comput. Surv. 2003, 35, 268–308. [Google Scholar] [CrossRef]
- Goswami, M.; De, A.; Habibi, M.K.K.; Daultani, Y. Examining freight performance of third-party logistics providers within the automotive industry in India: An environmental sustainability perspective. Int. J. Prod. Res. 2020. [Google Scholar] [CrossRef]
- Osterwalder, A. The Business Model Ontology—A Proposition in a Design Science Approach. Business 2004, 1–169. [Google Scholar] [CrossRef]
- Vargas, A.; Boza, A.; Cuenca, L.; Sacala, I. Inter-Enterprise Architecture and Internet of the Future; Springer: Berlin/Heidelberg, Germany, 2013; Volume 394. [Google Scholar]
- Kilger, C.; Reuter, B.; Stadtler, H. Collaborative Planning. In Supply Chain Management and Advanced Planning; Springer: Berlin/Heidelberg, Germany, 2008; pp. 263–284. [Google Scholar]
- Petersen, K.J.; Ragatz, G.L.; Monczka, R.M. An examination of collaborative planning effectiveness and supply chain performance. J. Supply Chain Manag. 2005, 41, 14–25. [Google Scholar] [CrossRef]
- Stadtler, H. A framework for collaborative planning and state-of-the-art. OR Spectr. 2009, 31, 5–30. [Google Scholar] [CrossRef]
- Verheij, H.; Augenbroe, G. Collaborative planning of AEC projects and partnerships. Autom. Constr. 2006, 15, 428–437. [Google Scholar] [CrossRef]
- Woxenius, J.; Persson, J.A.; Davidsson, P. Utilising more of the loading space in intermodal line trains-Measures and decision support. Comput. Ind. 2013, 64, 146–154. [Google Scholar] [CrossRef]
- Corne, D.; Knowles, J. Techniques for Highly Multiobjective Optimisation: Some Nondominated Points are Better than Others. In Proceedings of the 9th Annual Conference on Genetic and Evolutionary Computation, London, UK, 7–11 July 2007; ACM: London, UK, 2007; pp. 773–780. [Google Scholar]
- Ghallab, M.; Nau, D.; Traverso, P. Automated Planning: Theory and Practice; Elsevier: Amsterdam, The Netherlands, 2004. [Google Scholar]


| Barriers/Limitations for Collaboration | Author | Strategies to Overcome Them |
|---|---|---|
| (A) Shipper concerns of having a different carrier from its usual contracted carrier. | [11] | Concerns over branding could be resolved through use of independent third parties and non-liveried vehicles. Involving the shipper into the alliance, through agreements, showing them the advantages of collaboration. |
| (B) Load compatibility can restrict the ability for loads to be shared. | [16] | Matching companies moving similar products with similar handling equipment on similar types of vehicles. |
| (C) Responsibility for transportation operations. | [23] | If the collaborations for logistics sharing follow a contract or a chart where the responsibilities are well defined, these questions will not constitute an obstacle to sharing. |
| (D) Legal barriers; there are laws that interfere with the ability to share data: competition law. | [16,23,24,25,26] | The European Union (EU) recommends the use of a neutral trustee, to whom different stakeholders give data to be held and analysed preventing the transfer of commercial data such as volumes, delivery addresses, costs, product characteristics, etc. |
| (E) Lack of human resources, especially for small operators. | [26] | By giving to a central entity the authority of decision making in terms of optimisation and route scheduling for a group of partners who are collaborating, there is no need to increase utilisation of human resources for fleet operators. |
| (F) Significant coordination is needed to achieve data and asset sharing. | [26] | In a centralised structure collaboration scheme, the central coordinator is responsible for coordination of the partners in the collaboration, and the partners are committed to follow central instructions to allow the collaboration scheme to work. |
| (G) Lack of available accurate data. | [16,25,27] | Definition of data structure requirements for collection of unified and accurate data for collaboration. The confidentiality of data collection will be defined through contracts between the partners in the collaboration and the central trustee authority. |
| (H) Lack of trust and common goals. | [11,16] | Use of clear contract agreements, where partners define confidentiality policies, service level agreements, penalties in case of failing, payment conditions, coordination structure, management of unexpected events and contract duration. |
| (I) Lack of a fair allocation mechanism for collaboration revenues. | [11,16,24,28] | Giving different options for revenue sharing to the partners and showing them the cost benefits of each option will allow them to choose, during the negotiation phase, which mechanism will be used for revenue sharing. |
| (J) A neutral third party is required to facilitate collaboration. | [28] | A trustee figure is necessary to implement collaboration. The trustee needs to be a connector between the collaboration partners. Partners might be reluctant to accept a third party, but, this can be overcome through contracts between each partner and the trustee. |
| (K) There are clear regional imbalances in freight movement. | [16] | Use the practice of triangulation, where a truck is diverted from its main back route to a third point in order to pick up a return load, potentially increasing the mileage but reducing the amount of empty running. |
| (L) Unawareness of the benefits of participating in collaborative projects. | [29] | Engagement of stakeholders to participate in collaborative networks is crucial. During the initial engagement, it is necessary to show to the possible partners the real benefits of similar collaborative projects. |
| (M) High risk of strategic behaviour in auction collaborative process. | [30] | Effective profit-sharing mechanisms are needed, because these have the potential to impede strategic behaviour. |
| Enabler | Authors | Opportunity |
|---|---|---|
| (A) Common Cultural Mind Set. | [31,32] | The fundamental breakthrough for the success of collaborative projects in the freight industry comes from the willingness of the different industry actors to cooperate. It is critical that partners who decide to collaborate have a common cultural mind-set allowing the implementations of the collaborative process to run smoothly. It is necessary that a fundamental change in the management of transportation sourcing and operations requires that shippers and carriers make an actual “mental shift”, de-coupling from their own networks first and then agreeing to re-connect with other shipper network flows. |
| (B) Establishment of Non-disclosure Agreements. | [26,33] | An important way to protect data and assets that are intended to be shared and to assure that owners of the data and assets are willing to provide them to the consortium is to execute non-disclosure or privacy agreements. These may be part of legal contracts or separately negotiated documents. The use of this document will help to increase trust among the partners |
| (C) Stakeholder Engagement. | [26] | It is incumbent upon project leaders and participants in a collaboration project to get to know each other well, establishing a bond and trust between partners prior to collaboration. In this way the partners get to know each other deeply and increase the sense of confidence and trust among them. This will ultimately assure the success of the project. |
| (D) Technology Innovation. | [26] | In many cases, the implementation of a particular technology makes it easier to share data and assets and helps a project to succeed. An automated technology which could accomplish the identification, for instance, of a transportation vehicle without requiring the divulgence of certain data about that vehicle could be a motivator for participants. |
| (E) Articulating Benefits of Sharing. | [26] | It is important for project proponents to be able to explain to the public, to private sector participants, and to other stakeholders how they will benefit from the conduct of the project. Articulating benefits is an important part of project coordination. For instance, publishing analyses of the expected costs savings and benefits of the project reveals openness and transparency such that it could help to assure its success and the involvement of different stakeholders. |
| (F) Legislative Changes. | [23,26] | Normative and jurisprudence aspects of sharing are related to public administrations. Nowadays, the most important facilitators in this category are the different local laws and legislation that help the development of sharing approaches in urban and regional freight transportation. There are two types of approaches: restrictions to non-sharing and incentives to sharing. In the first approach, local authorities could use zero emission zones to force carriers to collaborate with Electric Vehicles (EV) operators to avoid expensive penalties. In the second approach, local authorities could, for instance, incentivise the reduction of empty running through reduced taxation for companies that join collaborative schemes. |
| (G) Previous Relationships Among Partners. | [23] | When participants have already collaborated, because of common interests or because they belong to the same network, transportation sharing is more naturally occurring; it can seem like a step forward in the relationship building among participants. Thus, the trust factor is already in place and the collaboration relationship flows smoothly. |
| (H) Definition of Penalties for Non-Compliance. | [29] | Penalties for non-compliance with contract terms could be made through default payments for each shipment in which a default occurs. Moreover, in some collaborative arrangements, default payments may not be assessed on a shipment basis. The approach used to define the type of penalties for non-compliance with specific terms in a contract will be defined for the collaborative network. The partners who are committed will work with extra care to achieve their liabilities. |
| Building Block | Description |
|---|---|
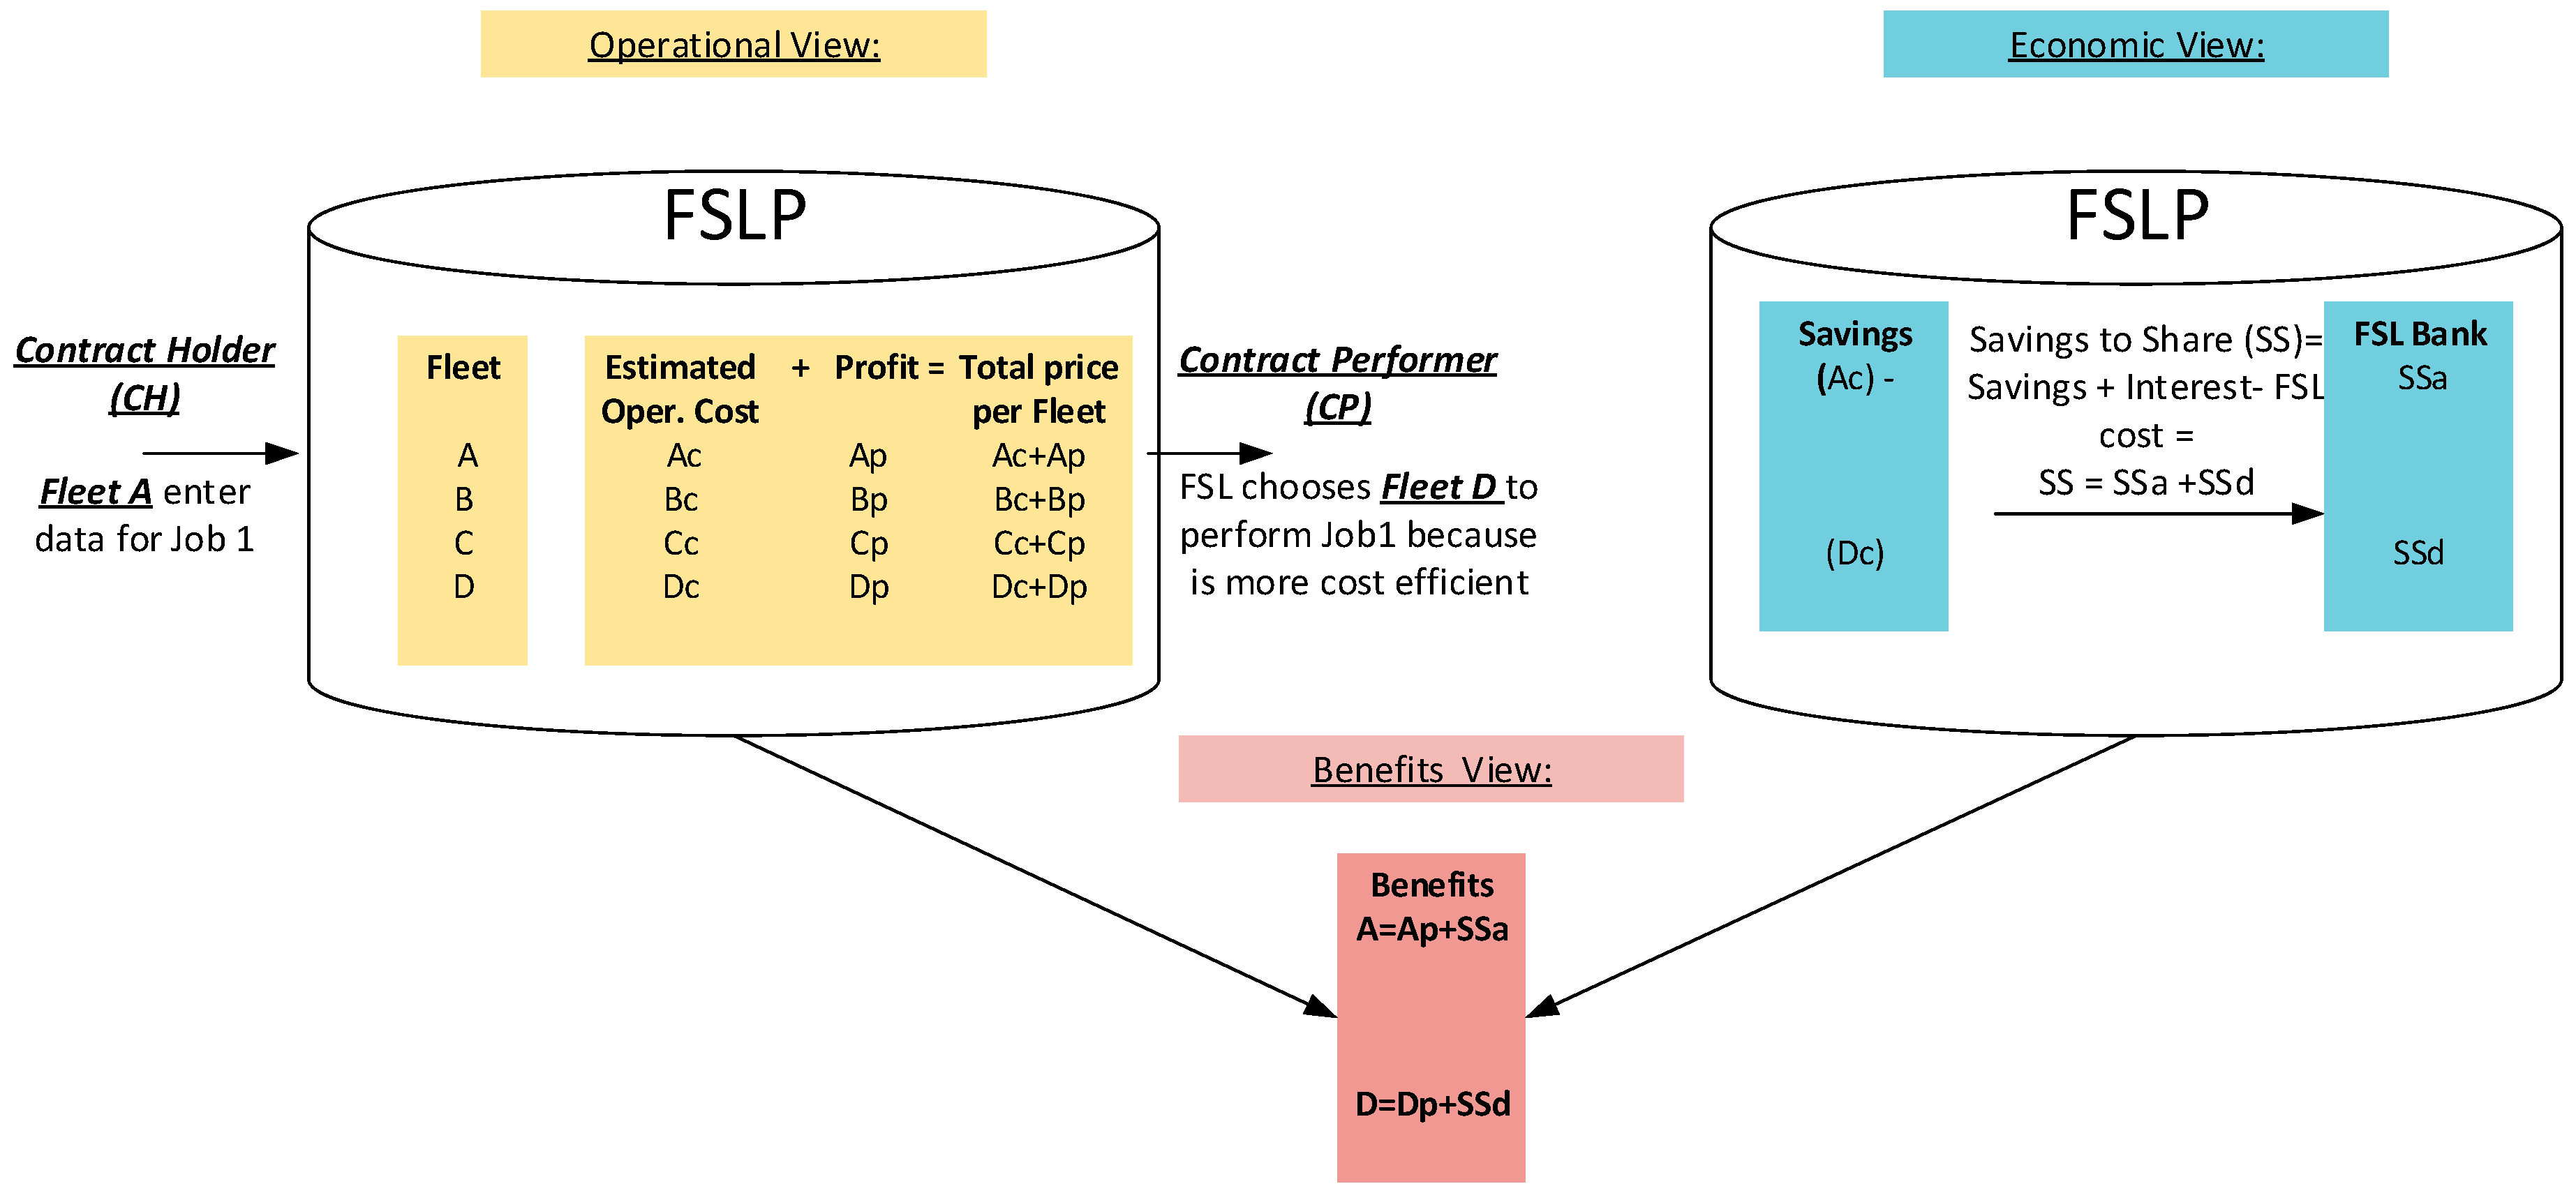
| Value proposition | The objective of the FSL platform is to increase competitiveness, efficiency and utilisation, by creating a collaborative ecosystem. The platform will search for the most efficient delivery in terms of operating costs, fleet utilisation and emissions for the fulfilment of contracts submitted by members of FSL using the assets of FSL members. A wide geographic coverage of members’ assets increases the likelihood of capacity being available and in turn increases the chances of fulfilling more contracts in any given period of time. However, the FSL algorithm will only reallocate jobs where price and emissions are lower than those possible if performed by the Contract Holder (CH). In the event that a lower price and lower emissions cannot be found, the CH would then fulfil the contracted job. |
| Customer Segment | Fleet operators are FreightShare Lab’s principal direct customers. Given their competitive nature, and to ensure compliance with competition law, it is necessary for a neutral trustee to facilitate the collaboration between them. Where the fleet operators or their customers participate in specific load-sharing, auction, return-load freight exchange platforms, FSL will look to provide value added for them as well: FSL will offer a collaborative relationship by which those contracts awarded through these other platforms can be uploaded into FSL system to see if a better alternative can be found and arranged (i.e., at a lower price and reduced emissions); in effect, the FSLP acts as a ‘platform of platforms’. |
| Customer Relationship | A neutral trustee is an organisation responsible for ensuring the collaborative network will be constructed in such a way that a fruitful long-term, sustainable relationship is established and maintained. Partners in a collaboration agreement (possibly competitors) could provide commercially sensitive data to the trustee organisation, which can maintain the required confidentiality and security of such data use, according to contractual terms and conditions agreed with the data owners, for fulfilling the purposes of FSL. In this way, compliance with EU competition and data protection laws is provided. Arguably, the platform is best managed as a cooperative by the FSL members; all terms and conditions, rules of the FSL business, quality and standards shall be agreed in a decentralised manner by the members and profits distributed among them. FSL members would upload contracts they have individually agreed with their customers into the platform, securely and confidentially, for the system to analyse. |
| Channels | A digital platform will be used to support and facilitate the operation of the FSL. Regular meetings will be necessary between partners and trustees to build trust, incentivise collaboration and negotiate terms and conditions. |
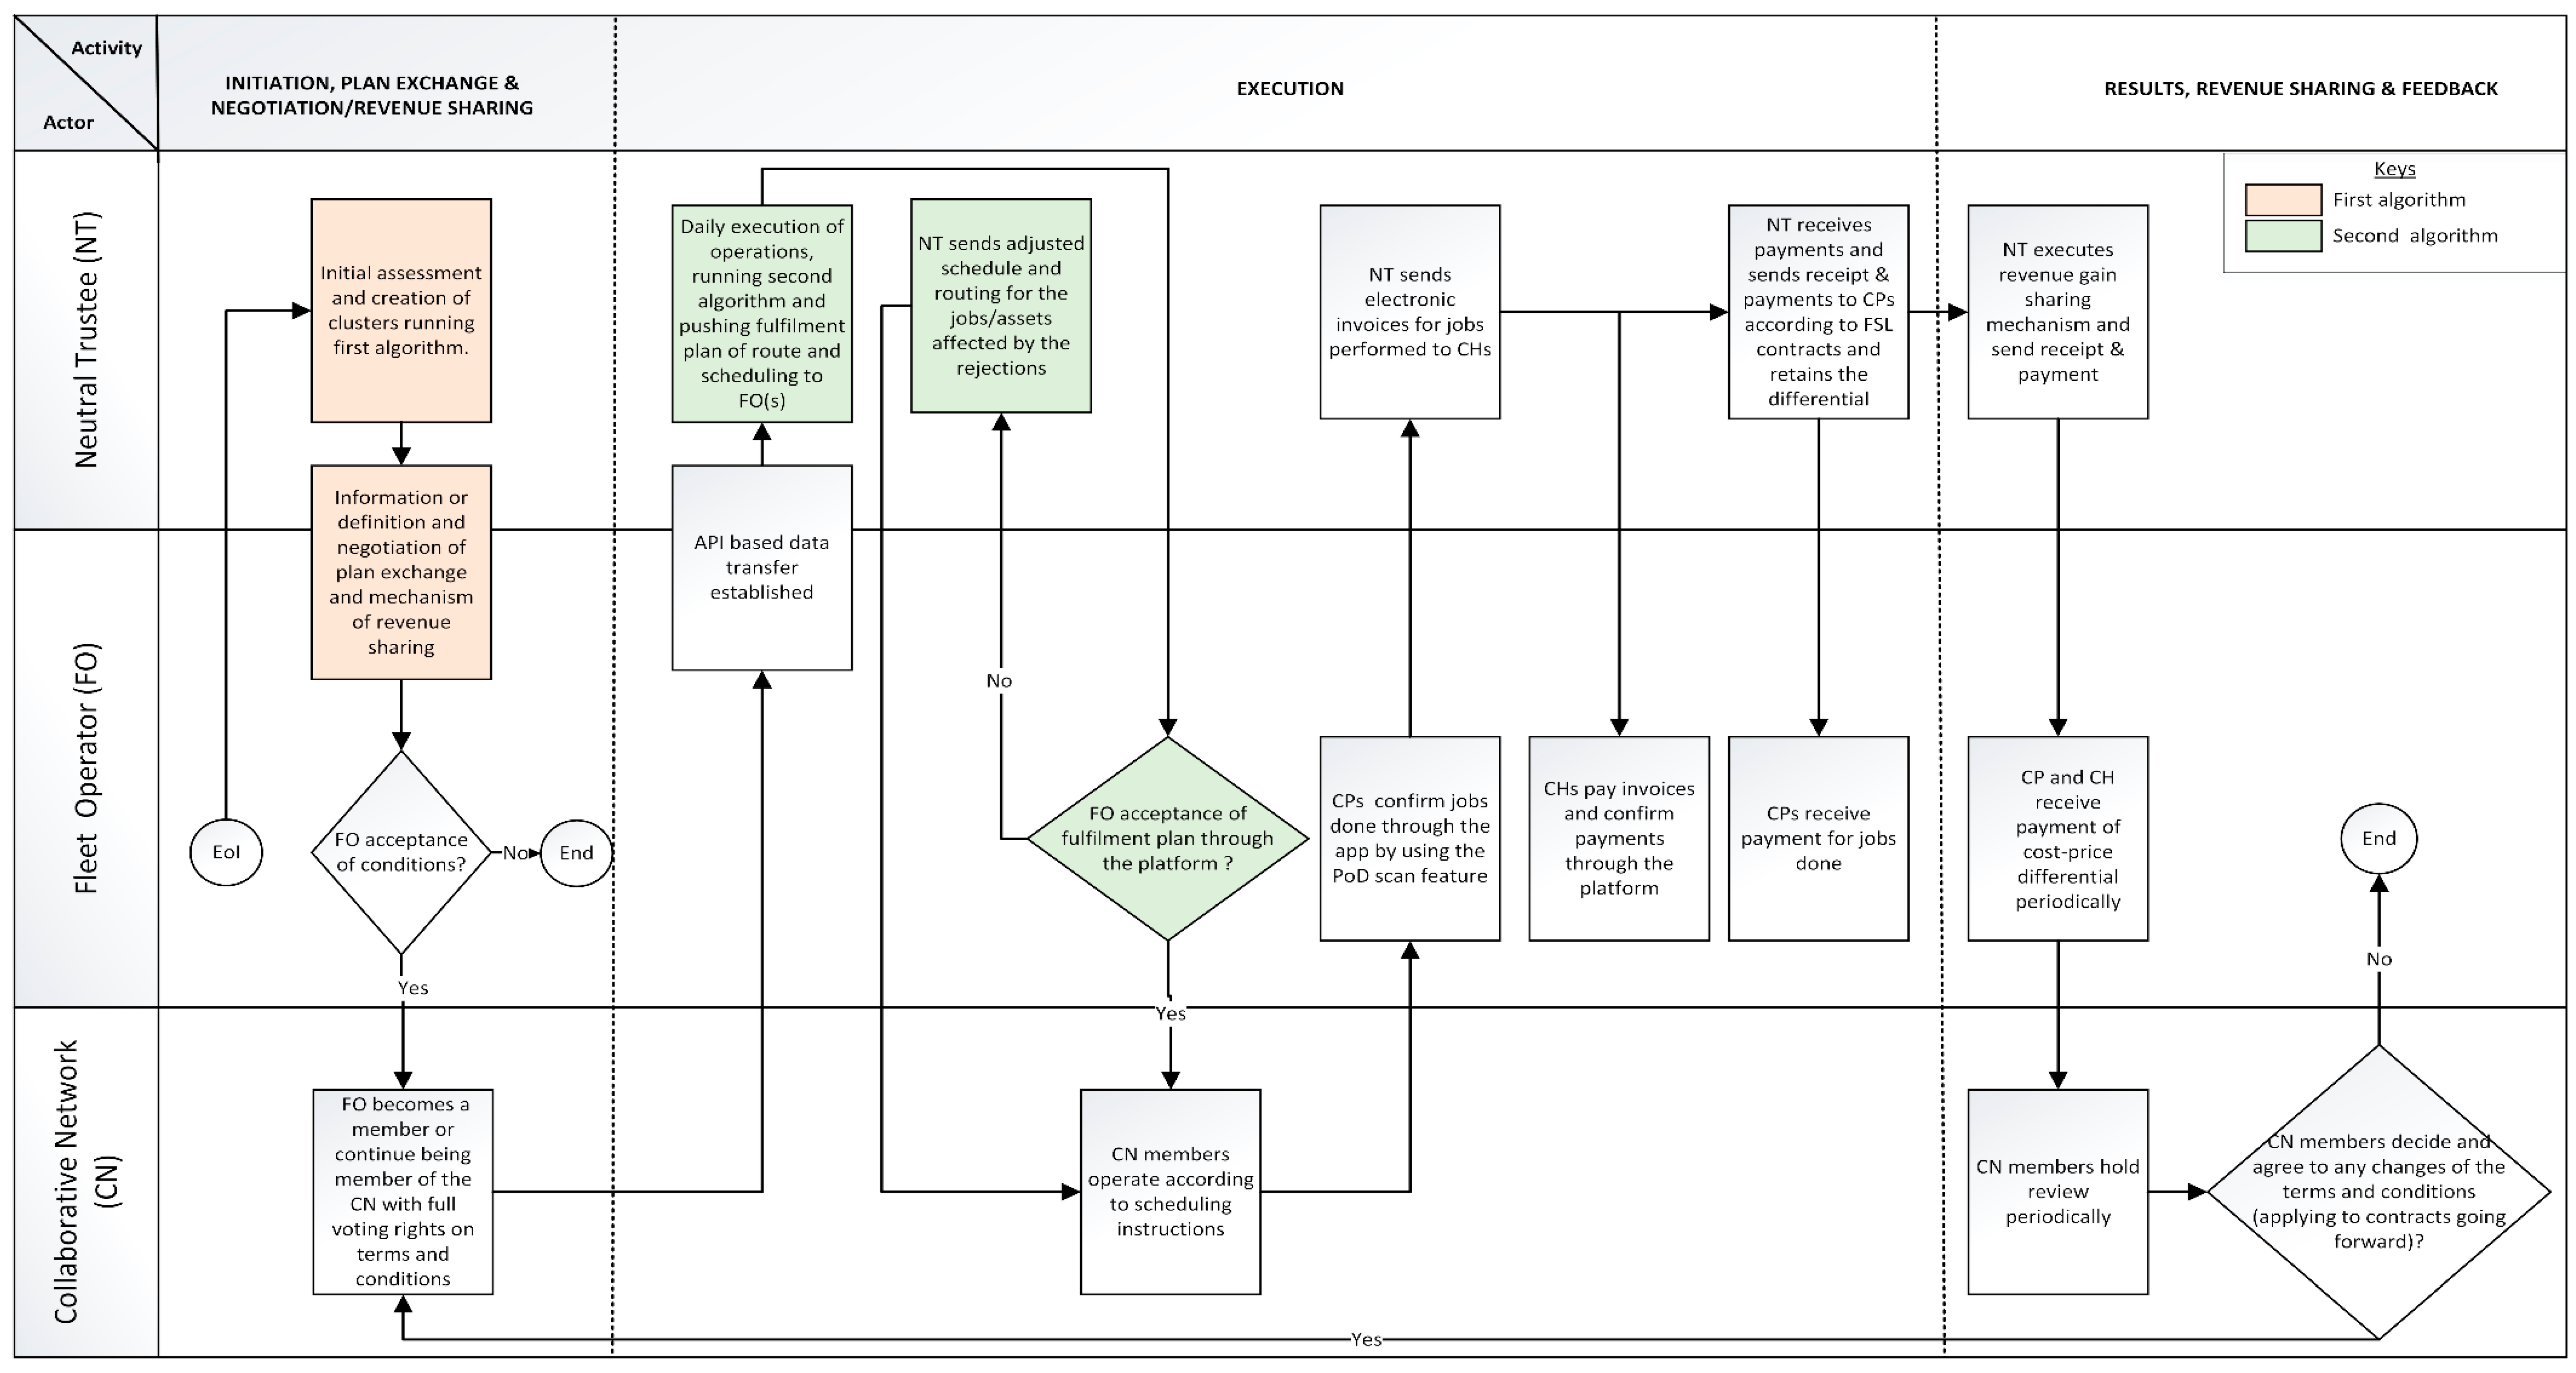
| Key Activities | The definition of the key activities in a collaborative process has been proposed in [10,49] based on previous ideas from [5,19,24,50,51,52,53]. These activities are: (1) Initiation, (2) Plan Exchange, (3) Negotiation/Revenue Sharing, (4) Execution, (5) Performance Measurement and Revenue Sharing Execution and (6) Feedback/ Improvement. |
| Key Resources | Data and assets provided daily by the FSL members in accordance with the terms and conditions negotiated for each cluster. The digital platform with the back-end optimization algorithms and the support team to manage and maintain the platform and to allow the orchestration of collaboration among the members |
| Key Partners | In this model, shippers, do not have direct access to the platform, but will benefit from it through sustainable competition among the logistics service providers and lower emissions associated with the fulfilment of their jobs. The relationships, interactions and negotiations between shippers and carriers remain the same. |
| Revenue Streams | The FSL algorithm will reallocate jobs where the total operational cost and associated profit margin is lower than the operational cost of fulfilling their own contracted jobs with their own logistics assets. This will guarantee that all collaborating members, both the original CH and Contract Performer (CP), maintain their agreed profit margins, as well as providing them with additional revenue. |
| Cost Structure | The business model provides that all savings achieved through the platform will be shared between members, once the costs of running the platform are covered. Costs will be distributed across collaborating members in proportion to the savings they generate, and hence those members that do not participate in any transaction will neither incur any costs during that period nor share any additional revenue generated. |
| Forms of Collaboration | A combination of decentralised and centralised coordination in each key activity is proposed in order to bring wider benefits and flexibility to enable its implementation between different members. The centralised coordination allows the platform to determine the optimal solution and assign to specific operators. The decentralised coordination facilitates members to negotiate terms and conditions for each cluster. |
| Strategies of Collaboration | The strategies imbedded into the optimization algorithms in the back-end of the platform are: route scheduling/planning, join optimization of assets, backhauling and consolidation. The use of complementary strategies into the platform makes the FSL more attractive for operators, enabling them to find the most cost and environmentally efficient solutions. |
| No Special Arrangements | Consolidation Centre | Morning Transfer | |
|---|---|---|---|
| % of jobs with savings | 48% | 63% | 72% |
| % increase of jobs completed per day | 3% | 1% | 5% |
| Daily mileage reduction | −3012 km | 3523 km | 2143 km |
| Collaboration Arrangement | Emissions Saved | |||
|---|---|---|---|---|
| CO2 (tonnes) | PM (Kgs) | NOx (Kgs) | HC (Kgs) | |
| No Special Arrangements | −629 | −122 | −12 | −996 |
| Consolidation Centre | 735 | 143 | 14 | 1165 |
| Morning Transfer | 447 | 87 | 9 | 708 |
| Collaboration Arrangement | Other Wider Economic Cost Savings | ||
|---|---|---|---|
| Congestion (k£) | Infrastructure (k£) | Accidents (k£) | |
| No Special Arrangements | −211 | −107 | −3 |
| Consolidation Centre | 247 | 125 | 4 |
| Morning Transfer | 150 | 76 | 2 |
| Collaboration Process Stage | Description |
|---|---|
| 1. Collaboration Initiation | The collaboration process starts when a logistics operator submits an ‘Expression of Interest’ (EoI) to the platform. The platform, which is managed by the neutral trustee (represented on the workflows), receives the EoI and performs the “Share-Cluster Assignment Algorithm” to identify a suitable ‘cluster’ of members in terms of equipment, geographical location, type of products, compatibility and data transfer capability, among others. If such a cluster exists, the interested party will receive information relating to the default contract pertaining to that cluster, to which it has been assigned, as well as its legal and commercial terms and rules of collaboration. Where a new member enters an existing cluster, they will not be able to negotiate or alter the previously defined terms and conditions of collaboration within the cluster, and will therefore have to accept any existing conditions until the following Ordinary Meeting, where they will have full voting rights and the opportunity to re-negotiate. Following the acceptance of conditions, the interested party will sign a contract with the cluster and another contract with the neutral trustee, where contracts are sent and signed electronically. In this way, the party becomes a new FSL member. If no suitable cluster exists for the interested party to collaborate with, the platform will check whether there is a member “on hold” and waiting for a possible partner that matches the appropriate criteria. If this match is affirmative, the two matched parties will perform the following two-step process; Plan Exchange and Negotiation. If there is no match found, then membership will be put on hold until another suitable collaboration partner eventually shows interest in FSL. |
| 2. Plan Exchange | At this stage in the collaboration process, the parties that were matched through the platform need to agree with the Plan Exchange; the sharing of data on the vehicles and jobs that are available through the platform using an Application Programming Interface (API) and the practicalities for execution of the API and the time limit. The parties are also informed about the operating costs, as calculated by the platform, based on standard tables. They can then decide if they want to use those standard operating costs or if they want to provide their own and real operating costs. This last option is advisable for those operators that are very efficient in their operations and are willing to embrace as many jobs as possible. Lastly, the parties are informed about their voting rights, frequency of vote and the next planned meeting where they will have the opportunity to re-negotiate any relevant terms and conditions. |
| 3. Negotiation/Revenue Sharing: | At this stage, the collaborating parties that were matched through the platform will negotiate terms such as: Service Level Agreements (SLA), liabilities, level of profit margin, rules of collaboration and the revenue sharing mechanism. This stage will not be applicable to those parties that have already been matched with an established cluster where, instead of negotiating terms and conditions, the parties shall accept those already in place but have the possibility of re-negotiation at a later stage. Any re-negotiation will take place at the Ordinary Meeting at the end of each financial period, where members will execute their voting rights to determine any terms ahead of the next Renegotiation of Conditions. If a new cluster is formed, the platform will provide a default contract with the terms that need to be agreed between the parties, thus providing them with a template for negotiation. If an agreement is reached among them, they will sign two contracts, one with the cluster and one with the neutral trustee. In this way, the parties officially become part of the FSL consortium. If an agreement is not reached in the negotiation phase, the process will terminate for both of them or otherwise will be put on hold to wait for another possible match |
| 4. Execution; | The execution will be led by the neutral trustee who will be responsible for managing and maintaining the platform. The FSL members will submit data through the API, in terms of the available assets and the contracted jobs they wish to post, which will only be visible to the neutral trustee, thus ensuring commercial confidentiality between members. This data will have to be entered into the API before a pre-determined time (e.g., 6 p.m. the day before a particular delivery contract is to be fulfilled). The platform will then run the algorithms and send the operators the resulting collaborative schedule and route. Once the schedule is received by the members’ transport planners, they can accept or reject the master schedule. If any of the members reject one or more of the jobs, the platform will adjust the solutions without the jobs rejected and recalculate schedules, routes and prices. An upper limit of 2% of the total offers to fulfil a contract (in whole or in part) may be rejected by each member in order to avoid too many re-calculations that may delay the schedules being received in sufficient time to organise the required resources to fulfil the job request. The updated solution is to be final; the members are bound to accept it and act accordingly (as would be specified under the terms and conditions they have agreed to when joining the FSL). On the day that deliveries are due, drivers will receive the schedule and route via the driver app. The drivers will then fulfil the jobs and send a Proof of Delivery (PoD) through the app. If everything goes as expected, the platform will send an electronic invoice to the CH corresponding to the jobs posted into the platform and performed by the CP. This e-invoice will reflect the standard operating costs that, according to the algorithm, would have been incurred by the CH if it were operating without collaboration. The platform will also make the corresponding payment and send an electronic deposit slip to the CP that fulfils the job. The latter payment will be equal to their operating costs, as estimated by the algorithm, plus their previously agreed profit margin. The platform retains the difference between the amount paid by the CH and the corresponding amount paid to the CP. |
| 5. Performance Measurement and Revenue Sharing Execution | The cost differential, being the difference between the CH payments to the FSL platform and the corresponding payment by the FSL platform to the CP, is retained until the end of the financial year. At the end of the financial year, the neutral trustee executes the gain-sharing for each cluster after deducting the platform management fees and running costs incurred throughout the financial year. The gain-share is made directly to members’ bank accounts at the end of the financial year in accordance with the cluster rules. |
| 6. Feedback/Improvement | The aggregated results in terms of participation, market share, operational and financial performance for the financial year, are presented at the Ordinary Meeting, where members may re-negotiate the terms within each cluster. Those members who agree with the changes to the terms and conditions may continue to be members of FSL and to work collaboratively, while those who do not accept them will leave the cluster. |
| Mileage (km) | Costs (£) | |||
|---|---|---|---|---|
| No Sharing | Collaboration | No Sharing | Collaboration | |
| Freight Operator X, Depot 1 | 8920 | 16,050 | £103,291 | £185,190 |
| Freight Operator B | 10,753 | 2045 | £124,231 | £24,603 |
| Collaboration leg: ‘morning transfer’ | N/A | 168 | N/A | £3396 |
| Total | 19,673 | 18,263 | £227,522 | £213,189 |
| Savings | 1410 | £14,333 | ||
| % Savings | 7% | 6% | ||
| Mileage (km) | Costs (£) | |||
|---|---|---|---|---|
| No Sharing | Collaboration | No Sharing | Collaboration | |
| Freight Operator X Depot 2 | 7156 | 5339 | £82,600 | £61,357 |
| Freight Operator B | 8842 | 8435 | £101,814 | £98,925 |
| Collaboration leg: ‘morning transfer’ | N/A | 308 | N/A | £4670 |
| Total | 15,998 | 14,082 | £184,414 | £164,952 |
| Savings | 1916 | £19,462 | ||
| % Savings | 12% | 11% | ||
| Collaboration Arrangement | Emissions Saved | |||
|---|---|---|---|---|
| CO2 (tonnes) | PM (Kgs) | NOx (Kgs) | HC (Kgs) | |
| Freight Operator X Depot 1 | 212 | 5 | 559 | 5 |
| Freight Operator X Depot 2 | 288 | 7 | 759 | 7 |
| Collaboration Arrangement | Other Wider Economic Cost Savings | ||
|---|---|---|---|
| Congestion (k£) | Infrastructure (k£) | Accidents (k£) | |
| Freight Operator X, Depot 1 | 103 | 62 | 2 |
| Freight Operator X, Depot 2 | 140 | 84 | 2 |
© 2020 by the authors. Licensee MDPI, Basel, Switzerland. This article is an open access article distributed under the terms and conditions of the Creative Commons Attribution (CC BY) license (http://creativecommons.org/licenses/by/4.0/).
Share and Cite
Vargas, A.; Fuster, C.; Corne, D. Towards Sustainable Collaborative Logistics Using Specialist Planning Algorithms and a Gain-Sharing Business Model: A UK Case Study. Sustainability 2020, 12, 6627. https://doi.org/10.3390/su12166627
Vargas A, Fuster C, Corne D. Towards Sustainable Collaborative Logistics Using Specialist Planning Algorithms and a Gain-Sharing Business Model: A UK Case Study. Sustainability. 2020; 12(16):6627. https://doi.org/10.3390/su12166627
Chicago/Turabian StyleVargas, Alix, Carmen Fuster, and David Corne. 2020. "Towards Sustainable Collaborative Logistics Using Specialist Planning Algorithms and a Gain-Sharing Business Model: A UK Case Study" Sustainability 12, no. 16: 6627. https://doi.org/10.3390/su12166627
APA StyleVargas, A., Fuster, C., & Corne, D. (2020). Towards Sustainable Collaborative Logistics Using Specialist Planning Algorithms and a Gain-Sharing Business Model: A UK Case Study. Sustainability, 12(16), 6627. https://doi.org/10.3390/su12166627