Article

Progress of Technological Innovation of the United States’ Shale Petroleum Industry Based on Patent Data Association Rules

Department of Energy Resources Engineering, Inha University, 100 Inharo, Nam-gu, Incheon 22212, Korea
*
Author to whom correspondence should be addressed.
Sustainability 2020, 12(16), 6628; https://doi.org/10.3390/su12166628
Submission received: 4 July 2020 / Revised: 12 August 2020 / Accepted: 13 August 2020 / Published: 16 August 2020
(This article belongs to the Section Energy Sustainability)

Abstract

:
This study analyzed the technological progress of the United States’ shale and tight petroleum (natural gas and crude oil) industry based on the association rules of its patents. According to the findings, although the production of shale oil and gas began in 2007, evidence of increasing technological developments in this industry assessed by patent applications began to appear only in 2010. In addition, the results showed that two distinct technological domains developed in 2010. Moreover, frequently developed technology classification networks are likely to contribute to the growth of this industry.

1. Introduction

In 2007, the shale and tight petroleum (natural gas and crude oil) industry in the United States (US) began to adopt an extraction technology that combined horizontal drilling and hydraulic fracturing [1]. Currently, shale and tight petroleum are some of the largest and most economically producible energy sources in the US, compared to conventional fossil fuel resources [2]. As of 2018, the production of shale gas and tight oil increased by about four to five times compared to 10 years earlier. In 2008, shale gas and tight oil production reached approximately 16% and 12% of the US’s total production of natural gas and crude oil, respectively. By 2018, their production increased to about 70% and 60%, respectively [3]. These huge reserves of economically producible fossil fuel resources received attention as new drivers of economic development [4,5].
In spite of the significant growth of this industry, there are many questions regarding the future of the shale petroleum industry, particularly concerning its environmental problems [6], social sustainability [7], economic feasibility [8], and applicability to other countries [9]. Nonetheless, shale and tight petroleum are expected to constitute the biggest portion of petroleum production in the US until 2050 [2], and the related technological developments are expected to become breakthroughs in addressing the current questions and problems.
Before reviewing the technological developments of the shale and tight petroleum industry, it is necessary to define shale and tight petroleum, especially because some previous studies confused industrialized shale and tight petroleum with others, such as potentially producible unconventional petroleum.
Simply put, shale and tight petroleum is a natural gas and crude oil located in low permeable reservoirs such as shale rocks or tight sandstone formations [10,11]. In a broad sense, shale gas and tight oil also refer to tight gas and shale oil, respectively. Both shale petroleum and tight petroleum can be produced economically by applying technologies that artificially improve the permeability of reservoirs, such as hydraulic fracturing and horizontal drilling [12,13]. In sum, industrialized shale and tight petroleum are economically producible crude oil and natural gas located in low permeable reservoirs accessible through hydraulic fracturing and horizontal drilling. Moreover, shale and tight petroleum are distinct from other unconventional resources like coalbed methane, heavy oil, oil shale, tar sand, and gas hydrates [14]. The production of these other unconventional resources largely depends on technologies that reduce the viscosity of the resource [15].
The prior studies referenced in this paper had limitations in gathering patent documents that focus on currently and economically producible shale and tight petroleum in the US. This limitation can lead researchers to misidentify a critical area of technological development that contributes to the growth of the US shale and tight petroleum industry. Subsequently, this study conducts a more elaborate retrieval of patent data relevant to this industry to provide a more accurate identification of the recent technological development trends that are likely to affect the future of the industry. Using patent data to analyze technological development also has the advantage of providing a proxy to assess innovation activity [16]. In addition, patent data granted by a patent office includes the qualification of new and useful improvements compared to prior art [17]. Thus, analyzing patent data for a certain period can show the trends of innovation activities and useful developments in technology. However, assessing innovation with patent data has a limitation in assessing the efforts and achievements of innovation activity before commercialization or industrialization.
This study analyzed the technology classification index of patents in the dataset. The results show advances in incumbent and new areas of technologies in the US shale and tight petroleum industry. Moreover, the results are in line with a previous study by West [18] that analyzed academic innovation activity.

Literature Review

As described in the previous section, this study focused on identifying technological advancements in the shale and tight petroleum industry that are likely to affect its future production capability(technological recoverable resources), productivity(economically recoverable resource), and environmental problems. Additionally, unconventional resources make up a small portion of the economically recoverable resources (ERR) but are a substantial part of the technologically recoverable resources (TRR) [13].
Reynolds [19] argued that the information and depletion effect affect production capability (the ultimately producible amount of a resource) and activity (production quantity satisfying market demand for the resource). The information and depletion effect implies that the production quantity and prices are the result of exploration activity. Due to the finite nature of natural resources, they are inevitably depleted and finally show increasing prices and decreasing production quantity. In other words, the price of natural resources could remain low and stable if locating new reserves keeps the ultimately producible quantity of the natural resource sufficient. Thus, exploration activity and cumulative information by exploration activity induce firms to find new and un-depleted natural resources. Moreover, Reynolds [20] used Hubbert’s cumulative production curve to predict the production activity of shale oil, and showed that it will increase until 2025 or 2030, and suggested less price sensitivity for shale oil.
According to Holditch [13], producing unconventional resources is sensitive to resource prices. Because unconventional resources require the use of stimulation methods during production, these methods result in higher costs than for conventional resources.
Horn [21] expected that shale petroleum production is possible when crude oil and natural gas prices increase sufficiently, or when high crude oil and natural gas prices translate to an increase in the ERR of shale and tight petroleum. Interestingly, such price issues became evident following the production of shale petroleum in late 2008 and 2014. Umekwe and Baek [22] conducted an empirical study on the impact of crude oil and natural gas price decreases. They found that price issues affect the production of shale petroleum only in the short term.
However, beyond these price issues, researchers suggested other factors as potential adversaries of shale and tight petroleum production. According to Wang et al. [6], environmental controversial problems related to shale gas, including substantial water usage, aquifer contamination, methane leaks, and induced earthquakes increased.
However, Holditch [13] asserted that most of the claims related to the negative impacts on the environment and quality of life near shale petroleum production sites are false, though emphasized the importance of supply factors in production and gaining productivity. Due to drinking water contamination by methane, which is a critical environmental issue of shale petroleum production, development is likely to depend on missed manufacturing during the casing process of uncased and abandoned wells, but is not likely to depend on the extension of shale petroleum reservoir fractures [23]. Therefore, Holditch [13] suggested technological developments for productivity gains such as the development of drill bits, rotary-steerable drilling, down-hole electronics as part of the drilling technology, isolation tools for multi-stage fracturing, proppant agents and fluids, micro-seismic monitoring for fractured areas, and the measurement and processing of three-dimensional seismic data to detect sweet spots to improve the performance of horizontal drilling and hydraulic fracturing.
According to Romer [24], productivity gains are possible in two distinct activities: production activities and research and development (R&D) activities. Some previous studies [25,26,27] measured productivity gains by applying the learning curve method, which measures technological progress based on cumulative production activities. Other studies attempted to find indications of productivity gains from R&D activities [28,29,30]. Additionally, some studies attempted to determine the specific technological changes likely to contribute to an increase in the productivity of the US shale and tight petroleum industry [18,31,32].
Fukui et al. [25] analyzed the learning curve of the US shale gas industry using the production data of shale gas and natural gas wellhead prices from 2005 to 2015. The study argued that a 13% decrease in wellhead prices occurs for each doubling of cumulative production. Kim and Lee [26] analyzed technological progress that induced decreases in production costs through cumulative production activities. In their study, production costs decreased by about 1.9% for each doubling of cumulative production activity. Furthermore, US shale petroleum companies chose to change the proportion of crude oil and natural gas according to their rapid price decreases [27]. Covert [33] argued that some shale oil companies in the Bakken region increased their profitability slowly without active experiments from 2005 to 2011. Therefore, the study emphasized the need for more active experiments to increase productivity and profitability [33]. Meanwhile, concerns about economic feasibility remained and reemerged. Sandrea [34] pointed to the stagnant progress of the average production of a well (barrels per day) in the Bakken region from 2008 to 2013. Nonetheless, the study added some positive aspects. Specifically, several companies reported improvements to their estimated ultimate recovery (EUR) and initial production (IP) of wells.
ISED (International Science and Economic Development Canada) [29] analyzed global patent data and identified the dominant fields of major petroleum companies in shale petroleum-related patents from 2000 to 2012. According to the study, major US petroleum companies own the majority of the technological field represented by several keywords: well casing drilling, drilling data detect, data determining formation, drilling well formation, well fracture formation, and formation wellbore subterranean. Wei et al. [30] analyzed global patent data and suggested that Australia, Canada, China, and the US owned the majority of exploration devices, drilling equipment, extraction equipment, and digital simulation technology. However, only the US has the majority of processing and feed purification equipment. Additionally, the study suggested three promising technologies for this industry: refined simulation of shale gas exploration through multi-step fracturing in deep pay zones, water treatment, and environmental protection technology. Moreover, the study suggested potential development fields including underground in situ techniques that provide highly efficient exploration of shale gas, which support technical decisions, as well as environmental protection technology [30]. In addition, Reynolds and Umekwe [35] argued that the relationship between the production of shale gas and shale oil depends on whether compliments or substitutes in production might affect the promising field of technological development of future unconventional petroleum sources.
Curtis [31] studied productivity gains after the natural gas and crude oil price crash in late 2014. The study suggested that technological developments and cuts in service costs caused this productivity gain. Specifically, the study showed increasing trends in initial production and the EUR of a shale petroleum well based on increased horizontal drilling and fractured lengths from 2014 to 2016. Furthermore, the study included other aspects of technological developments that could be initiated by pressure to cut service costs such as reduced drilling and completion times, more efficient design of completion (fracturing and treatment), and more precise lateral placement. Thus, the shale petroleum industry seemed to develop production technology more efficiently and productively between 2014 and 2016. Moreover, Curtis and Montalbano [32] argued for the potential of the development of production technology in the shale petroleum industry by introducing “known unknowns” for technological development. West [18] reviewed recent technological developments and various factors for optimizing the production process, finding that the latest technological developments address not only the EUR or IP of a well, but also the problems affecting productivity on a production site (or Christmas tree) unit. For example, the study addressed a “parent-child issue” that affects the productivity of developed wells near the same production site (or Christmas tree). Moreover, the study showed many possibilities for technological development in the shale petroleum industry given that academic R&D activities focused only on petroleum physics, with many areas still undeveloped. These activities grew 16% over the previous year (2019).
The rest of this paper is organized as follows. Section 2 outlines the methodology and data by describing the equations to analyze the patent data, as well as the descriptive statistics of the data. Section 3 presents the results of the analysis and suggests the interpretation of these results, while Section 4 provides a summary, discussion of the interpretation, and conclusion of the study.

2. Methodology and Data

This study conducted an association rules analysis to determine the relationship between technological classification indexes of patents by referring to previous studies [36,37,38,39]. The result can be described as a network of the components of the shale and tight petroleum industry’s production technology. This suggested result, based on the association rules analysis, will show the development path of the shale and tight petroleum industry’s production technology with a statistical inference of the technology classification index. The calculations and visualizations of the association rules are based on the “R project” [40] with the packages ‘arules’ [41] and “arulesViz” [42].

2.1. Association Rules

The association rules analysis is a mining method that analyzes relationships among components of independent entities. Here, the component is called an item (i) and the entity is called a transaction. For example, patents as transactions contain at least one technological classification index as an item but usually contain more than one. Each technology classification index of a patent represents the patent as a component of the technology. Thus, the association rule can be used to describe a specific technology of an industry with a composition of technological components, a collaboration of technological components, and a relationship between technological components by analyzing the co-occurrence of items in each patent.
An association rule consists of three main concepts: support, confidence, and lift. Support shows the probability of the occurrence of a relationship. In other words, support represents the composition of a technological component or the collaboration of technological components. Support can be expressed as in Equation (1) below.
s u p p o r t ( i x i y ) = P ( i x i y )
Support indicates the probability of a transaction including i x and i y simultaneously in a dataset. It can be calculated by dividing the number of transactions that simultaneously include i x and i y by the total number of all transactions. Support can also show the reverse version of the same probability [37].
Confidence represents the direction of the relationships between items. Confidence can be expressed as in Equation (2) below.
c o n f i d e n c e ( i x i y ) = P ( i y | i x ) = P ( i x i y ) / P ( i x )
Confidence is the conditional probability of i y with a given i x . It shows different values in the opposite direction. Therefore, the difference in the confidences of some items reflects the direction of the relationship among items [37].
Lift represents the extent of the relationship between items. Lift can be expressed as in Equation (3) below.
l i f t ( i x i y ) = c o n f i d e n c e ( i x i y ) / s u p p o r t ( i y ) = P ( i x i y ) / P ( i x ) P ( i y )
The value of lift determines the nature and extent of the relationship depending on whether it is bigger than zero or smaller than positive infinity. For example, a lift of less than 1 between two items, x and y, means that the relationship between the two items is substitutional. However, when lift is equal to 1, then the relationship between the two items is independent. In contrast, when lift is bigger than 1, it means the relationship between the two items is complementary [37].

2.2. Data Collection
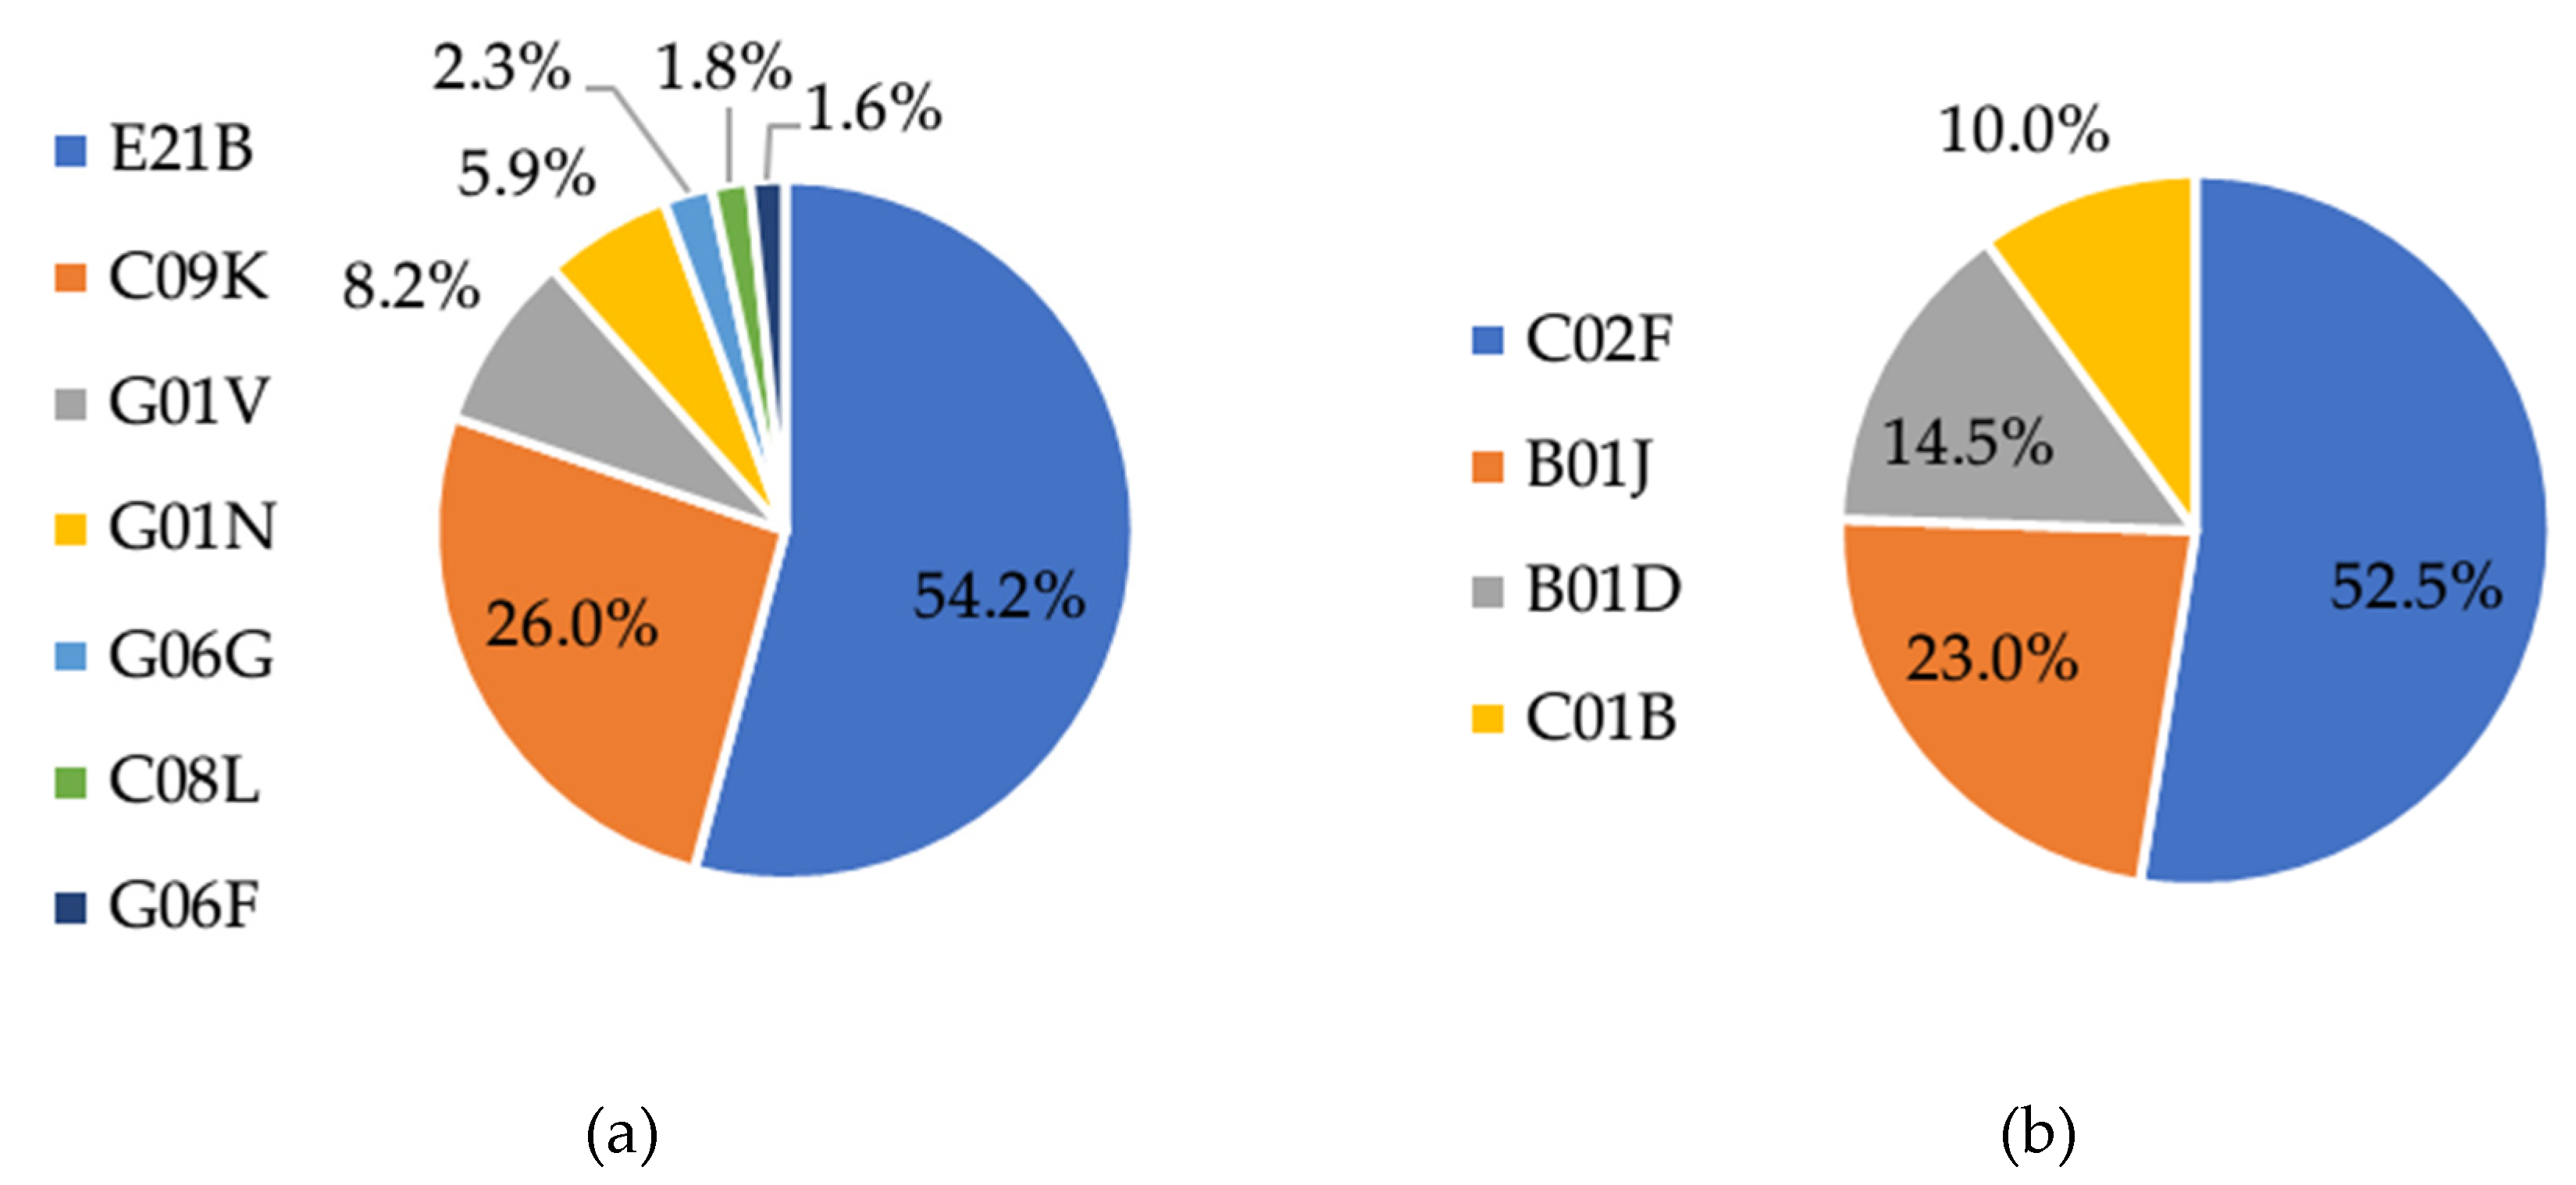
This study began with a sample of 757 patents applications from 1972 onwards. These were found through a search query on the Korea Intellectual Property Rights Information Service web database [43]. The dataset included 532 granted patents, and the remaining rejected patents were excluded to ensure confidence in the qualified data by the US national patent office. In Figure 1, the blue line represents the annual number of patent applications ordered by application date, and the orange line represents the annual patents granted ordered by application date. The gray dash represents the annual number of granted patents divided by the annual number of applications. The gray box indicates the period during which data was excluded from the analysis.
As shown in Figure 1, the sample includes 503 patents from the retrieved dataset with application dates between 1 January 1972 and 31 December 2016, given that the first granted patent of the dataset was recorded in 1972. In addition, patent applications after 31 December 2016 were excluded because many omitted patents can exist for three years.
The number of retrieved patents is substantially smaller than that of a similar previous study conducted by Wei et al. [29]. This is because this study distinguishes between shale (and tight) petroleum and other unconventional resources that can be produced by applying viscosity-reducing technologies, such as heavy oil, oil shale, and oil sand. In addition, immature hydrocarbons such as kerogen, tar shale, and coal tar, among others, require an upgrading process [15]. Table 1 presents more detail on this study’s data collection process.
The collected patents includes explicit information about the country of the patent office, filing date of the application, application number, date of publication, publication number, date of registration, registration number, date of international registration, international patent classification (IPC) code [44], cooperative patent classification code, kind code, applicant, inventor, assignee, title, abstract, claim, and patent family. In addition, this study includes patent data registered only in a US patent office to shed light on the innovation activities of the technological frontier country.
This study attempted to collect patents for technologies in the upstream shale and tight petroleum industry, which focuses on the production of resources and the chemical processing of feeds before the refining process. The query used consisted of various keywords and technology classification indices (IPCs). Table 1 presents the contents of the query, which are based on previous studies [29,30,44,45].
As shown in Table 1, the search query included two groups of keywords suggested in previous studies [29,30]. The keywords included tight gas, tight oil, and others, to include patents related to shale petroleum and reservoirs in the retrieved dataset, while the other keywords consisted of heavy oil, oil sand, oil shale, kerogen, tar sand, and others, to exclude patents related to unconventional energy resources in the retrieved dataset. Lastly, technology indices were used to prevent the inclusion of noise data that represents other industries with the same keywords as the shale petroleum industry, such as agriculture and fishing, food and grocery, and medical. In addition, the search query excluded patents that include the IPCs of industries that are not related to the shale and tight petroleum industry. The industries related to the IPCs in Table 1 are shown in Appendix A [45]. Thus, the search query retrieved patents that included any keywords related to shale (or tight) oil, gas, and reservoir, but not keywords or technology indices related to other unconventional resources or other industries.

3. Results

This study analyzed the patent data of the US shale and tight petroleum industry from the beginning of 1972 to the end of 2016. This section reports the results of the association rules analysis and the statistical description of the dataset. The following sub-sections provide evidence for the technological development of the shale and tight petroleum industry, focusing particularly on stimulation and fracturing techniques.
The analysis revealed some meaningful changes in the statistical value of the data. Therefore, the reporting focuses on showing the differences between the end of the research period and the time at which meaningful changes became apparent.

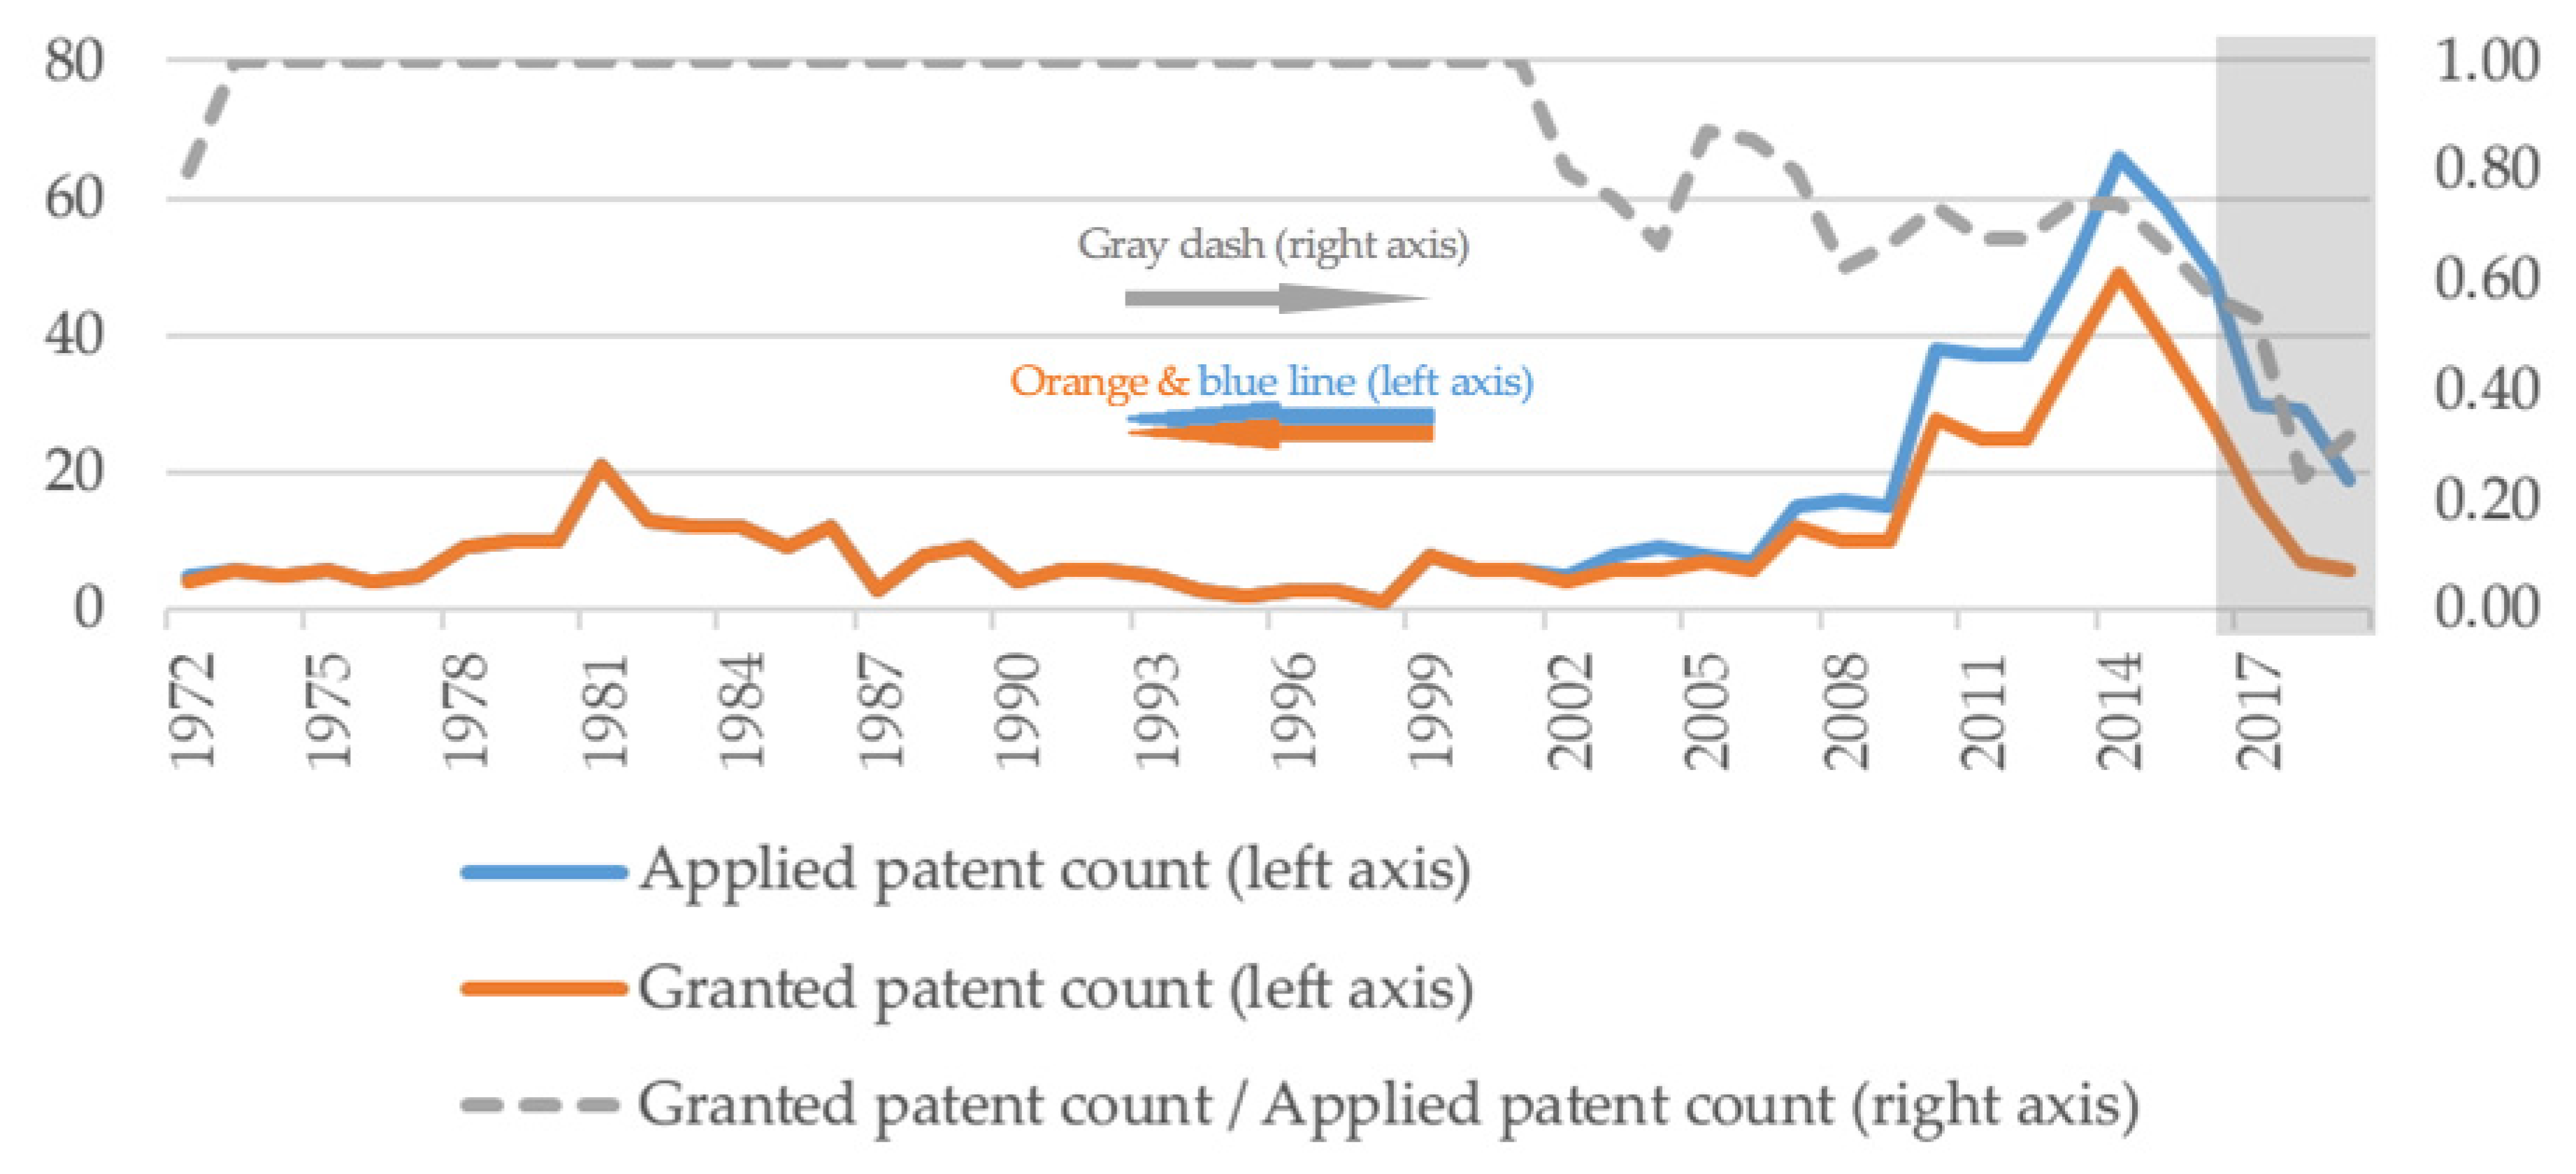
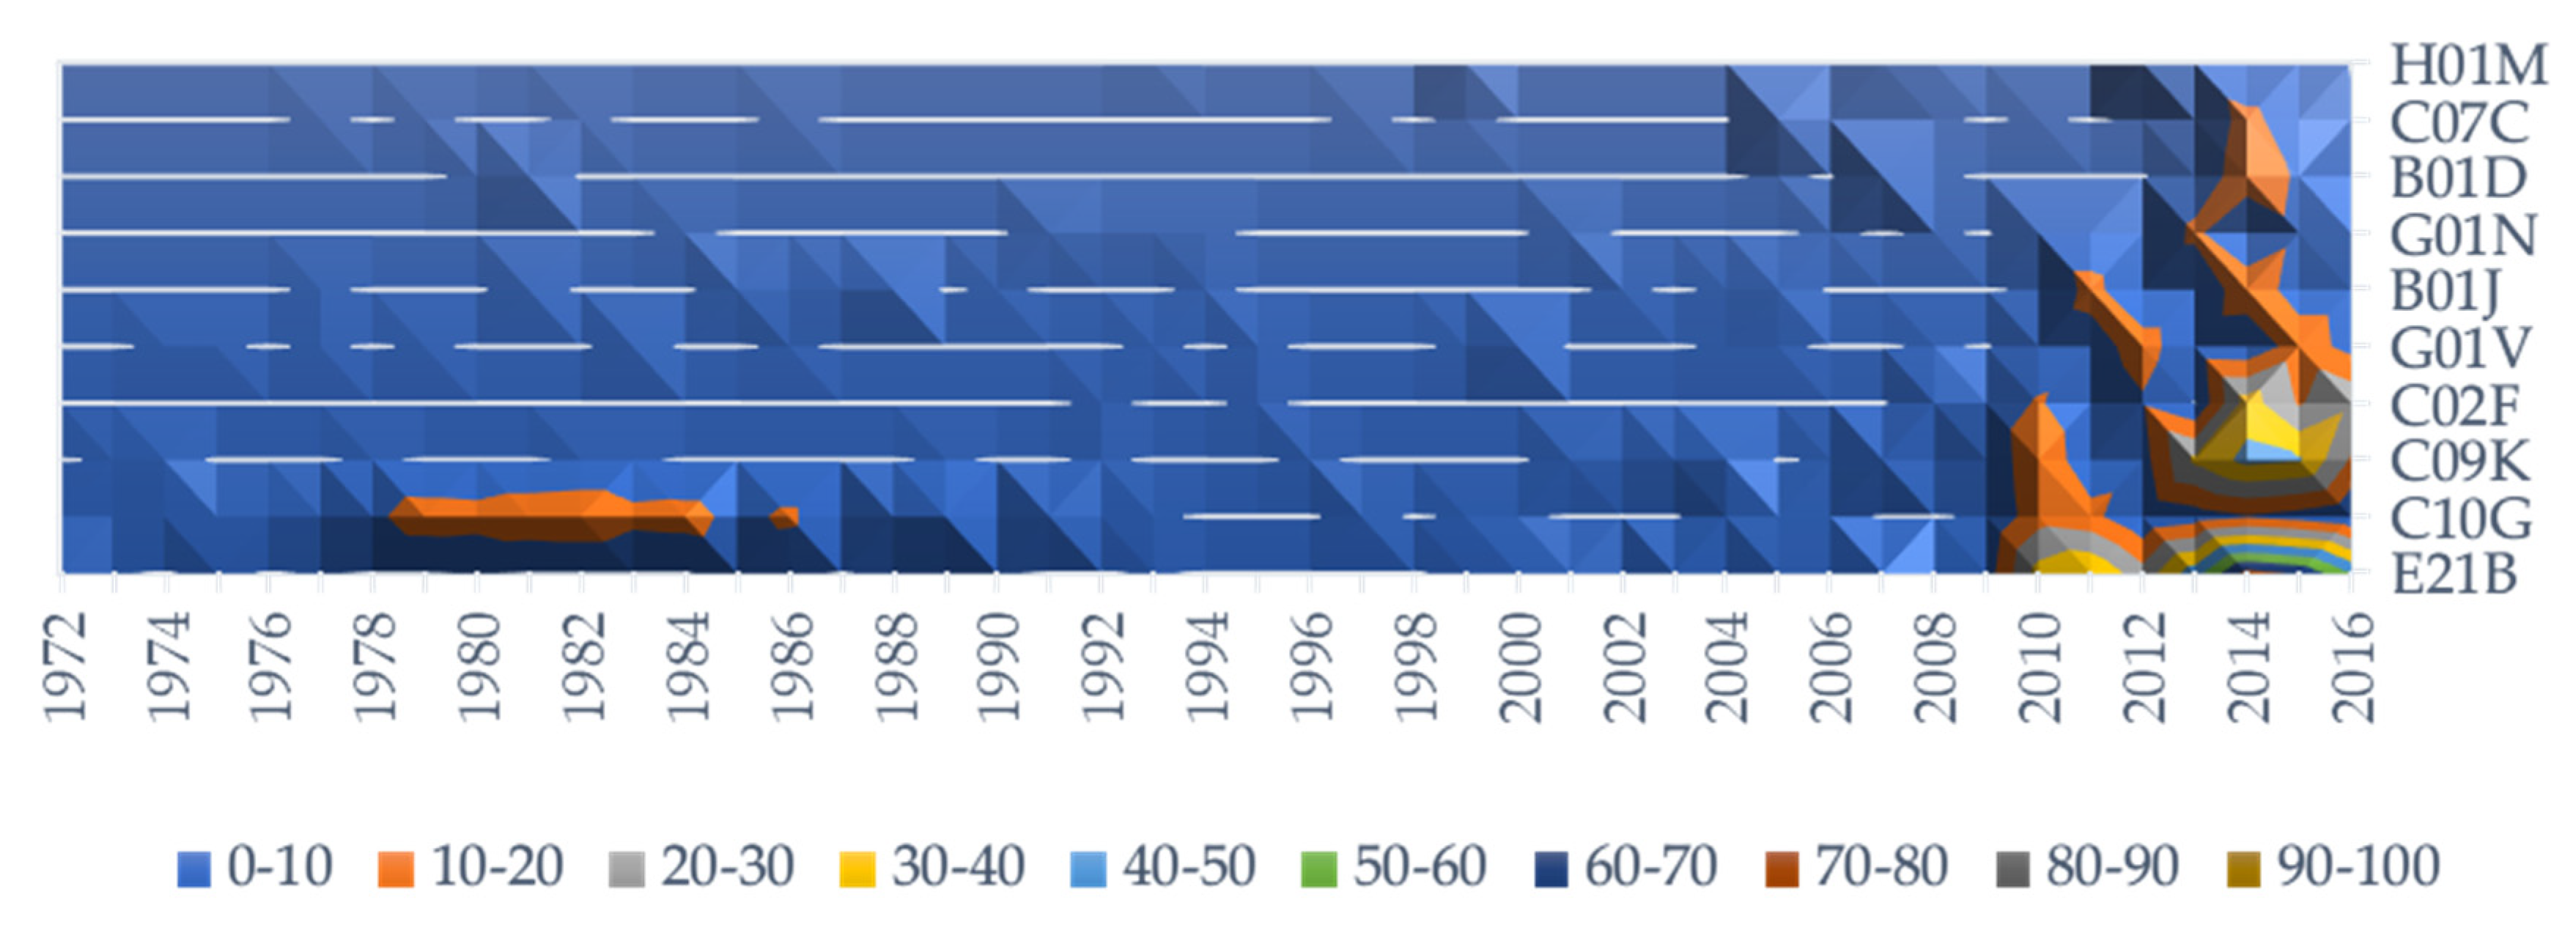
3.1. Statistical Description of the Data

This study found meaningful statistical changes in the dataset within the innovation activity area. It first seemed more difficult and complex to gain a patent for inventions after 2002. This is shown in Figure 1, which illustrates that the ratio of granted patents to patent applications decreased after 2002. However, the average number of cited IPCs in a patent shows an increasing trend from 2002 in Figure 2.
After 2009, the count of annual patent applications and grants increased remarkably, as seen in Figure 1. This change shows that the US shale and tight petroleum industry invested in intensive R&D to advance its technology after the successful trial of a new fossil energy business model based on shale petroleum in 2007. Moreover, the critical area of technological development changed from C10G (chemical process for the production of petroleum) to E21B (related to apparatus or method for obtaining petroleum), C09K (related to chemical composition for borehole or well), and C02F (related to water treatment) after 2009, as shown in Figure 3.
There are some interesting changes around 2002 and 2009. E21B and C09K, which are the main technological domains from 2009 to 2016, were invented around 2002, as shown in Figure 3. Then, the magnitude of development of these technological domains increased after 2009, as can be seen in the same figure. Thus, this study assumes that the shift in the main technological domain occurred around 2002 and that the intensive innovation of the shale petroleum industry began in 2009. Therefore, to understand the progress of technological innovation, this study will compare the results of the association rules analyses and statistics of 2002, 2009, and 2016.

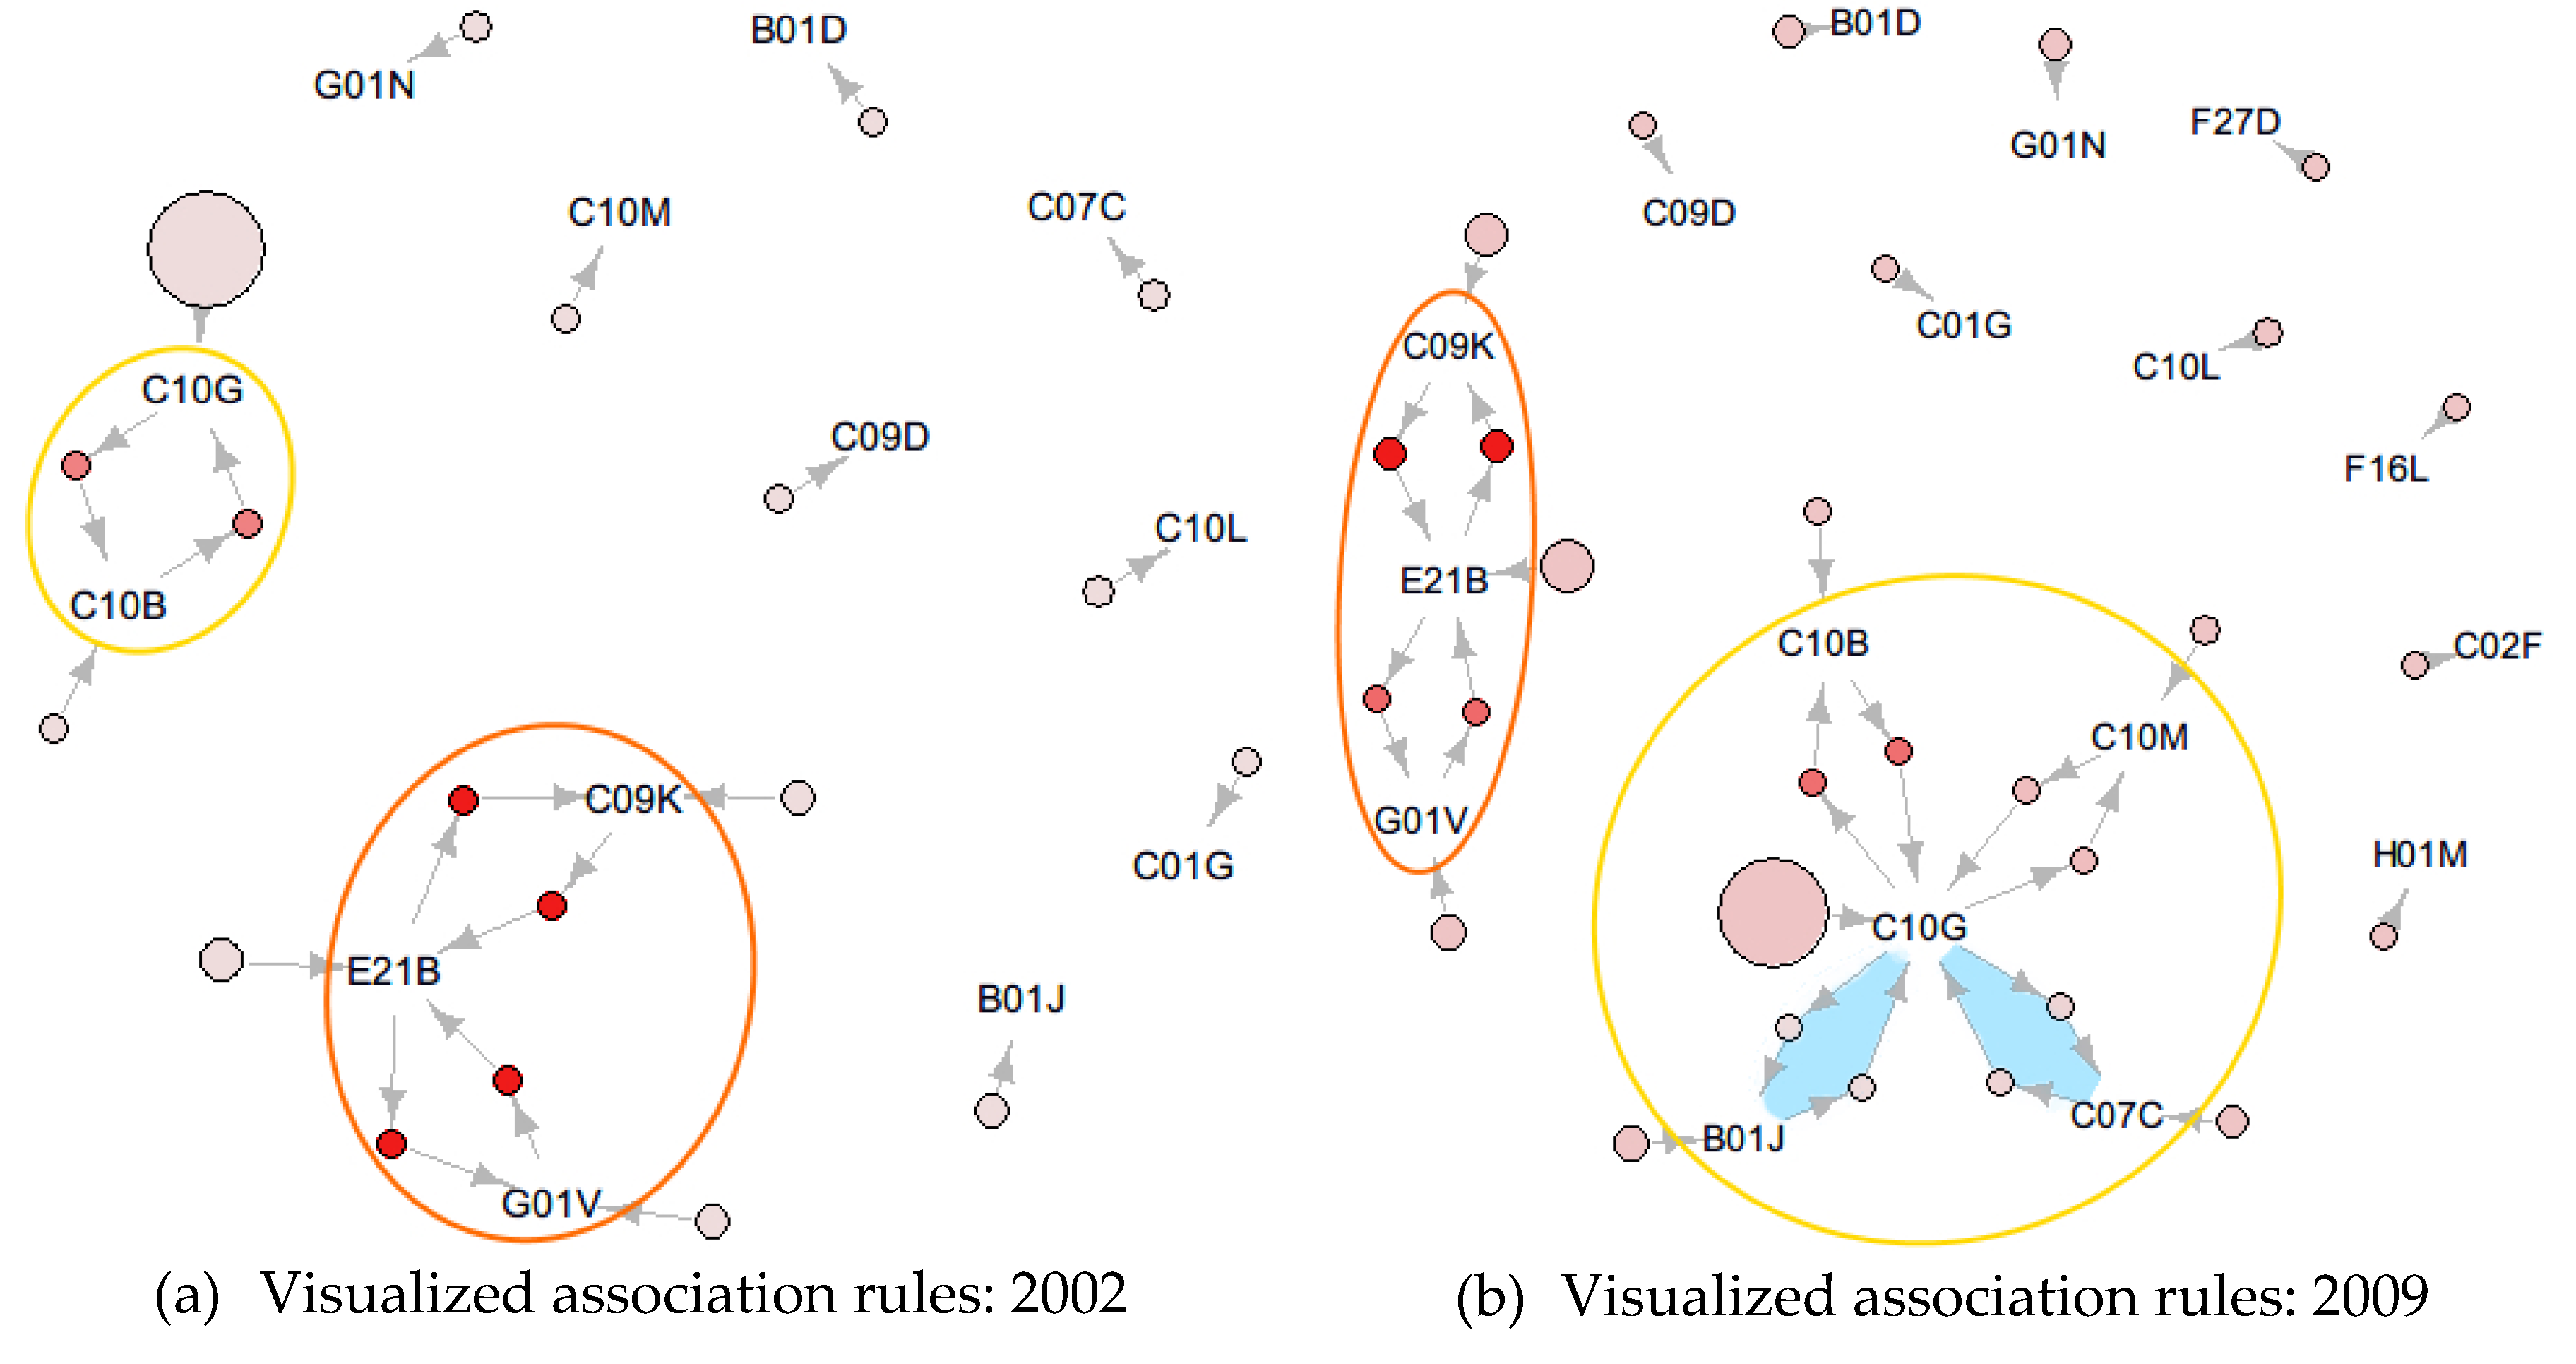
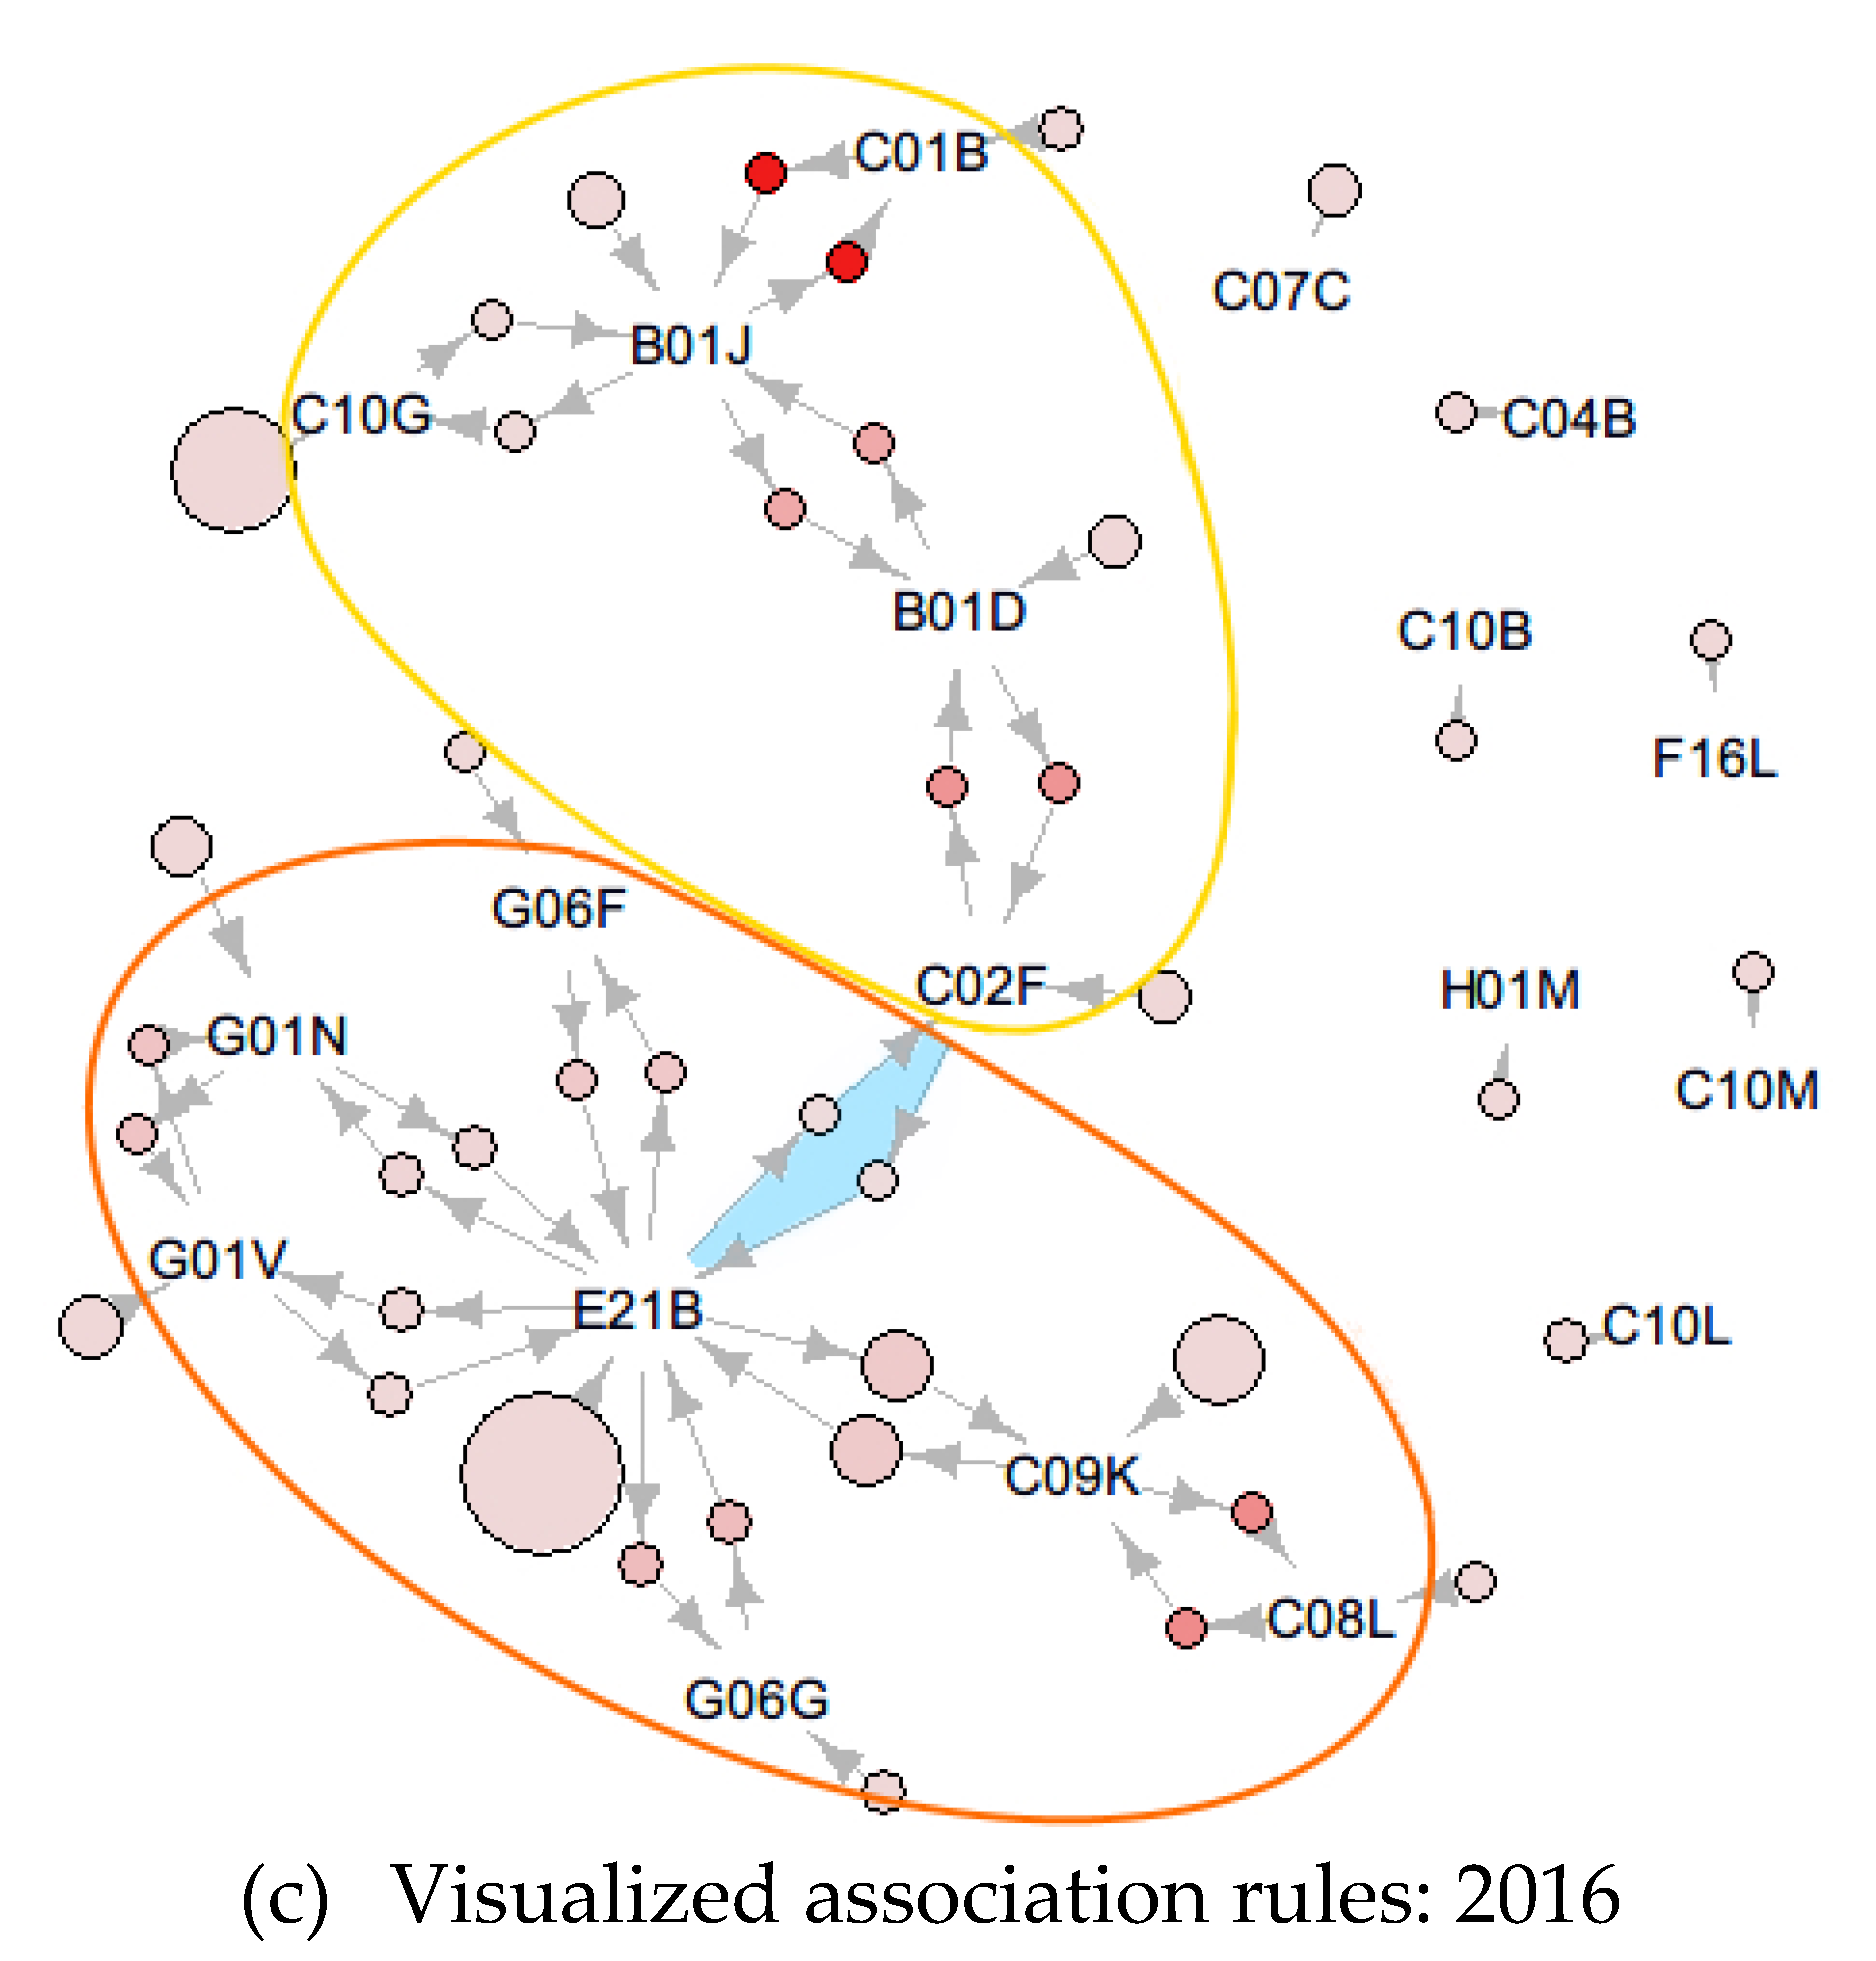
3.2. Association Rules Analysis

This section visualizes and presents the association rules based on the cumulative co-occurrence of IPCs (since 1972) whose confidence and support are greater than or equal to 0.01. Before looking at the empirical results, the visualized result indicates some notable characteristics. In Figure 4, the larger, darker circles reflect higher support values and deeper IPC codes with bigger lift values, respectively.
As Figure 4a shows, the association rules of 2002 show that most of the IPCs exist independently and that five IPCs have relationships with other IPC codes, as shown by the two separate groups. In Figure 4b, the association rules of 2009 show similar patterns to those of 2002. However, new relationships appear around C10G. The blue marks indicate substitutive relationships among the IPCs; that is, C07C (acyclic or carbocyclic compounds) and B01J (chemical or physical process or apparatus for catalysis, colloid chemistry, and others) have substitutive relationships with C10G (chemical process for production of petroleum), while C10M (lubricating compositions) has a complementary relationship with C10G.
In detail, the new relationships in 2009 between C10M and C10G are relatively less complementary compared to the incumbent relationships. The lift of the relationship between C10M and C10G is 1.100 in Table 2. The value of the substitutive relationships of C10G with C07C and B01J are 0.770 and 0.642, respectively.
In Table 2, some association rules—those that are independent and have no relationship to other IPCs—are omitted. The support and lift values of these rules are the same within the relationship, but the confidence values are different. The difference in confidence values means that the i y with the higher confidence value is the foundation of the relationship. Additionally, E21B always has higher confidence within its relationships. Thus, E21B is located at the center of every visualized association rule.
Figure 4c indicates numerous changes in the relationships between the IPCs of 2016 compared to those of 2009. First, C10G is located outside the networks, while B01J is located at the center of one of the networks and has a substitutive relationship with C10G. Moreover, B01J has directly complementary relationships with C01B (non-metallic element or compounds) and B01D, and indirectly complementary relationships with C02F (treatment of water, waste water, sewage, or sludge) through B01D. Additionally, in the 2016 visualization, B01J is located at a more central position compared to that of 2009. Interestingly, the relationships between B01D, B01J, C01B, and C02F show a strong complementary nature with high lift values. The lift values of B01J with C01B, B01D with C02F, and B01D with B01J are 9.581, 5.249, and 4.024, respectively, as shown in Table 2. E21B has a substitutive relationship with C02F and B01J, with lift values of 0.741 and 0.954, respectively, as shown in Table 2. The complementary relationships of E21B in 2016 increased notably compared to 2009. E21B has directly complementary relationships with G06G (analogue computers), G06F (electric digital data processing), and G01N (investigating or analyzing materials), and an indirectly complementary relationship with C08L (compositions of macromolecular compounds). The relationship between E21B and G06G is stronger than other relationships of E21B, even those after 2009, because the extent of technological development in the seven years following 2009 was sufficiently intensive, resulting in new, stronger technological combinations. As Table 3 shows, about 70% of the citations of IPCs for the whole period occurred after 2009, and most IPCs, except for C10G, occurred after 2009. Similarly, the annual patent count, average number of cited IPCs, and annual citations of the most frequently cited IPCs rapidly increased from 2009, as shown in Figure 1, Figure 2 and Figure 3.
In sum, we found two interesting statistical changes in the dataset in 2002 and 2009. Then, we checked the relationship between the IPCs of 2002, 2009, and 2016 and found differences in the analyses of each year. Table 4 summarizes the changes in the IPC network. For convenience, the names of the networks are denoted as in Table 4. In Figure 4, the most interesting findings are that C10G is not located at the center of the 2016 IPC network and that E21B is consistently located at the center of the IPC network in 2002, 2009, and 2016. Furthermore, in Figure 4, B01J occupies the central position of the 2016 IPC network. Additionally, in Figure 3, not only do the cited counts of E21B and C09K show a remarkably increasing trend after 2009, but the citations of C02F that have a complementary relationship with B01J also show a similar trend after 2009.

4. Discussion

This section focuses on the technological developments that occurred from 2010 to 2016. The reason for focusing on changes after 2009 is that the US shale and tight petroleum industry has grown commercially since 2007. The technological development that occurred three years after the industrial growth are similar to those of Covert [33], who commented on the relatively insufficient innovation activity of shale and tight oil petroleum companies in the Bakken region. Additionally, the IPCs of Networks 1 and 3 (described in Table 4) occurred intensively after 2009, as shown in Table 3.
The analysis reveals several findings, supported by data in Appendix B, Appendix C and Appendix D, which describe the IPCs of Networks 1 and 3. First, the results show that 54.2% of the IPCs of Network 1 consist of E21B, as in Figure 5. In addition, in Table 2, E21B always has higher confidence in its associations with the other IPCs of Network 1. Therefore, E21B can be explained by the fundamental and critical technology of Network 1, representing the purpose of technological development, and is supported by other technologies. In addition, E21B consists of many sub-level classifications related to various purposive technologies in industries producing natural resources. E21B43, which is related to methods or apparatus used to obtain resources, consists of 64.4% of E21B codes that represent the purposive subject of invention, as Appendix B and Appendix C show. Moreover, the other E21B sub-level IPCs are related to testing, surveying, drilling, equipment for producing or sealing borehole, and others. The other IPCs of Network 1, such as C09K and G01V, feature in other technology capable of combining with resources production technology. Appendix B provides descriptions of the Network 1 IPCs, which show some similarities. C09K and C08L relate to the compositions of borehole or well treatments or drilling. G01V and G01N relate to detection or investigation technologies. G06G and G06F relate to calculations or data processing.
In Table 2, C08L and C09K have a complementary relationship, with a 5.599 lift value. Similarly, C09K and E21B have a complementary relationship, with a 1.845 lift value. Thus, E21B has an indirect relationship with C08L through C09K, as Figure 4c shows, whereas there is no node for C08L in Figure 4a,b with regard to association rules prior to 2010. Thus, these differences in the relationships between E21B and C09K and C08L show that the US shale and tight petroleum industry realized technological developments, particularly in the usage of chemical compositions for treating or drilling boreholes or wells by utilizing macromolecular compounds.
In Table 2, G01N and G01V have a complementary relationship, with a 2.358 lift value. Likewise, G01N and G01V have a complementary relationship with E21B. Accordingly, the relationships of E21B, G01N, and G01V represent technological development trends since 2010, showing that the US shale and tight petroleum industry realized notable technological developments in the investigation of underground formation properties using magnetic or electronic methods.
In Table 2, there is no association rule between G06G and G06F; even the descriptions of the IPCs are similar. Compared to the cases of G01N with G01V and C09K with C08L, data processing and calculation technologies in the US shale and tight petroleum industry developed separately depending on whether the data were digital or analog.
Comprehensively, Network 1 shows that technological developments focused on the combination of resource production techniques (E21B43) with other specialized methods (C09K, G01V, G01N, G06G, C08L, and G06F) from 2010 to 2016. Therefore, we suppose that the Network 1 technologies played the most critical role in the US shale and tight petroleum industry, being more frequently used to invent combinations of specialized technologies for chemical compositions, data processing, and so on.
Second, Network 3 (and Network 2) have appeared (and disappeared) since 2010, as shown in Table 4. Therefore, we suppose that the economic use of Network 3 technologies were developed for shale and tight petroleum production. In Figure 5, C02F is the most frequently cited, at 52.5% of Network 3 IPCs. B01J, which is related to chemical or physical processes of sorbents or catalysts, has a 23.0% share, B01D (technologies of separation) has a 14.5% share, while C01B (non-metallic elements or compounds) has a 10% share. Interestingly, C02F is the most frequently cited IPC, while C02F is located outside Network 3. In Table 2, C02F has a lower confidence value in association with B01D, while B01D has a lower confidence value in association with B01J. Subsequently, C02F does not take a central position in Network 3, but rather, B01J does. Thus, we suppose that C02F represents the purposive subject of Network 3. Moreover, it appears that C02F is not a critical technology of Network 3, whereas B01J is. Appendix D describes C02F (water, water waste, or sludge treatment technologies) and B01J (separation technologies for liquid, gases, solvents, solids, etc.).
This study also addresses issues in prominent fields in the technological development of the US shale and tight petroleum industry. According to Wei et al. [30], treatment technologies are a promising avenue for the industry. However, the present study showed that water treatment was one of the most frequently developed technologies in the US from 2010 to 2016. This disagreement regarding water treatment may be due to differences in retrieval queries; that is, it is caused by the inclusion (or not) of exclusion keywords related to other unconventional resources. In addition, Wei et al. [30] suggested that production technology for in situ heat conversion processes is critical technology after analyzing the full forward citation matrix of the retrieved patent data. However, in this study, only 3.6% of IPC E21B36 (heating or cooling apparatus or methods) consisted of the whole cited E21B count since 2010. This low portion of E21B36 could imply that the in situ heat conversion process is not a promising production technology for the shale petroleum industry because the critical mechanism for producing shale gas and tight oil is the enhancement of the permeability of product formation [14]. However, in situ heating technologies for unconventional petroleum production aims to reduce the viscosity of petroleum [15].
Additionally, this study suggested that the most frequently developed technologies are those related to obtaining resources, surveyance or investigation, data processing, testing or sampling, and treatment of water waste or sludge. According to Holditch [13], Curtis and Montalbano [32], and West [18], these technologies contributed to productivity gains in the US shale and tight petroleum industry. Thus, the authors believe that the technological development trend of the US shale petroleum industry will continue until shale petroleum is depleted. Moreover, even if the sweet spot of the US shale petroleum decreases, recent developments in shale petroleum production technologies could be applied to deeper formations containing shale petroleum. If shale petroleum production is largely affected by the remaining amount of investigated and producible resources, then according to Reynold [19], technological development in the shale petroleum industry will be critical for increasing recoverable resources.

5. Conclusions

This study conducted an association rules analysis of the US shale and tight petroleum industry’s patent data. The results indicate numerous technological developments based on R&D activities since 2010. The most notable technological advancements occurred in fields related to obtaining resources, surveyance or investigation, and data process This technological domain, which was built from 2010 to 2016, has partly appeared since 2002 in areas such as the obtaining process or apparatus of hydrocarbons and compositions for treating or drilling artificial holes (borehole or well). Interestingly, this early emergence of promising technology appeared soon after the beginning of the industry’s growth. Moreover, the main area of technological development in the shale petroleum industry from 1972 to 2002 is not associated with exploration technology. This sequence of changes in technological development in the shale petroleum industry reflects the features of unconventional resources that are explored but difficult to produce. Moreover, this study is valuable as it shows the trends in the shale petroleum industry’s technological development that began approximately two decades ago, in the early 2000s. This is important because there is a debate about which area the shale industry should focus on in its technology development, as there are sufficient reserves of shale oil that can be produced to create added value through technological development. Nonetheless, it is worth noting that this study has a limitation in that it did not separate the technologies in much detail, which should be included in future research.

Author Contributions

Conceptualization, J.-H.K. and Y.-G.L.; methodology, J.-H.K.; software, J.-H.K.; validation, J.-H.K. and Y.-G.L.; formal analysis, J.-H.K.; investigation, Y.-G.L.; resources, Y.-G.L.; data curation, J.-H.K.; writing—original draft preparation, J.-H.K.; writing—review and editing, Y.-G.L.; visualization, J.-H.K.; supervision, Y.-G.L.; project administration, Y.-G.L.; funding acquisition, Y.-G.L. All authors have read and agreed to the published version of the manuscript.

Funding

This research has been funded by National Research Foundation (NRF-2018S1A3A2075175).

Conflicts of Interest

The authors declare no conflict of interest.

Appendix A

Description of IPCs included in the search query [40]
Industries
Agriculture and fishing; Food and agriculture; Beverage; Cigarette; Textile product; Clothes, accessory clothes, and fur product; Leather, bag, and shoes manufacturing; Print and recording media reproduction; Insecticide and pesticide; Medical material and medicine; Medical instrument and machine; Glasses, photograph instrument, and optical instrument; Clock and clock component; Home instrument and machine; Office instrument and machine; Aircraft; Combat vehicle; Motorcycle; Furniture; Other instrument and machine.

Appendix B

Description of Network 1 IPCs cited since 2010 [41].
IPC
(Cited Count)
Description
E21B(337)Earth or rock drilling; Obtaining oil, gas, water, slurry, and so forth from well
C09K(162)Compositions for treating or drilling boreholes or wells
G01V(51)Detecting through seismic, electric, or magnetic methods
G01N(37)Investigating or analyzing chemical or physical properties
G06G(14)Computing with analog computers
C08L(11)Compositions of macromolecular compounds
G06F(10)Digital data processing
IPC
(Proportion)
Description
E21B43
(64.4%)
Methods or apparatus for obtaining resources such as oil, gas, water, soluble, or meltable materials, and slurries of minerals from wells
E21B49
(8.0%)
Methods or apparatus for testing (or sampling) borehole or well fluids or formations
E21B47
(7.1%)
Surveyance of boreholes or wells
E21B33
(4.5%)
Sealing or packing of boreholes or wells
E21B41
(3.6%)
Equipment for obtaining oil, gas, water, slurry, etc., from wells
E21B21
(3.6%)
Methods or apparatus for flushing boreholes
E21B7
(3.0%)
Special methods or apparatus for drilling
(e.g., directional drilling, flame drilling, driving casing or pipe into borehole, etc.)
E21B36
(2.7%)
Methods or apparatus for heating, cooling, or insulating arrangements for boreholes or wells
E21B37
(0.6%)
Methods or apparatus for cleaning boreholes or wells
E21B25
(0.6%)
Apparatus for obtaining or removing undisturbed cores, e.g., core barrels, core extractors
E21B17
(0.6%)
Drilling apparatus
(e.g., drilling rods or pipes, flexible drill strings, kellies, drill collars, sucker rods, casings, tubing)
E21B44
(0.3%)
Automatic control or monitoring systems for drilling or operation
E21B4
(0.3%)
Drives for drilling, used in the borehole
E21B34
(0.3%)
Valve arrangements for boreholes or wells
E21B28
(0.3%)
Vibration generating arrangements for boreholes or wells
(e.g., stimulating production)
E21B19
(0.3%)
Handling rods, casings, tubes, or the like outside the borehole

Appendix C

Additional description of Network 1’s E21B segments cited since 2010 [41].

Appendix D

Description of Network 3 IPCs cited since 2010 [41].
IPC
(Cited Count)
Description
C02F(105)Treatment of water, water waste, or sludge
B01J(46)Chemical or physical processes
(e.g., catalysis, colloid chemistry)
B01D(29)Separation of liquids, gases, solvents, solids, etc.
C01B(20)Non-metallic elements or compounds

References

  1. Florence Geny. Can Unconventional Gas Be a Game Changer in European Gas Markets? Oxrford Institute for Energy Studies, 2010. Available online: https://ora.ox.ac.uk/objects/uuid:6de550f8-8b8f-43e9-a091-e2b0ecbc6b82 (accessed on 3 August 2020).
  2. The U.S. Energy Information Administration. Annual Energy Outlook 2020. 2020. Available online: https://www.eia.gov/outlooks/aeo/pdf/AEO2020%20Full%20Report.pdf (accessed on 3 August 2020).
  3. EIA Adds New Play Production Data to Shale Gas and Tight Oil Reports. Available online: https://www.eia.gov/todayinenergy/detail.php?id=38372 (accessed on 3 August 2020).
  4. Munasib, A.; Rickman, D.S. Regional economic impacts of the shale gas and tight oil boom: A synthetic control analysis. Reg. Sci. Urban Econ. 2015, 50, 1–17. [Google Scholar] [CrossRef] [Green Version]
  5. Paredes, D.; Komarek, T.; Loveridge, S. Income and employment effects of shale gas extraction windfalls: Evidence from the Marcellus region. Energy Econ. 2015, 47, 112–120. [Google Scholar] [CrossRef]
  6. Wang, Q.; Chen, X.; Jha, A.N.; Rogers, H. Natural gas from shale formation—The evolution, evidences and challenges of shale gas revolution in United States. Renew. Sustain. Energy Rev. 2014, 30, 1–28. [Google Scholar] [CrossRef]
  7. Cooper, J.; Stamford, L.; Azapagic, A. Shale gas: A review of the economic, environmental, and social sustainability. Energy Technol. 2016, 4, 772–792. [Google Scholar] [CrossRef]
  8. Trisha Curtis. US Shale Oil Dynamics in a Low Price Environment. Oxrford Institute for Energy Studies, 2015. Available online: https://www.oxfordenergy.org/wpcms/wp-content/uploads/2015/11/WPM-62.pdf (accessed on 3 August 2020).
  9. Castro-Alvarez, F.; Marsters, P.; de León Barido, D.P.; Kammen, D.M. Sustainability lessons from shale development in the United States for Mexico and other emerging unconventional oil and gas developers. Renew. Sustain. Energy Rev. 2018, 82, 1320–1332. [Google Scholar] [CrossRef] [Green Version]
  10. International Energy Agency. World Energy Outlook 2009; International Energy Agency: Paris, France, 2009. [Google Scholar]
  11. Pápay, J. Exploitation of Light Tight Oil Plays. Nafta 2014, 65, 231–237. Available online: https://core.ac.uk/download/pdf/33272860.pdf (accessed on 3 August 2020).
  12. Rogers, H. Shale gas—The unfolding story. Oxford Rev. Econ. Policy 2011, 27, 117–143. [Google Scholar] [CrossRef]
  13. Holditch, S.A. Unconventional oil and gas resource development–Let’s do it right. J. Unconv. Oil Gas Resour. 2013, 1, 2–8. [Google Scholar] [CrossRef]
  14. Holditch, S.A. Tight gas sands. J. Pet. Technol. 2006, 58, 86–93. [Google Scholar] [CrossRef]
  15. Symington, W.A.; Kaminsky, R.D.; Meurer, W.P.; Otten, G.A.; Thomas, M.M.; Yeakel, J.D. Oil Shale: A Solution to the Liquid Fuel Dilemma, ExxonMobil’s Electrofrac™ Process for In Situ Oil Shale Conversion; ACS Publications: Washington, DC, USA, 2010; pp. 185–216. [Google Scholar]
  16. Acs, Z.J.; Audretsch, D.B. Patents as a measure of innovative activity. Kyklos 1989, 42, 171–180. [Google Scholar] [CrossRef]
  17. Seymore, S.B. Rethinking Novelty in Patent Law. Duke Law J. 2011, 60, 919–976. [Google Scholar]
  18. Rob West. Prospects for US Shale Productivity Gains. Oxford Institute for Energy Study, 2019. Available online: https://www.oxfordenergy.org/wpcms/wp-content/uploads/2019/10/Prospects-for-US-shale-productivity-gains.pdf (accessed on 3 August 2020).
  19. Reynolds, D.B. The mineral economy: How prices and costs can falsely signal decreasing scarcity. Ecol. Econ. 1999, 31, 155–166. [Google Scholar] [CrossRef]
  20. Reynolds, D.B. US Shale-Oil Hubbert Production Peak: Civilization’s Ultimate Energy Forecast. 2020. Available online: https://papers.ssrn.com/sol3/papers.cfm?abstract_id=3640412 (accessed on 3 August 2020).
  21. Horn, M. OPEC’s optimal crude oil price. Energy Policy 2004, 32, 269–280. [Google Scholar] [CrossRef]
  22. Umekwe, M.; Baek, J. Do oil prices really matter to US shale oil production? Energy Sources Part B Econ. Plan. Policy 2017, 12, 268–274. [Google Scholar] [CrossRef]
  23. Osborn, S.G.; Vengosh, A.; Warner, N.R.; Jackson, R.B. Methane contamination of drinking water accompanying gas-well drilling and hydraulic fracturing. Proc. Natl. Acad. Sci. USA 2011, 108, 8172–8176. [Google Scholar] [CrossRef] [PubMed] [Green Version]
  24. Romer, P.M. Endogenous technological change. J. Political Econ. 1990, 98, S71–S102. [Google Scholar] [CrossRef] [Green Version]
  25. Fukui, R.; Greenfield, C.; Pogue, K.; van der Zwaan, B. Experience curve for natural gas production by hydraulic fracturing. Energy Policy 2017, 105, 263–268. [Google Scholar] [CrossRef]
  26. Kim, J.; Lee, Y. Analyzing the Learning Path of US Shale Players by Using the Learning Curve Method. Sustainability 2017, 9, 2232. [Google Scholar]
  27. Kim, J.; Lee, Y. Learning Curve, Change in Industrial Environment, and Dynamics of Production Activities in Unconventional Energy Resources. Sustainability 2018, 10, 3322. [Google Scholar] [CrossRef] [Green Version]
  28. Zhang, M.; Guo, W.; Lei, Z. Patent analysis of shale gas technology in China and implications for its exploitation. Energy Technol. 2014, 2, 1040–1045. [Google Scholar] [CrossRef]
  29. ISED. Patent Landscape Report: Shale Oil and Gas. 2016. Available online: https://www.ic.gc.ca/eic/site/cipointernet-internetopic.nsf/vwapj/Shale-Oil-Gas-report-May-2017.pdf/$file/Shale-Oil-Gas-report-May-2017.pdf (accessed on 3 August 2020).
  30. Wei, Y.; Kang, J.; Yu, B.; Liao, H.; Du, Y. A dynamic forward-citation full path model for technology monitoring: An empirical study from shale gas industry. Appl. Energy 2017, 205, 769–780. [Google Scholar] [CrossRef]
  31. Trisha Curtis. Unravelling the US Shale Productivity Gains. Oxford Institute for Energy Studies. 2016. Available online: https://www.oxfordenergy.org/wpcms/wp-content/uploads/2016/11/Unravelling-the-US-Shale-Productivity-Gains-WPM-69.pdf (accessed on 3 August 2020).
  32. Trisha Curtis, Benjamin Montalbano. Completion Design Changes and the Impact on US Shale Well Productivity. Oxford Institute for Energy Studies, 2017. Available online: https://www.oxfordenergy.org/wpcms/wp-content/uploads/2017/11/Completion-Design-Changes-and-the-Impact-on-US-Shale-Well-Productivity-Insight-21.pdf (accessed on 3 August 2020).
  33. Covert, T. Experiential and Social Learning in Firms: The Case of Hydraulic Fracturing in the Bakken Shale. 2015. Available online: https://papers.ssrn.com/sol3/papers.cfm?abstract_id=2481321 (accessed on 3 August 2020).
  34. Ivan Sandrea. US Shale Gas and Tight Oil Industry Performance: Challenges and Opportunities. Oxford Institute for Energy Studies, 2014. Available online: https://www.oxfordenergy.org/wpcms/wp-content/uploads/2014/03/US-shale-gas-and-tight-oil-industry-performance-challenges-and-opportunities.pdf (accessed on 3 August 2020).
  35. Reynolds, D.B.; Umekwe, M.P. Shale-Oil Development Prospects: The Role of Shale-Gas in Developing Shale-Oil. Energies 2019, 12, 3331. [Google Scholar] [CrossRef] [Green Version]
  36. Jun, S.; Park, S.S.; Jang, D.S. Technology forecasting using matrix map and patent clustering. Ind. Manag. Data Syst. 2012, 112, 786–807. [Google Scholar] [CrossRef]
  37. Jun, S. Database Theory and Application, Bio-Science and Bio-Technology; IPC code analysis of patent documents using association rules and maps–Patent analysis of database technology; Springer: Berlin/Heidelberg, Germany, 2011; pp. 21–30. [Google Scholar]
  38. Agrawal, R.; Imieliński, T.; Swami, A. Mining Association Rules between Sets of Items in Large Databases. In Proceedings of the 1993 ACM SIGMOD International Conference on Management of Data, Washington, DC, USA, 26–28 May 1993; pp. 207–216. [Google Scholar]
  39. Han, J.; Pei, J.; Kamber, M. Data Mining: Concepts and Techniques; Elsevier: Amsterdam, The Netherlands, 2011. [Google Scholar]
  40. Team, R.C. R: A Language and Environment for Statistical Computing. 2013. Available online: https://www.R-project.org/ (accessed on 17 April 2020).
  41. Hahsler, M.; Buchta, C.; Gruen, B.; Hornik, K. arules: Mining Association Rules and Frequent Itemsets. 2019. Available online: https://cran.r-project.org/web/packages/arulesViz/index.html (accessed on 17 April 2020).
  42. Hahsler, M.; Chelluboina, S. arulesViz: Visualizing Association Rules and Frequent Itemsets. 2020. Available online: https://cran.r-project.org/web/packages/arules/index.html (accessed on 17 April 2020).
  43. KIPRIS Web Database Service of Patent Information. Available online: http://www.kipris.or.kr/khome/main.jsp (accessed on 17 April 2020).
  44. International Patent Classification Scheme. Available online: https://www.wipo.int/classifications/ipc/ipcpub/?notion=scheme&version=20200101&symbol=none&menulang=en&lang=en&viewmode=f&fipcpc=no&showdeleted=yes&indexes=no&headings=yes&notes=yes&direction=o2n&initial=A&cwid=none&tree=no&searchmode=smart (accessed on 17 April 2020).
  45. Table about Industrial Classification and IPC. Available online: https://www.kipo.go.kr/kpo/HtmlApp?c=4031&catmenu=m06_07_05 (accessed on 17 April 2020).
Figure 1. Innovation activity of the US shale and tight petroleum industry (39).
Sustainability 12 06628 g001
Figure 2. Average number of IPCs cited per patent.
Sustainability 12 06628 g002
Figure 3. Annual count of the top 10 most frequently cited IPCs from 1972 to 2016.
Sustainability 12 06628 g003
Figure 4. Visualized association rules for 2002 (a), 2009 (b), and 2016 (c).
Sustainability 12 06628 g004aSustainability 12 06628 g004b
Figure 5. Proportion of IPCs in Network 1 (a) and Network 3 (b) from 2010 to 2016.
Sustainability 12 06628 g005
Table 1. earch query contents.
FieldContentsLogic
Title, abstract, claimTight gas, tight oil, tight petroleum, tight sand, shale gas, shale oil, shale petroleum, shale formation, shale layerIncluded
Title, abstract,
claim
Heavy oil, oil sand, oil shale, kerogen, tar sand, tar shale, coal tar, coal mine, biofuelExcluded
IPC
(International Patent Classification)
A01B27/02, A01C, A01D, A01G, A01H, A01K, A21D, A23B, A23C, A23D, A23F, A23G, A23J, A23K, A23L, A23P, C12J, C13B, C13K, C12C, C12F, C12G, C12H, A24B, A24D, A24F, D04D, D04G, D04H, D06C, D06J, D06M, D06N, D06P, D06Q, A41B, A41C, A41D, A41F, A42B, A42C5, A43B, A43C, A45C, B68B, B68C, B41M, B42D, A01N, A01P, A61P, C07D, C07J, C07K, C12N, C12P, C12Q, C12R, A61K, A61B, A61C, A61D, A61F, A61G, A61H, A61J, A61L, A61M, A61N, A62B, B01L, B04B, C12M, G01T, G03B42, H05G, G02B, G02C, G03D, G02F2, G02F3, G02F7, G03B, G03C5, G03C9, G03C11, G03F, G04B, G04C, G04D, G04F, G04G, G04R, A45D, A47G, A47J, A47L, D06F, E06C, F24B, F24C, H05B, B41L, B41J1, G03G, G06C, G06M, G07B, G07C, G07D, G07G, B64B, B64C, B64D, B64F, B64G, F02K, F03H, F41H7, B62J, B62K11, B62M6, B62M7, A47B, A47C, A47D, A47F, A41G, A44B, A44C, A45B, A45F, A46B, A46D, A63B, A63C, A63D, A63F, A63G, A63H, A63J, A63K, A99Z, B43K, B43L, B43M, B44D, B44F, B68G, B99Z, D07B, F23Q, G09B, G09F, G10B, G10C, G10D, G10F, G10G, G10HExcluded
Table 2. Association rules for 2002, 2009, and 2016.
YearFrom (ix)To (iy)SupportConfidenceLift
2002C09KE21B0.0140.2732.932
E21BC09K0.0140.1502.932
G01VE21B0.0140.2732.932
E21BG01V0.0140.1502.932
C10BC10G0.0191.0002.129
C10GC10B0.0190.0402.129
2009C09KE21B0.0330.3752.757
E21BC09K0.0330.2432.757
G01VE21B0.0150.2862.100
E21BG01V0.0150.1082.100
C10BC10G0.0150.8002.053
C10GC10B0.0150.0382.053
C10MC10G0.0110.4291.100
C10GC10M0.0110.0281.100
C07CC10G0.0110.3000.770
C10GC07C0.0110.0280.770
B01JC10G0.0110.2500.642
C10GB01J0.0110.0280.642
2016C01BB01J0.0160.5719.581
B01JC01B0.0160.2679.581
C08LC09K0.0120.8575.599
C09KC08L0.0120.0785.599
C02FB01D0.0120.2615.249
B01DC02F0.0120.2405.249
B01DB01J0.0120.2404.024
B01JB01D0.0120.2004.024
G06GE21B0.0201.0002.842
E21BG06G0.0200.0562.842
G01NG01V0.0120.1882.358
G01VG01N0.0120.1502.358
G06FE21B0.0120.6671.895
E21BG06F0.0120.0341.895
C09KE21B0.0990.6491.845
E21BC09K0.0990.2821.845
G01NE21B0.0280.4381.243
E21BG01N0.0280.0791.243
G01VE21B0.0300.3751.066
E21BG01V0.0300.0851.066
B01JC10G0.0140.2330.954
C10GB01J0.0140.0570.954
C02FE21B0.0120.2610.741
E21BC02F0.0120.0340.741
Table 3. Top 10 IPCs ordered by most frequently cited from 2010 to 2016.
IPC (%)Number of IPC Citations by Period
1972 ~ 20012002 ~ 20092010 ~ 20161972~2016
E21B2728337392
(6.888%)(7.143%)(85.969%)
C09K1120162193
(5.699%)(10.363%)(83.938%)
C02F28105115
(1.739%)(6.957%)(91.304%)
C10G159851218
(72.936%)(3.670%)(23.394%)
G01V1435168
(20.588%)(4.412%)(75.000%)
B01J1454665
(21.538%)(7.692%)(70.769%)
G01N823747
(17.021%)(4.255%)(78.723%)
B01D592943
(11.628%)(20.930%)(67.442%)
C07C6102440
(15.000%)(25.000%)(60.000%)
C01B012021
(0.000%)(4.762%)(95.238%)
Others9224211327
(28.135%)(7.339%)(64.526%)
Total33811810731529
(22.106%)(7.717%)(70.177%)
Table 4. Summary of changes in IPC networks.
NetworkPosition1972 ~ 20011972 ~ 20091972 ~ 2016
Network 1Center IPCE21BE21BE21B
Surrounding IPCsC09K, G01VC09K, G01VC09K, G01V, G01N, G06F*, G06G*, C08L*
Network 2Center IPCC10GC10G-
Surrounding IPCsC10BC10B, C10M-
Network 3Center IPC--B01J
Surrounding IPCs--B01D, C01B, C02F

