Article

Hydrological Effects of Urban Green Space on Stormwater Runoff Reduction in Luohe, China

1
Department of Landscape Architecture, College of Forestry, Henan Agricultural University, Zhengzhou 450002, China
2
College of Forest Resources and Environmental Science, Michigan Technological University, Houghton, MI 49931, USA
3
School of Mathematics and Statistics, Zhengzhou Normal University, Zhengzhou 450044, China
4
Graduate School of Urban Studies, Hanyang University, Seoul 04763, Korea
*
Authors to whom correspondence should be addressed.
These authors contributed equally to this work.
Sustainability 2020, 12(16), 6599; https://doi.org/10.3390/su12166599
Submission received: 22 July 2020 / Revised: 11 August 2020 / Accepted: 11 August 2020 / Published: 14 August 2020
(This article belongs to the Special Issue Landscape Planning for Sustainability)

Abstract

:
This paper reveals the role of urban green space (UGS) in regulating runoff and hence on urban hydrological balance. The modeling software i-Tree Hydro was used to quantify the effects of UGS on surface runoff regulation and canopy interception capacity in four simulated land-cover scenarios. The results showed that the existing UGS could mitigate 15,871,900 m3 volume of runoff (accounting for 9.85% of total runoff) and intercept approximately 9.69% of total rainfall by the vegetation canopy. UGS in midterm goal and final goal scenarios could retain about 10.74% and 10.89% of total rainfall that falls onto the canopy layer, respectively. The existing UGS in the Luohe urban area had a positive but limited contribution in runoff regulation, with similar responses in future scenarios with increased UGS coverage. UGS rainfall interception volume changed seasonally along with changing leaf area index (LAI) and precipitation, and the interception efficiency was distinctly different under various rain intensities and durations. The UGS had a relatively high interception performance under light and long duration rain events but performed poorly under heavy and short rain events due to limited surface storage capacities. Our study will assist urban planners and policy-makers regarding UGS size and functionality in future planning in Luohe, particularly regarding future runoff management and Sponge City projects.

1. Introduction

Urbanization disrupts hydrological cycles by replacing the natural pervious cover to manmade impervious cover [1]. The transformation of land cover includes compacted sealed soil and vegetation elimination, leading to the decreasing capacity of the land to intercept, store, purify, evapotranspirate and infiltrate rainfall [2]. As a result, the volume of rainfall runoff rises, particularly the magnitude of peak runoff, and local urban flooding occurs more frequently [3]. UGS, referring to vegetated areas with trees, shrubs or grasses in urban areas, is widely recognized as one way to manage and regulate urban surface runoff due to its positive influence on runoff reduction [4,5,6]. UGS can be categorized based on location and function into public parks, protective green spaces, square green spaces, and attached green spaces, based on the Standard for the Classification of UGS (CJJ/T85-2017: http://www.mohurd.gov.cn/wjfb/201806/t20180626_236545.html). Compared to traditional “grey” infrastructure, UGS can be a cost-effective stormwater management strategy with lower investment and maintenance costs [7]. UGS can also provide other benefits, such as noise absorption, Urban Heat Island mitigation, energy saving, biodiversity conservation, carbon sequestration and air quality improvement [8,9,10]. In addition, UGS also contributes to urban sustainability to improve environmental quality and human health and well-being [11].
Computer models using field data have proven to be an effective way to measure the flooding reduction capacity of urban green space. Vegetation cover and urban forests reduce the impact of impervious surfaces and stormwater by intercepting rainfall, slowing water movement, and increasing infiltration into the ground [12]. The potential influence of trees on surface runoff reduction was found through the interception and infiltration effects by comparing plots covered with and without trees [13]. For example, the stormwater runoff reduction contribution by UGS from 2000 to 2010 in Beijing was estimated by empirical modelling to control 17% to 23% of rainfall runoff annually [5]. In another study, the Soil Conservation Service Curve Number model was utilized to calculate the runoff reduction volume by UGS in Beijing, estimating that the current UGS could reduce a 4258 m3 volume of runoff per ha [14]. A single-tree interception model was used to simulate the rainfall interception effects by urban forests in Santa Monica, California; street and park trees could intercept 1.6% of total precipitation yearly and annual rainfall interception capacity varied by tree species and size [15]. Using the i-Tree Eco model, trees in the urban park system in Phoenix, Arizona were estimated to reduce runoff by around 52,800 m3 annually [16]. SWMM models have also been used for this purpose. A Storm Water Management Model (SWMM) model examined the performance of 15 green infrastructure (GI) scenarios for flood mitigation in China; bioretention cells plus vegetated swales was the most cost-effective GI option [17]. The interception losses of six trees in San Juan, Puerto Rico were quantified by field measurements; storm intensity and tree types directly influenced interception losses [18].
China has experienced dramatic urbanization since the 1980s [19] with urban flooding as a frequent side-effect, causing numerous deaths and substantial economic losses every year [20]. Meanwhile, extreme weather conditions, increasing impervious surface and outdated and undersized sewer systems have further aggravated and amplified urban flood damage [21,22]. To fight urban flooding, the Chinese national government started the Sponge City program in 2012, and two years later issued a detailed guideline called “Technical Guidance on Sponge City Construction”, developed by the Ministry of Housing and Urban-Rural Development [23]. The Sponge City program is similar to Low Impact Development (LID) in design and aims to manage up to 70% of annual rainfall at the source to reduce the surface runoff by utilizing GI to mimic predevelopment hydrological procedures. UGS, as the dominating pervious cover in urban areas, should play a key role in Sponge City construction [24].
A 2016 report from the China Institute of Water Resources and Hydropower Research warned that the ambitious goals of the Sponge City program were not supported by sound research [25]. The lack of locally specific information and uncertainty could impede Sponge City construction, posing a challenge to urban planners when choosing effective natural-based measures. Given its rapid urbanization and frequent urban flooding, Luohe City is clearly in need of research to support its future urban planning and GI design.
The purpose of this study was to identify and demonstrate the rainfall interception value and flooding mitigation potential of UGS in the City of Luohe, China. We used the i-Tree Hydro model to estimate the effects of UGS on urban hydrology and calculate urban hydrologic balance and its complex relationship with green space. A current scenario, two future scenarios and one control scenario with various land-cover compositions were applied to reveal the stormwater runoff mitigation effects of different UGS coverage, using climate data from 2016 to 2018. The study addressed the following research questions: (1) How much surface runoff was regulated by UGS in different scenarios? (2) How much rainfall was intercepted and stored by UGS in different scenarios? (3) How did UGS perform under different intensities and durations of rain events?

2. Materials and Methods
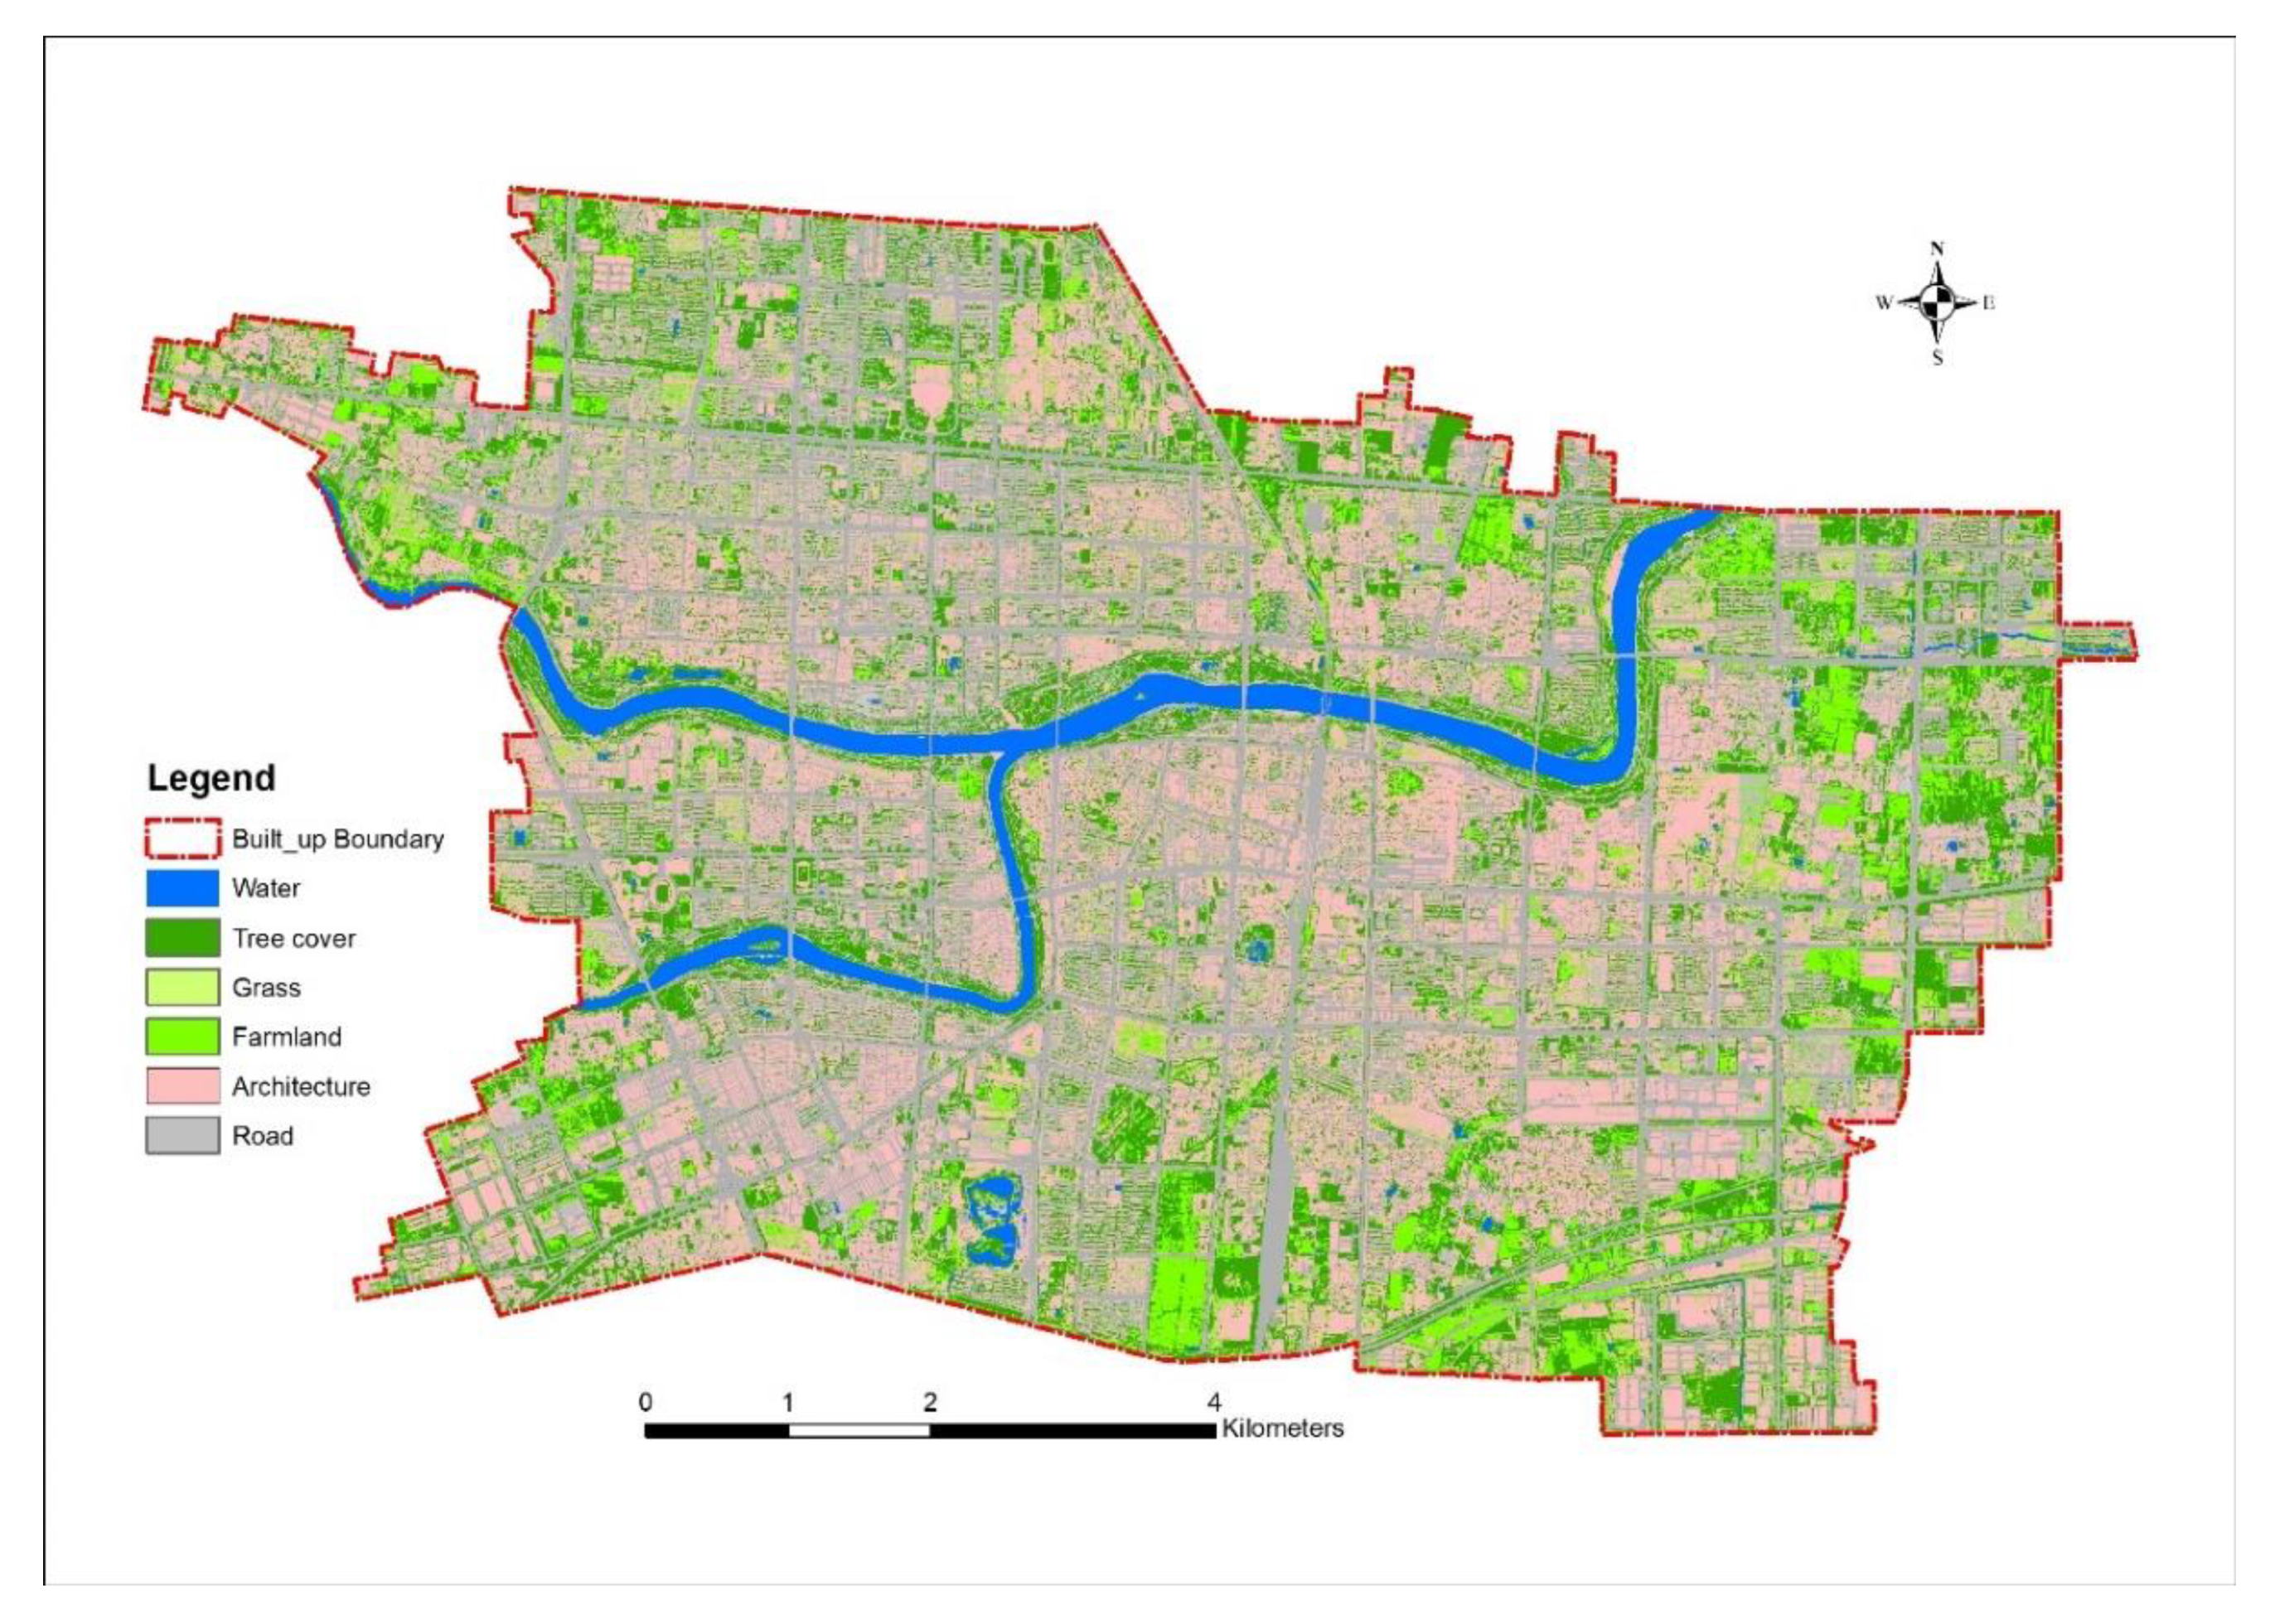
2.1. Study Area

Luohe City is a “National Forest City” in China, covering 2617 km2 with more than 2,760,000 inhabitants (as of 2016). The city is located on the southwest edge of the North China Plain at 33°34′52.35″ N, 114°00′38.84″ E, bordered by Funiu Mountain to the west, centered on the confluence of the Sha and Li rivers. Due to its unique location at the transitional zone from subtropical to temperate zones, Luohe has a Humid Subtropical Climate (“Cfa” climate, according to Köppen–Geiger Climate Classification) with an annual precipitation of 810.3 mm (most of the precipitation falls in summers from June to September). The Luohe Built-up area (Figure 1) occupies more than 75.2 km2 and was chosen as the study area. According to the 2016 Statistical Yearbook of Luohe, there were approximately 720,000 residents living in the study area, trending upwards with urbanization. The city’s UGS System Specialized Planning (2016–2030) and the Sponge City Specialized Plan of Luohe (2016–2030) plans were approved in 2016. To support this planning, two seasonal (leaf-on and leaf-off seasons) high-resolution Unmanned Aerial Vehicle (UAV) aerial images (Figure 2; spatial resolution: 9 cm) were produced, which provided the land cover data for our model.

2.2. i-Tree Hydro

Formerly called Urban Forest Effects-Hydrology (UFORE-Hydro) [26], i-Tree Hydro is a vegetation-specific, semi-distributed, topographical-based urban hydrological model. It was designed to simulate and assess the effects of urban vegetation and impervious cover changes on urban hydrological balance and water quality at the watershed or non-watershed level [26]. The model simulates the relevant hydrological processes, such as precipitation, interception, evaporation, infiltration and runoff, by combining with input data of climate, elevation, and land-cover, as well as soil conditions and vegetation information. Compared to other available hydrological models, such as Soil and Water Assessment Tool (SWAT) [27] and Storm Water Management Model (SWMM) [28], the modified vegetation interception algorithms in the i-Tree Hydro model enable better vegetation structure characteristics and seasonally changing LAI. The modeling results include three parts: water quantity, water quality and advanced output. Water quantity consists of hourly total flow, base flow, pervious runoff, and impervious runoff. Total flow is the total runoff produced in the entire study area, which is the sum of base flow, and pervious and impervious runoff. Base flow is the primary source of water during periods of low flow. Pervious or impervious runoff is the runoff generated by a pervious or impervious surface. Water quality shows a variety of pollutions that are eliminated by vegetation. Advanced outputs are made up of two subparts: aboveground vegetation hydrology processes and sub-surface hydrology processes. Vegetation hydrology includes hourly interception by vegetation, storage on vegetation surfaces, throughfall, and evaporation. Sub-surface hydrology includes infiltration and evapotranspiration from the root zone.
The i-Tree Hydro model is a peer-reviewed, free desktop application that is widely used to probe the relationship between urban hydrological balance and vegetation [29,30,31,32,33,34,35,36,37,38,39]. For example, Kirnbauer et al. (2013) quantified the canopy interception potential and evaporation by an i-Tree Hydro model to decide how to use vacant and underutilized land productively in Hamilton, Canada [31]. Lefrançois (2015) utilized the model to quantify the effect of surface cover change on the sewershed at a community scale in Vancouver, Canada [32]. Finally, Bautista and Peña-Guzmán (2019) simulated the hydrological impact of green roofs and increasing green areas in Fontibón Town, Colombia [39]. Thus, the i-Tree Hydro model should be suitable to estimate the hydrological benefits of UGS in this research.

2.3. Rainfall Interception Model in i-Tree Hydro

The rainfall interception model implemented in i-Tree Hydro version 6.0 was originally developed and upgraded based on UFORE-Hydro and refined based on work by Rutter et al. [40,41]. The interception model was later refined to consider throughfall in sparse vegetation by Gash et al. (1995) [42] and Valente et al. (1997) [43]. i-Tree Hydro creatively modified the Rutter model by introducing a seasonally changing LAI, which considered the leaf-on and leaf-off seasons separately, bringing more accurate simulation.
In a typical i-Tree Hydro project, the study site consists of tree cover and other impervious or pervious ground cover. Estimates are made of the percent of the area beneath the dripline of the tree that is covered by impervious or pervious surfaces [44]. The model assumes that precipitation is spatially uniform across the entire study area, so that some portion of precipitation falls on the vegetation cover area and some on the other non-vegetated ground area. Some precipitation falling on the tree canopy is intercepted and stored by the tree canopy, and the remainder reaches the ground under the canopy. Precipitation can be partially retained by ground depressions, and some continues to sink underground through pervious cover or becomes surface runoff over impervious cover. Although tree leaves, branches, and bark may intercept precipitation and thus mitigate surface runoff, only the precipitation intercepted by leaves will be considered in this model [26], which means it is a conservative estimate. More details regarding the i-Tree Hydro model can be found in [26] and on the homepage of i-Tree tools.

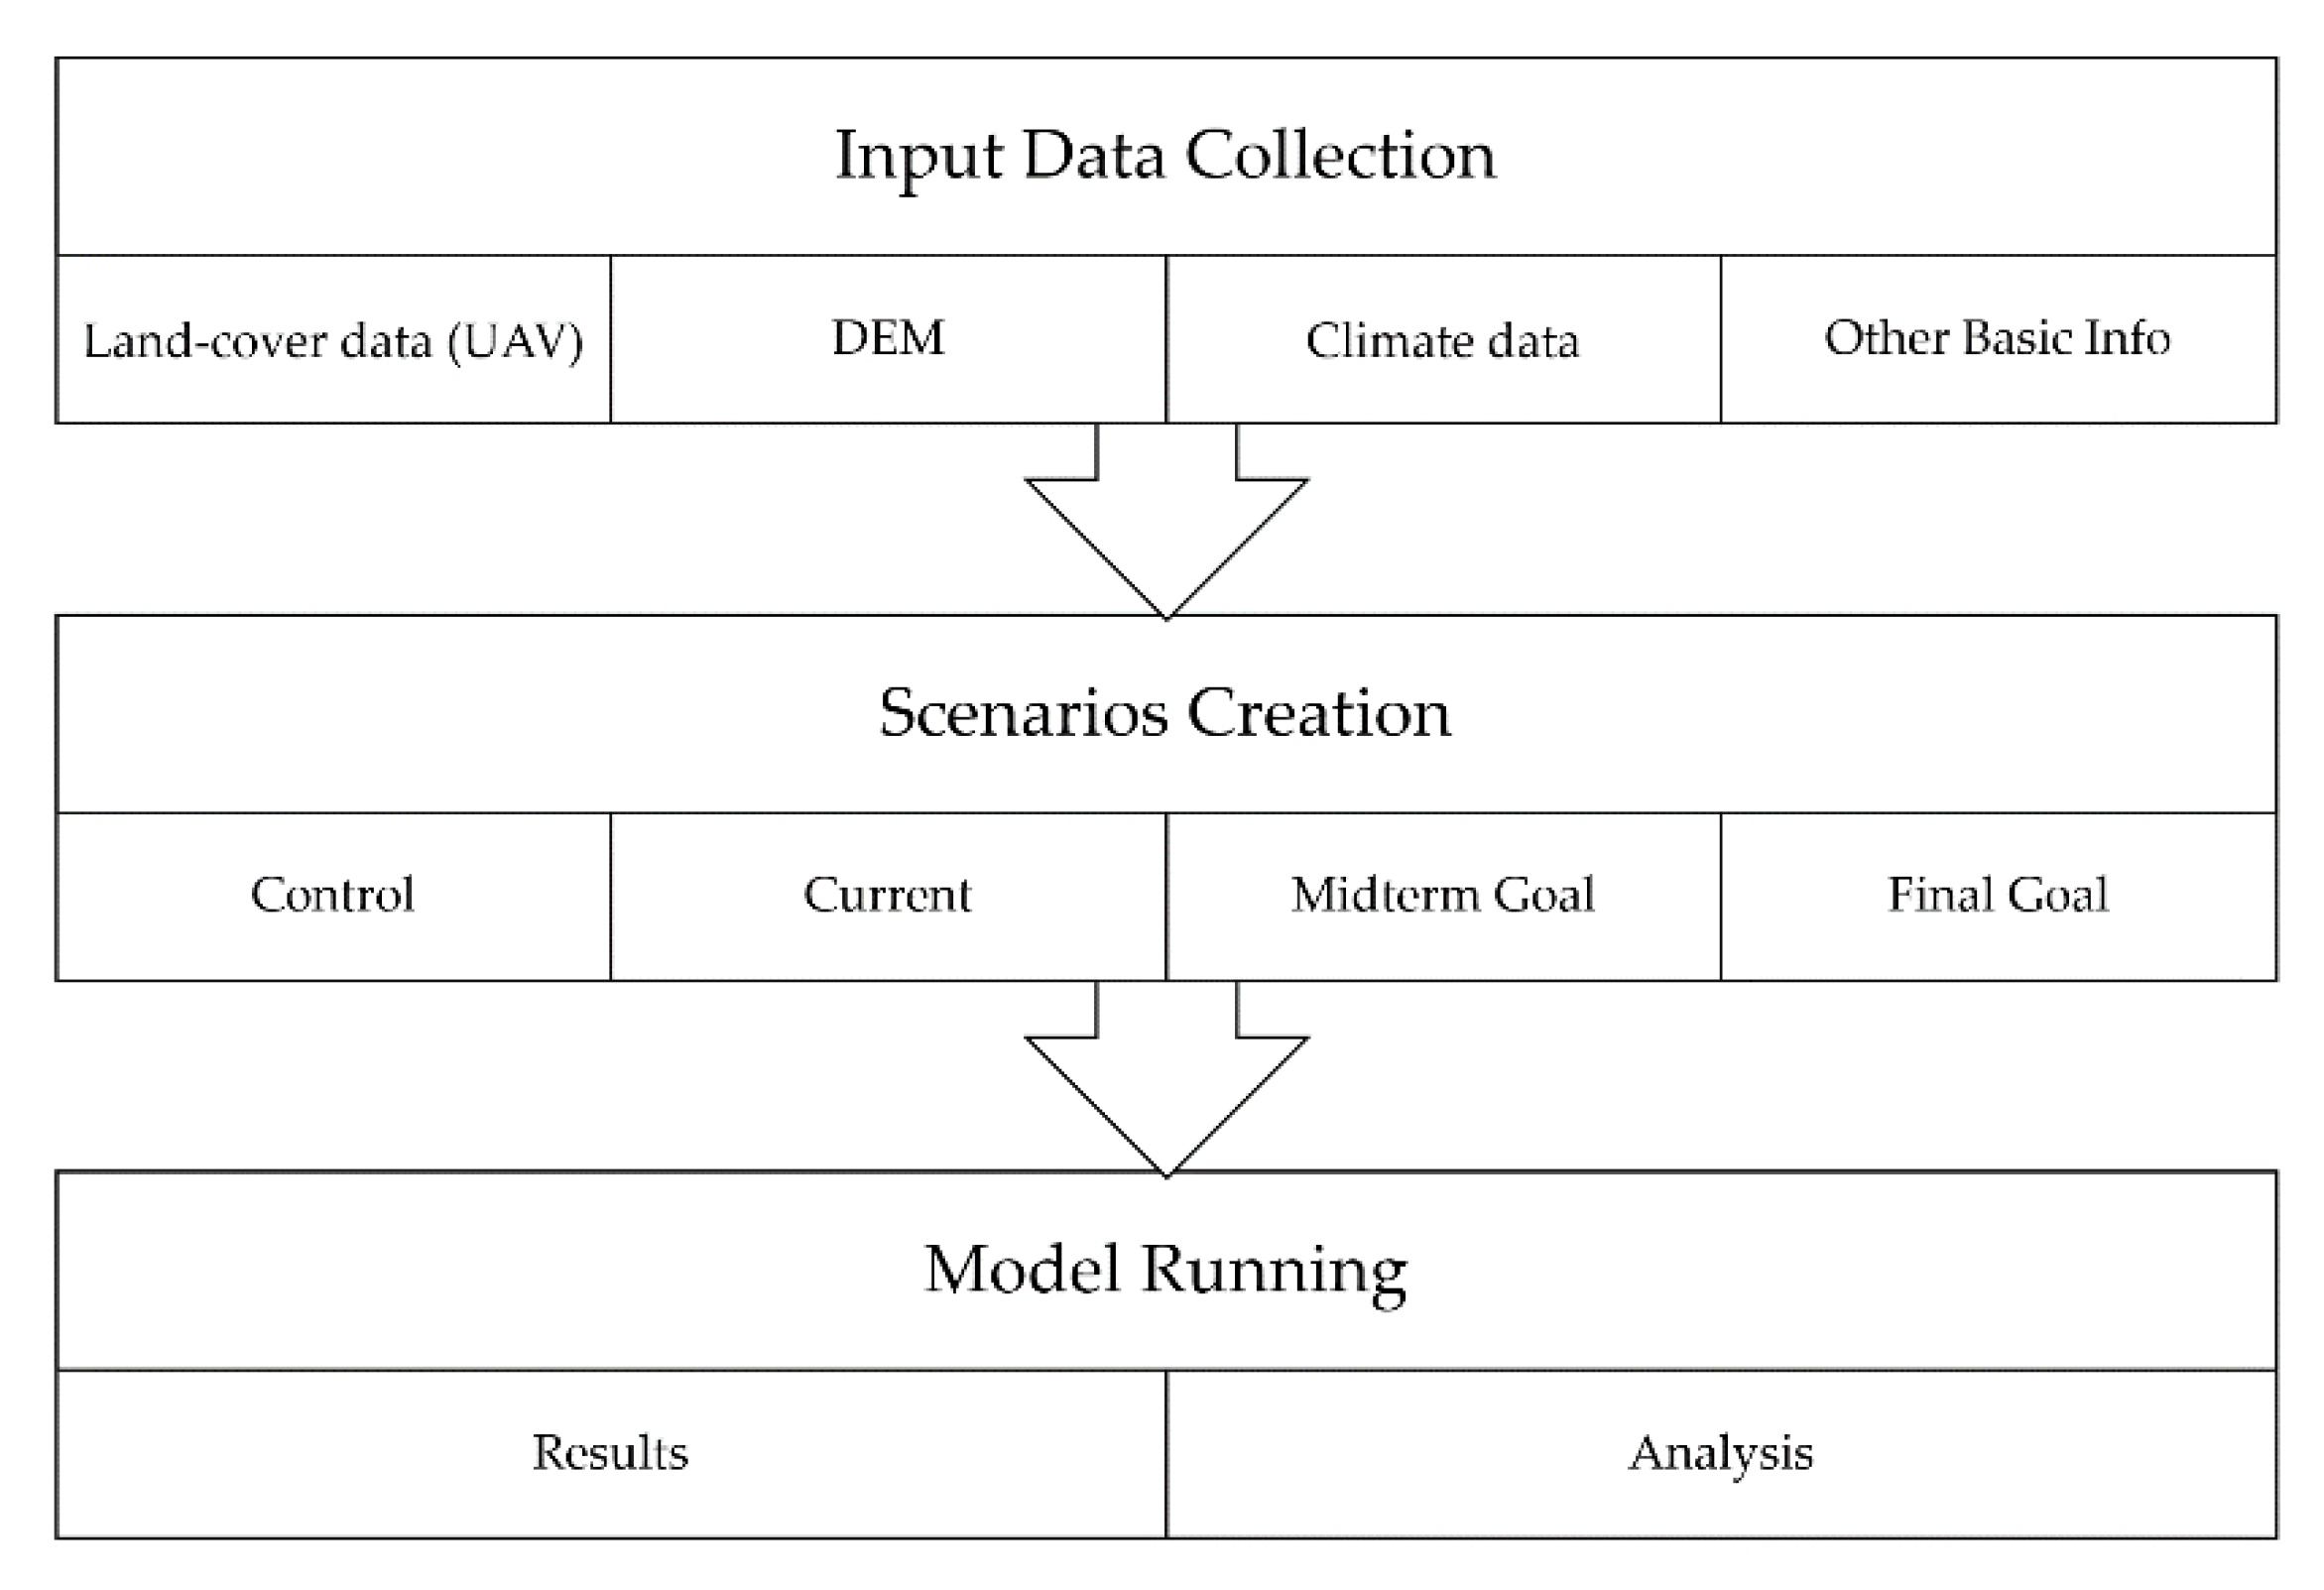
2.4. Data Processing

2.4.1. Required Input Data

The required basic information for the model includes geographic location, project area, topographic information in the form of digital elevation data (DEM), land-cover data, percentage of impervious area that directly connects to the stormwater drainage network, and the percentage of deciduous and conifer tree coverage. Hourly weather data from 2016–2018 used in this research were acquired from the local weather station (National # 57186, 33°36′ N, 114°03′ E, elevation 59.8 m), including hourly temperatures, humidity, wind speed and direction, and precipitation.
Although i-Tree Hydro was developed in an American context, it can be adapted for international users by selecting a suitable reference city in the US and replicating all the input data required to run the model (Figure 3). The reference city should best match the subject city with similar climate in terms of temperature, elevation, rain, snow, vegetation abundance, leaf-on and leaf-off days, and latitude. Wichita, Kansas was chosen as the reference location. Our three-year simulation period started on 1 January 2016 and ended on 30 December 2018. The topographic data for Luohe were initially 30-m resolution DEM from the United States Geological Survey (USGS). From 2016 to 2018, the annual average rainfall was 844 mm, which was approximately 28 mm lower than Wichita’s average annual precipitation. The project area was 75,198,600 m2. The directly connected impervious area (DCIA) percentage of the four scenarios were 87%, 56%, 53% and 49%, respectively, which were calculated by using the Sutherland Equation [45]. Furthermore, the tree LAI, shrub LAI, and herbaceous LAI were specified by the default values with Wichita—4.7, 2.2, 1.6, respectively. The soil type was determined to be Sandy Clay according to the Soil Survey of Luohe City [46].

2.4.2. Four Scenarios Creation

In this study, the current land-use condition was set as the base scenario, the current scenario with UGS excluded was set as the control scenario, and two future scenarios for UGS land use were created based on the midterm goal of 2020 and final goal of 2030 in the UGS System Planning of Luohe (2016–2030; Table 1). The specific tree cover percentage goals were set when executing the plan within different terms. The current land-cover data (Figure 4) were obtained by June’s UAV aerial images through Object-based Image Analysis by ENVI 5.1 [47]. The land-use data (Figure 5) were obtained by March’s UAV aerial images by visual interpretation manually because the March images have less tree canopy blocking the ground. The percent of pervious and impervious cover (Figure 6) under tree canopy was acquired through overlapping the land-cover map and land-use map. Some of land-use classification had to be further processed to meet the land cover categories used in i-Tree Hydro. Next, the proposed land-cover configuration of four scenarios were taken as the individual parameters. All the processed data mentioned above were imported to i-Tree Hydro model for further running.

3. Results and Discussion

The following sections highlight the significant observations related to UGS hydrological effects in the different scenarios.

3.1. Total Runoff Generation

The model outputs showed that 145,274,900 m3 volume of flow was generated throughout the study area under the current scenario. In the midterm goal and final goal scenarios, the total flow decreased by 2,661,300 m3 (1.83% of current scenario) and 4,432,100 m3 (3.05% of current scenario) to 142,613,600 m3 and 140,842,800 m3, respectively (Table 2). While the total base flow showed an overall increase from the base scenario to the midterm goal and final goal scenarios, the total base flow increased 8.55% and 17.04% to 1,446,600 and 1,559,800 m3 over the base scenario, respectively. Comparing with the control scenario, total runoff in the four scenarios showed a decreasing trend with increasing UGS coverage. The existing UGS had positive effects on runoff mitigation, regulating 15,871,900 m3 volume of runoff, accounting for 9.85% of total runoff in the control scenario. The role of existing UGS on runoff mitigation was limited, however, which highlighted a big gap for achieving the Sponge City goal of mitigating 70% of rainfall runoff [25]. Our results suggest that UGS as the dominant pervious cover in urban area could be a valuable ecological resource that can strategically act as urban green stormwater infrastructure through urban forests, including trees, shrubs and pervious ground cover that absorb much of the surface runoff in urban areas.
The results revealed some variability in how UGS coverage affects the total runoff at a city scale. Increasing UGS coverage contributed positively to decreasing total runoff, which was expected, given the increasing canopy interception capability. The results are consistent with O’Neill’s study, highlighting urban forest canopy effects on stormwater runoff in Guelph, Ontario [48], where the overall decrease in total flow volumes accounted for a small part of total runoff (less than 10%). Another study conducted by Zhang et al. (2015) showed that the runoff reduction rate attributed to UGS continuously decreased from 23% in 2000 to 17% in 2010 with a decreasing UGS area in Beijing [5]. Li et al. utilized the CITY-green model to assess the influence of urban vegetation in controlling flooding in Shenzhen, China. The results showed that urban vegetation could reduce the annual surface runoff by an average 55 mm, nearly 30% [49]. While different models were used in these studies, all studies showed that UGS has positive effects on runoff reduction in urban areas, although the runoff reduction capacity was not enough to control or eliminate urban flooding. Urban runoff control still mainly relies on sewer systems, while UGS plays a subordinate role [50]. Meanwhile, our results revealed the specific amount of stormwater runoff regulated by UGS and the clear gap to achieve the goal of Sponge City [23]—UGS plays a limited role in runoff mitigation because of limited surface storage capacity. To achieve the ambitious goal of the Sponge City program, more measures should be taken together with UGS, such as green roof retrofit [51] and mitigating impervious surfaces along roadsides [52].

3.2. Pervious and Impervious Runoff Generation

Model results showed a slight increase in total runoff over pervious surfaces from the current scenario to future scenarios. Pervious runoff started at 85,329,900 m3 and increased by 7,062,100 m3 (8.28%) to 92,392,000 m3 as the final goal achievement with 45% tree cover. Initial impervious runoff of 58,608,700 m3 expectedly decreased by 11,721,300 m3 to 46,887,400 m3 as the final scenario. The impervious cover decreased 11.14% in the final scenario over the base scenario, while the impervious runoff decreased 20%.
The total impervious cover (bare impervious cover + impervious cover under tree canopy) declined from 61.26% in the current scenario to 58.24% and 55.24% in the future two scenarios. The DCIA had the same decreasing trend with impervious cover. Decreasing impervious cover would result in decreased surface runoff. With decreasing DCIA, less impervious-generated surface runoff would continue over impervious cover all the way to the outlet, thus resulting in more water moving to pervious areas. The total pervious cover (impervious cover excluded) was increased from 38.74% in the current scenario to 41.76% and 44.76% in two future scenarios (Table 1). The increasing pervious area brought more stormwater falling on pervious areas, although infiltration and depression storage capacity was strained and limited, which was more likely to result in increasing pervious surface runoff. Increasing pervious cover generated more pervious surface runoff, and with the contribution of more runoff from impervious cover, resulted in increasing pervious surface runoff. With the increasing pervious cover, more stormwater infiltrated into the ground, which brought an increased base flow. More runoff volume reduction could be achieved by reducing impervious cover than increasing the canopy cover. Impervious cover cannot retain and evaporate and infiltrate water into the ground-like tree canopy, so almost all the rainfall falling on the impervious will be surface runoff directly. Due to the limited capacity of intercepting, storage on the tree canopy and infiltration rate—increasing the canopy over impervious cover—has a very small contribution in runoff reduction. With the limited storage capacity of UGS canopy and infiltration rate, the pervious runoff increased with increasing UGS coverage. Increased UGS coverage could allow for more infiltration, theoretically refilling more groundwater. The finding was consistent with previous research [53], which also found that urban vegetation had a positive effect on runoff regulation and the influence would increase along with increased vegetation covers. While comparing the pervious runoff, the base flow represented a minor percentage of total runoff. Compact soil with low infiltration rate is quite common in urban areas, so compact soil improvement, such as structural soil [54] could directly increase infiltration rate and volume. Another approach is to decrease impervious surface runoff by adding canopy cover above the impervious cover [6].

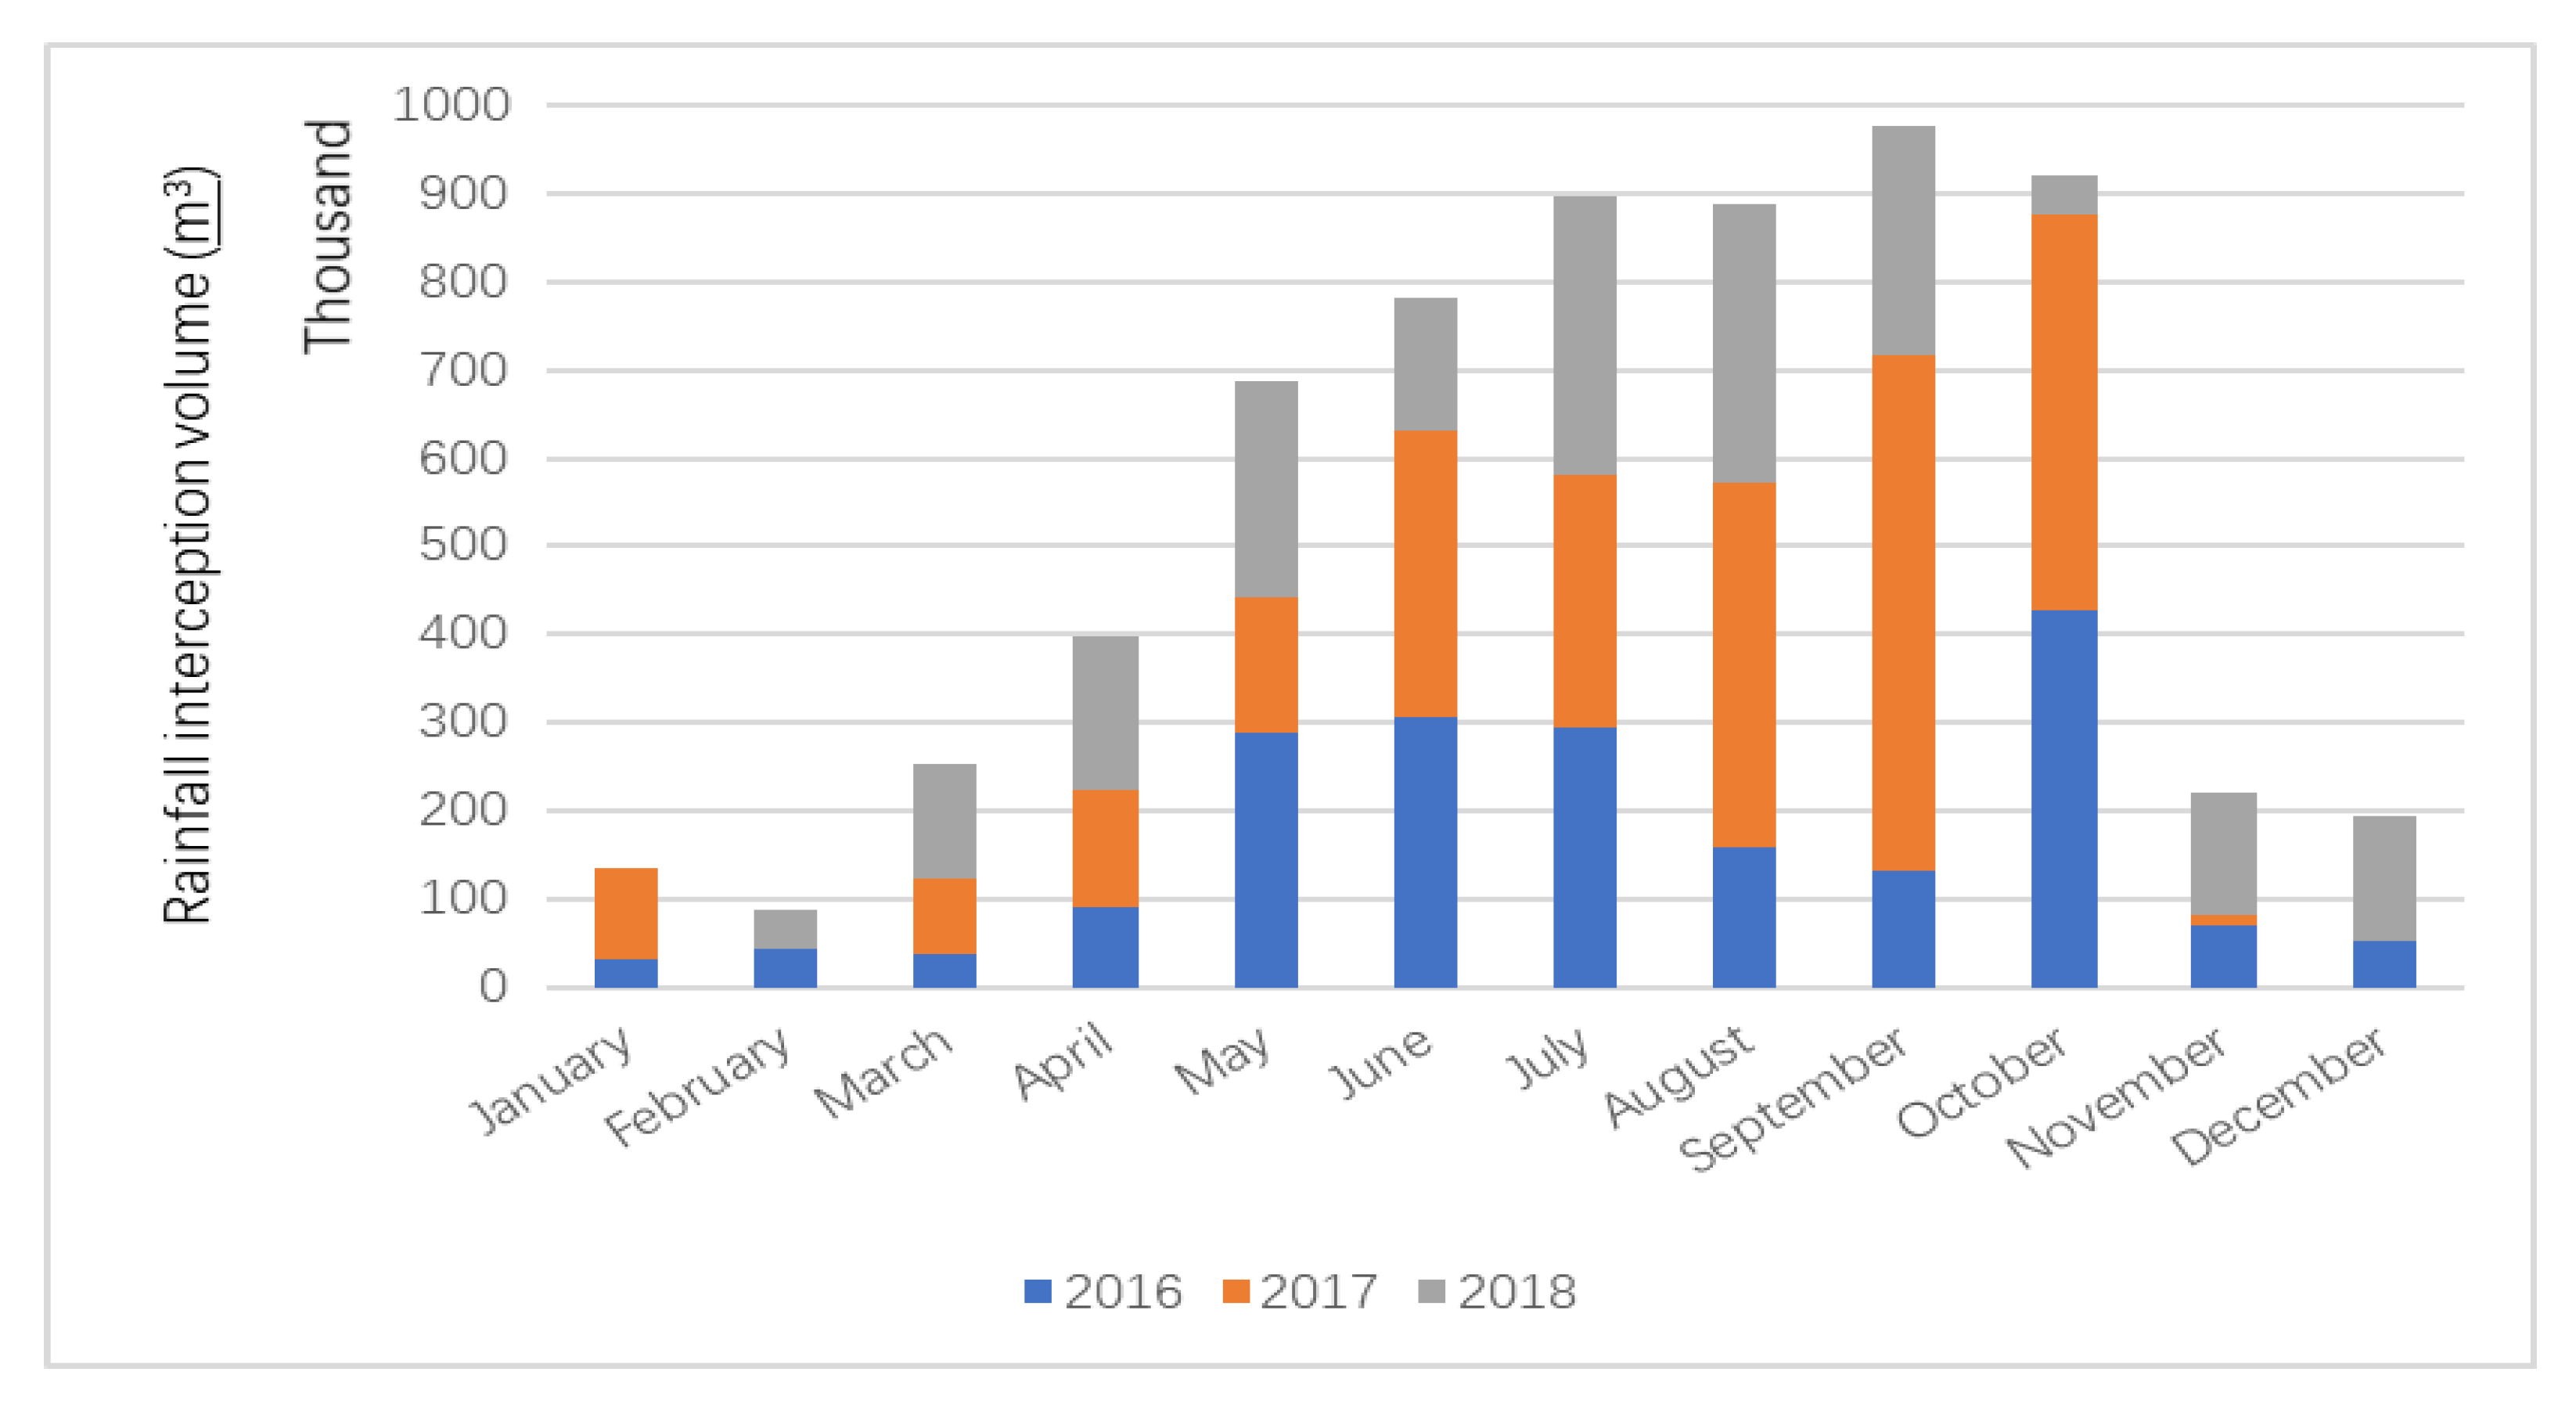
3.3. Rainfall Interception Effects

The model outputs for the current scenario showed that a total of 66,436,800 m3 of rainfall dropped over vegetation; 9.69% was intercepted by vegetation and evaporated into air over the 3-year study period. Increasing tree cover in the two future scenarios increased the total interception, increasing 36.60% and 51.44% by a volume of interception compared with the current scenario, respectively. In the mid-term goal scenario, 10.74% of the total rainfall that fell over the vegetation canopy was directly intercepted. The final goal scenario had the highest canopy interception volume by approximately 9,745,900 m3, and 10.89% of the total rainfall fell onto the vegetation canopy. Figure 7 provides a summary of the 3-year study period for the three scenarios. The increased vegetation cover resulted in increased vegetation canopy storage capacity; hence the total interception volume clearly showed an increasing trend along with the yearly rainfall. UGS, therefore, has considerable potential to intercept stormwater and further reduce surface runoff if UGS coverage increases.
Figure 8 summarized the monthly rainfall interception volume by vegetation in the current scenario. The interception volume increased or decreased along with monthly precipitation. The top six highest months of interception volume ranking were from May to October, and September had the highest interception volume by 975,200 m3 in three years, while February had the lowest volume by 88,700 m3.
The interception efficiency (the percentage of canopy interception amount of rainfall falling over the vegetation) was adopted to analyze the capacity of UGS rainfall interception. As seen in Figure 9, the monthly interception efficiency varied from 0 to 68.99% during the 3-year period, and January had the highest interception efficiency by 18.52%, while August was the lowest by 5.25%.
Most urban flood events happen during the summer time, while the monthly rainfall interception efficiency of existing UGS varied from 4% to 46% depending on the rain intensities in summer seasons. The rainfall interception efficiency of individual rain event was calculated, and 46% was the highest one, while 4% was the lowest. The UGS canopy interception effect was limited in heavy rain events. The interception benefits were affected by: dynamic weather conditions, including precipitation intensity and duration, wind, vapor pressure, and radiation; canopy characteristics, such as seasonally changing leaf area, bark roughness and initial canopy surface condition [55]. Studies of the interception benefit of vegetation canopy have demonstrated that interception loss could account for 10–50% of total rainfall in various natural and plantation forests [56,57,58]. There are several biotic and abiotic factors that affect canopy storage capacity that further affect interception performance: canopy structure [59], leaf surface feature [60], evaporation rate [61], and rainfall intensity and duration [62,63]. Xiao et al. determined that three broadleaved species in Oakland, California could intercept 14–27% of rainfall on average [64]. Asadian and Weiler (2009) found that urban coniferous trees in British Columbia could intercept an average of 71% of rainfall [65]. Several studies have demonstrated that coniferous tress have higher LAI than broadleaved trees, resulting in high canopy storage capacity [66,67]. In the i-Tree Hydro model, the trees, shrubs and grasses were represented with different LAI from high to low, and LAI is the key element in the canopy interception formula used in the model. The interception effect of the vegetation canopy was directly affected by its LAI, which determined the surface storage capacity [48], The higher LAI vegetation with higher canopy storage capacity could intercept more rainfall during rain events. Although the interception accounts for a small part of total runoff, the interception loss of the vegetation canopy should not be neglected and could be used to mitigate urban flooding [68]. The interception benefits contributed by the high LAI trees in the Sponge City project could be minor, while the cumulative effect could have significant implications for runoff reduction at a city scale. For urban planners and landscape architects, it is important to understand how to increase the water storage capacities above and underground within an area in ways that have significant effects on rainfall runoff mitigation [69].

3.4. Seasonal Variation in Rainfall Effects on Interception

The rainfall interception efficiency changed along with the magnitude of rain events. According to the changing LAI in different seasons used in this model, the rain events were divided into two seasons—leaf-on season (May to October) and leaf-off season (November to April)—which were used to reveal the different interception performances in different seasons.

3.4.1. Per Rain Event Precipitation Effects on Interception during Leaf-On Season

As shown in Figure 10, there were more than 236 rain events (88% of total rain events) with 20 mm or less precipitation, and interception efficiency varied with rainfall magnitude during the leaf-on season in the current scenario. Overall, there was a trend that the interception efficiency experienced a dramatic decrease from 87% to 1% with increasing precipitation. When the total rainfall was less than 7.6 mm, at least 20% or more of rainfall was intercepted, but when total rainfall surpassed 7.6 mm, the efficiency decreased gradually from 20% to 1%. This variation in interception efficiency was primarily attributed to the changes in the magnitude of rain events. There was a maximum volume of vegetation canopy storage capacity (Figure 11); the interception efficiency decreased with increasing precipitation per rain event. The interception effect was highest in most of the low rain events, and lowest in heavy rain events. The potential evaporation rate in summer is higher than in winter, due to high temperature, high wind speed, and Urban Heat Island (UHI) effects, which increase the canopy surface rainfall storage and further increase the interception capacities [70]. The LAI also reaches the peak in summer, while the canopy surface storage is limited, resulting in the largest canopy interception capacity [71]. High-intensity rainfall events mostly happen in summer in Luohe, which is typical for the northern part of China [72]. Frequent, extreme weather events, such as heavy rainfall associated with climate change, could be expected to increase flooding risks in Chinese cities and their related eco-systems [73,74]. Dealing with the additional stress of climate change may require new approaches to manipulate the relationship between land, water, and ecosystems [75]. UGS and urban forests could make cities more resilient to extreme weather but these mitigation effects are finite [76]. Using natural solutions, such as UGS, together with the aquatic ecosystems (river, lakes, ponds) and Green–Blue network construction, would increase urban resilience and mitigate flooding from extreme weather events in future urban planning [77,78].

3.4.2. Per Rain Event Precipitation Effects on Interception during Leaf-Off Season

Overall, the interception efficiency in the leaf-off season experienced a similar dramatic decreasing trend with that in the leaf-on season along with the increasing rainfall. Due to the low LAI with low canopy surface storage capacity in leaf-off seasons, the interception efficiency dropped dramatically with rainfall more than 10 mm, and the overall interception efficiency in the leaf-off season was obviously lower than the leaf-on season. As seen in Figure 11, the highest interception efficiency in the leaf-off season was 69.58%, which was around 18% lower than that in the leaf-on seasons with same rainfall. When the precipitation was lower than 3 mm per rain event, the vegetation canopy can intercept at least 30% to 69% of rainfall. With the increasing rainfall per rain event, the interception efficiency dropped rapidly from 30% to 2%.
The finding of this study is consistent with a study by Deguchi et al. (2006) [79], which found that the differences in interception loss between seasons were small despite the distinctly different LAI in a multi-species, broad-leaved forest in Japan. The interception decrease in the leaf-off season may depend on the reduction in leaf amounts, which was reported about the relationship between interception and LAI [80,81,82]. These changes in LAI directly decreased the canopy surface storage capacity, further decreasing the interception efficiency [71]. In this study, for deciduous trees during the leaf-off season, the interception depends on bark area index, and the surface storage capacity of deciduous tree bark is considerably smaller than for leaves, which means the interception benefits of deciduous trees accounts for a small part of winter interception. So evergreen trees play a vital role in interception contribution during the winter season, due to their more constant canopy structure. Another study conducted by Kermavnar and Vilhar (2017) reported that the presence of coniferous cover had been attributed to greater interception loss in urban areas in Ljubljana, Slovenia [67]. From the perspective of urban stormwater management, the interception benefits of coniferous and broadleaved evergreen trees may outweigh those from deciduous trees during winter seasons [83]. Adding more coniferous and broadleaved evergreen trees in UGS could increase the interception efficiency in both leaf-off and leaf-on seasons, which would further mitigate urban flooding.

3.5. Rain Event Duration and Intensity Effects on Interception

Hundreds of rain events happened during the three years, while there were few pairs of rain events with exactly same the rainfall and different duration times to make comparisons. Different magnitudes of paired rain events were selected to reveal the differences from low-intensity to high-intensity rain events. We selected four magnitudes of rain events, consisting of 2.9 mm, 7.6 mm, 16.5 mm and 21.2 mm, with the duration time from 1 h to 24 h, to reveal the relationship between the interception efficiency and rain duration. As shown in Figure 12a–d, the individual figures show pairs of rain events with the same rainfall and different duration times, and the total interception volume per rain event was higher in the long duration rain events than that in the short duration rain events. In the short duration rain events, interception volume increased swiftly, and canopy surface storage capacity reached a high level in a very short time, resulting in the later interception volume decreasing sharply, even equal to zero when the storage volume reached capacity. Heavy and short duration rain events resulted in less time for interception and evaporation, leading to surface storage reaching capacity quickly and the later interception volume decreasing dramatically, while in the long duration rain events, the canopy began to intercept rainfall when the rain started, and the canopy surface storage increased and recovered due to continuous evaporation loss simultaneously, which allowed for more interception later. The canopy continued intercepting rainfall until the canopy storage reached capacity and interception stopped, and all subsequent rainfall became throughfall. Overall, under the same rainfall rain event with different rain duration, the UGS could intercept more rainfall in long duration rain events than the short ones, due to more evaporative loss. The interception efficiency in long duration rain events was found to be 3~13% higher than that in the short ones under the same rainfall event.
Rainfall depth, duration, intensity, continuity and the inclination angle of rainfall can affect the redistribution of rainfall by vegetation canopy to interception loss [18,68,84]. Rain events, along with continuous and long-duration rainfall were subjected to higher evaporation loss from canopy surface than short-duration events, while intermittent drying would happen throughout rain events with a rather low intensity (sometimes even lower than the during-event evaporation rate), which would increase interception benefits through periodic recovery of canopy storage capacity [68,85]. However, there is no consensus concerning the relationship between rainfall intensity and interception loss. Calder (1996) [86] and Carlyle-Moses (2004) [87] hypothesized that the canopy storage capacity would decrease, due to the displacement of water stored on the canopy surface, in response to relatively large raindrops hitting the canopy under higher rainfall intensities. Murakami (2006) suggested that greater splash would be formed when the large raindrop sizes with high kinetic energy hit the canopy [88], forming a mass of smaller droplets and evaporating more quickly due to their smaller size [89]. Therefore, the effects of rainfall intensity on interception benefits are complicated, and the trend of increasing or decreasing interception loss along with increasing rainfall intensity is dependent upon the net balance between canopy storage capacity and the during-event evaporation rate. Thus, the rainfall intensity effects on the canopy interception benefits is likely specific to tree species and rain events. In these high rainfall intensity events, the soil underneath the vegetation was easily saturated, which decreased the later rainfall infiltration, resulting in more pervious runoff generation.
There was another issue that should be noted: UGS rainfall interception capacities were affected by initial conditions when the rain began. If the former rain event had just finished, the rainfall stored in the canopy surface could not evaporate at once and the canopy storage capacity would directly decrease, resulting in less rainfall intercepted in later rain events. During the three years, the antecedent dry period (ADP) of all rainfall events ranged from 2 to 2285 h. According to the model results, in high density rainfall events (canopy rainfall storage reaching capacity), a UGS needs at least 23 to 45 h for the maximum rainfall storage of the canopy to evaporate into the atmosphere, while in low density rainfall events (canopy rainfall storage not reaching maximum), a UGS needs 10 to 39 h for the canopy rainfall storage to recover. The evaporation rate affected the interception capacities during rain events by decreasing canopy rainfall storage [90]. The evaporation rate varied enormously in daytime or nighttime, depending upon the temperature or humidity condition [91]. In the beginning of the rainfall event, the low humidity deficit and low irradiation, due to cloudiness, may cause a very low evaporation rate [91]. However, the evaporation rate decreased along with continuous rainfall and increased the humidity near the canopy surface [92]. Evaporation rates were very high in the drying phase after rain events, which was in agreement with Singh and Saeicz (1979) [93].

3.6. Limitation in This Research

Only three years’ climate data were used in this study, so longer-term climate data should be utilized in future studies to bring a more reliable result. In particular, given the expected changes in rainfall intensity, duration, and frequency expected as a result of climate change, as well as increased temperatures, additional scenarios which account for these expected changes will provide necessary information for long-term land use planning. Additionally, our model assumptions regarding future land cover for the two future scenarios were likely over simplistic but necessary due to unavailable data. The percentage of land-cover in the two future scenarios were hypothesized based on current conditions and future planning goals. The physical measurement approach to assess the UGS effects on runoff mitigation was unrealistic at a city scale; however, the empirical approach quantifying the rainfall interception volume could be beneficial for modeling calibration and improved accuracy. The model results of vegetation hydrological benefits showed the simplified integrated influence contributed by all of the vegetation types in the research area.

4. Conclusions

The overall goal of this research was to explore the effects of UGS on runoff reduction in urban areas. Our results demonstrated that the existing UGS in the Luohe built-up area did have a positive but limited contribution in runoff regulation, with a similar response in future scenarios with increased UGS coverage. As expected, the rainfall interception volume changed seasonally along with changing LAI and precipitation. The interception efficiency was distinctly different under various rain intensities and durations; the UGS had a relatively high interception rate under light and long duration rain events and a poor performance under heavy rain events due to the limited surface storage capacities and evaporation loss. The gap between the runoff mitigation needs of the Sponge City program goals in Luohe, and the capacity of what the UGS can do, is large. The ambitious goal, therefore, cannot not be achieved only through green space, and requires integrating other methods such as water-permeable pavements, green roof retrofits, structural soil modifications and underground rainfall storage modules, among other possibilities.
This research was conducted to understand the role of UGS on runoff regulation effects in the urban hydrological balance. i-Tree Hydro can be used to estimate site-specific vegetation effects on the urban hydrology system in established urban areas. It is important to note that the land-cover data acquired based on high-resolution seasonal UAV images were much more precise than those in other research, through the use of satellite images, which brought more precise and convincing modelling results for further analysis. Meanwhile, this study illustrates the international application of the i-Tree Hydro model to help stormwater managers and policy-makers identify optimized strategies for stormwater management by using UGS to maximize the runoff reduction. The presented results have practical implications on future runoff-reduction-oriented urban planning and Sponge City practices. Urban planners or decision-makers could use i-Tree Hydro to quickly quantify how much surface runoff might be generated by existing land uses, and the runoff reduced by UGS at both small and large scales, which is increasingly needed for urban planning and Sponge City construction.

Future Research

With the very limited contribution to runoff reduction, increasing the UGS surface storage capacities as much as possible did make a difference. Due to the limited available land for greening in urban areas, how to increase and maximize the runoff regulation effects within constrained UGS should be considered in future research.

Author Contributions

Conceptualization, A.L.M., G.T. and G.K.; Data curation, P.S. and J.H.; Formal analysis, P.S., E.X. and A.L.M.; Funding acquisition, E.X., G.T. and G.K.; Investigation, J.H.; Methodology, E.X. and C.L.; Project administration, J.H.; Software, P.S., J.G. and J.H.; Supervision, G.T. and G.K.; Writing—original draft, P.S.; Writing—review and editing, A.L.M. and G.K. All the authors revised the manuscript. All authors have read and agreed to the published version of the manuscript.

Funding

This research was funded by Education Department of Henan Province Program (18B22003), Urban-Rural Green Space Resources Control and Landscape Ecological Design Disciplinary Innovation and Talents Introduction Centre Program (GXJD006), Korea Ministry of Environment (MOE) (2020002780001) and Korea Environment Industry & Technology Institute (KEITI) through its Urban Ecological Health Promotion Technology Development Project. The APC was funded by the investigation and database construction of green spaces in Luohe Project (20161210).

Acknowledgments

We thank Robert Coville and Kruegler James from The Davey Tree Expert Company for continuous technical support for model running and results analysis.

Conflicts of Interest

The authors declare no conflict of interest.

References

  1. McGrane, S.J. Impacts of urbanisation on hydrological and water quality dynamics, and urban water management: A review. Hydrol. Sci. J. 2016, 61, 2295–2311. [Google Scholar] [CrossRef]
  2. Arnold, C.L.; Gibbons, C.J. Impervious Surface Coverage: The Emergence of a Key Environmental Indicator. J. Am. Plan. Assoc. 1996, 62, 243–258. [Google Scholar] [CrossRef]
  3. Cheng, S.-J.; Wang, R.-Y. An approach for evaluating the hydrological effects of urbanization and its application. Hydrol. Process. 2002, 16, 1403–1418. [Google Scholar] [CrossRef]
  4. Liu, W.; Chen, W.; Peng, C. Assessing the effectiveness of green infrastructures on urban flooding reduction: A community scale study. Ecol. Model. 2014, 291, 6–14. [Google Scholar] [CrossRef]
  5. Zhang, B.; Xie, G.-D.; Li, N.; Wang, S. Effect of urban green space changes on the role of rainwater runoff reduction in Beijing, China. Landsc. Urban Plan. 2015, 140, 8–16. [Google Scholar] [CrossRef]
  6. Zölch, T.; Henze, L.; Keilholz, P.; Pauleit, S. Regulating urban surface runoff through nature-based solutions—An assessment at the micro-scale. Environ. Res. 2017, 157, 135–144. [Google Scholar] [CrossRef]
  7. Mell, I.C. Can green infrastructure promote urban sustainability? Proc. Inst. Civ. Eng. Eng. Sustain. 2009, 162, 23–34. [Google Scholar] [CrossRef]
  8. Chang, J.; Qu, Z.; Xu, R.; Pan, K.; Xu, B.; Min, Y.; Ren, Y.; Yang, G.; Ge, Y. Assessing the ecosystem services provided by urban green spaces along urban center-edge gradients. Sci. Rep. 2017, 7, 11226. [Google Scholar] [CrossRef] [Green Version]
  9. Szumacher, I. Functions of Urban Greenspace and Ecosystem Services. Misc. Geogr. 2011, 15, 123–129. [Google Scholar] [CrossRef] [Green Version]
  10. Vargas-Hernández, J.G.; Pallagst, K.; Zdunek-Wielgołaska, J. Urban Green Spaces as a Component of an Ecosystem. In Handbook of Engaged Sustainability; Marques, J., Ed.; Springer International Publishing: Cham, Switzerland, 2018; pp. 1–32. [Google Scholar]
  11. Bertram, C.; Rehdanz, K. The role of urban green space for human well-being. Ecol. Econ. 2015, 120, 139–152. [Google Scholar] [CrossRef] [Green Version]
  12. Kim, G.; Miller, P.A.; Nowak, D.J. Assessing urban vacant land ecosystem services: Urban vacant land as green infrastructure in the City of Roanoke, Virginia. Urban For. Urban Green. 2015, 14, 519–526. [Google Scholar] [CrossRef]
  13. Armson, D.; Stringer, P.; Ennos, A. The effect of street trees and amenity grass on urban surface water runoff in Manchester, UK. Urban For. Urban Green. 2013, 12, 282–286. [Google Scholar] [CrossRef]
  14. Yao, L.; Chen, L.; Wei, W.; Sun, R. Potential reduction in urban runoff by green spaces in Beijing: A scenario analysis. Urban For. Urban Green. 2015, 14, 300–308. [Google Scholar] [CrossRef]
  15. Xiao, Q.F.; McPherson, E.G.; Ustin, S.L.; Grismer, M.E.; Simpson, J.R. Winter rainfall interception by two mature open-grown trees in Davis, California. Hydrol. Proces. 2000, 14, 763–784. [Google Scholar] [CrossRef]
  16. Kim, G.; Coseo, P. Urban Park Systems to Support Sustainability: The Role of Urban Park Systems in Hot Arid Urban Climates. Forests 2018, 9, 439. [Google Scholar] [CrossRef] [Green Version]
  17. Mei, C.; Liu, J.; Wang, H.; Yang, Z.; Ding, X.; Shao, W. Integrated assessments of green infrastructure for flood mitigation to support robust decision-making for sponge city construction in an urbanized watershed. Sci. Total. Environ. 2018, 639, 1394–1407. [Google Scholar] [CrossRef]
  18. Nytch, C.J.; Meléndez-Ackerman, E.J.; Pérez, M.-E.; Ortiz-Zayas, J.R. Rainfall interception by six urban trees in San Juan, Puerto Rico. Urban Ecosyst. 2018, 22, 103–115. [Google Scholar] [CrossRef] [Green Version]
  19. Chen, J. Rapid urbanization in China: A real challenge to soil protection and food security. Catena 2007, 69, 1–15. [Google Scholar] [CrossRef]
  20. Winsemius, H.C.; Aerts, J.C.J.H.; Van Beek, L.P.H.; Bierkens, M.; Bouwman, A.; Jongman, B.; Kwadijk, J.C.J.; Ligtvoet, W.; Lucas, P.L.; Van Vuuren, D.P.; et al. Global drivers of future river flood risk. Nat. Clim. Chang. 2015, 6, 381–385. [Google Scholar] [CrossRef]
  21. Chen, Y.; Zhou, H.; Zhang, H.; Du, G.; Zhou, J. Urban flood risk warning under rapid urbanization. Environ. Res. 2015, 139, 3–10. [Google Scholar] [CrossRef]
  22. Schreider, S.Y.; Smith, D.I.; Jakeman, A. Climate Change Impacts on Urban Flooding. Clim. Chang. 2000, 47, 91–115. [Google Scholar] [CrossRef]
  23. MOHURD. Technical Guidance for Sponge City Construction—Low Impact Development Stormwater System Construction. Available online: http://www.mohurd.gov.cn/wjfb/201411/t20141102_219465.html (accessed on 18 February 2019).
  24. Zhang, Y.S. Sponge City Theory and its Application in Landscape. World Constr. 2017, 6, 29. [Google Scholar] [CrossRef]
  25. Shao, W.; Zhang, H.; Liu, J.; Yang, G.; Chen, X.; Yang, Z.; Huang, H. Data Integration and its Application in the Sponge City Construction of CHINA. Procedia Eng. 2016, 154, 779–786. [Google Scholar] [CrossRef] [Green Version]
  26. Wang, J.; Endreny, T.; Nowak, D.J. Mechanistic Simulation of Tree Effects in an Urban Water Balance Model. J. Am. Water Resour. Assoc. 2008, 44, 75–85. [Google Scholar] [CrossRef]
  27. Arnold, J.; Srinivasan, R.; Muttiah, R.S.; Allen, P.M. Continental scale simulation of the hydrologic balance. Am. Water Resour. Assoc. 1999, 35, 1037–1051. [Google Scholar] [CrossRef]
  28. Gironás, J.; Roesner, L.; Rossman, L.A.; Davis, J. A new applications manual for the Storm Water Management Model (SWMM). Environ. Model. Softw. 2010, 25, 813–814. [Google Scholar] [CrossRef]
  29. Yang, Y.; Endreny, T.; Nowak, D. Simulating Urban Tree Effects on Air, Water, and Heat Pollution Mitigation: iTree-Hydro Model; AGU Fall Meeting Abstracts. December 2011. Available online: https://ui.adsabs.harvard.edu/abs/2011AGUFM.B31B0323Y/abstract (accessed on 16 February 2019).
  30. Stephan, E.; Endreny, T.; Nowak, D. Development of Nutrient Model for i-Tree Hydro using Sampling Results from the Mianus River Watershed; AGU Fall Meeting Abstracts. December 2013. Available online: https://ui.adsabs.harvard.edu/abs/2013AGUFM.B13F0571S/abstract (accessed on 16 February 2019).
  31. Kirnbauer, M.; Baetz, B.; Kenney, W. Estimating the stormwater attenuation benefits derived from planting four monoculture species of deciduous trees on vacant and underutilized urban land parcels. Urban For. Urban Green. 2013, 12, 401–407. [Google Scholar] [CrossRef]
  32. Lefrançois, C.B. Designing Effective Stormwater Management Policies: The Role of the Urban Forest and Impervious Cover in Vancouver, B.C. Ph.D. Thesis, University of British Columbia, Vancouver, BC, Canada, 2015. [Google Scholar]
  33. Wen, L.; Weiping, C.; Chi, P. Modeling the Effects of Green Infrastructure on Storm Water Runoff Reduction on Community Scale. Acta Ecol. Sin. 2016, 36, 6. [Google Scholar] [CrossRef]
  34. Lega, M.; Endreny, T.; Brebbia, C.A.; Itoh, H. Quantifying the environmental impact of pollutant plumes from coastal rivers with remote sensing and river basin modelling. Int. J. Sustain. Dev. Plan. 2016, 11, 651–662. [Google Scholar] [CrossRef]
  35. Bodnaruk, E.; Kroll, C.; Yang, Y.; Hirabayashi, S.; Nowak, D.; Endreny, T. Where to plant urban trees? A spatially explicit methodology to explore ecosystem service tradeoffs. Landsc. Urban Plan. 2017, 157, 457–467. [Google Scholar] [CrossRef] [Green Version]
  36. Stephan, E. Development of a Parsimonious Urban Landscape Nutrient Model using Representations of Terrestrial Denitrification Controls. Ph.D. Thesis, State University of New York, New York, NY, USA, 2017. [Google Scholar]
  37. Bautista Avila, D.S. Modelación del ciclo hidrológico urbano en la localidad de Fontibón con I-TREE hydro. Master’s Thesis, University of Santo Tomas, Bogotá, Colombia, 2018. [Google Scholar]
  38. Jermyn, C. An Analysis of Runoff Ratios Across Urbanizing Gradients. Honors Thesis, State University of New York, Albany, NY, USA, 2018. [Google Scholar]
  39. Bautista, D.; Peña-Guzmán, C.A. Simulating the Hydrological Impact of Green Roof Use and an Increase in Green Areas in an Urban Catchment with i-Tree: A Case Study with the Town of Fontibón in Bogotá, Colombia. Resources 2019, 8, 68. [Google Scholar] [CrossRef] [Green Version]
  40. Rutter, A.; Kershaw, K.; Robins, P.; Morton, A.J. A predictive model of rainfall interception in forests, 1. Derivation of the model from observations in a plantation of Corsican pine. Agric. Meteorol. 1971, 9, 367–384. [Google Scholar] [CrossRef]
  41. Rutter, A.J.; Morton, A.J.; Robins, P.C. Predictive model of rainfall interception in forests. II. generalization of model and comparison with observations in some coniferous and hardwood stands. J. Appl. Ecol. 1975, 12, 367–380. [Google Scholar] [CrossRef]
  42. Gash, J.; Lloyd, C.; Lachaud, G. Estimating sparse forest rainfall interception with an analytical model. J. Hydrol. 1995, 170, 79–86. [Google Scholar] [CrossRef]
  43. Valente, F.; David, J.S.; Gash, J. Modelling interception loss for two sparse eucalypt and pine forests in central Portugal using reformulated Rutter and Gash analytical models. J. Hydrol. 1997, 190, 141–162. [Google Scholar] [CrossRef]
  44. Kim, G. Assessing Urban Forest Structure, Ecosystem Services, and Economic Benefits on Vacant Land. Sustainibility 2016, 8, 679. [Google Scholar] [CrossRef] [Green Version]
  45. EPA. EPA’s Methodology to Calculate Baseline Estimates of Impervious Area (IA) and Directly Connected Impervious Area (DCIA) for Massachusetts Communities. Available online: https://www3.epa.gov/region1/npdes/stormwater/ma/IA-DCIA-Calculation-Methodology.pdf (accessed on 18 February 2019).
  46. Yang, F. Study on Building and Application of Henan Province Soil Database. Master’s Thesis, Henan Agricultural University, Zhengzhou, China, 2008. [Google Scholar]
  47. Tsai, Y.H.; Stow, D.A.; Weeks, J.R. Comparison of Object-Based Image Analysis Approaches to Mapping New Buildings in Accra, Ghana Using Multi-Temporal QuickBird Satellite Imagery. Int. J. Remote Sens. 2011, 3, 2707–2726. [Google Scholar] [CrossRef] [Green Version]
  48. O’Neill, S. Measuring Urban Forest Canopy Effects on Stormwater Runoff in Guelph, Ontario. Master’s Thesis, The University of Guelph, Guelph, ON, Canada, 2018. [Google Scholar]
  49. LI, P.-W.; LI, G.-C.; Chen, L.; Yuan, X.-Z.; Xu, F. Analysis of Shenzhen’s vege-tation: Flood control and ecological benefit. J. Nat. Resour. 2009, 24, 1223–1233. [Google Scholar]
  50. Zhou, Y. Research on Urban Green Space System Design in Sponge City. Urban Rural Constr. 2017, 6, 29. [Google Scholar]
  51. Mentens, J.; Raes, D.; Hermy, M. Green roofs as a tool for solving the rainwater runoff problem in the urbanized 21st century? Landsc. Urban Plan. 2006, 77, 217–226. [Google Scholar] [CrossRef]
  52. Marengo, B.; Cahill, T.; Wible, D.; Marm, C.; Johnstone, R. Developing Green Streets Prototypes to Reduce Combined Sewer Overflows for Cincinnati, Ohio. In World Environmental and Water Resources Congress 2009: Great Rivers; Starrett, S., Ed.; ASCE: Reston, VA, USA, 2009; pp. 1–10. [Google Scholar]
  53. Inkiläinen, E.N.; McHale, M.R.; Blank, G.B.; James, A.; Nikinmaa, E. The role of the residential urban forest in regulating throughfall: A case study in Raleigh, North Carolina, USA. Landsc. Urban Plan. 2013, 119, 91–103. [Google Scholar] [CrossRef]
  54. Day, S.D.; Dickinson, S.B. Managing Stormwater for Urban Sustainability Using Trees and Structural Soils; Virginia Polytechnic Institute and State University: Blacksburg, VA, USA, 2008; pp. 1–63. [Google Scholar]
  55. Coville, R.; Endreny, T.; Nowak, D.J. Modeling the Impact of Urban Trees on Hydrology. In Forest-Water Interactions; Levia, D.F., Carlyle-Moses, D.E., Iida, S.i., Michalzik, B., Nanko, K., Tischer, A., Eds.; Springer: Cham, Switzerland, 2020; Volume 240, pp. 459–487. [Google Scholar]
  56. Toba, T.; Ohta, T. An observational study of the factors that influence interception loss in boreal and temperate forests. J. Hydrol. 2005, 313, 208–220. [Google Scholar] [CrossRef]
  57. Šraj, M.; Brilly, M.; Mikoš, M. Rainfall interception by two deciduous Mediterranean forests of contrasting stature in Slovenia. Agric. For. Meteorol. 2008, 148, 121–134. [Google Scholar] [CrossRef] [Green Version]
  58. Ghimire, C.P.; Bruijnzeel, L.A.; Lubczynski, M.W.; Ravelona, M.; Zwartendijk, B.W.; Van Meerveld, H.J.I. Measurement and modeling of rainfall interception by two differently aged secondary forests in upland eastern Madagascar. J. Hydrol. 2017, 545, 212–225. [Google Scholar] [CrossRef]
  59. Livesley, S.J.; Baudinette, B.; Glover, D. Rainfall interception and stem flow by eucalypt street trees—The impacts of canopy density and bark type. Urban For. Urban Green. 2014, 13, 192–197. [Google Scholar] [CrossRef]
  60. Xiao, Q.; McPherson, E.G. Surface Water Storage Capacity of Twenty Tree Species in Davis, California. J. Environ. Qual. 2016, 45, 188–198. [Google Scholar] [CrossRef]
  61. Návar, J.; Bryan, R.B. Fitting the analytical model of rainfall interception of Gash to individual shrubs of semi-arid vegetation in northeastern México. Agric. For. Meteorol. 1994, 68, 133–143. [Google Scholar] [CrossRef]
  62. Crockford, R.; Richardson, D. Partitioning of rainfall into throughfall, stemflow and interception: Effect of forest type, ground cover and climate. Hydrol. Process. 2000, 14, 2903–2920. [Google Scholar] [CrossRef]
  63. Levia, D.; Herwitz, S. Interspecific variation of bark water storage capacity of three deciduous tree species in relation to stemflow yield and solute flux to forest soils. Catena 2005, 64, 117–137. [Google Scholar] [CrossRef]
  64. Xiao, Q.; McPherson, E.G. Rainfall interception of three trees in Oakland, California. Urban Ecosyst. 2011, 14, 755–769. [Google Scholar] [CrossRef]
  65. Asadian, Y.; Weiler, M. A New Approach in Measuring Rainfall Interception by Urban Trees in Coastal British Columbia. Water Qual. Res. J. 2009, 44, 16–25. [Google Scholar] [CrossRef]
  66. Li, X.; Xiao, Q.; Niu, J.; Dymond, S.; Van Doorn, N.S.; Yu, X.; Xie, B.; Lv, X.; Zhang, K.; Li, J. Process-based rainfall interception by small trees in Northern China: The effect of rainfall traits and crown structure characteristics. Agric. For. Meteorol. 2016, 218, 65–73. [Google Scholar] [CrossRef]
  67. Kermavnar, J.; Vilhar, U. Canopy precipitation interception in urban forests in relation to stand structure. Urban Ecosyst. 2017, 20, 1373–1387. [Google Scholar] [CrossRef]
  68. Carlyle-Moses, D.E.; Gash, J.H.C. Rainfall Interception Loss by Forest Canopies. In Forest Hydrology and Biogeochemistry: Synthesis of Past Research and Future Directions; Levia, D., Carlyle-Moses, D., Tanaka, T., Eds.; Springer: Cham, Switzerland, 2011; Volume 216, pp. 407–423. [Google Scholar]
  69. Fletcher, T.; Andrieu, H.; Hamel, P. Understanding, management and modelling of urban hydrology and its consequences for receiving waters: A state of the art. Adv. Water Resour. 2013, 51, 261–279. [Google Scholar] [CrossRef]
  70. Zipper, S.C.; Schatz, J.; Kucharik, C.J.; Loheide, S. Urban heat island-induced increases in evapotranspirative demand. Geophys. Res. Lett. 2017, 44, 873–881. [Google Scholar] [CrossRef]
  71. Xiao, Q.; McPherson, E.G.; Simpson, J.R.; Ustin, S.L. Rainfall interception by Sacramento’s urban forest. J. Arboricult. 1998, 24, 235–243. [Google Scholar]
  72. Wang, Y.; Zhou, L. Observed trends in extreme precipitation events in China during 1961–2001 and the associated changes in large-scale circulation. Geophys. Res. Lett. 2005, 32. [Google Scholar] [CrossRef]
  73. Song, X.; Zhang, J.; AghaKouchak, A.; Roy, S.S.; Xuan, Y.; Wang, G.; He, R.; Wang, X.; Liu, C. Rapid urbanization and changes in spatiotemporal characteristics of precipitation in Beijing metropolitan area. J. Geophys. Res. Atmos. 2014, 119, 11250–11271. [Google Scholar] [CrossRef] [Green Version]
  74. Bai, T.; Mayer, A.L.; Shuster, W.D.; Tian, G. The Hydrologic Role of Urban Green Space in Mitigating Flooding (Luohe, China). Sustainability 2018, 10, 3584. [Google Scholar] [CrossRef] [Green Version]
  75. Mooney, H.; Larigauderie, A.; Cesario, M.; Elmquist, T.; Hoegh-Guldberg, O.; Lavorel, S.; Mace, G.; Palmer, M.; Scholes, R.J.; Yahara, T. Biodiversity, climate change, and ecosystem services. Curr. Opin. Environ. Sustain. 2009, 1, 46–54. [Google Scholar] [CrossRef]
  76. Maimaitiyiming, M.; Ghulam, A.; Tiyip, T.; Pla, F.; Latorre-Carmona, P.; Halik, Ü.; Sawut, M.; Caetano, M. Effects of green space spatial pattern on land surface temperature: Implications for sustainable urban planning and climate change adaptation. ISPRS J. Photogramm. Remote. Sens. 2014, 89, 59–66. [Google Scholar] [CrossRef] [Green Version]
  77. Hering, D.; Carvalho, L.; Argillier, C.; Beklioğlu, M.; Borja, Á.; Cardoso, A.C.; Duel, H.; Ferreira, T.; Globevnik, L.; Hanganu, J.; et al. Managing aquatic ecosystems and water resources under multiple stress—An introduction to the MARS project. Sci. Total. Environ. 2015, 503, 10–21. [Google Scholar] [CrossRef] [PubMed]
  78. Keesstra, S.D.; Nunes, J.P.; Novara, A.; Finger, D.; Avelar, D.; Kalantari, Z.; Cerdà, A. The superior effect of nature based solutions in land management for enhancing ecosystem services. Sci. Total. Environ. 2018, 610, 997–1009. [Google Scholar] [CrossRef] [PubMed] [Green Version]
  79. Deguchi, A.; Hattori, S.; Park, H. The influence of seasonal changes in canopy structure on interception loss: Application of the revised Gash model. J. Hydrol. 2006, 318, 80–102. [Google Scholar] [CrossRef]
  80. Pitman, J.I. Rainfall interception by bracken in open habitats—Relations between leaf area, canopy storage and drainage rate. J. Hydrol. 1989, 105, 317–334. [Google Scholar] [CrossRef]
  81. Anzhi, W.; Jinzhong, L.; Jianmei, L.; Tiefan, P.; Changjie, J. A semi-theoretical model of canopy rainfall interception for Pinus Koraiensis Nakai. Ecol. Model. 2005, 184, 355–361. [Google Scholar] [CrossRef]
  82. Yang, B.; Lee, J.-K.; Heo, H.K.; Biging, G. The effects of tree characteristics on rainfall interception in urban areas. Landsc. Ecol. Eng. 2019, 15, 289–296. [Google Scholar] [CrossRef] [Green Version]
  83. Carlyle-Moses, D.E.; Livesley, S.; Baptista, M.D.; Thom, J.; Szota, C. Urban Trees as Green Infrastructure for Stormwater Mitigation and Use. In Forest-Water Interactions; Levia, D., Carlyle-Moses, D., Iida, S., Michalzik, B., Nanko, K., Tischer, A., Eds.; Springer: Cham, Switzerland, 2020; Volume 240, pp. 397–432. [Google Scholar]
  84. Xiao, Q.; McPherson, E.G.; Ustin, S.L.; Grismer, M.E. A new approach to modeling tree rainfall interception. J. Geophys. Res. Space Phys. 2000, 105, 29173–29188. [Google Scholar] [CrossRef] [Green Version]
  85. Zeng, N.; Shuttleworth, J.; Gash, J. Influence of temporal variability of rainfall on interception loss. Part I. Point analysis. J. Hydrol. 2000, 228, 228–241. [Google Scholar] [CrossRef]
  86. Calder, I.R. Dependence of rainfall interception on drop size: 1. Development of the two-layer stochastic model. J. Hydrol. 1996, 185, 363–378. [Google Scholar] [CrossRef]
  87. Carlyle-Moses, D. Throughfall, stemflow, and canopy interception loss fluxes in a semi-arid Sierra Madre Oriental matorral community. J. Arid. Environ. 2004, 58, 181–202. [Google Scholar] [CrossRef]
  88. Murakami, S. A proposal for a new forest canopy interception mechanism: Splash droplet evaporation. J. Hydrol. 2006, 319, 72–82. [Google Scholar] [CrossRef]
  89. Dunkerley, D.L. Evaporation of impact water droplets in interception processes: Historical precedence of the hypothesis and a brief literature overview. J. Hydrol. 2009, 376, 599–604. [Google Scholar] [CrossRef]
  90. Van Dijk, A.I.J.M.; Bruijnzeel, L. Modelling rainfall interception by vegetation of variable density using an adapted analytical model. Part 1. Model description. J. Hydrol. 2001, 247, 230–238. [Google Scholar] [CrossRef]
  91. Klaassen, W.; Bosveld, F.; De Water, E. Water storage and evaporation as constituents of rainfall interception. J. Hydrol. 1998, 212, 36–50. [Google Scholar] [CrossRef] [Green Version]
  92. Morton, F. What are the limits on forest evaporation? J. Hydrol. 1984, 74, 373–398. [Google Scholar] [CrossRef]
  93. Singh, B.; Szeicz, G. The effect of intercepted rainfall on the water balance of a hardwood forest. Water Resour. Res. 1979, 15, 131–138. [Google Scholar] [CrossRef]
Figure 1. Location of Henan Province and Luohe City in central area of China (left); location of research area in Luohe City (right).
Sustainability 12 06599 g001
Figure 2. UAV images of study area in February (a) and June (b), 2016.
Sustainability 12 06599 g002
Figure 3. Schematic depiction of i-Tree Hydro model running.
Sustainability 12 06599 g003
Figure 4. Land-cover Map of research area in June, 2016.
Sustainability 12 06599 g004
Figure 5. Land-use Map of research area in February 2016.
Sustainability 12 06599 g005
Figure 6. Pervious and impervious cover of research area in February 2016.
Sustainability 12 06599 g006
Figure 7. Rainfall interception volumes for each scenario for 3 years.
Sustainability 12 06599 g007
Figure 8. Monthly rainfall interception of current scenario during 2016 to 2018.
Sustainability 12 06599 g008
Figure 9. Monthly various interception efficiency of current scenario during 2016 to 2018.
Sustainability 12 06599 g009
Figure 10. The relationship between rainfall per rain event and interception efficiency in leaf-on season.
Sustainability 12 06599 g010
Figure 11. The relationship between rainfall per rain event and interception efficiency in leaf-off season.
Sustainability 12 06599 g011
Figure 12. Canopy interception and storage versus hourly rainfall of two rain events with same total rainfall; (a): NO. 99 in 2016 vs. NO. 73 in 2018 with 2.9 mm rainfall; (b): NO. 61 in 2018 vs. NO. 47 in 2017 with 7.6 mm rainfall; (c): NO. 72 in 2017 vs. NO. 78 in 2017 with 16.5 mm rainfall; (d): NO. 69 in 2017 vs. NO. 103 in 2017 with 21.2 mm rainfall. (L represents long duration rain event; S represents short duration rain events).
Sustainability 12 06599 g012
Table 1. Land-cover configuration of four scenarios (* TC: tree cover).
ScenarioCanopy CoverShrub CoverHerbaceousBare SoilImpervious CoverWaterPervious under TCImpervious under TC
Control0008%89%3%00
Current27%2%6%8%54%3%20%7%
Midterm Goal40.00%1.00%2.00%3%51.00%3%33%7%
Final Goal45.00%1.00%1.00%2%48.00%3%38%7%
Table 2. The overall runoffs of each scenario (Unit: m3; ↗ & ↘ means increasing or decreasing comparing with Control scenario).
ScenarioTotal RunoffBase FlowPervious RunoffImpervious Runoff
Control161,146,805289,71228,446,592132,406,889
Current↘15,871,880↗1,043,017↗56,883,324↘73,798,215
Midterm Goal↘18,533,251↗1,156,936↗60,167,292↘79,857,470
Final Goal↘20,303,993↗1,270,101↗63,945,390↘85,519,483

