Article

Reinterpreting Sustainable Architecture: What Does It Mean Syntactically?

Department of Architecture, Gachon University, Seongnam 13120, Korea
Sustainability 2020, 12(16), 6566; https://doi.org/10.3390/su12166566
Submission received: 30 June 2020 / Revised: 6 August 2020 / Accepted: 9 August 2020 / Published: 13 August 2020

Abstract

:
How can sustainable architecture be described spatially? Is there any way of looking at sustainable architecture from a spatial perspective? This paper aims to explore whether a syntactical viewpoint would be an appropriate focus, and attempts to address how a configurational approach contributes to our understanding of sustainable architecture. To explore the possible theoretical framework in understanding sustainable architecture from a spatial perspective, three buildings (namely, Olympic House, SK Chemicals R&D, and the Epson Innovation Center), which are recognized as the most sustainable buildings by Leadership in Energy and Environmental Design and Comprehensive Assessment System for Built Environment Efficiency, are selected and analyzed by using visibility graph analysis, a useful analytical tool in space syntax. The in-depth theoretical studies and literature reviews have suggested that the atria in sustainable architecture play a substantial role in maximizing energy efficiency, minimizing negative impacts on the environment, and generating spatial integration. Thus, it is concluded that sustainable architecture is economical in technological, environmental, and spatial ways as well.

1. Introduction: The Problem of Sustainable Architecture

Space has long been a key issue in areas of architectural research, and this topic attracts the attention of many different disciplines, such as cognitive science, environmental psychology, environmental graphic design, and even sociology. That is, a built space not only works as a physical shelter, but it is also a “meaningful and informative formation expressive of the culture and lifestyle of different societies and of the transformations that the social structure has experienced” [1] (p. 54.1). It is the distinctive characteristics of social systems that embody spatial formations, and spatial formations, in turn, can be seen as “visual symbols of societies” [2]. If this is so, what is the problem in understanding sustainable architecture?
It has been admitted that sustainable architecture is an architecture which aims to maximize energy efficiency by using the most modern technologies and, in turn, minimize negative impacts on the environment. In addition, there are diverse viewpoints regarding sustainable architecture that go beyond such a technological viewpoint. Guy and Farmer (2001) present six alternative logics of ecological design—eco-technic logic, eco-centric, eco-aesthetic, eco-cultural, eco-medical, and eco-social—and one of the reasons why they try to identify such aspects is to argue that sustainability is not an uncontested single homogeneous concept, but should be understood as an interpretative flexible one, because “debates about sustainable architecture are shaped by different social interests, based on different interpretations of the problem, and characterized by quite different pathways toward a range of sustainable futures” [3] (p. 146). Susan Maxman also suggests that sustainable architecture is not “a prescription” but “an approach” and “an attitude,” and therefore, it “should be just architecture” (cited in [3] (p. 140)). Further, Guy and Moore contend that “we need to recognize and analyze green buildings as a series of contingent hybrids, an understanding of which is inseparable from the encounter with the people and places that shaped their design and development” [4] (p. 3). In this way, sustainable architecture should be seen not only as an ecological context but also as an activity of constituting a spatial layout and forming human behaviors.
However, it is not clear how strongly sustainable architecture is related to spatial formations, and how it characterizes spatial configurations. This paper, therefore, aims to shed light on creating a new framework of viewing sustainable architecture from a spatial perspective, and to provide a substantial understanding by looking at in-depth literature reviews and case studies.

2. Sustainable Architecture

As is well known, the term sustainable development was introduced in the Our Common Future report of the Brundtland Commission in 1987, and defined as “development that meets the needs of the present without compromising the ability of future generations to meet their own needs.” In particular, the issue of sustainable development was widely accepted as one of the important matters which are central to our present and future as well. Considering its significance, the United Nations Conference on Environment and Development held in Rio de Janeiro in 1992 took the first step of communicating sustainable development, and generating substantial agreement on what to do and how to reach sustainable standards. In 2002, the World Summit on Sustainable Development identified that poverty, which is one of the threats, should be reduced to overcome hindrances of sustainable development. The underlying purpose of sustainable development is to help developing countries reasonably manage their natural resources and to utilize them without depleting these resources, and make them ecologically and economically balanced. As Dr Brundtland said, “healthy life is an outcome of sustainable development, as well as a powerful and undervalued means of achieving it,” and we need to understand “health as a precious asset in itself, and as a means of stimulating economic growth and reducing poverty” [5]. Therefore, sustainable development is strongly related to a better life (or sustainable living).
In this, Vallero and Brasier stress that “we have a core ethic of intergenerational equity,” and “future generations should have an equal opportunity to achieve a high quality of life” [6] (p. 175). They go further to say that this goal, a sustainable global ecological and economic system, is achievable “in part by the wise use of available resources,” and thus, sustainable development can only be achieved through “green engineering” [6] (p. 175).
Green engineering is defined as “the design, commercialization and use of processes and products that are feasible and economical while reducing the generation of pollution at the source and minimizing the risk to human health and the environment.” In practice, green engineering can be implemented by “principles of green programs, such as ‘waste prevention,’ ‘safe design,’ ‘low-hazard chemical syntheses,’ ‘renewable material use,’ ‘avoiding chemical derivatives,’ ‘selection of safer solvents and reaction conditions,’ ‘improved energy efficiencies,’ ‘design for degradation,’” and so on [6] (pp. 180–182). In short, the primary aim of green engineering is to achieve “waste reduction,” “materials management,” “pollution prevention,” and “product enhancement.” In the case of building design, green architecture begins with a close look at given site conditions or environmental characteristics, because it is believed that a given building site is not empty but full of fragile macrobiotics, microclimate, and urban fabrics as well. Therefore, green architecture can be described as the “means of allowing people to become more in touch with the environment in which they live … [and incorporating] natural landscapes into the design of the building which gives people a better connection to the land” [6] (p. 168).
Similar to the conception of green architecture, Guy and Farmer try to understand sustainable architecture in terms of not an absolute or incontestable conception, but a relative or variant one. This is because “the concept of a green building is a social construct,” and therefore “individuals, groups, and institutions embody widely differing perceptions of what environmental innovation is about” [3] (p. 140). Considering this, they analyze some studies of completed buildings and conduct a literature review of books, articles, and reports which are primarily concerned with sustainable, environmental, ecological, or green buildings, and they suggest a total of six logics: eco-technic, eco-centric, eco-aesthetic, eco-cultural, eco-medical, and eco-social. First, the key feature of the eco-technic logic is its “globalized viewpoint” which is concerned with “the universal, global environmental problems of climate change, global warming, ozone layer depletion, and transitional pollution,” and, in architectural practice, the representative issue is “efficiency,” so that the design strategy is based on “modern and high-technology buildings that attempt to maximize the efficiency of building in spatial, construction, and energy terms” [3] (pp. 141–142). Second, the eco-centric logic proceeds from the recognition of “the dynamic interaction between the living and nonliving as a community of interdependent parts,” so that this logic encompasses “nonliving objects and ecological systems” [3] (pp. 142–143). The main approaches to building begin with inquiring whether to build at all. If necessary, the main objective of erecting a building is focused on reducing its ecological footprint. Third, the eco-aesthetic is the view that the role of sustainable architecture should act to “inspire and convey an increasing identification with nature and the nonhuman world” [3] (p. 143). This logic emphasizes “individual creativity and a liberated imagination combined with a romantic view of nature that rejects Western rationalism, modernism, and materialism,” so that the solution to the environmental crisis requires “a shift from utilitarian values to a view in which aesthetic and sensual values play a prominent role” [3] (p. 144). On the contrary, the eco-cultural stresses “a fundamental reorientation of values to engage with both environmental and cultural concerns,” so that the key issue of this logic is to preserve “a diversity of existing cultures” [3] (p. 144). Unlike the eco-technic logic, this one argues for “decentralization”, and focuses on local characteristics. Within this logic, sustainable architectural approaches correspond to the “cultural values of a particular place or people.” The eco-medical construct is mainly concerned with sustaining individual health, so it focuses on “the adverse impacts of the built environment and the causes of stress that engender health problems, both physical and psychological” [3] (p. 145). In building design, this logic is dealt with particularly by reducing chemical pollution from synthetic materials used in the interior of the building. Lastly, the eco-social aspect addresses that “the root cause of the ecological crisis stems from wider social factors”, so it proposes “the decentralization of industrial society into smaller, highly self-sufficient, and communal units, working with ‘intermediate technologies that are based on an understanding of the laws of ecology’” [3] (pp. 145–146).
Taken as a whole, we have gone through a literature review, from the definition of sustainable development to those diverse aspects which play an important role in understanding sustainable architecture, via green engineering, which is mainly concerned with increasing efficiencies with the help of technological advances and finding a better way of building function itself. However, those aspects hardly cover the spatial issue which is an integral part of the architecture. Specifically, they seldom provide us with a useful framework to understand how strongly sustainable development is related to the pattern of spaces or spatial configuration.

3. Configurations and Space Syntax

3.1. Configurational Approach in Understanding Built Forms
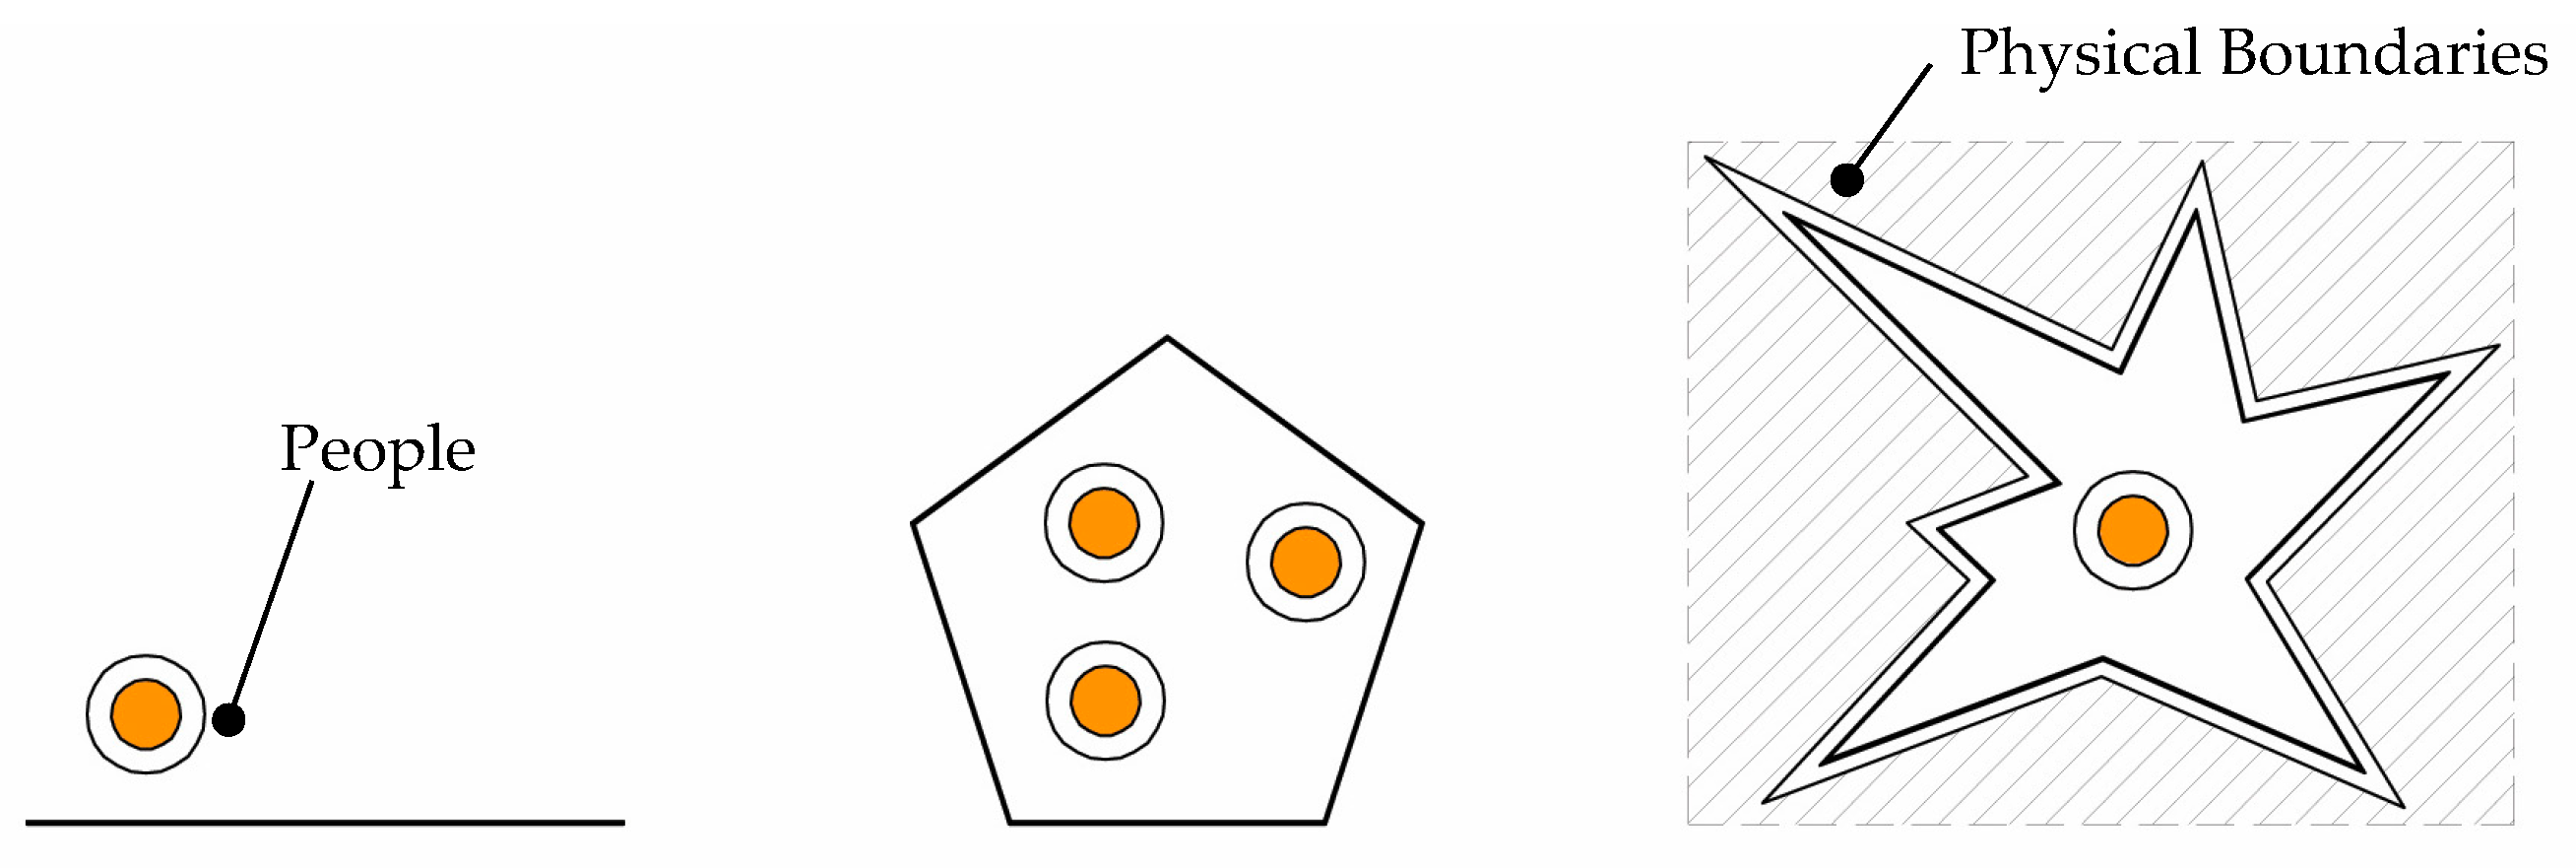
The term configuration refers to “the particular arrangement or pattern of a group of related things,” and Hillier et al. (1987) take this a step further, under a spatial consideration, to argue that configuration can be defined as, at least, “the relation between two spaces taking into account a third, and, at most, as the relations among spaces in a complex taking into account all other spaces in the complex” [7] (p. 363). Spatial configuration, therefore, is a way to constitute spatial patterns and forms. For example, say you are asked to build a shelter like a hut. Working on this, you realize that even though it can be constructed in a very simple way, the act of both creating boundaries of inside or outside and partitioning into sub-spaces is logical and sociological as well. It is because the drawing of these boundaries “establishes not only a physical separateness but also the social separateness of a domain,” and therefore “the logical distinction and the sociological distinction … emerge from the act of making a shelter even if they are not intended” [8] (p. 16). Human activities, such as encountering, congregating, avoiding, interacting, dwelling and conferring, are “attributes of patterns” which are “formed by groups or collections of people” [8] (p. 20), and these activities are carried out in spatial configurations. Therefore, architecture is understood as the relation between space and people.
In the article Configurations and urban sustainability (2004), Akkelies van Nes has a slightly different approach from that of Hillier: he stresses that urban morphology is not an object but a process within which a continual transformation of urban cultures and economies has taken place, and urban layout, as an ongoing product, affects a certain kind of behavior both socially and economically. This transformation is, effectively, driven by the conception of sustainable development which is one of the major issues in the Brundland report of 1987 and the 1992 Earth Summit in Rio de Janeiro. Based on this idea, van Nes asserts that urban sustainability takes account of “compactness,” and the compact city model is the most sustainable way of “living and low energy use for transportation” [9] (p. 413). In particular, both movement and interaction are important issues in understanding urban compactness. For example, retail shops, which are one of the integral parts of urban activities, are strongly correlated with the configurational features of urban layout: the more the urban layout is integrated, the more shoppers’ movement is attracted. In other words, the urban layout has a deterministic influence on attracting people’s movement, and placing retail shops accordingly as well.

3.2. Space Syntax

Space syntax is “a set of techniques for the presentation, quantification and interpretation of spatial configuration in buildings and settlements” [7] (p. 363), and it is considered an analytical tool for describing spatial formations, identifying the pattern of people across configurational characteristics, and understanding social meanings.
Space syntax represents spaces in many ways, such as convex space, axial line or isovist, and these representations are markedly ecological because they are strongly interrelated with our behaviors. In Figure 1, for example, people move through spaces in lines and this movement is drawn by an axial line; people interact in a convex space which is described by a polygon; and, lastly, people see through spaces and get a “visual field at a certain standing point” [10] (p. 36), and this visual field is called isovist, defined as “the set of all points visible from a given vantage point in a space” [11] (p. 47). In particular, the two former representations (i.e., convex space and axial line) are quantified and explained in terms of depth.
Therefore, how can we understand depth in relation to our behaviors and spatial configurations? For this, we need to look at a rural French house. Figure 2 shows a ground floor plan and justified graphs. The justified graph is the most useful device not only for showing ‘configurational properties in visual form’, but also for illustrating in a numeric way how deep or shallow a certain space might be [13] (p. 30). Simply, this graph can be drawn in this way: a circle, which is selected as a root, is put at the base; all circles, which are directly connected to the root, are aligned above the root, meaning depth 1; then all circles, which are directly connected to those at depth 1, are aligned above them again at depth 2; and one repeats this process until all depth levels from the root are explained. After having completed drawing the graph, we can obtain the total depth from the root by adding up the numbers which are computed by multiplying the number of circles by the depth level: in Figure 2(b-1), for example, the total depth from the root, the grande salle (reception room), is 31 (31 = 0 × 1 + 1 × 1 + 2 × 2 + 3 × 3 + 4 × 3 + 5 × 1). Like this, the total depths from outside and the salle commune (everyday communal living and cooking space) are measured, and they are 21 and 18 accordingly (Figure 2(b-2,b-3)).
The ground plan, justified graphs drawn from different roots, and the total depth values give us important configurational characteristics. The space of the grande salle is located just by the main entrance, which leads to a vestibule and the upper floor, so it could be thought that it is significant because of its direct accessibility from the outside. In terms of the depth conception, however, this space has a total of 31 depths, and it can be thought overall that it is located in the most remote part of the house, and, hence, is hard to reach by family members. On the other hand, the salle commune has a total of 18 depths, and it is relatively shallow and thus recognized as a central place. Although this rural house shows a simple spatial composition, the grande salle, which is mainly used as a reception room for visitors, is intentionally placed far from the ‘salle commune’, which is a central place for family. Therefore, it is noted that the configurational properties of space, in particular the total depth, are seen as a powerful way of understanding how spaces are arranged and how the spatial formation works.

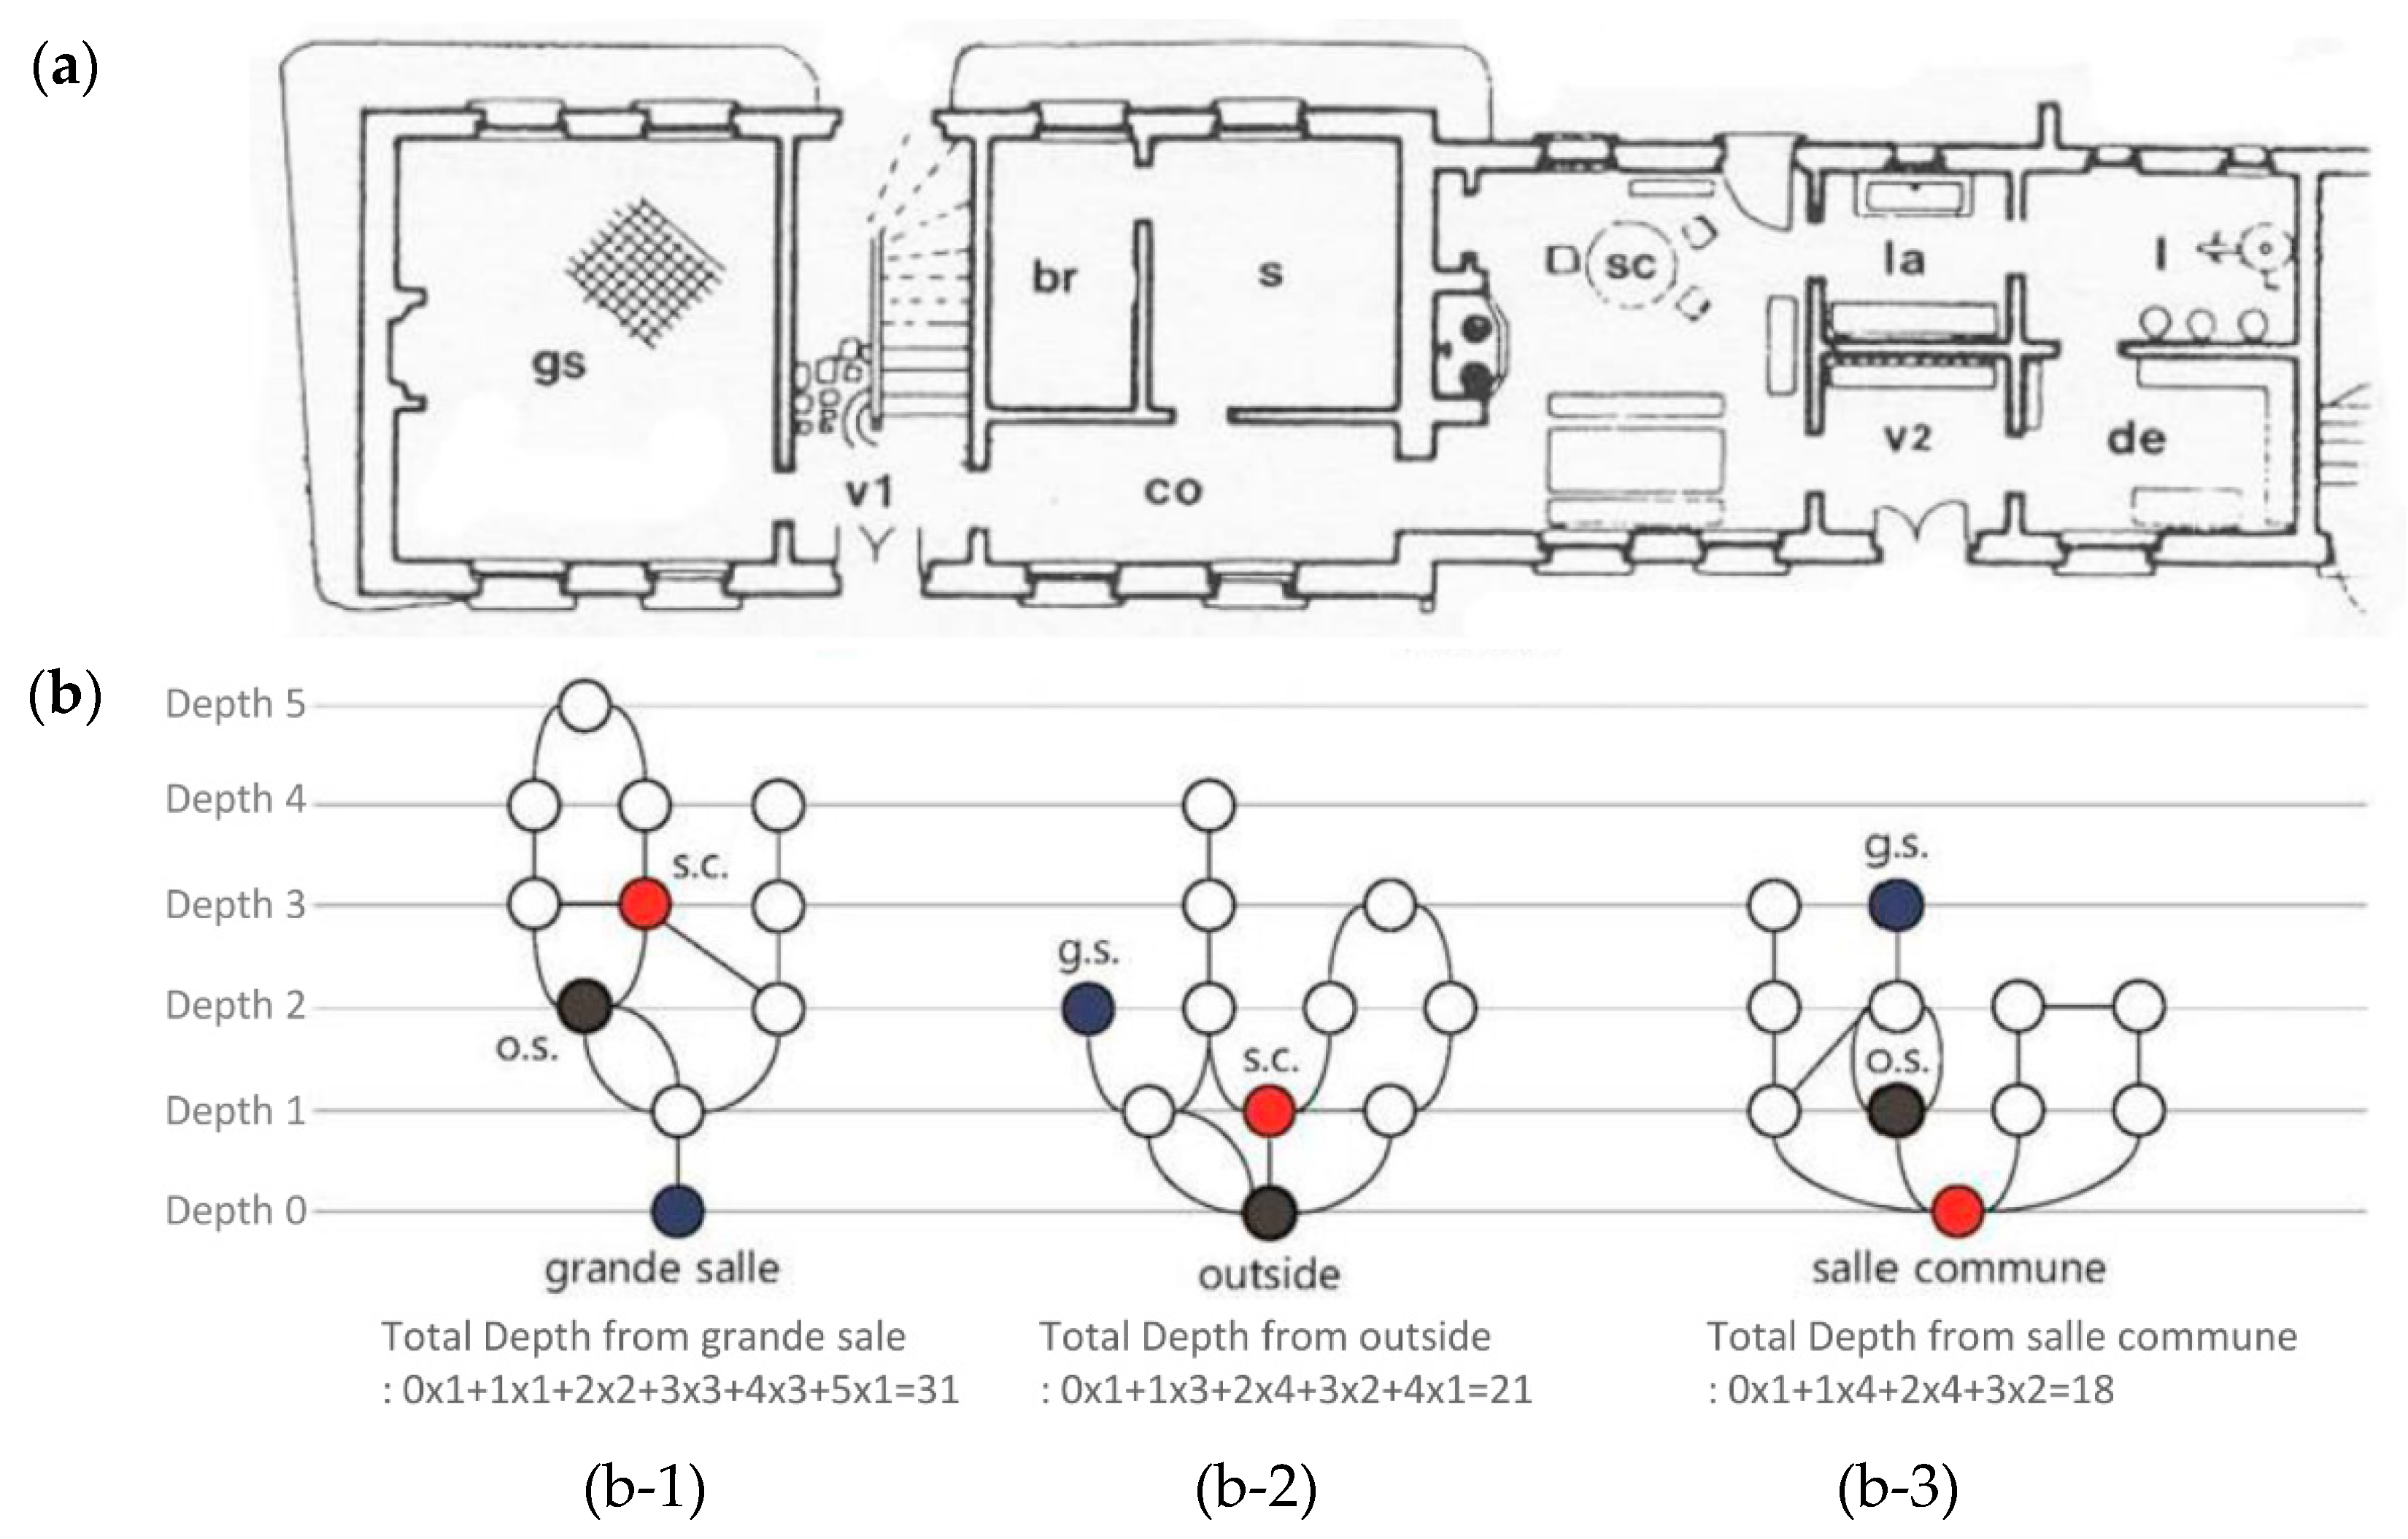
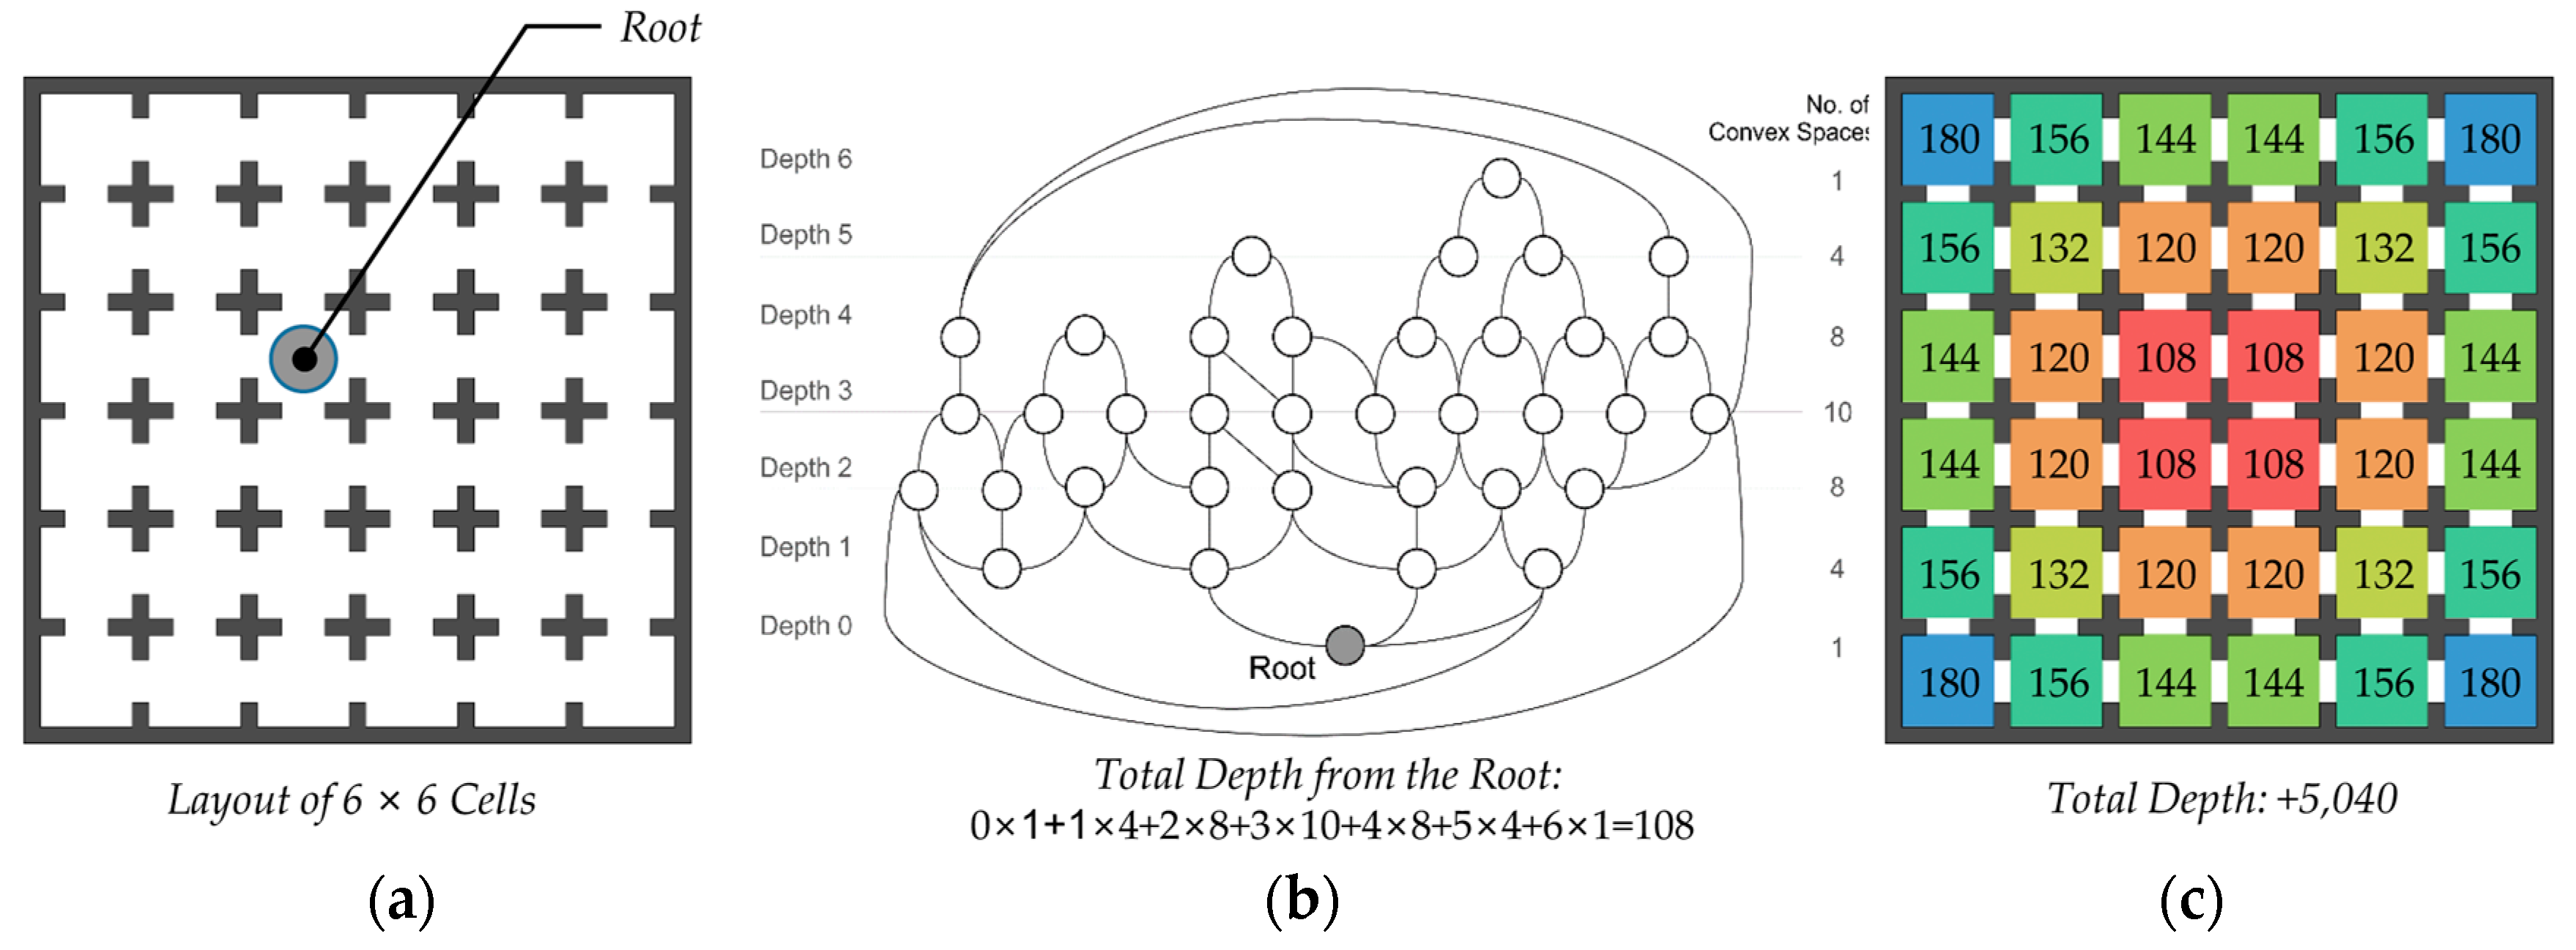
3.3. Partitioning Theory: Gaining or Losing Total Depths

We need to take a step further and ask in what way configurational properties affect depth gains or losses, or, in turn, how depth gains or losses determine spatial formations. Regarding these questions, Hillier suggests partitioning theory. Consider a simple six by six half-partitioned complex, wherein a total of 36 cells are placed within a square boundary, and all cells are open to each other (Figure 3a). As we already know from the analysis of the rural French house, the total depth values for each cell can be obtained from the justified graph. For example, Figure 3b shows a justified graph of a certain root in the layout of 6 × 6 cells, and a total number of 108 depths is measured (108 = 0 × 1 + 1 × 4 + 2 × 8 + 3 × 10 + 4 × 8 + 5 × 4 + 6 × 1). When we repeat the drawing of the justified graphs and computing the depths for the other cells, depths can be obtained (see Figure 3c). One of the interesting findings in this analysis is that there is a pattern. That is, the central four cells have the least number of total depth values, 108, while the corner cells have the greatest number, 180. As Hillier notes about this, it is clear that “the differences between the cells are due to the relation of the cell to the boundary of the complex,” and “Corner cells have most depth, center edge rather less, then less toward the center” [8] (p. 223). This means that the boundary of the complex works as bars so that the cells located at the corner have more depths than the ones at the center. When we add up all of the total depths of the cells, this spatial formation has 5040 depths.
Placing a bar between cells leads to gaining total depths. Hillier explains the barring and gaining depth relation in terms of four principles: centrality, extension, continuity, and linearity [8].

3.3.1. Principle of Centrality

The principle of centrality dictates that the depth gain will be maximized when a bar is at or near the center, rather than at the edge. For example, when we place a bar in the leftmost horizontal top line in Figure 4(a-1), the total depth is increased from 5040 to 5060—an additional 20; when locating the bar one to the right, the number is increased from 5040 to 5072 (Figure 4(a-2)), and on placing the bar at the center, the number rises from 5040 to 5076—a gain of 36 (Figure 4(a-3)). These depth gain effects of barring from the edge to the near or center are called the principle of centrality: “more centrally placed bars create more depth gain than peripherally placed bars” [8] (p. 234).

3.3.2. Principle of Extension

Suppose that a second bar is located on an adjacent line. Figure 4(b-1–b-4) show that when the two bars are getting closer, the total depths will be increased from 5040 to 5084, 5100 and 5120—a total depth gain of 44, 60 and 80, respectively, from the default layout. When two bars are moving together toward the near or the center, the total depths will be greater, a gain of 92. These systematic effects, as Hillier suggests, are called the principle of extension: “barring longer lines creates more depth gain than barring shorter” [8] (p. 228).

3.3.3. Principle of Continuity

This principle is about the effect of continuous bars. When two bars are linked, the total depths in the aggregate will be increased from 5040 to 5168—an additional 128 depths in total from the default layout, more than the scenario where two bars are separated, which results in an additional 68 (see Figure 4(c-1,c-2)). However, when we look at Figure 4(c-2–c-4), it is quite interesting that when a two-bar L-shape is moving diagonally from the upper left corner to the lower right, the additional total depth gains are less (i.e., 128, 108, 80). Therefore, “continuous bars create more depth gain than non-continuous bars”, because the non-continuity of bars provides a way through via the shortest path [8] (p. 234).

3.3.4. Principle of Linearity

The principle of linearity is the one whereby “linearly arranged continuous bars create more depth gain than coiled or partially coiled bars” [8] (p. 234). For instance, the number of total depths in which two bars are linearly connected in Figure 4(d-1) is increased from 5040 to 5220, an additional 180. When three bars are placed in Figure 4(d-2), the total depths gain is increased to 5544. When we look at Figure 4(d-3,d-4), it is obvious that the linearly placed bars result in more depth gains than the bent ones. This principle is the most effective way of increasing total depths. This is because, according to Hillier, “it is the most economical way of constructing an object requiring the longest detour from cells on either side to the other,” and because “the longer the bar the more it has the effect of increasing the number of cells on either side of it” [8] (p. 232).

3.3.5. Losing Total Depths

Placing internal bars can affect the process of gaining total depths, and the effects always follow the four principles of centrality, extension, continuity, and linearity. On the other hand, we can imagine that there are larger spaces, such as courts or corridors, within a given spatial formation. In Figure 4e, larger spaces are created by eliminating the two-thirds partitions in the adjacent four cells. The larger spaces are made up of the same numbers, but the only differences are the shapes and locations: specifically, in Figure 4(e-1,e-2), the space is a square, and one is located at the upper left corner, while the other is at the center; Figure 4(e-3,e-4) is a rectangle, and one is placed at the near left edge, while the other at the center. As already noted, there are quite substantial distinctions between the figures. The most depth loss happens in Figure 4(e-4), from 5040 to 3866 (a loss of 1174), whereas the least depth loss is found in Figure 4(e-1), from 5040 to 4417—a loss of 622. Contrary to the partitioning theory, the total depth losses will be increased as larger spaces are placed at the center rather than at the edge or corner. Besides, the depth losses are greater when larger spaces are arranged in a linear way.

4. Research Methodology and Cases

4.1. Research Methodology
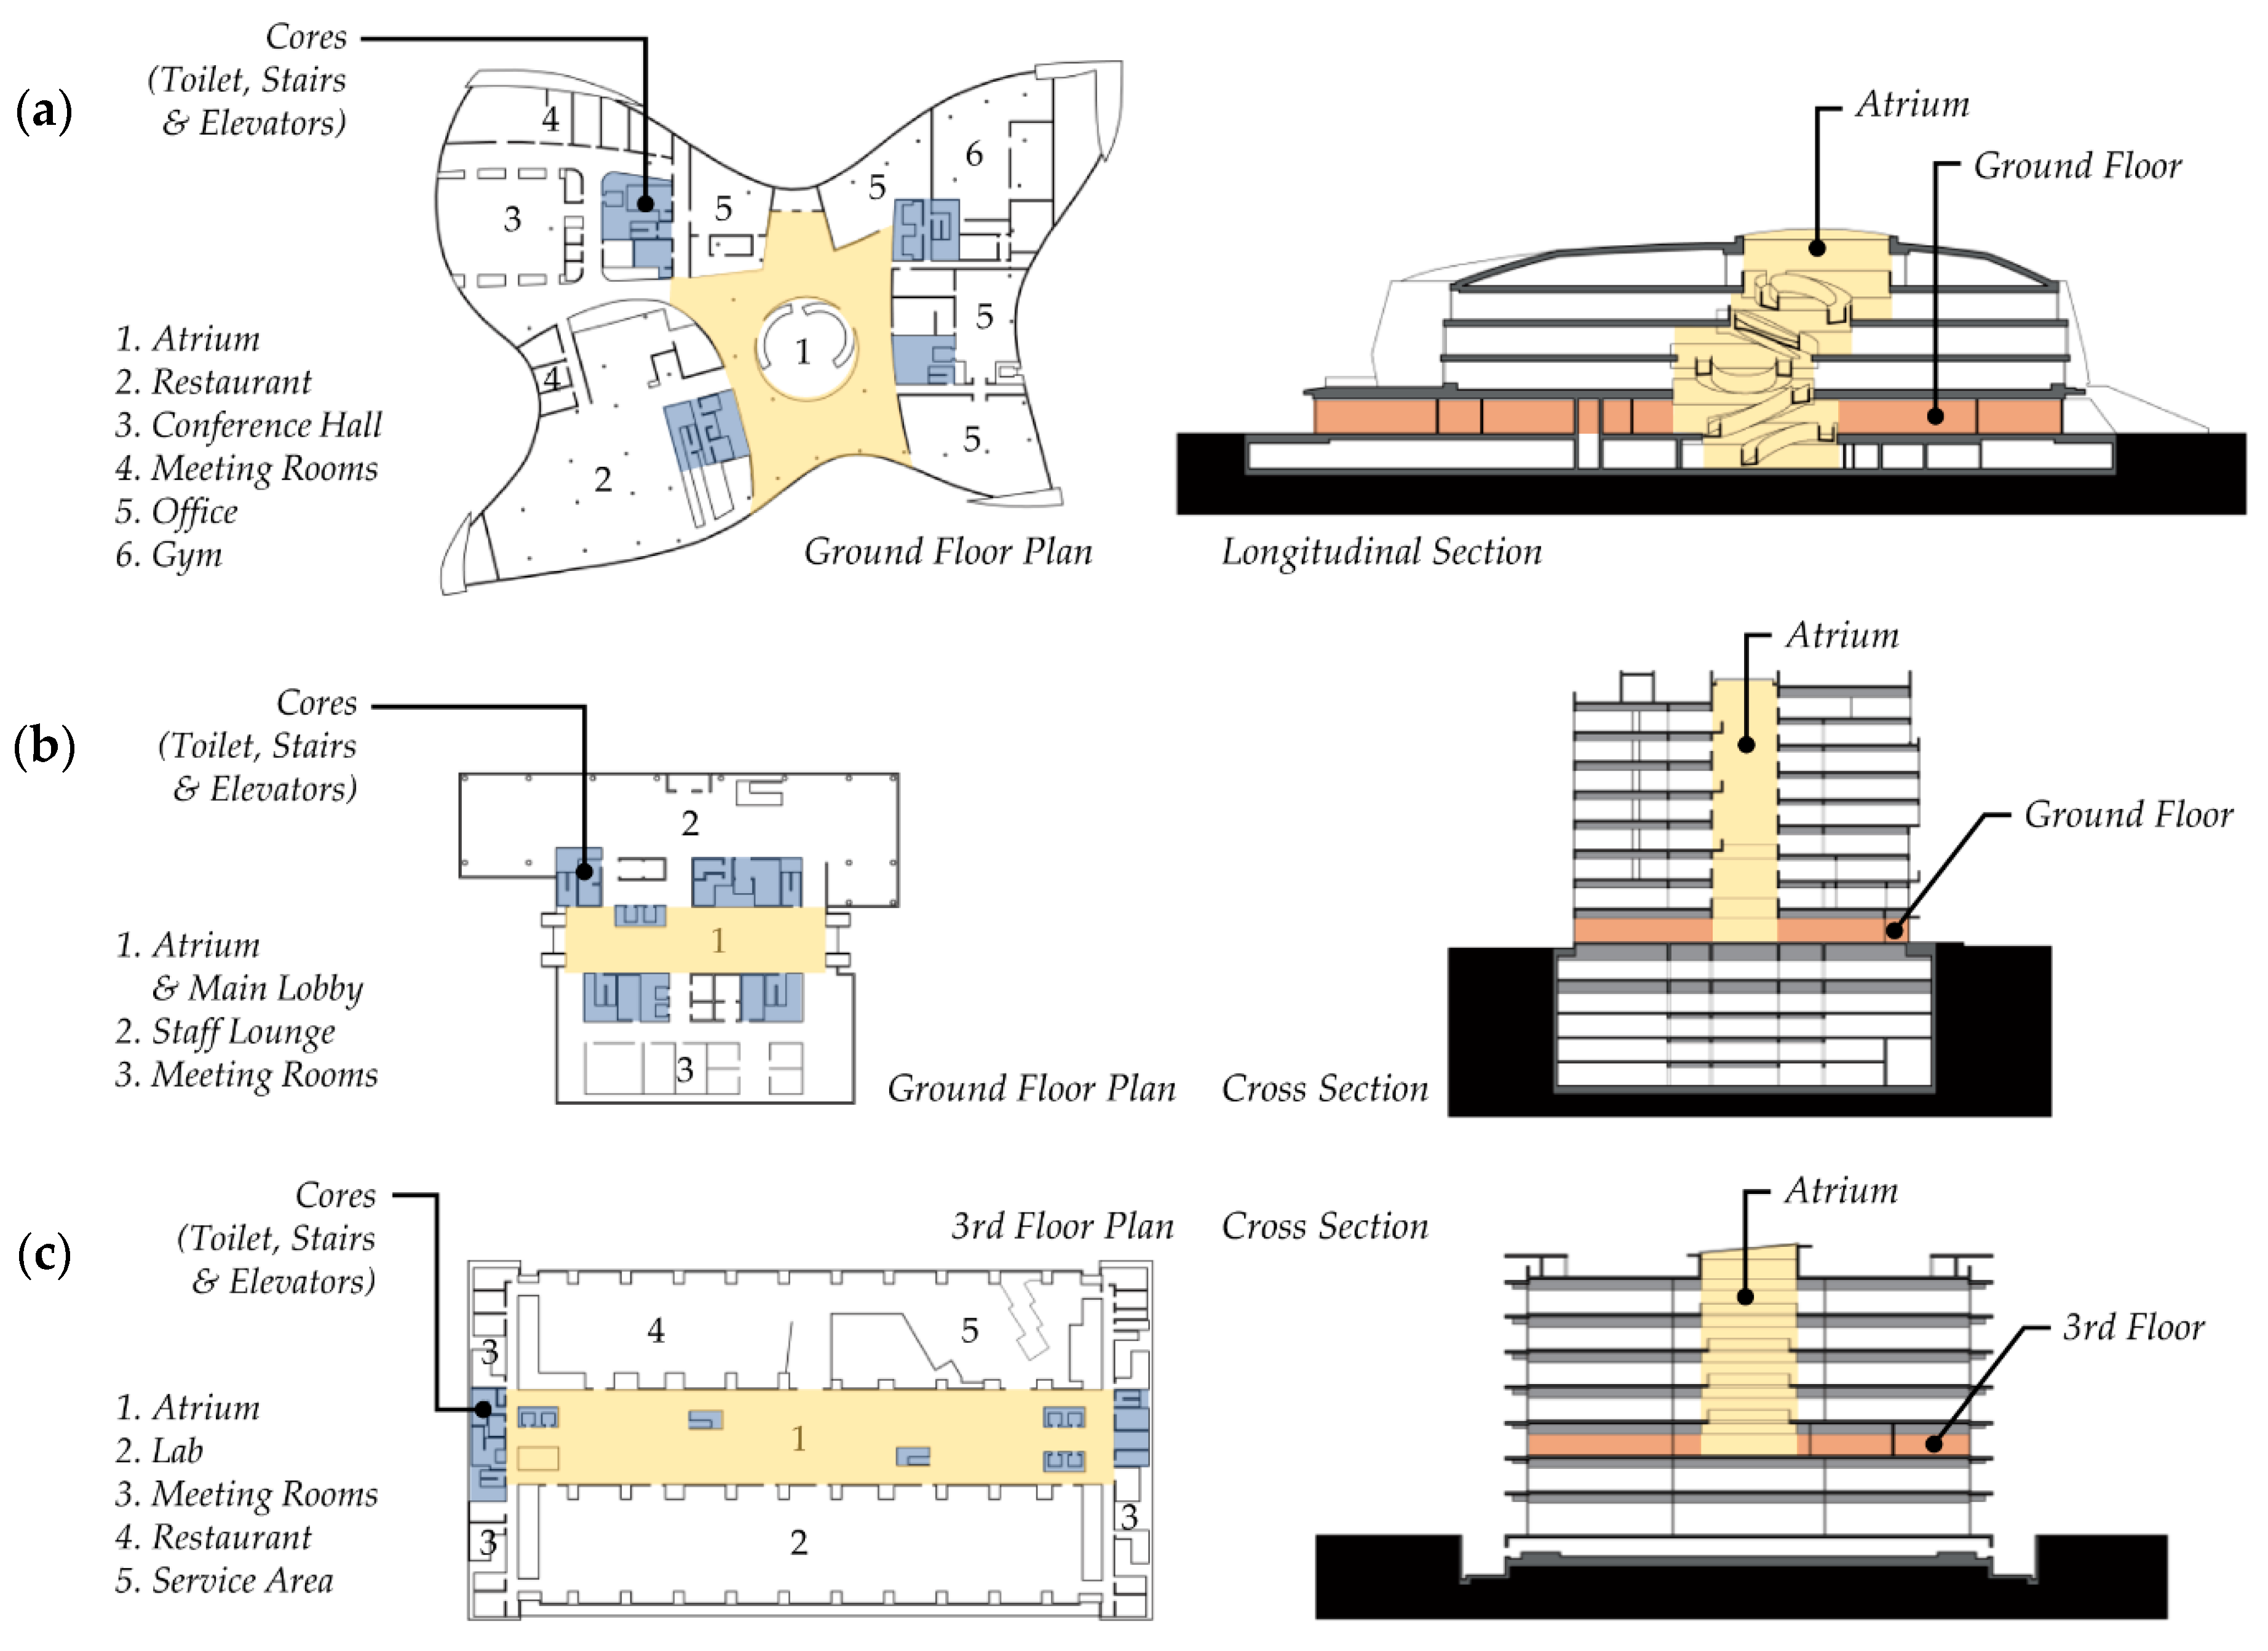
We have taken a look at the idea of partitioning theory and the theoretical scenarios of total depth gains and losses by manipulating partitions through the convex map of the six by six half-partitioned complex. In theory, convex space is a powerful approach to describing and representing spaces in a spatial layout. In practice, however, it is not easy to convert all spaces into convex spaces. In Figure 5, for instance, the spaces have several different shapes: some of them follow geometric forms like the meeting rooms in the SK Chemicals R&D Center, while others take idiosyncratic forms like the offices in Olympic House. In the Epson Innovation Center, moreover, the atrium consists of several small convex spaces due to the dispersed vertical access points, such as elevators and stairs. In this, the convex map is little used in analyzing a large and complicated floor plan, and thus, visibility graph analysis (VGA) is used in buildings.
The idea of VGA is derived from the conception of the isovist. However, the isovist is not suitable for looking into the whole spatial layout of a building, because, as we have mentioned before, “the geometric formation of the isovist represents purely local properties of space” and “the visual relationship between the current location and the whole spatial environment is missed” [14] (p. 104). In relation to this, Turner suggests a VGA which allows us to understand all of the configurational properties (see Figure 5). The first step of VGA is to make a grid of point locations, and the grid spacing is normally set to 0.6 m by 1.0 m, which corresponds to human scale. After having completed the grid setting, VGA is performed using the depthmap X program (depthmapX-0.6.0_win64 version).
Similar to the convex map analysis, VGA calculates the visual depth of each point location. Here, the visual depth is defined as a “measure of the shortest path through the graph,” and it provides different measures, such as visual step depth, visual connectivity, visual mean depth, and visual integration [15] (pp. 10–17). In VGA, we can arrive at both a local and a global analysis of the graph. The local one sees how a node is directly connected to other nodes, and this measure includes visual step depth and connectivity. On the other, the global measure looks at how a node is related to the whole, and this is understood by visual mean depth and integration.
As a local feature, visual step depth can be seen as “the number of turns that it takes to get from the current location to any other location” within the spatial layout. Visual step depth gives an idea of how easy or difficult it is to reach the other locations. Visual connectivity is described by the total number of direct connections to the others from a certain node. Therefore, this measure can lead us to have instant meetings or casual talks with people locally.
Visual mean depth, as one of the global features, describes the mean number of a certain node to all others within the system. If a node has a relatively high mean depth value, it is placed in remote areas. Visual integration value looks at how an individual node is related to the whole. This means that it enables us to explore how many nodes should be passed through to reach the whole system from the individual node. If a certain node within a spatial layout has a high integration value, it can be said that it is integrated or shallow. Conversely, if a node has a low value, this indicates that it is difficult to get to this node from the others, so it is referred to as segregated or deep.
Once these values are allocated to all nodes, they are grouped into five from the highest to the lowest. These groups, then, are illustrated by different colors from red to blue. Red stands for the most connected and integrated nodes, and the lowest values of step depth and mean depth. On the other hand, blue stands for the most disconnected and segregated ones, and the greatest values of step depth and mean depth. These colors suggest important ideas of “where the most integrating spaces are,” “what they relate to in the system,” and “what type of pattern the strong integrating spaces make” [2] (p. 115). Furthermore, these ideas make us think of how intelligible or unintelligible a spatial layout would be [8]. If a spatial system is intelligible, what we see on a node at a local level can lead us to understand what we cannot see at a global level, even though the amount of information is scant. Therefore, it can be said that the spatial morphology is predictable and apprehensible. However, if a spatial layout is unintelligible, it is hard to comprehend the relation of the local to the global. Therefore, it is expected that the morphology is not predictable. Intelligibility can be measured by the correlation between “the pattern of connectivity” and “that of integration” [8,10].

4.2. Cases

The three buildings we have chosen to describe are Olympic House, the SK Chemicals R&D Center, and the Epson Innovation Center. We need to make the point that these buildings do not represent the “ideal” sustainable buildings, and their physical performance is not an issue discussed in this article even though it has become a central concern in contemporary sustainable architecture.
In Table 1, Olympic House (OH) was newly designed as the International Headquarters of the International Olympic Committee (IOC) and construction was completed in June 2019. Before having this new headquarters, employees of the IOC were split into several buildings across Lausanne, Switzerland, and this geographical split brought about an inefficiency. For this reason, the IOC had decided to build a new headquarters big enough to accommodate all staff. The IOC had seen this new building as “an opportunity to craft a headquarters that served not only as an office space but also as a representation of their brand” [16] (p. 2). From this perspective, a “five-ring central staircase” is designed in the heart of the building, and this five-story atrium leads directly to transparent and collaborative working areas across the floors (see Figure 6a). Notably, this atrium is called the “Unity Staircase,” because it strengthens “connectivity and collaboration between the different sections of Olympic House while simultaneously representing the IOC’s mission statements of Unity in Diversity, Universality and Solidarity” [16] (p. 4). Regarding sustainability, this building has been awarded a Platinum rating and received the most points out of any Leadership in Energy and Environmental Design (LEED) v4 Building Design and Construction project up until now. Specifically, it is designed to provide every employee with access to outdoor views, and, in turn, to bring in natural daylight to office areas through the exterior and atrium. It reduces resource consumption by means of low-flow faucets and toilets, a rainwater harvester, enhanced insulation, heat recovery system, Light Emitting Diode (LED) lighting, a natural ventilation system through the atrium, and so on.
The SK Chemicals R&D Center (SK), as the second case, is located in Seongnam, South Korea, and opened in 2010. This building is divided into three sub-blocks: a northern block designed for staff who work in administration; a southern one for researchers working for developing technologies; and a central one linking to the northern and southern blocks. Specifically, the central block is designed as an atrium, which provides a splendid view of a vertical and spacious indoor environment (see Figure 6b). This center has a total of 14 floors: 5 basement floors, a ground floor, 8 office and research floors, and a roof garden. The ground floor serves as a welcoming place where all staff and visitors move around freely, and have meetings in several meeting rooms placed in the southern block or a staff lounge in the northern. This building received the Platinum Certificate from LEED v3 Building Design and Construction in 2011 [17]. Regarding green features (see Table 1), it provides good access to green areas such as a roof garden, wall fountain, green shaft and interior wall greening; energy-consumption-reducing technologies are applied across the building, such as a triple-layered low-e glass curtain walls, enhanced insulation, a micro-louver system on the top floor of the atrium, LED lighting, and vertical and horizontal louvers on the exterior walls. This center has enhanced energy-earning technologies from nature, such as a Building-Integrated Photovoltaics (BIPV) system, natural ventilation through the atrium, a geothermal heat pump, and a rainwater tank.
The Epson Innovation Center (EI) is located in Nagano, Japan, and was completed in 2006. This center is a research facility for developing next-generation information-related products and appliances. This building has a total of seven floors, and all floors are composed of an experiment and research lab, except the second one where service facilities and the research office are located. In the central part of this building, there is an atrium starting from the third floor to the top, and this atrium is intentionally designed to promote closer relationships between researchers. Interestingly, service areas are located on the second floor instead of the ground floor (see Figure 6c). In terms of sustainability (see Table 1), this center received a high score from CASBEE-NC 2008 (v.0.5), which is an evaluation and assessment system developed by the Japan Sustainable Building Consortium [18], and this building is characterized by the following criteria: a natural ventilation system using automatically opening and closing windows, a wind-based ventilation induction plate, and a backdraft damper installed in the atrium; a cooling and heating trench system which draws in fresh air and delivers it to the interior through a one-kilometer-long trench; a light duct system introducing daylight into the building, particularly the restaurant; and energy-saving technologies such as photovoltaic power generation, a vacuum type solar heater, a water saver, and the recycling of air-conditioning drainage.
Having briefly reviewed these buildings, it has been found that they are considered highly efficient buildings. One of the fascinating things is that each building has an atrium in the central area, although they are located in geographically distinct areas across the world and have different functions. This indicates that the atrium plays a substantially important role in creating energy-efficient buildings. For instance, the vertical openness from the ground floor to the top enables natural ventilation, and also this characteristic allows daylight into the central area of the building. Indeed, the atrium makes buildings more sustainable, and also makes us healthier. However, it is unclear how this atrium works spatially, or how it helps us to achieve sustainable life. To answer this architecturally fundamental question, space syntax was used in each of the cases.

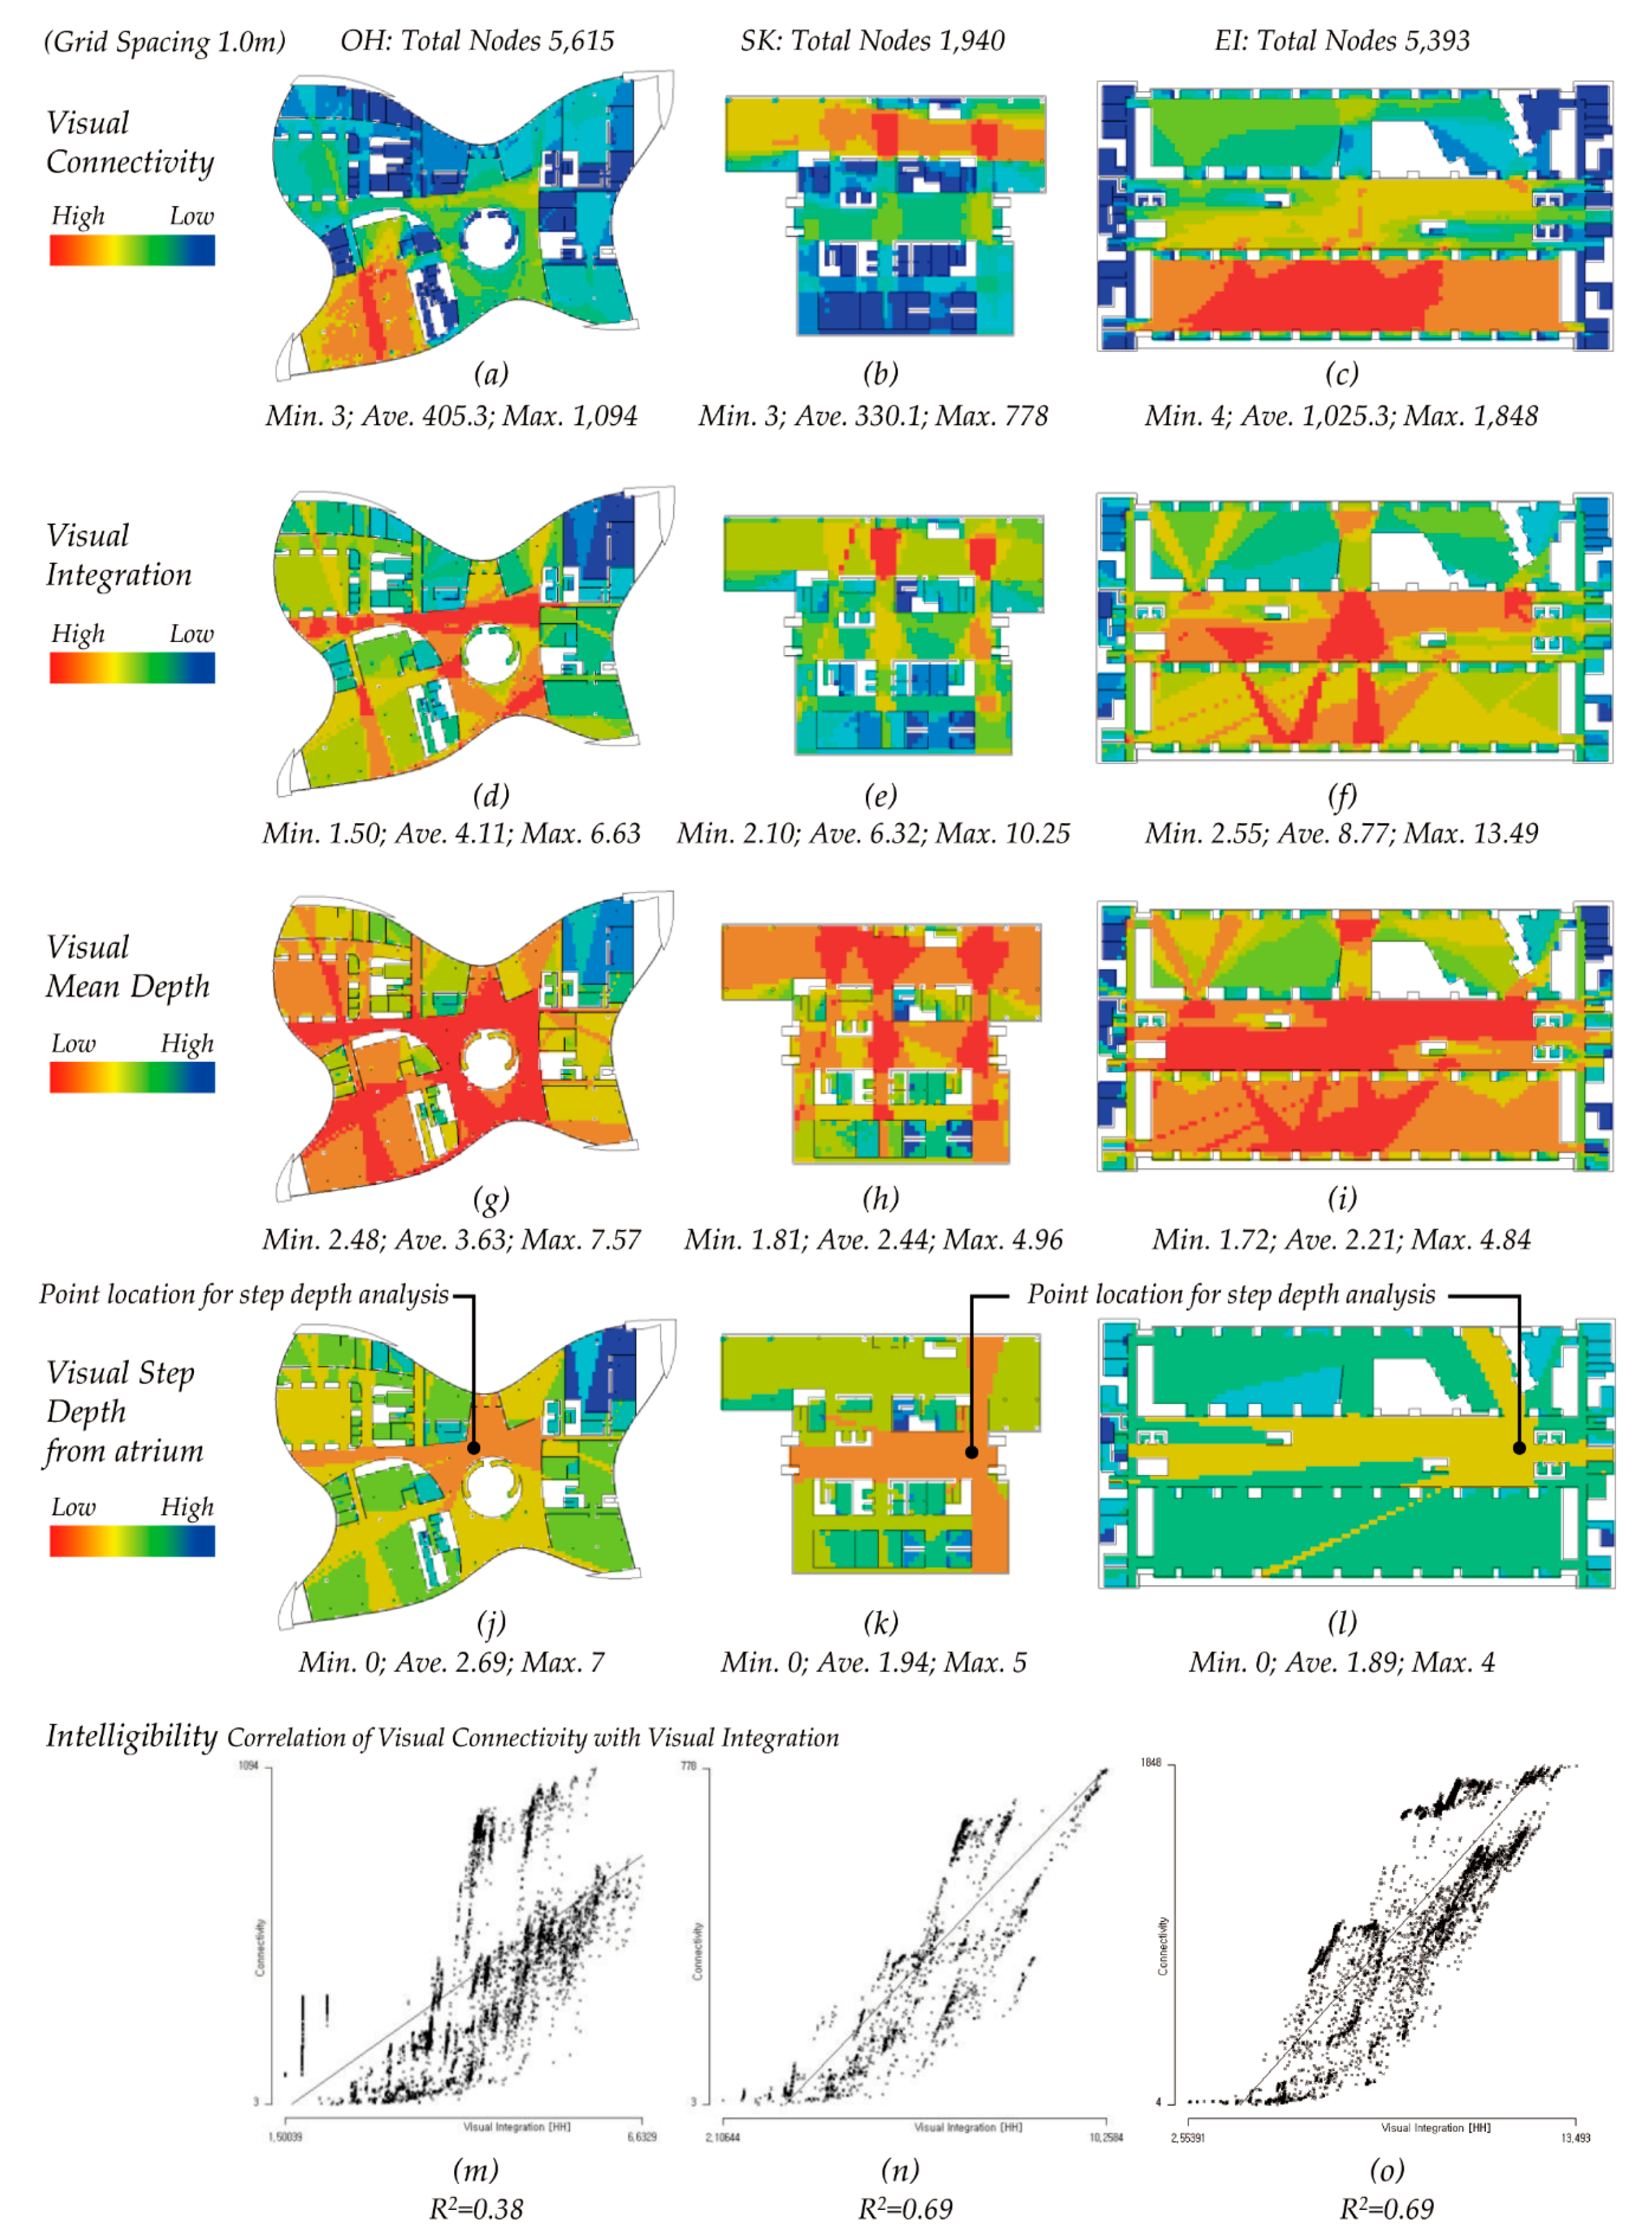
5. Syntactical Analyses and Discussion

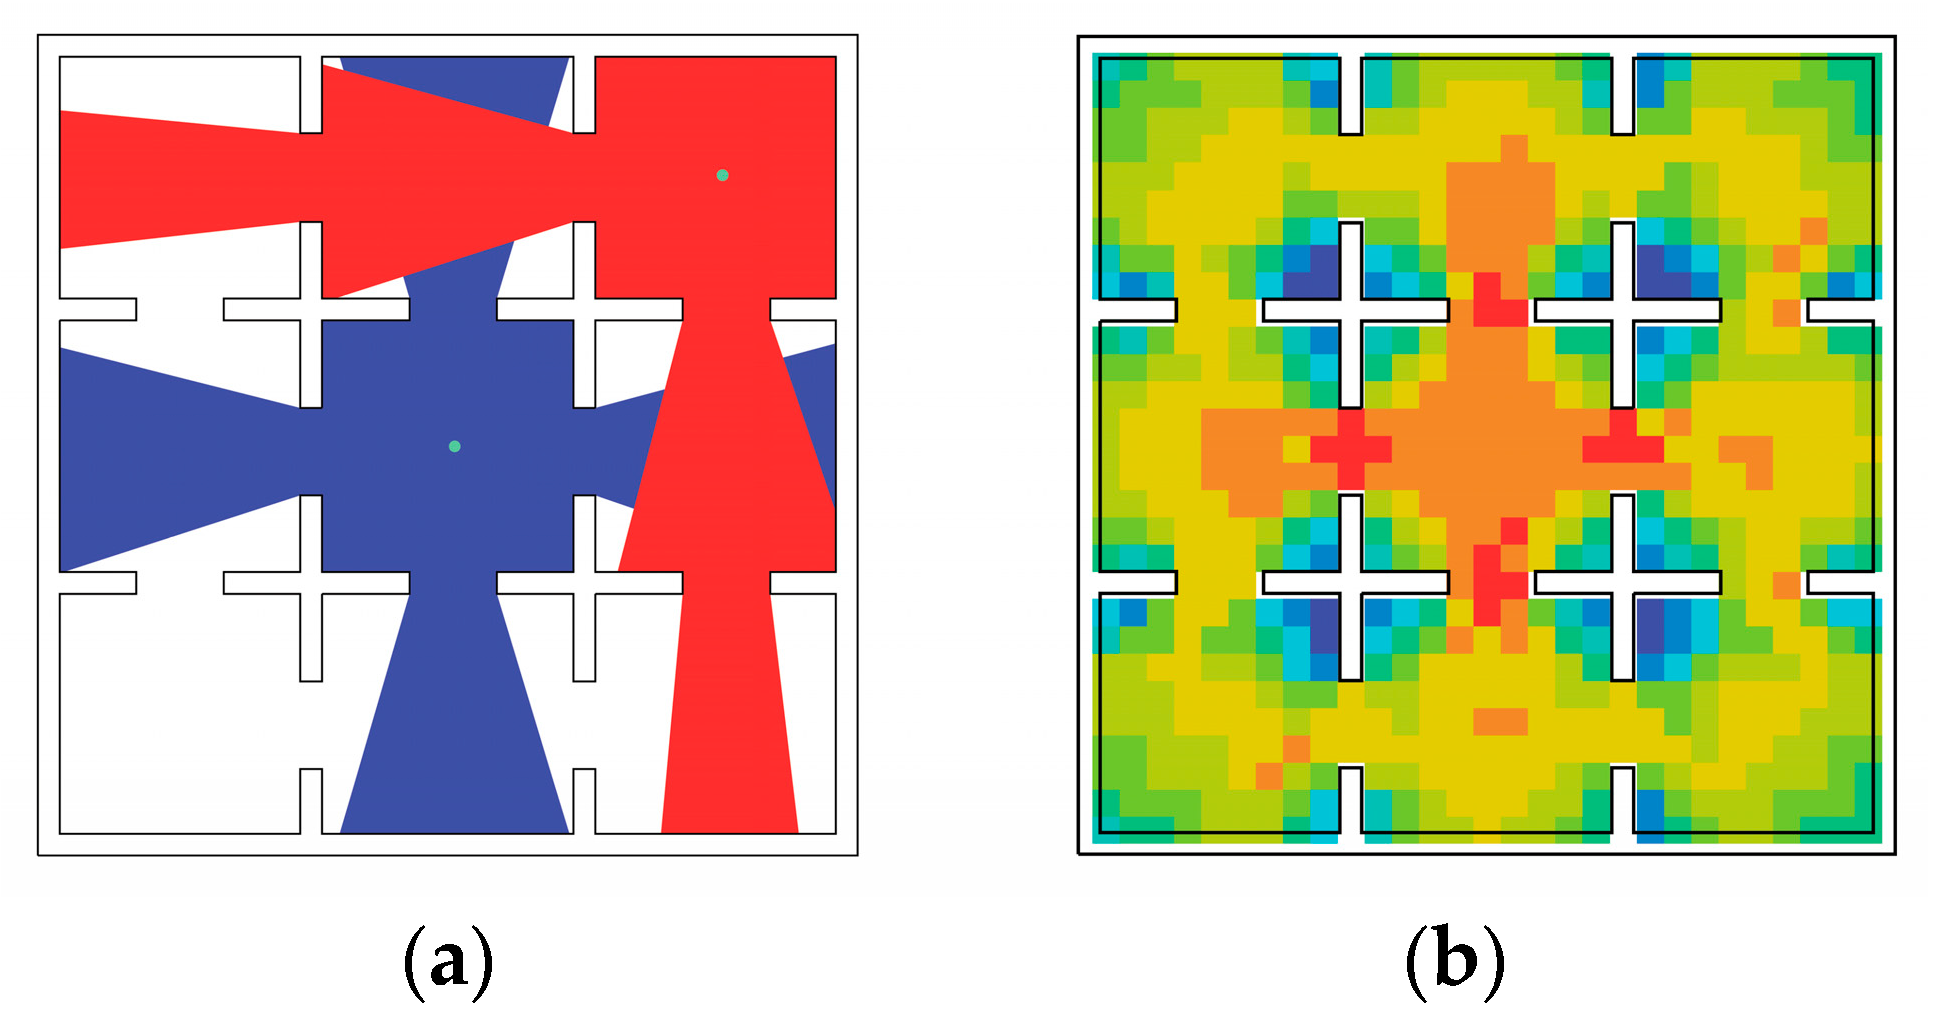
5.1. VGAs: Visual Connectivity, Integration, Mean Depth, and Step Depth

Figure 7 shows the syntactical results of the three buildings. The grid spacing of all cases was set equally by 1.0 m, and only the floor where an atrium begins in the building was investigated. All spaces, such as toilets, stairs, elevators, facility rooms and vestibules, were included, except for furniture. Through the VGA, the depthmapX-0.6.0 space syntax program, which is maintained and developed by UCL’s Space Syntax Laboratory, was used.
In the visual connectivity, it can be recognized that there is a strong pattern in terms of spatial connectedness (see Figure 7a–c). That is, the larger spaces colored in red—a restaurant in Olympic House (OH), a staff lounge in the SK Chemicals R&D Center (SK), and a lab in the Epson Innovation Center (EI)—have higher numbers of direct connections, and, in particular, the lab in the EI is the most connected space in this connectivity analysis. The smaller spaces colored in blue—meeting rooms, stairs, elevators, and restrooms in all cases—have the lowest numbers. From this result, we can understand that the larger spaces, compared to the smaller ones, offer an opportunity for social interaction because of their greatest total number of direct connections to others. However, when we look carefully at this result, we see something interesting: unlike the restaurant in OH and the staff lounge in the SK, the lab in the EI is used not as a congregational space but a research one. Of course, there is a congregational space in the EI: that is, a restaurant opposite the lab. This result can be explained in this way: the lab is larger than the atrium and the restaurant, and there are no additional architectural elements such as stairs, elevators, or partitions for this reason, the lab tends to be highly connected, with the highest number (max. 1848).
The visual integration analysis at the global level, however, gives us a different story (see Figure 7d–f). In the cases of OH and the EI, it can be said that the atria, rather than the restaurant and the lab, are the most integrated places, and in particular, this high integration value extends to the corridor between meeting rooms, and a conference hall in OH and the lab in the EI. The staff lounge rather than the atrium in the SK is still highly integrated at this level.
In the visual connectivity and visual integration, we see there is a dynamic change in terms of different levels: at a local level, social interactions take place in the congregational spaces, whereas, on a global level, the atrium is considered an important place in understanding the spatial structure and navigating other places across the building. In the case of the SK, however, the atrium hardly plays a key role in comprehending where different kinds of facilities would be across the building.
However, when we look at the visual mean step depth, it is surprising because the atria have the lowest values of total depth (see Figure 7g–i). In other words, the atria decrease the value of total depth. In particular, the SK provides a similar result to those of OH and the EI. For instance, in OH, the low mean depth values, represented in red and close to 2.48, originate from the atrium, the corridors and the conference hall, and the thresholds to the restaurant; in the SK, the low values close to 1.81 are found in the staff lounge and the atrium; and, in the EI, the values are particularly focused in the atrium, and running through the thresholds leading to the lab. In all cases, the atrium plays an important role in reducing the mean depths in total. Like the visual integration analysis, mentioned before, the visual mean depth describes how deep or shallow a certain point location would be in relation to the others at the global level. If a point location has a low mean depth value, it is easy for us to recognize and reach many locations, whereas if it has a high value, it makes it difficult to comprehend where it is and how to get there. Considering this conception, it can be argued that the atrium works well in reducing the mean depths. This, as we have reviewed via the partitioning theory, is because the atrium aims to intentionally remove several partitions, create a single large space horizontally and vertically and connect to adjacent permeable spaces, and, therefore, this is the most economical way of constructing the shortest path from one space to the others within the spatial system.
The visual step depth results make it clear how the atrium reduces the number of step depths (see Figure 7j–l). In OH, for example, most facilities, such as the conference hall, meeting rooms, restaurant, and offices, are placed one step away from the atrium; in the SK, the staff lounge and meeting rooms are directly connected from the point location; in the EI, the lab and the restaurant are easily accessed from the atrium as well.

5.2. Intelligibility (or Understandability)

We can now look at the intelligibility analysis, which is not only an important idea in space syntax but also a useful conception of the morphological features of a building. The graphs in Figure 7m–o show scattergrams for the intelligibility of three cases, and the r-squared values below the graph mean the degree of how intelligible the spatial layout would be in terms of visibility. In this analysis, what we need to look at carefully is OH: the r-squared value is 0.38, and it is quite low, whereas the other two cases show the same intelligibility; that is, 0.69. Why is OH much lower than the others? How can we understand these conflicting results?
This will be answered in terms of partitioning theory. As we reviewed before, this is understood as the theory whereby, as bars are placed at or near the center, extended, continued, and arranged linearly, the total depth of a spatial layout is increased. As a result of the depth gain, the spatial system becomes segregated and unintelligible. In contrast, as they are placed far from the center, shortened, discontinued, and arranged at angles, the total depth is reduced and, as a result, the spatial system becomes integrated and intelligible. From this aspect, it can be argued that the atrium of OH, and specifically the outline of the atrium, acts as a bar; the bar is placed at the center; it is extended, continued, and arranged linearly; it is circled; and, eventually, a block has emerged. As a result, the depth of this spatial layout is higher (the average of visual mean depth: 3.63) than that of the others (SK: 2.44, EI: 2.21) (see Figure 7g–i). Furthermore, the atrium makes it less intelligible (r-squared value of intelligibility: 0.38) than the others (SK: 0.69, EI: 0.69) (see Figure 7m–o).
In syntactical terms, the atrium works as a block, and, indeed, we cannot move through the atrium because of its vertical openness. In reality, however, there are no physically-defined partitions around it. We can see through the atrium, and these particular characteristics enable us to get some useful information about the overall morphological features and how to reach destinations [19]. Even though OH is less intelligible and has greater mean depth compared with the SK and the EI, the atrium of OH still plays an important role in reducing the mean depth across the plan, distributing people to other places, and understanding efficiently the spatial structure.

6. Conclusions and Future Studies

How, then, could we describe sustainable architecture spatially? More specifically, how could we illustrate sustainable architecture syntactically? As we have reviewed before, the three buildings all achieve most of the points assessed by LEED in the USA and CASBEE in Japan, and they are considered the most efficient buildings in the world. They are highly efficient and, therefore, economic, in that they are aimed at minimizing energy consumption by using the most advanced technologies—such as a heat recovery system, LED lighting, triple-layered low-e glass, and a micro-louver system—as well as at maximizing energy creation via a BIPV system, geothermal heat pumps, rainwater harvest, and a light duct system. In particular, the buildings have an atrium at their center for natural ventilation. Considering these advanced technologies and the designed atria, it is certain that economic value is thought of as an important issue in sustainable buildings.
Regarding the economic aspect, Hillier argues that cities can be seen as movement economies, and suggests two principles: one is “natural movement,” meaning “the tendency of the structure of the grid itself to be the main influence on the pattern of movement”, and the other is “through movement,” describing “the by-product of how the grid offers routes from everywhere to everywhere else” [8] (pp. 121–127). From this theory, he stresses that an urban system should be understood as the one which has “at least some origins and destinations more or less everywhere,” and, therefore, every trip in an urban system has “three elements: an origin, a destination, and the series of spaces that are passed through on the way from one to the other” [8] (pp. 125–126). In particular, movement in cities occurs on different scales: at a local level, locally integrated spaces are mostly taken at a local scale, whereas globally integrated spaces are mostly used at a global level. What we should note from this economic perspective is the fact that our movement patterns, even within a complex urban system, are results of the movement economies, and therefore, it is obvious that the spatial layout (or formation) is spatially economic.
If we apply this theory and framework to our research question, it can be noted that the economic issue in sustainable architecture does not just mean the design that is achieved by using mostly advanced technologies and minimizing environmentally negative impacts; it also means a highly integrated and understandable design. In other words, it is the architecture wherein a detour movement or disorientation hardly ever occurs. Therefore, it is concluded that sustainable architecture should be seen as an architecture which aims to maximize energy efficiency with the most modern technologies, to minimize the negative impacts on the environment, and, most importantly, to configure spatial patterns and forms in a spatially economical way.
Beside the spatial economics, it might be worth taking a look at whether sustainable architecture has an impact on spatial quality or not. In architecture, spatial quality is one of important issues, such that it might be an additional framework for understanding architecture. However, we could take account of this issue from a social perspective. Without doubt, as Lee argues, atria can be understood as integrated, co-dependent, and comprehensive spaces because they afford a variety of social activities such as resting, standing, waiting, descending or ascending, making one aware of people’s movement, and facilitating social behaviors and wayfinding or navigating through the visually vertical and horizontal openness [19]. It means that even though atria are thought of as conceptual spaces, their “combination of bounded convexity and visual openness” promotes social interactions and strengthens virtual community [19] (p. 260). From this social perspective, we can say that sustainable architecture contributes to structuring “a dense and random pattern of encounter”, rather than simply a pre-defined social pattern [13], so that it can be said that the objectives of sustainable architecture have an impact on making the spatial quality better.
This study is specifically focused on establishing a theoretical framework for how spatially economically sustainable architecture could be, by using space syntax theory and in particular the partitioning theory and movement economies. However, this approach is deficient in many respects. First of all, this paper has not presented how OH works practically. In other words, it is unclear whether this building works at different scales, how people move around in such an unintelligible building, and whether the atrium would play an important role in distributing people’s movement across the entire building. Besides, there is still doubt regarding how the spatial configurations of sustainable buildings would be spatially economic when compared with non-sustainable ones. Therefore, follow-up studies should be carried out to comprehend what sustainable architecture is.

Funding

This research was funded by the Gachon University research fund of 2019, grant number GCU-2019-0805.

Acknowledgments

The author would like to thank the editors and the anonymous referees for their valuable comments and suggestions that improve the quality of this paper.

Conflicts of Interest

The author declares no conflict of interest. The funder had no role in the design of the study; in the collection, analyses, or interpretation of data; in the writing of the manuscript, or in the decision to publish the results.

References

  1. Dursun, P.; Saglamer, G. Spatial analysis of different home environments in the city of Trabzon, Turkey. In Proceedings of the 4th International Space Syntax Symposium, London, UK, 17–19 June 2003; pp. 54.1–54.18. [Google Scholar]
  2. Hillier, B.; Hanson, J. The Social Logic of Space, 1st ed.; Cambridge University Press: Cambridge, UK, 1984. [Google Scholar]
  3. Guy, S.; Farmer, G. Reinterpreting sustainable architecture: The place of technology. JAE 2001, 54, 140–148. [Google Scholar] [CrossRef]
  4. Guy, S.; Moore, S.A. Introduction: The paradoxes of sustainable architecture. In Sustainable Architecture: Cultures and Natures in Europe and North America; Guy, A., Moore, S.A., Eds.; Spon Press: New York, NY, USA, 2005; pp. 1–12. [Google Scholar]
  5. World Summit on Sustainable Development. Available online: https://www.who.int/wssd/en/ (accessed on 27 February 2020).
  6. Vallero, D.; Brasier, C. Sustainable Design: The Science of Sustainability and Green Engineering, 1st ed.; John Wiley & Sons, Inc.: Hoboken, NJ, USA, 2008. [Google Scholar]
  7. Hillier, B.; Hanson, J.; Graham, H. Ideas are in things: An application of the space syntax method to discovering house genotypes. Environ. Plan. B Plan. Design 1987, 14, 363–385. [Google Scholar] [CrossRef] [Green Version]
  8. Hillier, B. Space is the Machine: A Configurational Theory of Architecture; Space Syntax: London, UK, 2007; Available online: https://spaceisthemachine.com/ (accessed on 10 August 2020).
  9. Van Nes, A. Configurations and urban sustainability. In The Sustainable City III: Urban Regeneration and Sustainability; Marchettini, N., Brebbia, C.A., Tiezzi, E., Wadhwa, L.C., Eds.; WIT Press: Southampton, UK, 2004; pp. 411–420. [Google Scholar]
  10. Lee, J.H. The Impact of Maps on Spatial Experience in Museum Architecture. Ph.D. Thesis, UCL, London, UK, 2014. [Google Scholar]
  11. Benedikt, M. To take hold of space: Isovists and isovist fields. Environ. Plan. B 1979, 6, 47–65. [Google Scholar] [CrossRef]
  12. Hillier, B. The Art of Place and the Science of Space. World Archit. 2005, 185, 96–102. Available online: https://discovery.ucl.ac.uk/id/eprint/1678/ (accessed on 10 August 2020).
  13. Hillier, B.; Penn, A. Visible College: Structure and randomness in the place of discovery. Sci. Context 1991, 4, 23–49. [Google Scholar] [CrossRef] [Green Version]
  14. Turner, A.; Doxa, M.; O’Sullivan, D.; Penn, A. From isovists to visibility graphs: A methodology for the analysis of architectural space. Environ. Plan. B Plan. Des. 1987, 28, 103–121. [Google Scholar] [CrossRef] [Green Version]
  15. Turner, A. Depthmap 4: A Researcher’s Handbook; Bartlett School of Graduate Studies, University College London: London, UK, 2004; Available online: https://discovery.ucl.ac.uk/id/eprint/2651/ (accessed on 10 August 2020).
  16. Case Study: Olympic House. Available online: https://www.usgbc.org/education/sessions/case-study-olympic-house-12538375 (accessed on 13 March 2020).
  17. Park, K. 2011 Korean Architecture Award: SK Chemicals’ Eco Lab. Archiworld Vol. 199, 30 November 2011; 100–105. [Google Scholar]
  18. Epson Innovation Center. Available online: http://www.ibec.or.jp/jsbd/Q/index.htm (accessed on 13 March 2020).
  19. Lee, J.H. Identifying spatial meanings of atria in built environment and how they work. J. Asian Archit. Build. Eng. 2019, 18, 247–261. [Google Scholar] [CrossRef]
Figure 1. Space is not a background but an intrinsic aspect of human activity. (redrawn from the original image from Figure 1 [12] (p. 5)).
Sustainability 12 06566 g001
Figure 2. (a) Ground floor plan of a rural French house; (b) Justified graphs of three primary spaces (grande salle, outside, and salle commune) (reproduced from Figure 1 [13] (p. 31)).
Sustainability 12 06566 g002
Figure 3. (a) Default layout of 6 × 6 cells open to each other; (b) Example of justified graph and total depth from the selected Root; (c) Total depth values of each cell on color schemes (red ones such as the four cells in the center have the least total depth, 108, whereas blue, like the corner four cells, have the most depth values, 180) (redrawn from Figure 8.2(a) [8] (p. 224)).
Sustainability 12 06566 g003
Figure 4. (a) Principle of centrality and depth gain effects; (b) Principle of extension and depth gain effects; (c) Principle of continuity and depth gain effects; (d) Principle of linearity and depth gain effects; (e) Subtracting partitions and depth loss effects (the numbers depicted on cells stand for additional depth gains, compared with the default layout where all cells are open to each other) (regenerated from Figure 8.3–8.9 [8] (pp. 225–237)).
Sustainability 12 06566 g004
Figure 5. (a) Two isovists on a 3 × 3 complex; (b) Visibility graph analysis (VGA) with integration values on a 3 × 3 complex on a 0.7 m-grid (source from Figure 2.4 [10] (p. 42)).
Sustainability 12 06566 g005
Figure 6. Plans and sections of cases: (a) Olympic House: IOC Headquarters; (b) The SK Chemicals R & D Center; (c) The Epson Innovation Center.
Sustainability 12 06566 g006
Figure 7. Syntactical results of VGA: (ac) visual connectivity; (df) visual integration; (gi) visual mean depth; (jl) visual step depth from atrium; (mo) scattergrams for the intelligibility, which is the correlation between visual connectivity and visual integration with r-squared value.
Sustainability 12 06566 g007
Table 1. Building facts and green features of three cases.
CasesMain Features
Olympic House
  • Located on the shores of Lake Geneva in Lausanne, Switzerland
  • Total floor area: 25,000 m2
  • Total six floors (basement + ground floor + three office floors + roof terrace)
  • Opened in June 2019
  • Energy rating: Platinum awarded (93/110) from LEED v4 BD + C 1
  • Green features
    -
    Providing access to outdoor views and bringing in natural daylight to the office through windows and atrium
    -
    Reducing resource consumption (i.e., low-flow faucets and toilets, rainwater harvester, enhanced insulation, heat recovery system, Light Emitting Diode (LED) lighting, natural ventilation system through the atrium, etc.)
The SK Chemicals R & D Center
  • Located in Seongnam, South Korea
  • Total floor area: 47,652 m2
  • Total 14 floors (5 basement floors + ground floor + 8 office and research floors + roof garden)
  • Opened in September 2010
  • Energy rating: Platinum awarded (55/69) from LEED v3 BD + C
  • Green features
    -
    Providing access to green areas such as roof garden and wall fountain
    -
    Reducing energy consumption (i.e., triple-layered low-e glass, enhanced insulation, micro-louver system, LED lighting, etc.)
    -
    Earning energy from nature using a Building-integrated Photovoltaics (BIPV) system, natural ventilation through the atrium, geothermal heat pump, rainwater harvester, etc.)
The Epson Innovation Center
  • Located in Nagano, Japan
  • Total floor area: 53,372.05 m2
  • Total seven floors (seven experiment and research floors)
  • Opened in February 2006
  • Energy rating: S (excellent) awarded from CASBEE-NC 2 2008 v.0.5
  • Green features
    -
    Natural ventilation system using automatic ventilation windows and atrium
    -
    Using ground heat by a cooling and heating trench system
    -
    Applying energy-saving technologies such as photovoltaic power generation, a vacuum type solar water heater, water saver, using rainwater, recycling of air-conditioning drainage, etc.
    -
    Light duct system
1 LEED v4 BD + C = Leadership in Energy and Environmental Design version 4 Building Design + Construction established by the U.S. Green Building Council (USGBC). 2 CASBEE-NC = Comprehensive Assessment System for Built Environment Efficiency—New Construction developed by Japan Sustainable Building Consortium (JSBC).

