Article

Determination of the Optimal Operative Conditions for the Torrefaction of Olive Waste Biomass

by
Jaime Martín-Pascual
1,
Joaquín Jódar
2,
Miguel L. Rodríguez
3 and
Montserrat Zamorano
1,*
1
Department of Civil Engineering, Campus Fuentenueva, University of Granada, 18071 Granada, Spain
2
Department of Mathematics, Campus Las Lagunillas, University of Jaén, 23071 Jaén, Spain
3
Department of Applied Mathematics, Campus Fuentenueva, University of Granada, 18071 Granada, Spain
*
Author to whom correspondence should be addressed.
Sustainability 2020, 12(16), 6411; https://doi.org/10.3390/su12166411
Submission received: 9 June 2020 / Revised: 4 August 2020 / Accepted: 6 August 2020 / Published: 10 August 2020

Abstract

:
The need for new energy sources and the problems associated with waste in the agroforestry industry are an opportunity for the recovery of this waste. For the use of this agricultural waste as energy, different pretreatments, such as torrefaction, can be carried out. Torrefaction is a thermochemical treatment involving energetic densification of biomass at temperatures ranging from 200 to 300 °C under an inert and anaerobic environment. This study developed a numerical model to evaluate the effect of temperature and residence time of torrefaction on biomass from olive tree waste to determine optimum operative conditions for the process. Four temperatures and four residence times, in the operation range of the process, were tested to determine the weight loss and the higher heating values (HHVs) of the torrefied sample. From these data, a numerical model was developed to infer the complete behavior of the process in the temperature range between 200 and 300 °C and in the residence time range of a few minutes to 2 h. The HHV of the torrefied sample increased at a temperature between 200 and 275 °C. However, from 275 to 300 °C, there was an HHV decrease. The effect of the residence time depended on the torrefaction temperature. At low temperatures, there were no statistically significant differences, although an increase of HHV was detected under 120 min. However, at 250 °C this effect was reversed, and statistically significant differences were not observed between 30 and 120 min. Overall, the increase of temperature in the torrefaction process reduces the residence time needed to achieve the maximum HHV. As a result, the optimum conditions of torrefaction for this biomass were, approximately, 275 °C and 30 min of residence time. This reaction yielded an optimum 5830 cal/g HHV.

1. Introduction

Environmental issues and climate change will require our society to transition to more sustainable means. To achieve this transition, the development of a new concept of waste disposal and energy creation must be considered. Efficient valorization of agricultural waste is a key factor in developing new strategies for the circular economy [1], and renewable energy sources can be used worldwide to mitigate the impact of global warming and to decrease the high dependence on fossil fuels in the energy market [2,3]. Renewable energy has environmental benefits, since bioenergy can not only reduce carbon dioxide emissions but also decrease the environmental impact caused by organic wastes and the economic development of rural areas. Biomass is one emerging and fundamentally important source of renewable energy [4]. Biomass-derived energy is often preferred over other renewable alternatives, including wind and solar power, due to its higher and decentralized availability [5].
Biomass is a primary source of renewable carbon that can be used as feedstock for biofuel production. Using biomass as an energy source allows for energy independence [6] because it can be converted into fuels and chemicals through thermochemical and biochemical processes, making it a potential alternative to fossil fuels [7,8]. There is considerable potential for bioenergy from several sources, since a wide range of feedstocks can be used for bioenergy generation. These sources include energy crops, biomass residues, and organic wastes [4]. Lignocellulosic biomass is a renewable energy source with a carbon-neutral cycle and relatively low cost of production, originating from energy plantations or residues from primary or industrial processing of crops and forest products [9].
While in northern Europe, it is common to use wood biomass, such as bark, wood chips, and sawdust, the Mediterranean area has great potential from agricultural residues, namely the olive oil sector [4]. Olives are the most extensively cultivated fruit crop in the world and are particularly widespread throughout the Mediterranean region. Olives play an important role in the rural economy, local heritage, and environment protection of the Mediterranean region [10]. Furthermore, in 2014, the five largest olive oil producer countries were Spain, Italy, Greece, Tunisia, and Morocco [1]. There is consequently a considerable amount of waste generated from the olive industry in these countries. In this context, several options of valorization may be of interest, especially given the amounts produced and environmental impacts caused [11].
The residual biomass produced in the olive sector is the result of the large quantity of olive groves and olive oil manufacturers that generate byproducts with a potentially high energy content [12]. Moreover, olive tree waste production takes place for a short period of the year, so large amounts of waste accumulate in a short period of time. All these facts hamper the use of raw olive biomass due to the difficulty of storing, transporting, and grinding it [13]. One of the main alternatives to enhance the energy quality of the biomass and to support its increased use as a fuel source is the application of post-harvest treatments [9]. Many methods used to extract energy from lignocelluloses have been developed, including combustion, pyrolysis, gasification, and torrefaction [14]. Torrefaction can help to overcome some of the above-mentioned limitations by converting biomass into an upgraded solid material with increased energy density and decreased oxygen content, which is, therefore, more suitable for energy generation [4]. Elemental analysis done by Martin-Lara et al. revealed that the composition of olive tree pruning moved from lignocellulosic biomass to coal during the torrefaction [15].
Torrefaction is a thermochemical technology used to treat biomass at temperatures ranging from 200 to 300 °C under an inert, anaerobic environment, such as nitrogen or argon [13,16,17]. Although there is a small loss of carbon from biomass during torrefaction, a large quantity of oxygenated compounds is lost as well [14], thus enabling energy densification of biomass and biomass homogenization [18,19].
Torrefaction is a mild pyrolysis process that may overcome some of the previously mentioned limitations, thus improving the quality of biomass feedstock [20,21]. During torrefaction, biomass is converted into an upgraded solid material with increased energy density and decreased oxygen content, which is more suitable for energy generation [4]. Torrefaction also contributes towards addressing the challenges associated with the supply chain management (regarding storage, handling, and transportation costs) [3].
Torrefied biomass has a higher heating value than raw biomass, mainly due to the reduction of moisture content and the atomic O/C and H/C ratios [3]. Therefore, torrefaction has been recommended as an efficient way to enhance solid biofuel properties through water removal, reduction of the hygroscopic range, increased grindability [6] and resistance to degradation, among other properties [22]. Torrefied material is comparable with a low-rank coal. It still retains some characteristic properties from its original biomass yet has a higher energy content and better stability against microbial degradation due to improved hydrophobic properties [4].
During torrefaction, cell walls are degraded, producing fuel in a solid form [6] with intermediate characteristics between raw biomass and charcoal. These characteristics include dark color, high carbon and energy contents, and low equilibrium moisture content [22,23,24]. During the process, other volatile products (carbon dioxide, carbon monoxide, and possible traces of acetic acid, hydrogen, and methane) and condensable and non-condensable gases (water vapor, acetic acid, furfural, formic acid, methanol, lactic acid, phenol) are also produced [4]. The volatiles eliminated during torrefaction come from partial and selective degradation of the lowest calorific fraction of the biomass composition, such as hemicelluloses and some extractives [9,25].
Torrefaction is influenced by many parameters, including biomass composition, physical properties, and operating conditions [6,19]. Temperature and residence time are the two most important parameters that influence the torrefaction process [26]. With the increase of temperature or residence time, mass efficiency decreases in the different chemical reactions that occur during the process itself [27]. Considering these parameters, the aim of this study was to evaluate the effect of temperature (200, 250, 275, and 300 °C) and residence time (0, 30, 60, and 120 min) of torrefaction on biomass from olive tree waste in relation to its weight loss and higher heating value (HHV). With these results, this study determined the optimal conditions for increasing the HHV of olive waste as a renewable energy source.

2. Materials and Methods

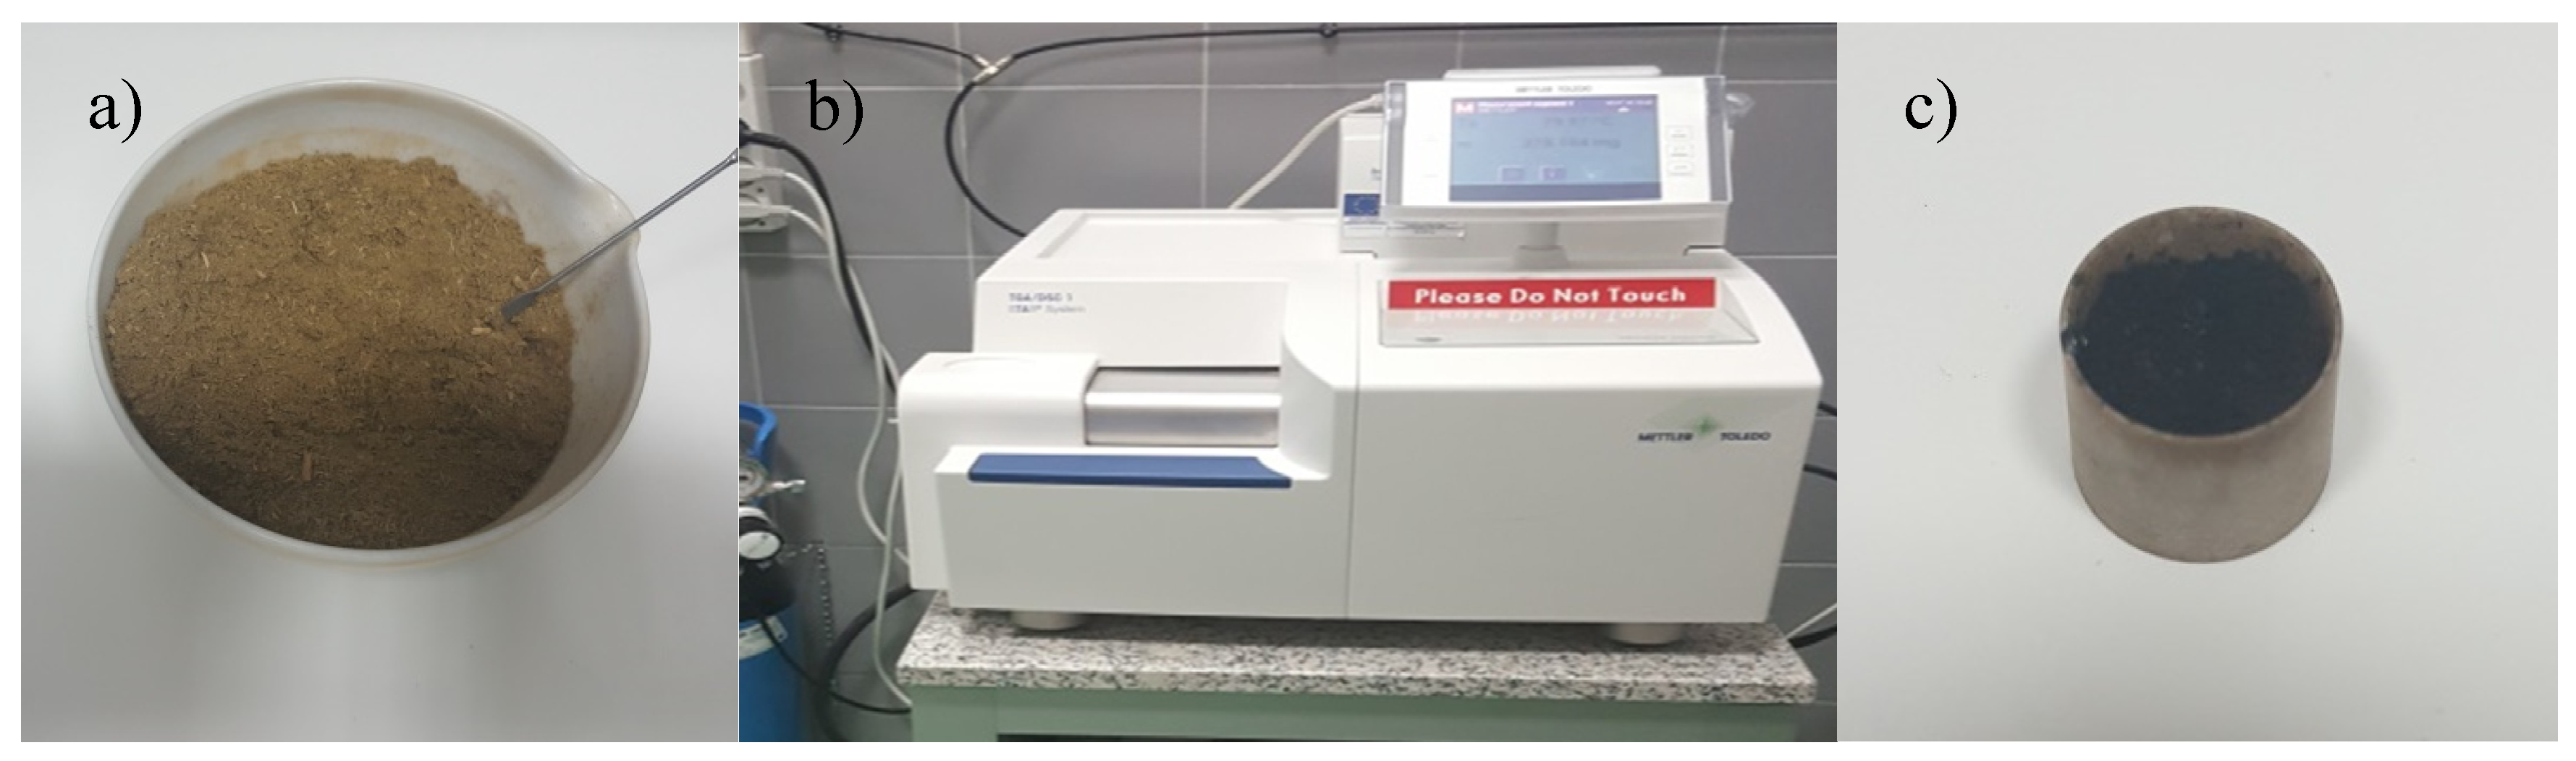
2.1. Characteristics of the Biomass

The biomass from olive trees used in this research included leaves and small tree branches originating from agricultural activities in Granada (Spain).

2.2. Torrefaction Process

Biomass was dried at 105 °C for 24 h prior to torrefaction to remove any residual water in the biomass (Figure 1a). It was needed to reduce the granulometric values of the raw materials, as a particle size smaller than 0.5 mm was necessary for thermogravimetric analysis and for ensuring the heat transfer rate.
The torrefaction process of the biomass in this study was performed with a Mettler Toledo TGA/DSC 1 thermogravimetric analyzer (Figure 1b) under inert atmosphere using 900 μL alumina crucibles as previously done by Harun et al. [28]. The initial mass of the samples was kept between 7.5 and 8 mg to avoid any possible effect on mass and heat transfer during the process. First, samples were heated from ambient temperature to the torrefaction temperature (200, 250, 275, or 300 °C) at heating rates of 10 °C/min and with 10 mL/min of nitrogen gas, as in Nakason et al. [29]. To analyze and model the effect of residence time in the torrefaction process, four conditions of this variable were tested. In the first condition, once the temperature was reached, the process was stopped (0 min of residence time), as in the study by Arias et al. [19]. In the other three conditions, when the target temperature was achieved, this was maintained during the tested residence time (for 30, 60, and 120 min). During the process, the weight loss of torrefied biomass can be determined from the percentage of the initial mass that remains at the end of the torrefaction procedure (mass yield). At the end, the HHV of torrefied sample (Figure 1c) was measured.

2.3. Moisture and Ash Content

Three samples were milled from raw material to determine their moisture content in a drying oven (105 ± 2 °C) to a constant weight and according to CEN/TS 14774-2:2004. The ash content was determined using the TGA/DSC 1 thermogravimetric analyzer (METTLER TOLEDO, Columbus, OH, United States). After the torrefaction procedure, the loss of ignition (at 550 °C) of the torrefied biomass samples was measured according to CEN/TS 14775:2004.

2.4. Determination of Higher Heating Value (HHV)

Three samples from raw material and their corresponding torrefied biomass samples were tested under the different conditions and milled to determine their heating values with a bomb calorimeter IKA C 2000, according to UNE 164001:2005 EX.

2.5. Statistical Analysis

Data obtained throughout this study were analyzed using SPSS 20 for Windows. A least significant difference (LSD) test was used to measure the differences between the weight loss and HHV obtained under the different operational conditions of temperature and residence time. An analysis of variance (ANOVA) was used to assess the homogeneity of variance, with a significance level of 5% (p < 0.05).

2.6. Numerical Model

The data experimentally obtained were used for determining two approximating functions, one for mass yield and the other one for HHV.
For a given set of data (measurements and locations at which these measurements were obtained), the approximation procedure usually tries to determine a function (“approximating function”) that is a good fit for the given data. It is considered that this good fit is achieved if the values provided by the approximating function exactly match the given measurements at the corresponding locations (or at least are close to these measurements). Once the approximating function is determined, information can also be deduced about the studied problem at locations different from those at which the measurements were obtained.
There are several techniques to determine this approximating function. The method of least squares is useful for obtaining an approximation of a set of points by analytic expressions. It is also a recommended method for approximating the problem when the available number of points is small, as was the case in this study. Its name, least squares, is due to the fact that this mathematical procedure finds the best-fitting function to a given set of points by minimizing some errors, typically the sum-of-the-squares of the residual errors. In other words, this least square deviation is reached by the function for which that minimum is achieved [30].
Additionally, approximation by radial basis functions has proved to be very useful in numerical analysis, in numerical treatment of differential, integral, and partial differential equations, in statistics, and has found applications in science, engineering, economics, biology, medicine, etc. To approximate mass yield and HHV from the data experimentally obtained, an approximant expressed as a finite linear combination of a certain radial basis function and its translations was sought. In order to do this approximation, the multiquadric function given by the expression ϕ (r) = 1 + ( ε r ) 2 , r ≥ 0, was chosen as the basis function, but there are other possibilities. A wide range of radial basis functions can be found in the literature [31,32]. The parameter ε ≥ 0 that appears in the above expression is a shape parameter.
More precisely, the formulation of the problem was the following:
Given n points (xi, yi, zi)∊R3, i = 1, …, n, a function s(x, y) that approximated the given scalar values zi at the points (xi, yi) in the least-squares sense was sought. Specifically, expression (1), where fi, i = 1, …, n, constituted a set of linear independent functions on R2 and, ai, i = 1,…, n, constituted a set of real coefficients to be determined, was set.
s ( x , y ) = i = 1 n a i f i ( x , y )
To this end, the error functional according to the expression (2) was defined, and the following minimization problem was posed: min E(a1,…, an).
E ( a 1 ,   ,   a n ) = j = 1 n ( s ( x j , y j ) z j ) 2
For all our examples, s(x, y) was assumed to have the form of expression (3), where ‖.‖ is the Euclidean norm on R2 and   ϕ ∶ [0, ∞) → R, is the basis function. In our particular case, k = n was chosen. As mentioned, the function s(x, y) is known when the a i values are determined, and this is basically done by solving a linear equation system. Namely, the critical points of the error functional, that is, those points (a1, …, an) for which all the first-order partial derivatives of E(a1, …, an) are zero, were firstly computed. Then the second derivative test was used to check if the obtained critical points were indeed minimizers of the functional E. This method is described in detail in many books [30].
s ( x , y ) = i = 1 k a i ϕ ( ( x , y ) ( x i , y i ) )

3. Results and Discussion

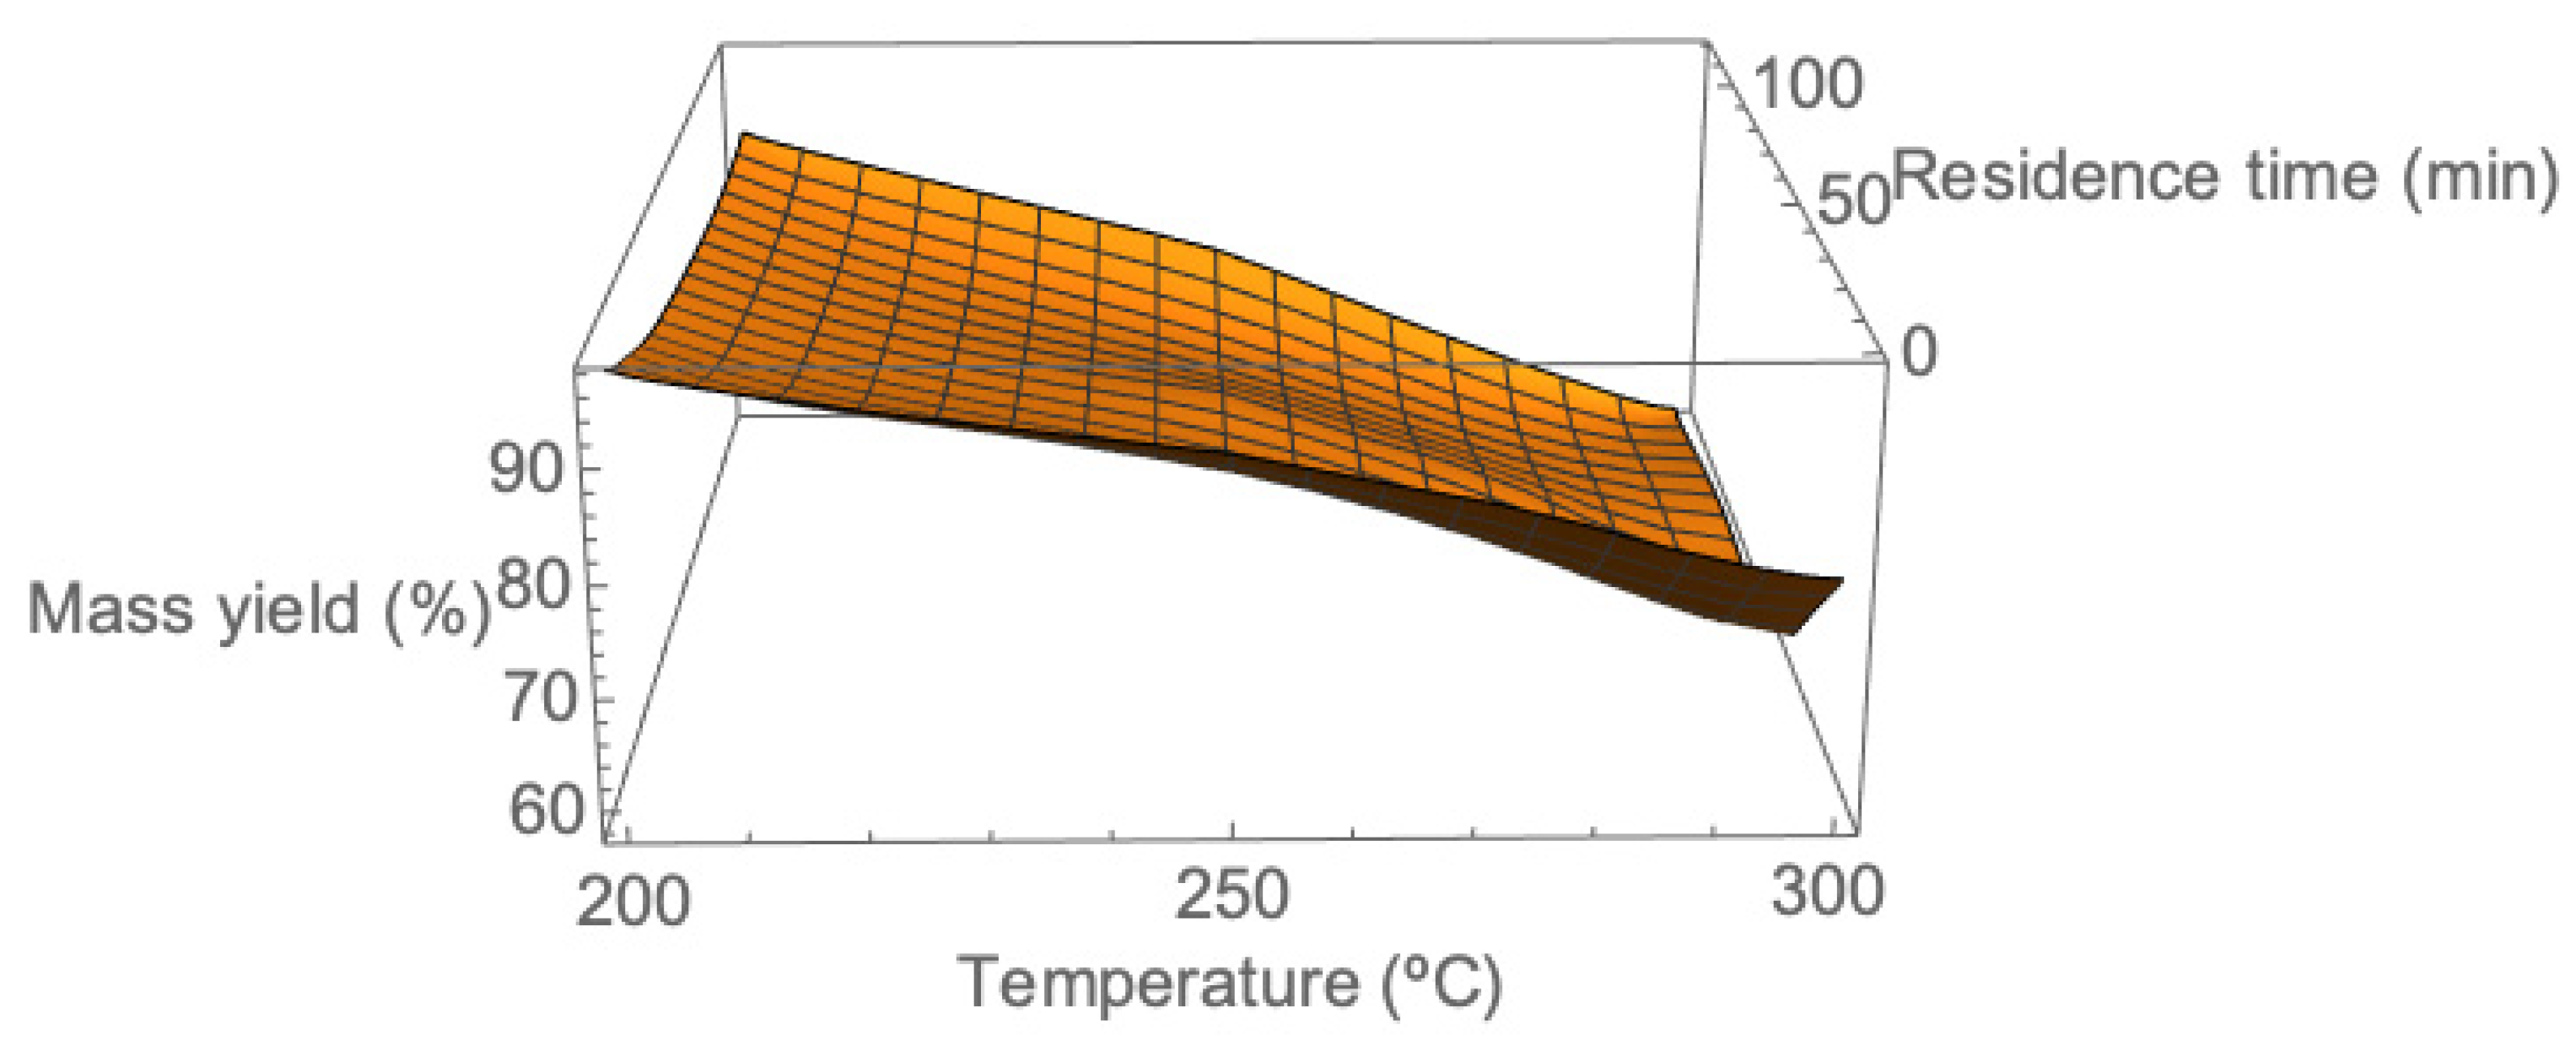
3.1. Weight Loss of Torrefied Biomass

Weight loss is an important parameter for optimizing the design and operation of a biomass torrefaction plant [6]. The mass yield (Table 1) under the different conditions of temperature and residence time was tested. In Table 1, which shows the average results obtained, the homogenous groups resulting from the analysis of the variance are indicated by superscripts. If two conditions have the same superscript, this means that no statistically significant differences were detected.
It was observed that the mass yield of the biomass tested varied between 97.48% and 57.61%. At 200 °C, the weight loss was relatively low, reaching a maximum value of 10.52% with a residence time of 2 h (89.48% of mass yield). At this temperature (i.e., the first stage), the slight decay of the biomass weight was due to the drying procedure and the release of some light volatiles [27]. According to Chen et al., the weight loss between 250 and 300 °C could be caused by dehydration reactions via bond scission with the elimination of H2O, carbonyl, and carboxyl group formation reactions with the elimination of CO and CO2, and limited devolatilization and carbonization for the production of final tars and chars [17]. For this reason, at temperatures greater than 250 °C, the weight loss was higher, leading to drastic weight reductions at 300 °C, similar to those observed by Chin et al. [6]. At a residence time of 30 min, the mass started to decline dramatically from a temperature of 275 °C, similarly to the results obtained by Phanaphanic and Mani [33]. They used pine wood chips and logging residue chips as biomass with a residence time of 30 min and observed that the biomass weight decreased to only about one-half of its original value when the torrefaction temperature reached 300 °C.
Independently of the temperature, the weight loss increased with time. However, the effect of time was higher when the temperature was increased. At 200 °C, the difference in weight during the first 2 h was approximately 8%. This difference was significantly higher at 300 °C. At this temperature, the change in weight was 24.28%. At 250 and 275 °C, the change presented intermediate values (14.82% and 18.15%, respectively). In the same way, at a constant residence time, the weight loss also increased with temperature. The effect of the temperature on the weight loss was higher when the residence time was higher too. At 0 min, the difference between 200 and 300 °C was 18.59%, whilst at 2 h the difference obtained at the same temperatures was 31.87%. These results clearly show that the effect of the temperature is higher than the effect of the residence time, similarly to the observation of Nimlos et al. [34]. They studied sawdust torrefaction and reported that the torrefaction temperature has a more profound effect on the weight loss than the residence time. In fact, when comparing the weight loss between residence times of 0 and 30 min and between 30 and 120 min, it is clear than after the first 30 min, the weight loss is lower. At 200 °C, the difference in weight between 0 and 30 min was 5.38%, while between 30 and 120 min it was only 2.72%. This reduction is similar to that obtained under low temperature (200 °C) by Chin et al. [6] in a study about the optimization of torrefaction conditions in lignocellulosic biomass. This is more significant at higher temperatures (275 and 300 °C), at which the weight loss did not present statistically significant differences. Moreover, the ANOVA showed that the results obtained with a residence time of 120 min and a temperature of 200 °C were similar to those obtained at an initial time and 250 °C.
The ash content of the raw material was 11.51% ± 0.28%. This value is increased because of the presence of olive leaves [35]. After the torrefaction, a higher ash content of the torrefied mass was observed. The relative content of ash is noticeably increased in the torrefied biomass [22], which is related to the loss of mass of organic matter during torrefaction [36]. During torrefaction, the fixed compounds remain and the ratio of mass of fixed compounds to total mass increased in the same way as the weight loss. The ash content ranged between 11.85% ± 0.28% (200 °C and 0 min) and 19.95% ± 0.24% (300 °C and 120 min). This implied a maximum increase of 73.32%. However, this value is lower than that obtained by Pinchuai et al. [37] with other raw materials such as rice husk, sawdust, or bagasse (resulting in the ash content being increased by more than 100%). One problem inherent in biomass combustion stems from the ash generated in the process [38], so the increase of the ash content could be the main disadvantage for the use of torrefaction as a pretreatment.

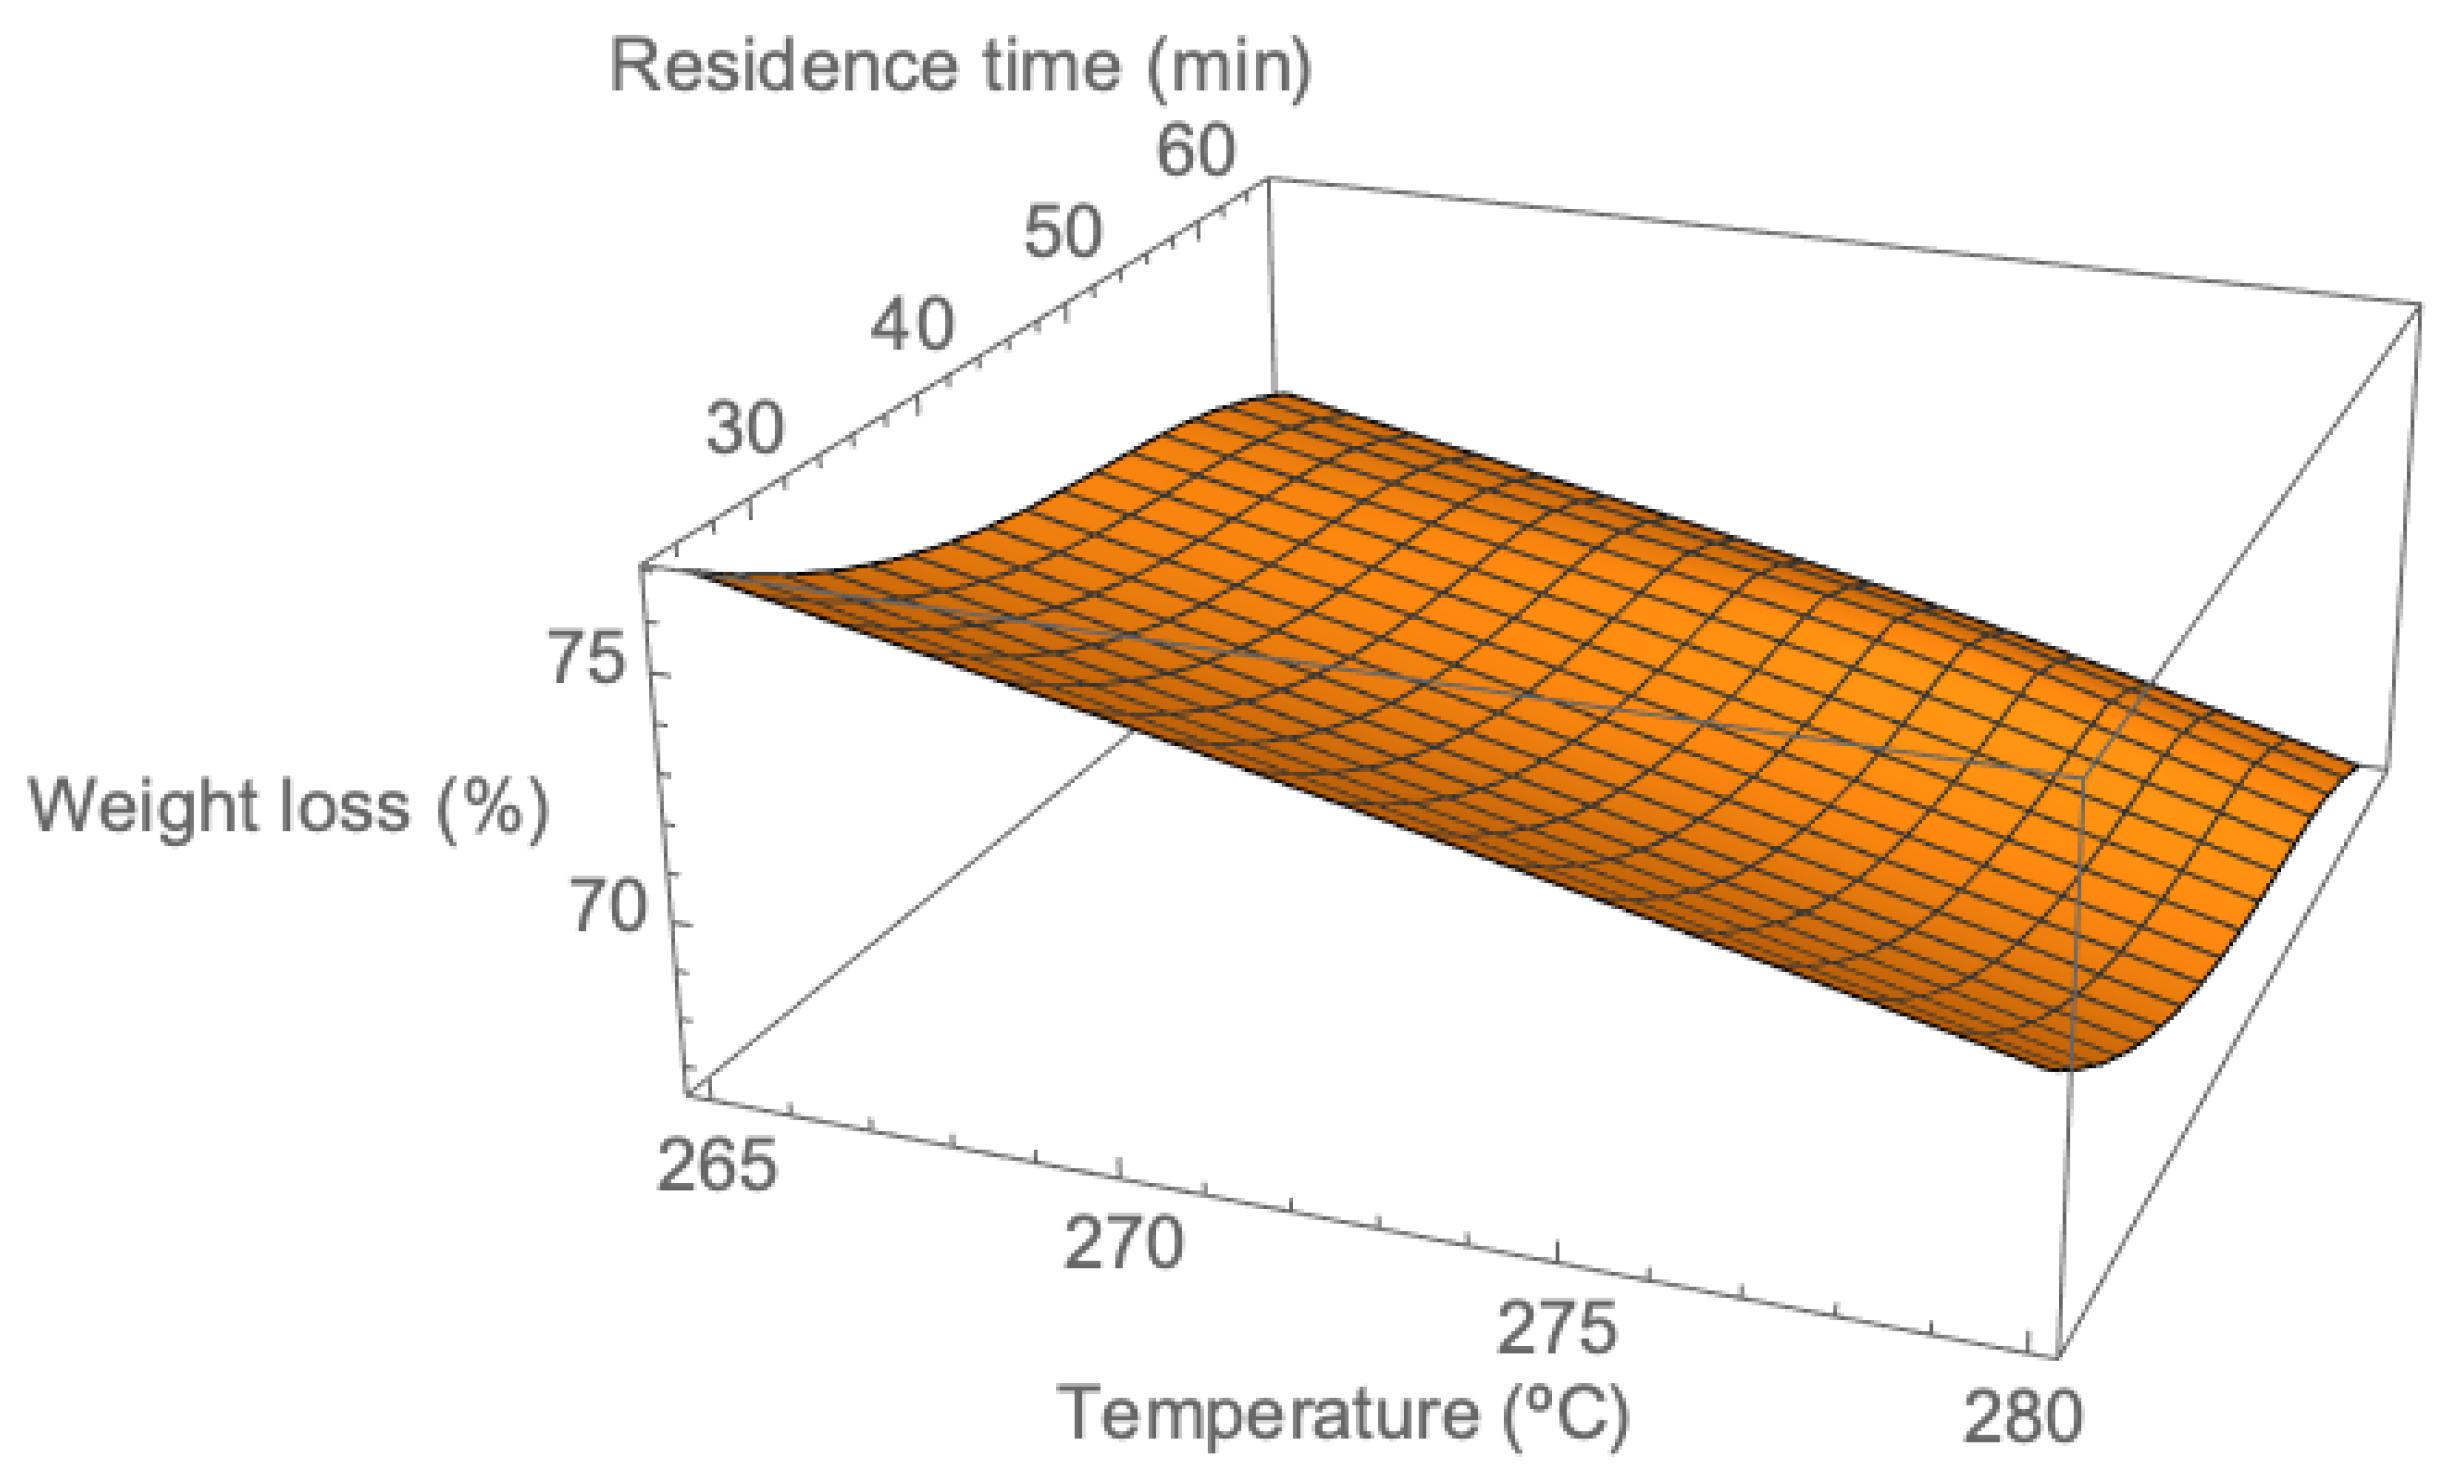
3.2. Higher Heating Value (HHV)

The heating value of the biomass is an important property, as it determines its use in energy applications [20]. The higher heating value (HHV) of the raw material was 4933 ± 80 kcal/g. Considering its origin, this value is coherent with those obtained by other researchers investigating the use of olive waste, such as the value obtained by Zamorano et al. for leaves of olive trees [39]. When the biomass is torrefied, the HHV clearly intensifies, so compared to the HHV of raw material, the HHV increased by approximately 4.8 to 5.9 kcal/g under the different conditions tested. The average HHV for each condition tested is shown in Table 2.
It is observed that HHV varied from 4884.14 ± 36.45 to 5893 ± 68.83 kcal/g, representing an increase of 19.47% for 275 °C and 120 min. These results are similar to those obtained by Benavente and Fullana [4], who torrefied olive mill wastes at 300 °C and obtained a 13.4% rise in HHV. Chen et al. collected data on the increase of HHV after torrefaction in a review of the use of different raw materials and found that the rise in HHV reached almost 63% with a mixture of spruce, pine, and fir [19]. The increase in the HHV with increasing temperature was mainly due to a reduction of the low-energy bonds and an increase of high-energy bonds [12].
Considering the ANOVA test, we can see the conditions under which the HHV was similar. At the initial time (0 min), the HHV was similar to that obtained with the raw material at all temperatures tested, slightly higher at 200 and 250 °C, and slightly lower at 275 and 300 °C. Considering this fact, operation at 275 or 300 °C and 0 min cannot be recommended. Similarly, at 200 °C, comparing the results obtained at residence times of 0 and 30 min, it was observed that the results did not present statistically significant differences, so performing the torrefaction at 0 min is recommended. Slightly higher results were detected at 250 °C and 30 min and at 200 °C and 2 h. In this case, a specific analysis considering other advantages and disadvantages must be done to choose the optimal conditions.
The highest HHV was detected at 275 °C and residence time of 120 min. From this temperature, the HHV decreased with this parameter. At 275 °C, the highest HHV was obtained at a residence time of 120 min (5893.45 ± 68.83 kcal/g). However, the ANOVA test showed that there were no statistically significant differences from the result achieved with a residence time of 30 min and temperature of 275 °C (5830.70 ± 44.31 kcal/g), so the optimal operating condition for the torrefaction of this biomass would be 30 min. At a temperature of 300 °C, the HHVs were 5679.08 ± 66.34 and 5725.33 ± 21.23 kcal/g at residence times of 30 and 120 min, respectively, presenting no statistically significant differences from the optimal condition. However, the weight loss at 300 °C is higher, as mentioned in the previous section, and due to this higher weight loss along with the lower HHV, this temperature is not recommended.
At a temperature of 200 °C, from 30 to 120 min, the HHV increased by 9.38%. However, the effect of the residence time on the HHV of torrefied biomass at high temperatures (275 and 300 °C) was significantly lower. As the ANOVA test showed, no statistically significant differences were detected between 30 and 120 min, which is coherent with the results of Arias et al. [19], who observed that the heating value yield of woody biomass remained practically constant from 30 min to 2 h of torrefaction.

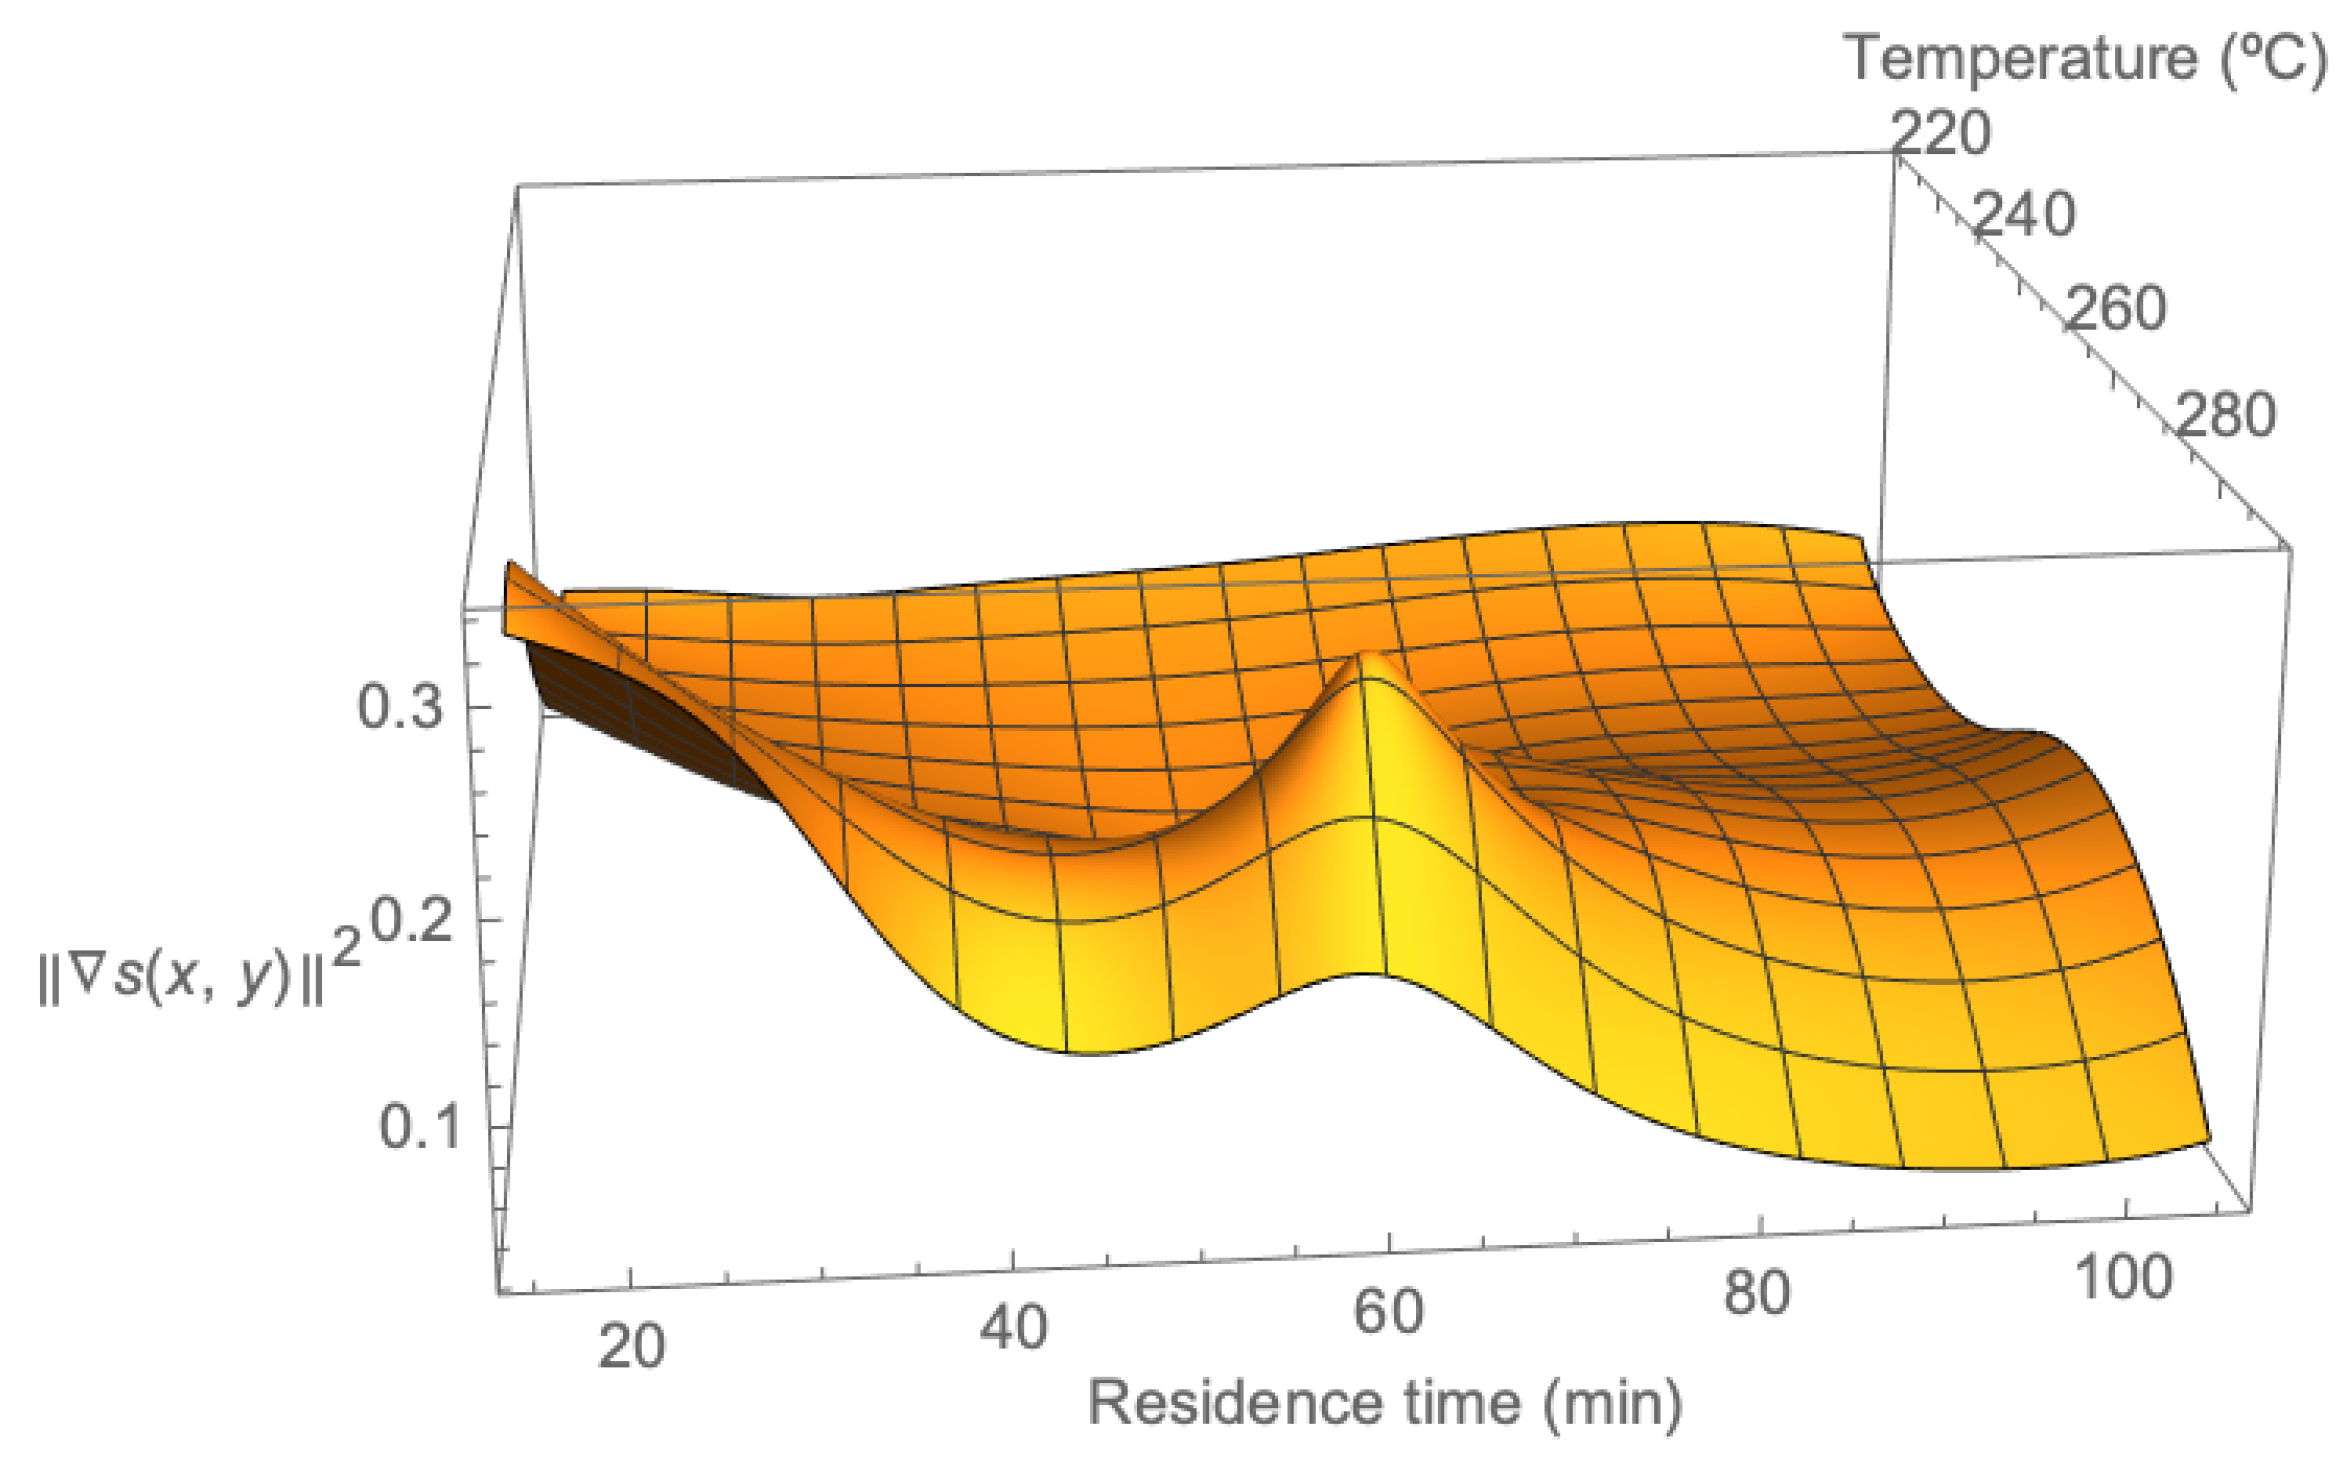
3.3. Numerical Model

Several studies about the effect of the operational conditions in the torrefaction process have been carried out, e.g., on solid olive waste products to study changes in properties [15] and on almond shells using a response surface methodology to examine effects of torrefaction temperature and time on mass and energy yields of solid product [40]. This research presents as a novelty the development of a numerical model to predict the optimal conditions of temperature and residence time for the torrefaction of olive tree waste. The independent variables, x, y, of the numerical model were temperature and residence time, respectively. The dependent variables were the HHV and the mass yield loss. For these values, and according to the methodology explained in Section 2.6, the explicit expression of the approximant from 12 data points for the HHV, by using as basis function the multiquadric function, was obtained. Its graph is shown in Figure 2, where the axes on the plane represent temperature and residence time, and the vertical axis represents the approximated HHV. The graph for the mass yield approximant built from 16 points with translations of multiquadric functions is shown in Figure 3.
Once these functions were obtained, they were used to infer some facts of interest. To deduce them, the approximate values of residence time and temperature for which the maximum HHV is achieved, and the approximate values for which the strongest decrease of mass yield is reached (maximum weight loss), were computed.
With respect to the first goal, numerical techniques were used to determine that the maximum HHV on the interior domain of our variables was reached at 275.45 °C and 31.23 min. With respect to the second aim, and considering s(x, y) the mass yield approximant, it is known that the value (x, y) for which the strongest decrease of the function s(x, y) occurs is that one for which –‖∇s(x, y)‖ is minimized, where ∇s(x, y) is the gradient vector of s(x, y). This coincides with the point for which ‖∇s(x, y)‖ is maximized or, equivalently, to remove square roots, where s ( x , y ) 2   is maximized. The graph of ‖∇s(x, y)‖2 is shown in Figure 4, in which the horizontal axes represent the residence time and the temperature. By using numerical techniques again, the strongest decrease on the interior domain of our variables was achieved at 278.27 °C and 60.56 min (which corresponds to the values of temperature and residence time for which s ( x , y ) 2 , represented on the vertical axis of Figure 4, reaches its maximum).
.
Our objective was to determine the values of residence time and temperature for which maximum HHV and small weight loss are achieved in order to maintain the maximum mass with the highest heating value. Taking into account the values cited in the two previous paragraphs, it was determined that fixing the smallest temperature, that is, 275.45 °C, the weight loss between 31.23 and 60.56 min is less than three percent (this can be easily seen in Figure 5, in which the graph for the weight loss approximant is focused on a range of residence time between 25 and 65 min and a range of temperature between 265 °C and 280 °C). As a result of this, the conclusion is that an optimal choice for our proposals would be approximately 275 °C and 30 min. These conditions are similar to those obtained by Chin et al. [6] for oil palm biomass and fast-growing species available in Malaysia, Acacia spp. (260 °C for 30 min) and Macaranga spp. (280 °C for 45 min), in a study about the optimization of torrefaction conditions.

4. Conclusions

From the results obtained for the torrefaction of olive tree waste at four different temperatures (200, 250, 275, and 300 °C) and four different residence times (0, 30, 60, and 120 min), the following conclusions were drawn:
(1)
The mass yield of the tested biomass varied between 97.48% and 57.61%, decreasing with the residence time and temperature. However, the ash content of the torrefied biomass increased with respect to the raw material up to a maximum of 73.32%, so the problem inherent in biomass combustion of ash could be increased.
(2)
The HHV of the torrefied biomass varied from 4884.14 ± 36.45 to 5893 ± 68.83 kcal/g. In the best case (275 °C and 120 min), a 19.47% increase in the HHV was achieved. The results of the mathematical model showed that the optimal conditions for torrefaction of olive tree waste are approximately 275 °C and 30 min.
For all these reasons, the use of torrefaction for this olive tree biomass could be a reliable pretreatment when operating under the optimal conditions.

Author Contributions

Conceptualization, J.M.-P.; laboratory methodology, J.M.-P.; validation J.J. and M.L.R.; formal analysis M.Z., J.M.-P., M.L.R. and J.J.; writing—original draft preparation, J.M.-P.; writing—review and editing, M.Z.; supervision, M.Z. All authors have read and agreed to the published version of the manuscript.

Funding

This research received no external funding.

Acknowledgments

The authors appreciate the support of the research groups TEP-968 (Technologies for Circular Economy) and FQM191 of the University of Granada, and EIFQM8 and FQM178 of the University of Jaén.

Conflicts of Interest

The authors declare no conflict of interest.

References

  1. Volpe, M.; Wüst, D.; Merzari, F.; Lucian, M.; Andreottola, G.; Kruse, A.; Fiori, L. One stage olive mill waste streams valorisation via hydrothermal carbonization. Waste Manag. 2018, 80, 224–234. [Google Scholar] [CrossRef] [PubMed]
  2. Lenis, Y.A.; Agudelo, A.; Pérez, J.F. Analysis of statistical repeatability of a fixed bed downdraft biomass gasification facility. Appl. Therm. Eng. 2013, 51, 1006–1016. [Google Scholar] [CrossRef]
  3. Ramos-Carmona, S.; Martínez, J.D.; Pérez, J.F. Torrefaction of patula pine under air conditions: A chemical and structural characterization. Ind. Crops Prod. 2018, 118, 302–310. [Google Scholar] [CrossRef]
  4. Benavente, V.; Fullana, A. Torrefaction of olive mill waste. Biomass Bioenergy 2015, 73, 186–194. [Google Scholar] [CrossRef] [Green Version]
  5. Ibrahim, R.H.H.; Darvell, L.I.; Jones, J.M.; Williams, A. Physicochemical characterization of torrefied biomass. J. Anal. Appl. Pyrolysis 2013, 103, 21–30. [Google Scholar] [CrossRef]
  6. Chin, K.L.; H’ng, P.S.; Go, W.Z.; Lim, T.W.; Maminski, M.; Paridah, M.T. Optimization of torrefaction conditions for high energy density solid biofuel from oil palm biomass and fast growing species available in Malaysia. Ind. Crops Prod. 2013, 49, 768–774. [Google Scholar] [CrossRef]
  7. Berndes, G.; Hoogwijk, M.; van den Broek, R. The contribution of biomass in the future global energy supply: A review of 17 studies. Biomass Bioenergy 2003, 25, 1–28. [Google Scholar] [CrossRef]
  8. Zheng, A.; Zhao, Z.; Chang, S.; Huang, Z.; He, F.; Li, H. Effect of torrefaction temperature on product distribution from two-staged pyrolysis of biomass. Energy Fuels 2012, 26, 2968–2974. [Google Scholar] [CrossRef]
  9. Da Silva, C.M.S.; Vital, B.R.; Carneiro, A.D.C.O.; Costa, E.V.; De Magalhães, M.A.; Trugilho, P.F. Structural and compositional changes in eucalyptus wood chips subjected to dry torrefaction. Ind. Crops Prod. 2017, 109, 598–602. [Google Scholar] [CrossRef]
  10. Matos, M.; Barreiro, M.F.; Gandini, A. Olive stone as a renewable source of biopolyols. Ind. Crops Prod. 2010, 32, 7–12. [Google Scholar] [CrossRef]
  11. Nunes, L.J.R.; Loureiro, L.M.E.F.; Sá, L.C.R.; Silva, H.F. Thermochemical Conversion of Olive Oil Industry Waste: Circular Economy through Energy Recovery. Recycling 2020, 5, 12. [Google Scholar] [CrossRef]
  12. Garcia-Maraver, A.; Zamorano, M.; Ramos-Ridao, A.; Díaz, L.F. Analysis of olive grove residual biomass potential for electric and thermal energy generation in Andalusia (Spain). Renew. Sustain. Energy Rev. 2012, 16, 745–751. [Google Scholar] [CrossRef]
  13. Mei, Y.; Che, Q.; Yang, Q.; Draper, C.; Yang, H.; Zhang, S.; Chen, H. Torrefaction of different parts from a corn stalk and its effect on the characterization of products. Ind. Crops Prod. 2016, 92, 26–33. [Google Scholar] [CrossRef]
  14. Li, M.F.; Li, X.; Bian, J.; Xu, J.K.; Yang, S.; Sun, R.C. Influence of temperature on bamboo torrefaction under carbon dioxide atmosphere. Ind. Crops Prod. 2015, 76, 149–157. [Google Scholar] [CrossRef]
  15. Martín-Lara, M.; Ronda, A.; Zamora, M.C.; Calero, M. Torrefaction of olive tree pruning: Effect of operating conditions on solid product properties. Fuel 2017, 202, 109–117. [Google Scholar] [CrossRef]
  16. Prins, M.J.; Ptasinki, K.J.; Jansen, F.J.J.G. Torrefaction of wood Part 2. Analysis of products. J. Anal. Appl. Pyrolysis 2006, 77, 35–40. [Google Scholar] [CrossRef]
  17. Chen, W.-H.; Peng, J.; Bi, X.T. A state-of-the-art review of biomass torrefaction, densification and applications. Renew. Sustain. Energy Rev. 2015, 44, 847–866. [Google Scholar] [CrossRef]
  18. Yan, W.; Acharjee, T.C.; Coronella, C.J.; Vasquez, V.R. Vásquez, Thermal pretreatment of lignocellulosic biomass. Environ. Prog. Sustain. Energy 2009, 28, 435–440. [Google Scholar] [CrossRef]
  19. Arias, B.; Pevida, C.; Fermoso, J.; Plaza, M.; Rubiera, F.; Pis, J.J. Influence of torrefaction on the grindability and reactivity of woody biomass. Fuel Process. Technol. 2008, 89, 169–175. [Google Scholar] [CrossRef] [Green Version]
  20. Chen, W.-H.; Kuo, P.-C. Torrefaction and co-torrefaction characterization of hemicellulose, cellulose and lignin as well as torrefaction of some basic constituents in biomass. Energy 2011, 36, 803–811. [Google Scholar] [CrossRef]
  21. Park, S.-W.; Jang, C.-H.; Baek, K.-R.; Yang, J.-K. Torrefaction and low-temperature carbonization of woody biomass: Evaluation of fuel characteristics of the products. Energy 2012, 45, 676–685. [Google Scholar] [CrossRef]
  22. Van Der Stelt, M.J.C.; Gerhauser, H.; Kiel, J.H.A.; Ptasinski, K.J. Biomass upgrading by torrefaction for the production of biofuels: A review. Biomass Bioenergy 2011, 35, 3748–3762. [Google Scholar] [CrossRef]
  23. Chen, W.-H.; Lu, K.-M.; Liu, S.-H.; Tsai, C.-M.; Lee, W.-J.; Lin, T.-C. Biomass torrefaction characteristics in inert and oxidative atmospheres at various superficial velocities. Bioresour. Technol. 2013, 146, 152–160. [Google Scholar] [CrossRef]
  24. Bach, Q.-V.; Skreiberg, Ø. Upgrading biomass fuels via wet torrefaction: A review and comparison with dry torrefaction. Renew. Sustain. Energy Rev. 2016, 54, 665–677. [Google Scholar] [CrossRef]
  25. Bach, Q.-V.; Tran, K.-Q.; Skreiberg, Ø.; Trinh, T.T. Effects of wet torrefaction on pyrolysis of woody biomass fuels. Energy 2015, 88, 443–456. [Google Scholar] [CrossRef]
  26. Wannapeera, J.; Worasuwannarak, N. Upgrading of woody biomass by torrefaction under pressure. J. Anal. Appl. Pyrolysis 2012, 96, 173–180. [Google Scholar] [CrossRef]
  27. Simonec, M.; Goricanec, D.; Urbancl, D. Impact of torrefaction on biomass properties depending on temperature and operation time. Sci. Total Environ. 2020, 740, 140086. [Google Scholar] [CrossRef]
  28. Harun, N.H.H.M.; Samad, N.A.F.A.; Saleh, S. Development of kinetics model for torrefaction of empty fruit bunch from palm oil waste. Energy Procedia 2017, 105, 744–749. [Google Scholar] [CrossRef] [Green Version]
  29. Nakason, K.; Pathomrotsakun, J.; Kraithong, W.; Khemthong, P.; Panyapinyopol, B. Torrefaction of Agricultural Wastes: Influence of Lignocellulosic Types and Treatment Temperature on Fuel Properties of Biochar. Int. Energy. J. 2019, 19, 253–266. [Google Scholar]
  30. Burden, A.; Burden, R.; Faires, J. Numerical Analysis, 10th ed.; Cengage: New York, NY, USA, 2016. [Google Scholar]
  31. Buhmann, M.D. Radial Basis functions; Cambridge University Press: Cambridge, UK, 2003. [Google Scholar] [CrossRef]
  32. Fasshauer, G.E. Meshfree Approximation Methods with Matlab; World Scientific Publishing: Singapore, 2007. [Google Scholar] [CrossRef]
  33. Phanaphanich, M.; Mani, S. Impact of torrefaction on the grindability and fuel characteristics of forest biomass. Bioresour. Technol. 2011, 102, 1246–1253. [Google Scholar] [CrossRef]
  34. Nimlos, M.R.; Brooking, E.; Michael, J. Biomass torrefaction studies with a molecular beam mass spectrometer. Am. Chem. Soc. Div. Fuel Chem. 2003, 48, 590–591. [Google Scholar]
  35. García-Maraver, A.; Terron, L.C.; Ramos-Ridao, A.; Zamorano, M. Effects of mineral contamination on the ash content of olive tree residual biomass. Biosyst. Eng. 2014, 118, 167–173. [Google Scholar] [CrossRef]
  36. Bridgeman, T.G.; Jones, J.M.; Williams, A.; Waldron, D.J. An investigation of the grindability of two torrefied energy crops. Fuel 2010, 89, 3911–3918. [Google Scholar] [CrossRef] [Green Version]
  37. Pinchuai, A.; Dutta, A.; Basu, P. Torrefaction of Agriculture Residue to Enhance Combustible Properties. Energy Fuels 2010, 24, 4638–4645. [Google Scholar] [CrossRef]
  38. García-Maraver, A.; Mata-Sánchez, J.; Carpio, M.; Pérez-Jiménez, J.A. Critical review of predictive coefficients for biomass ash deposition tendency. J. Energy Inst. 2017, 90, 214–228. [Google Scholar] [CrossRef]
  39. Zamorano, M.; Popov, V.; Rodríguez, M.L.; García-Maraver, A. A comparative study of quality properties of pelletized agricultural and forestry lopping residues. Renew. Energy 2011, 36, 3133–3140. [Google Scholar] [CrossRef]
  40. Chiou, B.-S.; Valenzuela-Medina, D.; Bilbao-Sainz, C.; Klamczynski, A.P.; Avena-Bustillos, R.J.; Milczarek, R.R.; Du, W.-X.; Glenn, G.M.; Orts, W.J. Torrefaction of almond shells: Effects of torrefaction conditions on properties of solid and condensate products. Ind. Crops Prod. 2016, 86, 40–48. [Google Scholar] [CrossRef]
Figure 1. Torrefaction process: (a) Raw material, (b) thermogravimetric analyzer used for torrefaction process, and (c) torrefied sample.
Sustainability 12 06411 g001
Figure 2. Graph for the higher heating value (HHV) approximant.
Sustainability 12 06411 g002
Figure 3. Graph for the mass yield approximant.
Sustainability 12 06411 g003
Figure 4. Graph of s ( x , y ) 2 .
Sustainability 12 06411 g004
Figure 5. Graph for the weight loss approximant.
Sustainability 12 06411 g005
Table 1. Mass yield at the end of torrefaction versus the temperature and residence time tested. The superscripts (A–H) show the homogeneous subsets indicated by the ANOVA test. If two conditions have the same superscript, this means that no statistically significant differences were detected.
Temperature (°C)Residence Time (min)
030120
20097.48 ± 0.69 A92.20 ± 0.65B89.48 ± 0.22C
25090.53 ± 0.54 B,C79.87 ± 0.44E75.71 ± 0.82F
27584.57 ± 1.14 D72.01 ± 0.55G66.49 ± 1.35G
30078.89 ± 0.84 E62.38 ± 1.86H57.61 ± 0.80H
Table 2. Higher heating value of torrefaction versus the temperature and residence time tested. The superscripts (A–F) show the homogeneous subsets indicated by the ANOVA test. If two conditions have the same superscript, this means that no statistically significant differences were detected.
Temperature (°C)Residence Time (min)
030120
2005028.19 ± 102.76 B5053.42 ± 33.27B5527.34 ± 68.97C,D
2505129.31 ± 59.75 B5409.52 ± 26.03C5679.21 ± 69.72D,E
2754884.14 ± 36.45 A5830.70 ± 44.31E,F5893.45 ± 68.83F
3004895.61 ± 57.65 A,B5679.08 ± 66.34D,E5725.33 ± 21.23D,E,F

