Article

Variability of Water Balance under Climate Change Scenarios. Implications for Sustainability in the Rhône River Basin

1
Departament of Geoscience, Université de Fribourg, Chemin du Musée 4, 1700 Fribourg, Switzerland
2
Departamento de Geografía, Facultad de Letras, Campus Universitario de La Merced, Universidad de Murcia, 30001 Murcia, Spain
3
Departamento de Sociología, Facultad de Economía y Empresa, Campus Universitario de Espinardo, Universidad de Murcia, 30100 Murcia, Spain
4
Departamento de Didáctica de las Ciencias Experimentales, Facultad de Educación, Campus Universitario de Espinardo, Universidad de Murcia, 30100 Murcia, Spain
*
Author to whom correspondence should be addressed.
Sustainability 2020, 12(16), 6402; https://doi.org/10.3390/su12166402
Submission received: 24 May 2020 / Revised: 5 August 2020 / Accepted: 6 August 2020 / Published: 9 August 2020
(This article belongs to the Special Issue Socio-Ecological Systems Sustainability)

Abstract

:
The Rhône basin is considered a complex river socio-ecological system, which houses numerous socioeconomic activities closely linked to its river courses, as well as competition between the different users of these water resources. Likewise, its increasing vulnerability to climate change highlights the need to assess the potential effects of a set of climate scenarios to assist the management of these resources. With this aim, we have analysed the effects of five scenarios on different environmental zones of the basin characterised by altitudinal features, using the “Water Yield” hydrological module of the InVEST model. The model outputs show that the Rhône basin will have significant discharge water variations and changes in the seasonality of the hydrological regime, being able to trigger serious economic and environmental effects under the simulated scenarios. Regarding these altitudinal environmental zones, results show important differences in the final water balance, resulting in the mountain and subalpine zones being the most affected by these scenarios. The uncertainty in the availability of water resources and the need for its sustainable management will require the establishment of important adaptations to the new challenges imposed by these scenarios, particularly in alpine zones, due to its sensitivity and fragility to climate change.

Graphical Abstract

1. Introduction

The effects of climate change are increasingly visible in river socio-ecological systems around the world [1]. The short- and mid-term predictions foresee significant variations in the downward volume and seasonality of hydrological regimes. This dynamic will mean the worsening of a set of problems, especially in the socioeconomic and environmental systems [2,3]. Thus, the expected impacts become especially serious in the basins which house intense demographic pressures and important economic development, such as the case of the Rhône river basin [4,5].
The Rhône is one of the main French rivers, rising in Switzerland and running towards southeastern France, whose spatial and management differences make it a complex socio-ecological system [6]. Moreover, this river basin houses numerous socioeconomic activities with functioning closely linked to its river courses, which has triggered a competition between the different users of these water resources to ensure their needs [7]. As it is a complex conflict of uses, a strategy of continued use has been developed for decades by the different competent administrations, as explained in detail below. Nevertheless, growing environmental concerns are changing the positions of the actors involved [8]. Among others, the changes observed in its hydrological regime are forcing the management areas of the river basin to be modified; this means policies which may alter the preference of the different uses of water, especially in the plans for floods, environmental protection and energy programs [8,9,10].
In this regard, energy policies are evolving towards sustainability to favour the production of renewable sources, in particular, the production of hydroelectric energy [11]. This change is reflected in the reinforcement of the environmental ordinances, favoured by the regulations of the European Union (Water Framework Directive [12]), and the development of water legislation in France and Switzerland. According to [13], climate change impacts on hydropower production in the Alpine region, since hydropower plants may be directly influenced by the change in the water discharge regime. Therefore, it will be needed to take these changes into account in order to adopt different management strategies, “depending also from the evolution of the energy market” [13] (p. 966).
On the other hand, this river basin includes several climatic zones, mostly characterised by oceanic influence with moderate precipitation in all seasons. According to [5], total precipitation is around 600 mm/year in the southern valley, but rainfall can be intense in autumn in the Cévennes Range, in the southeast of the catchment (>600 mm in days), whereas northern areas and mountains receive the highest precipitation. The Rhône receives waters from the Alps, on its left bank, and those of the French Massif Central and the Vosges, through the Saône, on the right. These mountain regions, among others, are named as natural “water towers”, which provide the necessary water resources to ensure enough flow to strengthen the agricultural, industrial and urban activity of its plains since the beginning of their occupation [14,15]. Nevertheless, these headwater areas have a greater vulnerability to the effects of climate change than the lower areas. Therefore, it seems interesting to analyse the new climatic configurations under global change scenarios to contribute to the better adaptation of the potential management options in each area, which is considered as one of the key challenges for the management of transboundary rivers, such as the Rhône [16].
The European Alps is one of the regions of the planet where effects of climate change are really noticeable today. According to the series of records, the rise in temperatures has already led to an increase of up to 2 °C since the beginning of the last century [17]. For this author, the predictions of the regional climate models suggest that thermal values higher than the current ones could be reached in Switzerland by the year 2100, with ranges of 3–5 °C in winter and 6–7 °C in summer, associated with an increase in winter precipitation and a drastic decrease during the summer period. According to the current land use distribution, direct and indirect impacts will affect key economic sectors such as tourism, hydroelectric power, agriculture and the big insurance companies, which will have to face the expenses caused by increasingly frequent natural disasters [15,18].
With regard to the variability of water resources, the trends shown by climate change simulations [19] are predicting more extreme events (droughts and floods), a greater reduction in the area occupied by glaciers and the alteration of melting conditions, which are significantly modifying the different hydrological regimes in the Rhône basin [20,21]. The probable changes regarding water quality caused by an increase in temperature will have significant consequences for aquatic and riparian ecosystems, as well as for the infrastructure dependent on the hydroelectric and cooling production systems of the existing nuclear power plants in the French part of the basin [7,22,23]. In another order of magnitude, the reduction in the flow of the Rhône might have a significant impact on the salinity of the Mediterranean Sea, as shown by the reduction in the volume of water in other areas [24,25].
Therefore, addressing the potential fluctuations of water resources in mountainous regions seems essential, especially in areas where changes in water regimes will be accompanied by frequent geomorphological hazards [26,27] related to the increasing of intense precipitation events, as well as the melting of permafrost [28,29]. In this sense, projects such as ACQWA (Assessing Climate impacts on the Quantity of Water), of the Seventh Framework Program of the European Union, have analysed the impacts of global warming on the quantity and quality of water, and they provide tools which help to solve issues related to current water management and potential changes in its future demands. The application of solid sustainable policies, which could face the new scenarios of water scarcity and use in the coming decades, acquires special relevance, since it will allow us to solve more effectively the potential conflicts between economic sectors that may be confronted by water resources [20].
In this regard, the modelling and projections of the effects of climate change on the quantification and availability of water are increasingly necessary for the improvement and reinforcement of water management planning. Despite the benefits of these tools, it should be noticed that their predictions are not yet exempt from a degree of uncertainty associated with the dispersion of the climate models used, the internal climate variability itself, and the difficulties in transferring the results of the climate model to the spatial and temporal scales required by hydrological models [30,31]. Thus, it has been suggested that the knowledge and the reduction of these uncertainties are essential to be able to perform projections in the runoff estimation [32].
Thence, the main objective of this work focuses on analysing the effects of climate change on the water availability in the Rhône river basin, and on establishing the possible causes of the variation of the basin’s water balance, according to factors related to altitudinal environmental zones, as explained in detail below, as well as discussing their potential socioeconomic and ecological consequences.

2. Materials and Methods
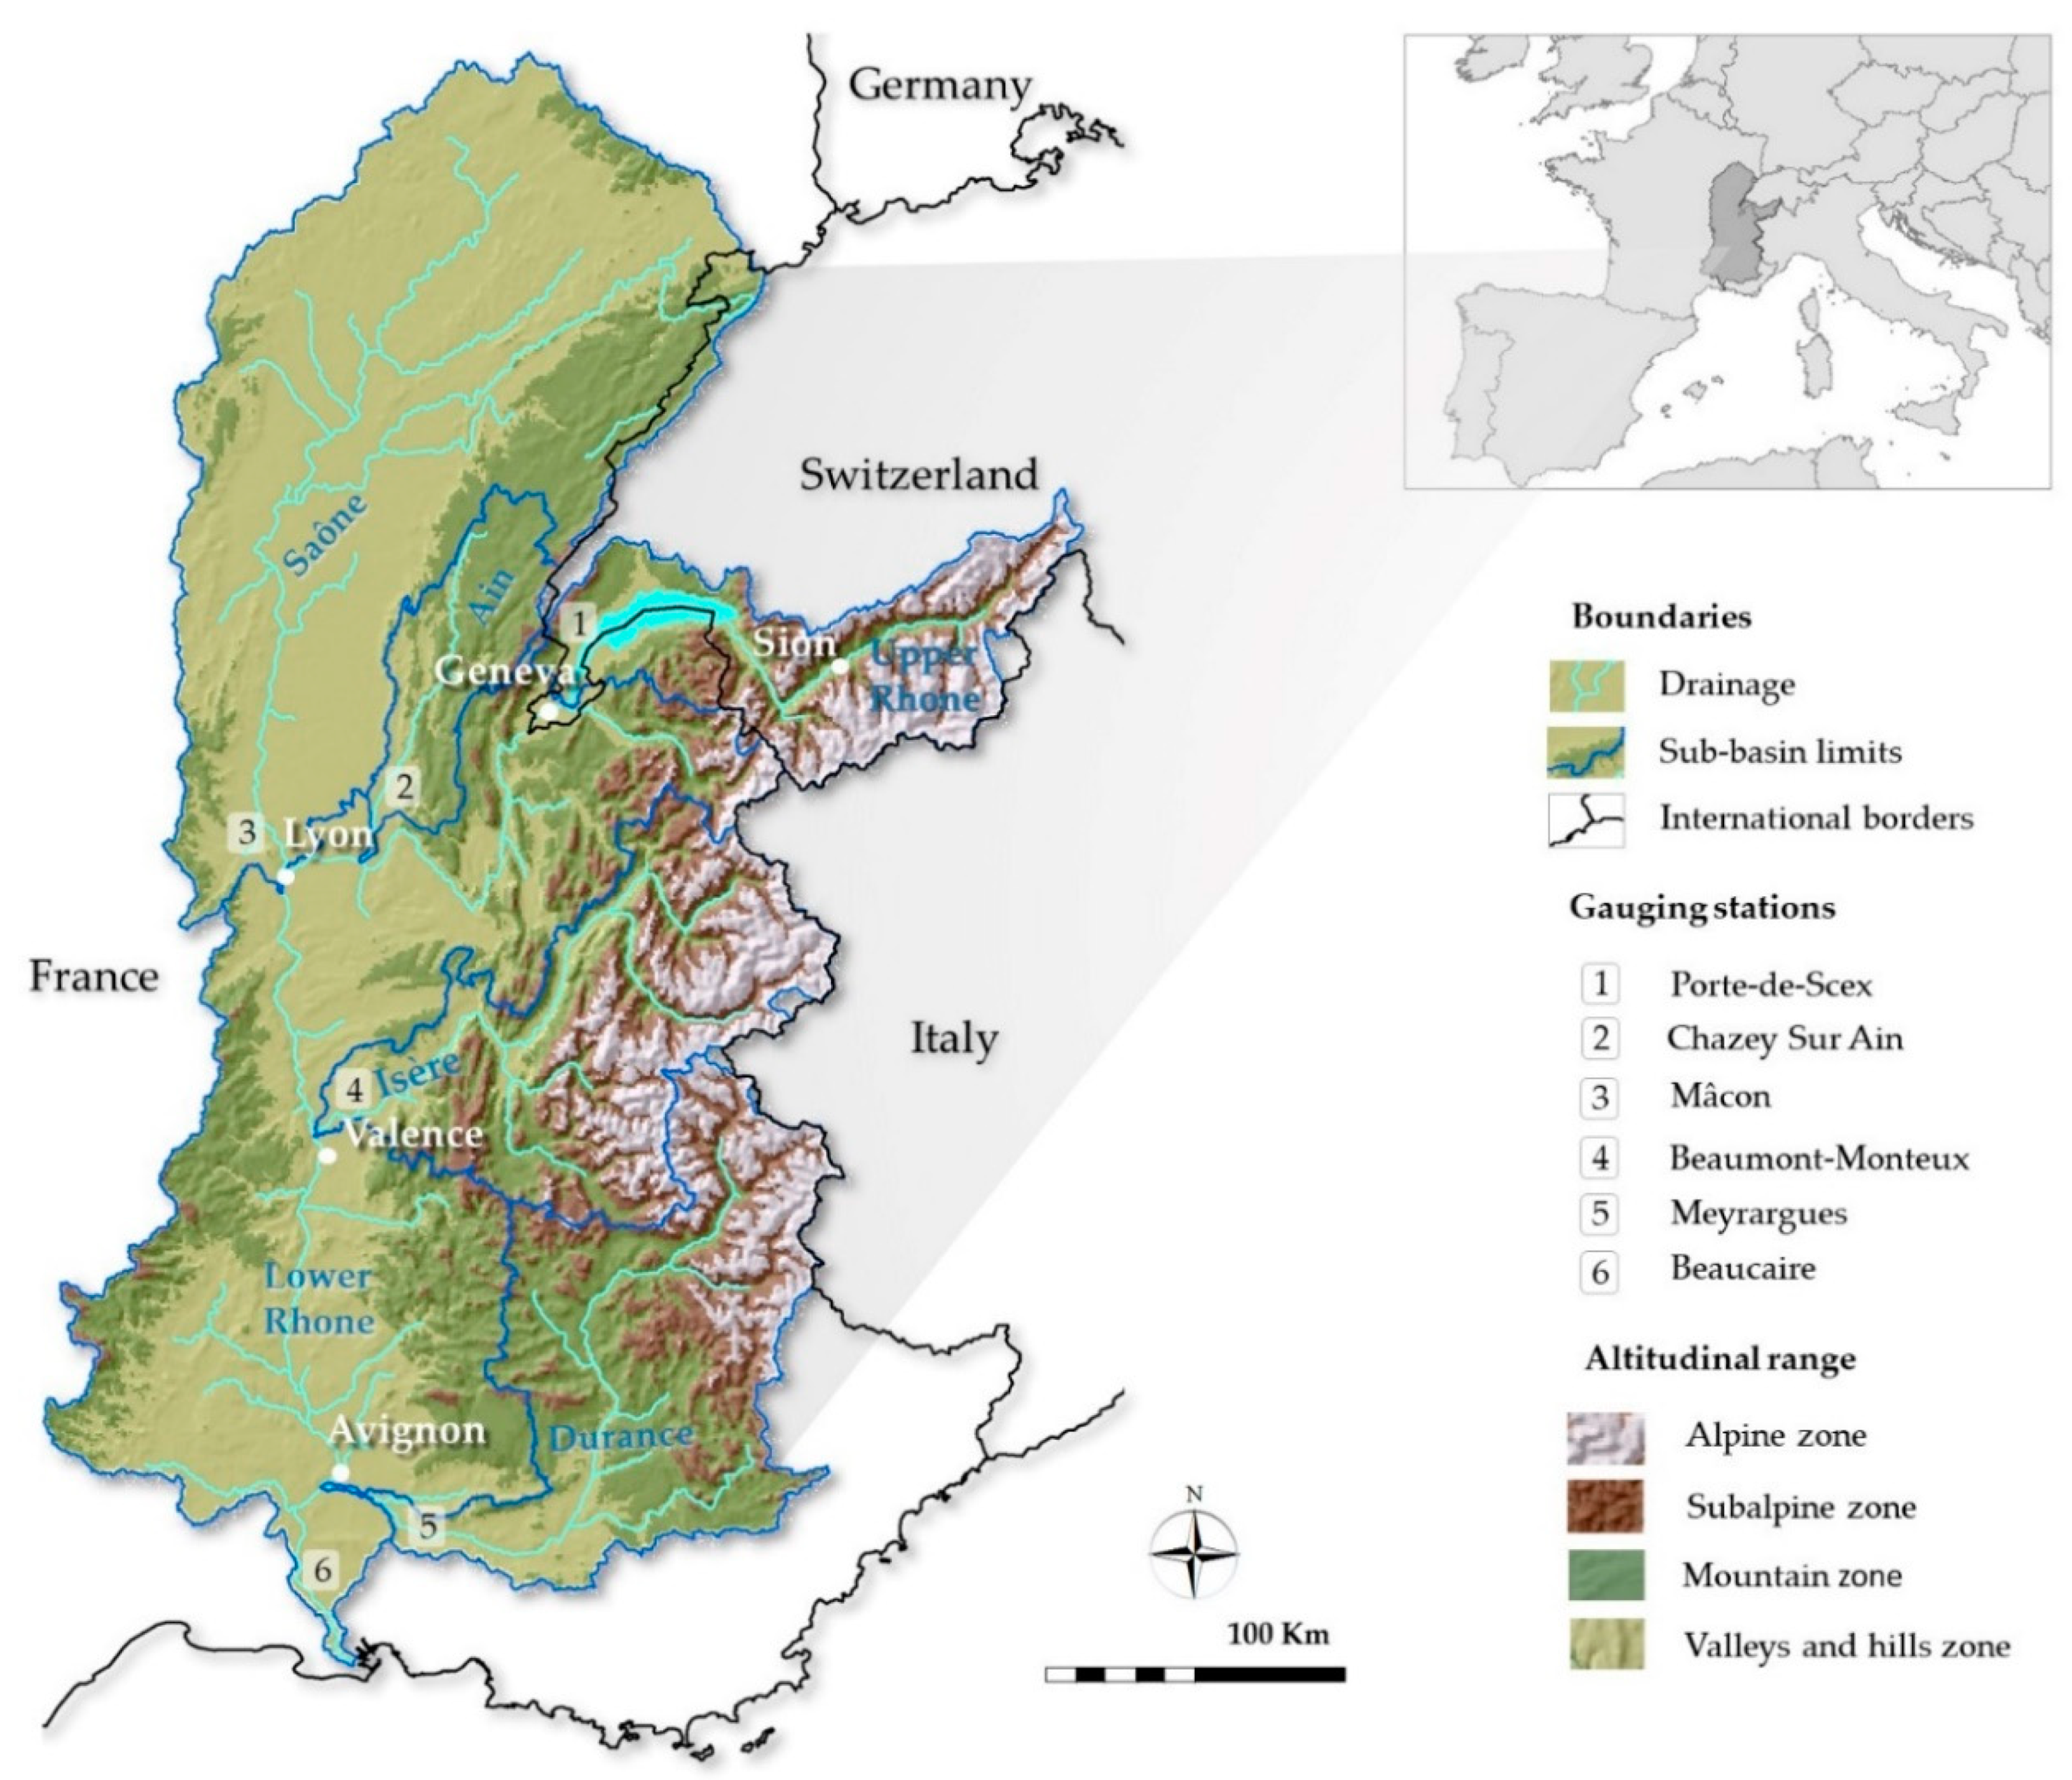
2.1. Study Area

In this work, the selection of the study area attends to three main reasons. The first is related to the spatial size of its river system. The Rhône is one of the largest European rivers (with an average annual flow of 1700 m3/s and a length of 810 km) and the most important in the Mediterranean basin, reaching 20% of the river water supply in the Mediterranean [33]. The second is due to the different economic interests (such as commercial shipping and hydroelectric production) existing along its banks. Additionally, the third is related to its high ecological value of the area [34]. The combination of these reasons symbolises a representative case of study to reveal the socioeconomic and ecological impacts that the expected variability of the water resources may have in face of the effects of a potential climate change scenario.
The Rhône drainage area is located in the countries of Switzerland and France (97,900 km2, almost 88.5% out of them belongs to the latter), as shown in Figure 1. Its high flow is fed by several mountain ranges, being the Alpine range and the Jura massif the most important. The main riverbed is joined by important tributaries, such as the Saône and the Ain in the north, and the Isère, Ardèche and Durance in the south, which give it high peak flows, exceeding 11,000 m3/s in some cases [35].
According to [4], the Rhône river basin is characterised by the existence of different water patterns, which can be summarised in three well-differentiated areas. The first is located in the Upper Rhône, in the Swiss cantons of Valais and Vaud. It has a snow-glacial runoff regime that provides a greater discharge in summer than in winter. The role of glaciers as a source is very important in the hydrological regime of this part of the Rhône, occupying an area of approximately 10%, and it is estimated that they provide runoff of 10% in winter, and 30–40% in summer. Precipitation is highly variable due to the barrier effect of high peaks, with relatively dry inland valleys (<600 mm/year) and mountain areas with high precipitation (>2500 mm/year) [36]. The water resources provided by the river and its tributaries allow the development of diverse economic uses, such as agriculture, chemical industry and tourism; although, hydroelectric power generation is the most important socioeconomic sector, since 56% of the energy consumed in Switzerland comes from these hydroelectric plants, making it a strategic sector with 80% of capital in hands of the cantons and municipalities.
The second area concentrates its runoff in Lake Geneva. With an area of 582 km2, it serves as the natural border between France and Switzerland [4]. The management of the lake has a complex water regulation in which different institutional levels of these two countries are involved, as well as European legislation. This allows the management of different infrastructures which regulate the flow of the river.
The third area is defined by the French slope, in which the Rhône river flows at its mouth in the Mediterranean Sea. This part of the course provides most of the economic resources of the entire basin. In this area, the river, supported by its tributaries from the French Alps (Isère and Durance), supports a great variety of uses: support for nuclear energy production, irrigation for wide agricultural valleys, the river fishing sector, the production of drinking water, tourism, the maintenance of freshwater ecosystems, as well as hydroelectric power production [13].
The functions performed by the Rhône for the population who inhabit its banks have led to the location of many human settlements of large sociodemographic dimensions, such as the large cities of Lyon, Valence or Avignon. Nonetheless, as it happens in a large part of the Mediterranean river courses, the occupation process experienced throughout history shows scarce adaptations for sustainable flood management, which has generated noticeable problems due to the recurrent floods. The important floods produced between 2000 and 2003 led to the implementation of the “Plan Rhône”, a political instrument intended to manage the river in a coordinated way and avoid flood risks in the French part of the basin [6].
From the climatic point of view, the northern part of the basin is under the oceanic domain. This climatic condition is characterised by a rainfall regime of heavy rains during winter, which contrasts with the southern part under the Mediterranean influence, high temperatures in summer and heavy rains in autumn and spring. The eastern part, an alpine-influenced margin, provides a significant volume of solid precipitation in winter, making the river regime more complex, with significant flash floods occurring in late spring and early summer during thaw [37].
According to projections of climate change, in the coming decades, the northwest of the Mediterranean area of the basin could experience an increase in air temperature around 1 to 3 °C, and an uncertain evolution of precipitation, especially in winter, with a possible variation of ±10%, and a decrease of 5% in the summer precipitation records [37]. The influence of these alterations on the frequency of floods may complicate the management of current floods in the lower riverbed and, with it, the loss of millions of euros for these episodes [28].

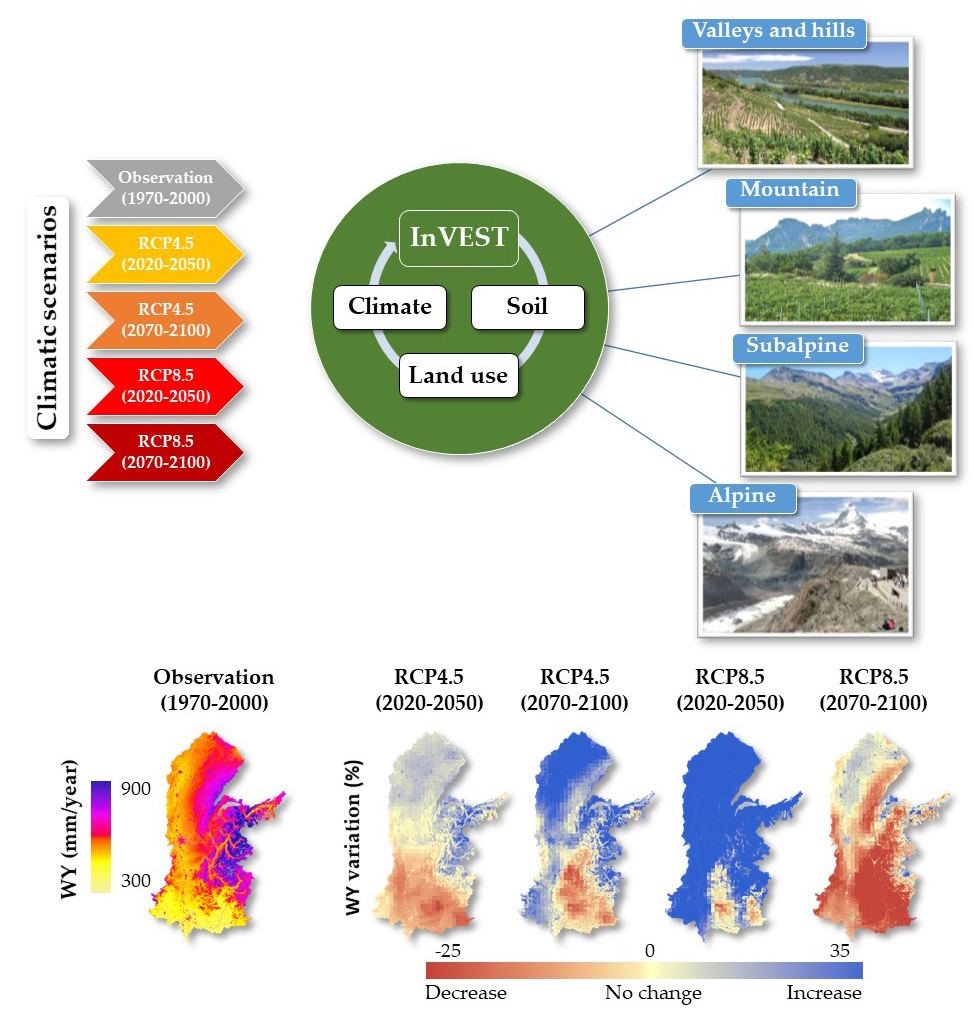
2.2. Methodological Approach

The methodological approach was based on the application of the “Water Yield” hydrological module of the InVEST model (Integrated Valuation of Ecosystem Services and Tradeoffs [38]), by means of the assessment of five climate scenarios. This tool has been widely used for the study of socio-ecological systems [39,40] and, specifically, of the management of water resources [41,42].
The first of the scenarios, referring to the historical period (observation), served as a reference in the comparison of two scenarios of Concentration of Greenhouse Gases (Representative Concentration Pathways, RCP) in two future periods. The results were compared in four altitudinal environmental conditions or zones to determine the spatial variability of the water balance in the basin.

2.2.1. Model Description

The calculations to obtain the availability of water generated by the Rhône basin were done using the “Water Yield” module of the InVEST model v.3.3.3 ecosystem services analysis program. In short, the model takes into account changes in land use patterns and their effect on surface water yield (WY).
The results were subjected to a spatial analysis using algebra of raster maps, based on the WY estimates by each sub-basin in the area of study. It determines the amount of water running off each pixel, whose calculation is based on precipitation and evapotranspiration; thus, all the water that is not evaporated is supposed to represent the available water. Therefore, the model does not differentiate between surface, subsurface and base flow, but assumes that all WY input included in a value of the pixel reaches the lowest altitude of the basin through one of these pathways. The water yield calculation process can be summarised as shown in Equations (1)–(5):
W Y ( x ) = ( 1 A E T ( x ) P ( X ) ) * P ( x )
where, a A E T ( x ) : annual actual evapotranspiration and P ( x ) : annual precipitation, based on the Budyko curve proposed by [43] and developed by [44] (Equation (2)):
A E T P = 1 + ω R 1 + ω R + 1 R
where R is the dimensionless Budyko dryness index [45] by land cover class. The index is defined as (Equation (3)):
R = K c E T 0 P
where ET0 is the value of reference evapotranspiration by pixel; kc is the plant evapotranspiration coefficient for land cover on the pixel; ω ratio is a non-physical parameter to characterise the natural climatic-soil properties, defined below (Equation (4)):
ω = Z   A W C P
AWC is the volumetric (expressed in mm) plant available water content. The soil texture and effective rooting depth define AWC, which establishes the amount of water that can be held and released in the soil for use by a plant. It is estimated as the product of the plant available water capacity (PAWC) and the minimum of root restricting layer depth (rrd) and vegetation rooting depth (vrd). Root restricting layer depth shows the soil depth at which root penetration is inhibited because of physical or chemical characteristics. PAWC is the plant available water capacity, indicating the difference between field capacity and wilting point:
A W C = M i n ( r r d , v r d ) P A W C
Finally, Z is an empirical constant (as a seasonality factor), which captures the local precipitation pattern and additional hydrogeological characteristics [46].

2.2.2. Model Input Data

Land Cover

The land uses were obtained from the database contained in the Climate Change Initiative of the European Space Agency [47]. This source is organised in a global cartography with 37 land cover classes, and a spatial resolution of 300 m per pixel.

Watershed Delimitation

The hydrological limits of the Rhône watershed were obtained from the digital elevation model of Shuttle Radar Topography Mission (SRTM DEM) [48] of 250 m pixel resolution, using the hydrological model arcHydro Tools from ArcGIS, for spatial identification of sub-basins. The results were contrasted with data from the HydroBASINS program [49].

Soil Data

To determine the depth value of the roots, the information from the SoilGrids database of the International Soil Information and Reference Centre [50] was used. All input soil layers provide 200 m per pixel spatial resolution. These data allowed the estimation of the absolute depth of the rock base (in mm) in raster format, as well as plant available water content fraction (PAWC). Within the SoilGrids data catalogue, the available water content (AWC) at different depths is presented, which was used to estimate the PAWC along the total depth of the soil profile.

Climate Data

Climate data were obtained from two sources. On the one hand, the historical values from the WorldClim database [51] in its second version [52] were obtained, with a resolution of 1 km per pixel. On the other hand, those data corresponding to the climate change scenarios came from the Coordinated Downscaling Experiment—European Domain (EURO-CORDEX) [53], which provides emission scenarios projected—historical and future—as estimates of climate change (10 km/pixel resolution) [54]. Then, we have applied a process of scale improvement (“downscaling” at 1 km pixel), applying a delta change bias correction method [55,56,57], using the WorldClim database, in a series of 13 regional climate models, as shown in Table 1 [53]. These calculations have a high degree of uncertainty, largely due to the dispersion between the different climate models, as well as the internal climate diversity and the difficulties in transferring the results of the climate model at different spatial and temporal scales. To reduce this variability, the development of a single ensemble model, which assumes the average values of the set of used models, was performed, reducing the bias in the final values [58].
The proposed future climate conditions are based on the RCP, used to produce a new set of climate model simulations [59]. Specifically, the analyses performed in our study apply RCP4.5 and RCP8.5 (which represent intermediate and extreme conditions in the level of radiation force, respectively) projected for two periods—one in the short term (average values 2020–2050) and another in the mid-term (average values 2070–2100). Then, the combination of these climatic conditions, summarised in four future scenarios, are defined as: RCP4.5 2020–2050, RCP4.5 2070–2100, RCP8.5 2020–2050 and RCP8.5 2070–2100.
In both databases (historical and future scenarios), the annual averages of precipitation, the average, maximum and minimum temperature, and radiation were calculated. These new records were used to estimate the reference evapotranspiration (ET0) values, needed for the “Water Yield” model. For the calculation of the ET0, the Hargreaves formula was used [60], in a simplified way, as shown in Equation (6):
E T 0 = 0.0023 ( T a v + 17.78 ) R 0 ( T m a x T m i n ) 0.5
where, E T 0 = daily reference evapotranspiration (mm/day), T a v = average daily temperature (°C), R 0 = extraterrestrial radiation (mm/day), T m a x = maximum daily temperature (°C), T m i n = minimum daily temperature (°C).

2.2.3. Model Calibration

The model “Water Yield” is based on a water balance which applies annual average periods values at pixel level, expressed at the sub-basin level. Therefore, in order to perform a model calibration, the use of existing gauging station data with long-term average flows is suggested [61]. In this work, the model calibration has been performed from the available data of the water volumes obtained in the gauging stations in 6 sub-basins, shown in Table 2.
The daily discharge data were transformed to volume per unit area and per year. The parameters (evapotranspiration coefficient (kc), the seasonality factor (Z) and soil values in the ground cover) were adjusted to calibrate the model “Water Yield” within the intervals found in the literature [63,64]. Moreover, the comparison of the simulation results to the observed data was carried out, using the mean absolute percentage error (MAPE, Equation (7) [65,66]).
M A P E = 1 n t = 1 n | y t y ^ t y t | 100
where n is the number of observations, y t is the observed value and y ^ t is the simulated value.

2.2.4. Altitudinal Delimitation of the Basin

In order to determine a set of limits which allow us to show areas with similar ecological features, the Rhône basin was categorised into four spatial zones according to an altitudinal criterion, as shown in Figure 1. The thresholds used were established according to a physiognomic classification, which contains information on the altitudinal range of plant species [67], and which is organised as follows:
  • Valleys and hills (<500 m), a zone which includes most of the agricultural fields, as well as the leafy forest and the Mediterranean forest;
  • Mountain (500–1200 m), a zone characterised by the existence of important pasture and the development of mainly mixed and leafy forests;
  • Subalpine (1200–2000 m), constituted by the coniferous forests, which represent the highest altitude forest mass groups;
  • Alpine (>2000 m), which gathers three environments—firstly, the lowest (subnival), represented by irregular vegetation restricted only to the most favourable places and where snow is found during part of the year. The second is the alpine zone, formed by a dense cover of vegetation including alpine meadows and sporadic bushes. In addition, finally, the glacial zone, covered in snow for most of the year.
Changes in vegetation cover can lead to significant variations in the water cycle at the basin scale, so this classification contributes to a greater adjustment of the azonal climatic distortion shown in mountain areas. This approach allows a more detailed analysis based on a segmentation of the model results in different altitudinal environmental zones, and it facilitates the detection of changes in the water availability patterns in the proposed climate change scenarios.

3. Results

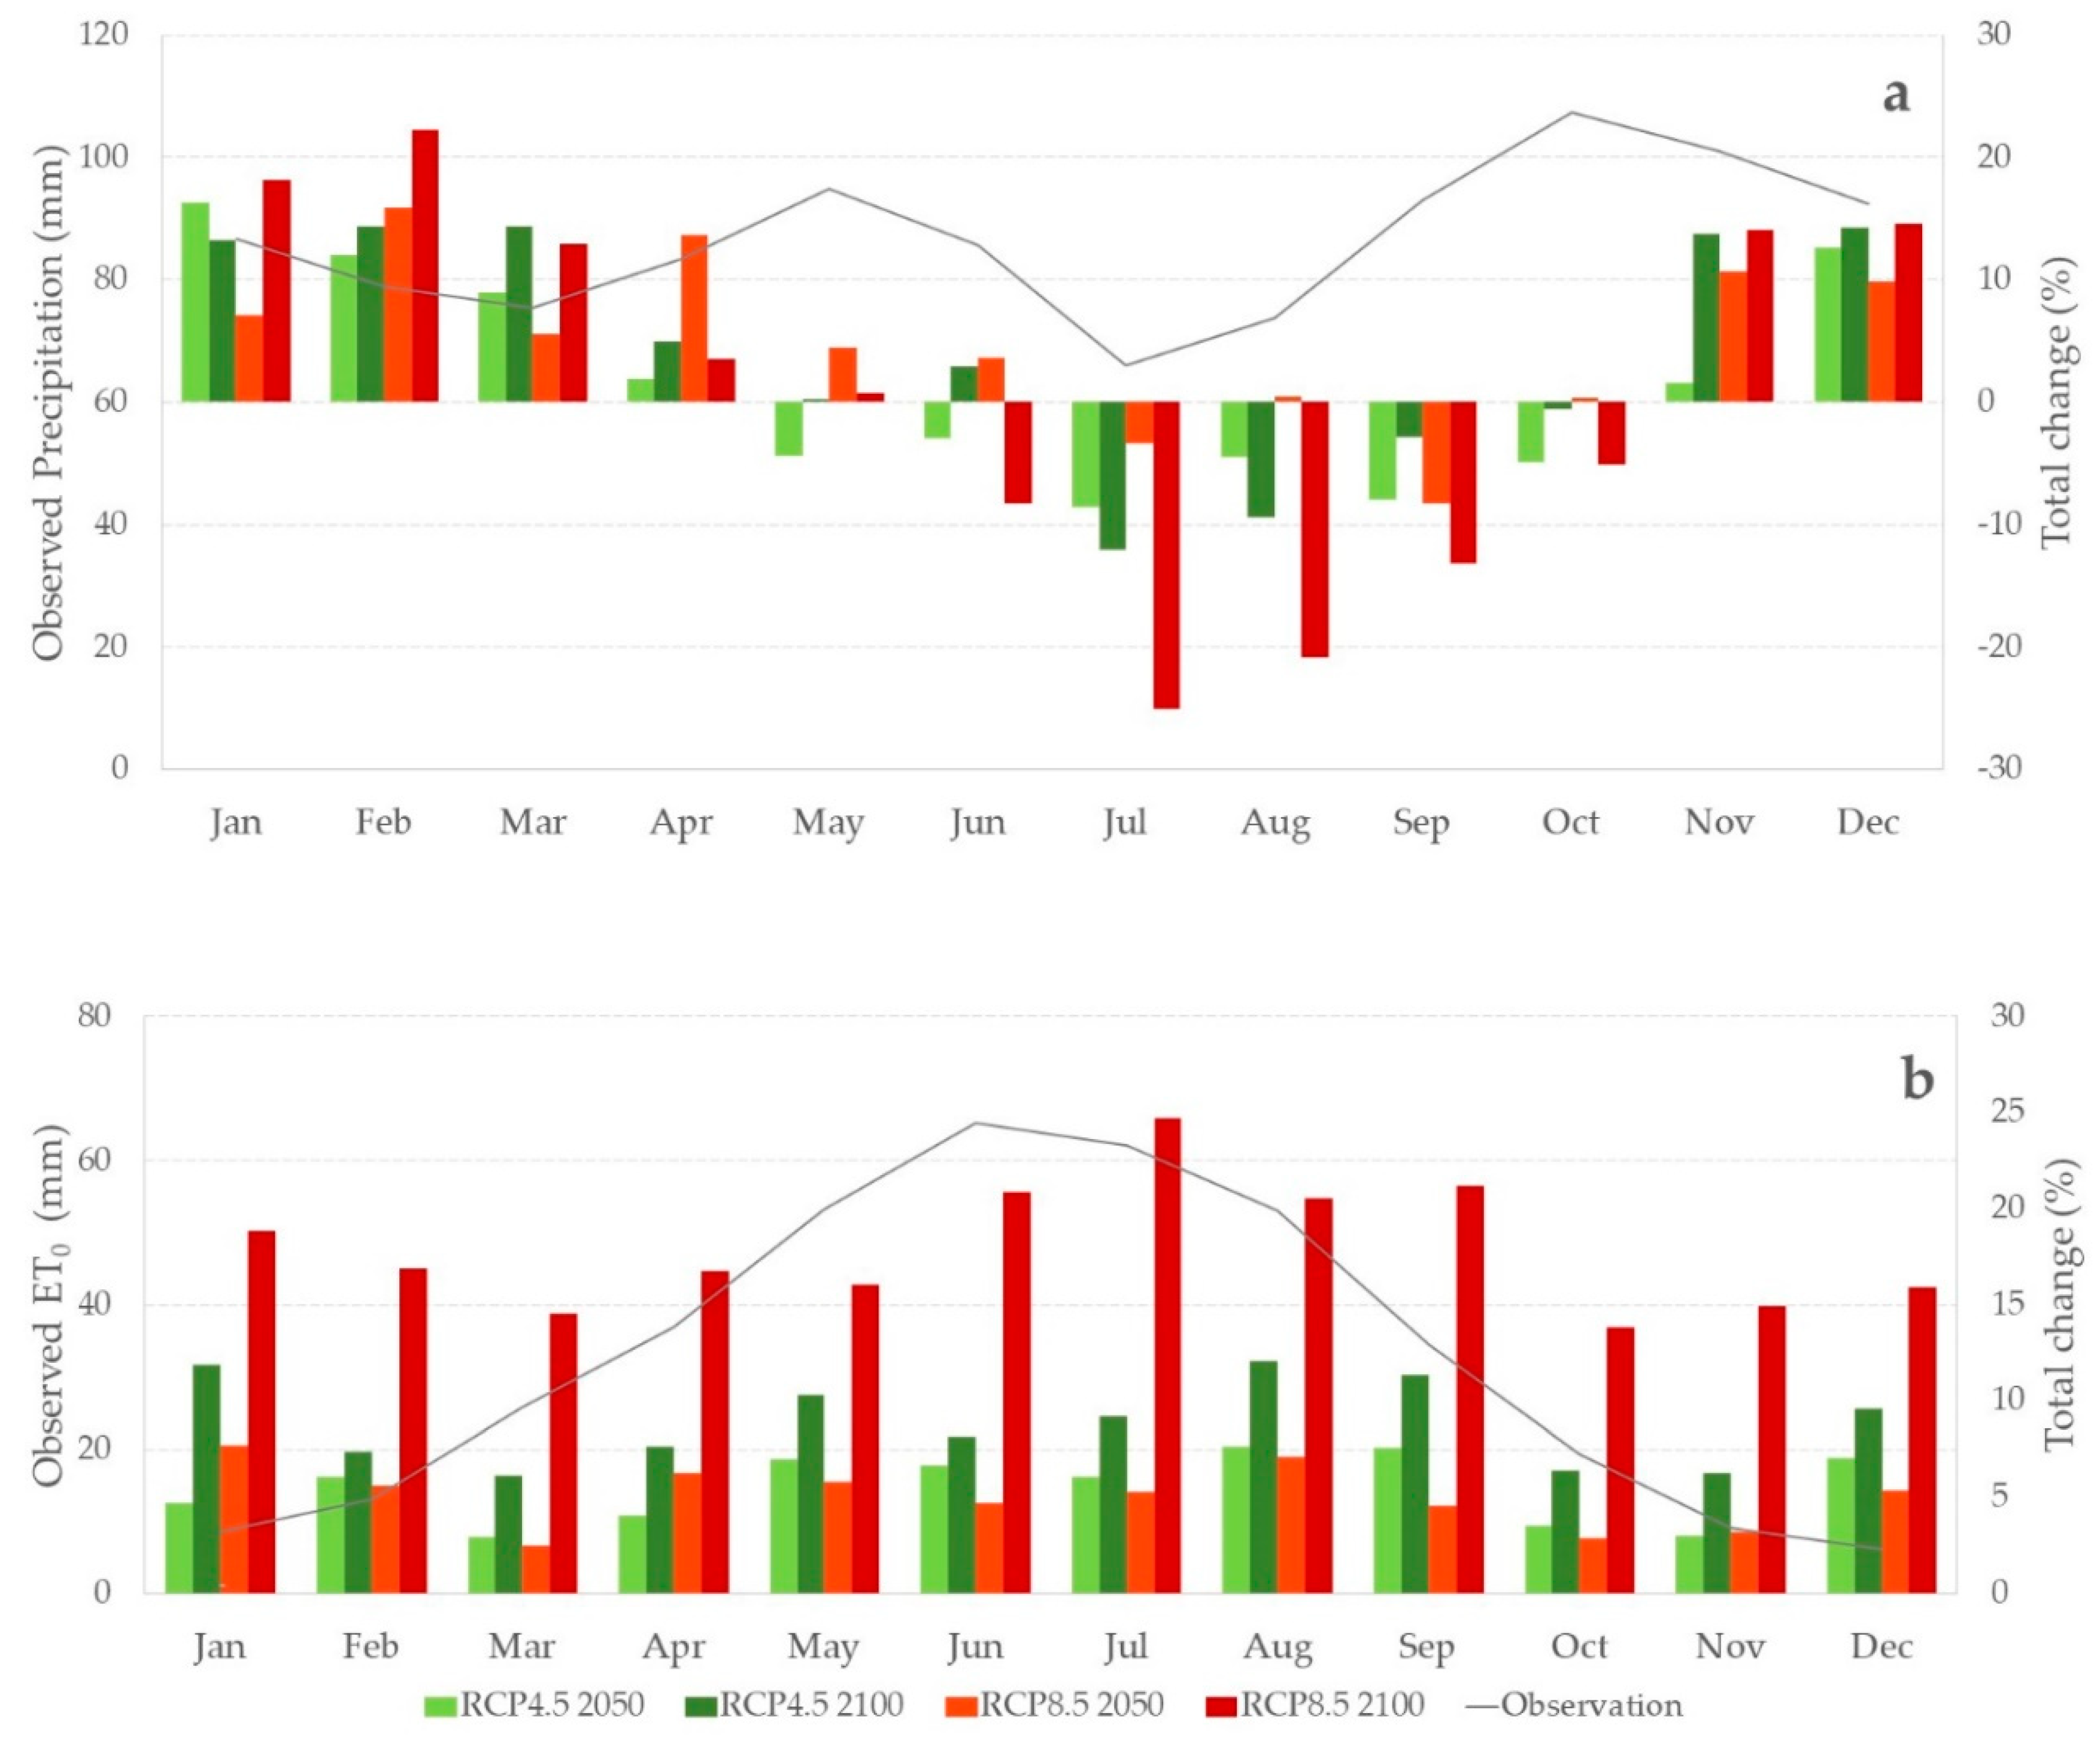
3.1. Trends in Monthly Reference Precipitation and Evapotranspiration Data

As described in Section 2.1, the Rhône basin shows a high complexity in the analysis of its physical factors, due to its size and climatic and orographic heterogeneity. The trends of the analysed climate change scenarios offer values which point to important variations in the dynamics of precipitation. In general, the variation of the estimated precipitation is related to the different RCP and temporal conditions. In this regard, the most interesting results are recorded in the monthly evolution, as shown in Figure 2a. They show a very clear seasonal variation pattern, with increases in precipitation during the autumn–winter period and very pronounced decreases during spring and summer, which can exceed 20% in both cases. However, the months with less precipitation (July and August) also receive important contributions with more than 60 mm monthly, on average. Annually, the average values are greater than 1000 mm, as shown in Figure 2a.
Regarding the ET0 data, as shown in Figure 2b, a more constant distribution is observed throughout the year, with a maximum in summer (65 mm) which drops to 6 mm in December. The expected future change trends reflect a similar pattern in each month, with generalised increases in the RCP4.5 conditions for the two periods analysed. While, for the RCP8.5, a softer upward trend is observed in the period 2020–2050. However, this increase shoots up for the period 2070–2100, with increases that exceed 15% in every month (compared to historical values), and which reach levels close to 25% for the average values of July.

3.2. Model Calibration

The comparison of the simulation results to the observed data constitutes a measure of the goodness of fit and, therefore, the ability of the model to track the observed behaviour. As shown in Table 3, the mean absolute percentage error was below 5% in five out of six sub-basins, which is considered an adequate degree of fit, according to [68], whereas only one sub-basin achieves a good degree of fit (MAPE between 10 and 20%).
It can be concluded that the results of the model calibration point to a high degree of fit between simulation results and observed data, which supports the model outputs, with an average MAPE of 4.3%.

3.3. Outputs of the Module “Water Yield”

The main outputs of the model provide a spatial quantification of the values of actual evapotranspiration and the water yield in the whole basin. From this information, the average records for the entire study area and the five scenarios are obtained. A slight increase in precipitation is obtained in all the scenarios in relation to the current reference value. Regarding potential and actual evapotranspiration, slight changes are also expected in future scenarios, reaching values close to 400 mm in the RCP8.5 2100 scenario, as shown in Figure 3.
Lastly, regarding the estimates of WY in the basin, the trend draws a complex pattern, showing a decrease (1.24%) in the RCP4.5 scenario of the closest period. In RCP4.5 and RCP8.5 of the periods 2070–2100 and 2020–2050, respectively, an increase is shown, even reaching close to 5% in the latter. Finally, in RCP8.5 of the period 2070–2100, a decrease in water yield could be expected, by 9.8% compared to the historical period, as shown in Table 4.
As shown in Figure 3, AET values experience an increase in the entire Rhône basin which are close to 30% in the most extreme cases. These values are related to the temperature increase, according to numerous climate models [7,69]. Concerning WY, the spatially distributed values show a more complex pattern. These results are adjusted to the input values to the precipitation model, which determines important changes in the different scenarios analysed. Both RCP4.5 2050 and RCP8.5 2100 scenarios show the most similar results, with a noticeable decrease in precipitation and, therefore, in the WY (which could reach a 9.8% decrease in the entire basin under RCP8.5 2100), being more pronounced in the southern part of the basin. In the rest of the scenarios, this relationship is not so direct, showing significant precipitation increases (which in some cases can reach 30%), and which determine a positive global WY (1.8 and 4.9% increase in RCP4.5 2100 and RCP8.5 2050, respectively). However, this does not prevent the existence of areas, generally located in the central and southern part of the basin, in which the annual decrease in WY could reach 15–20%.

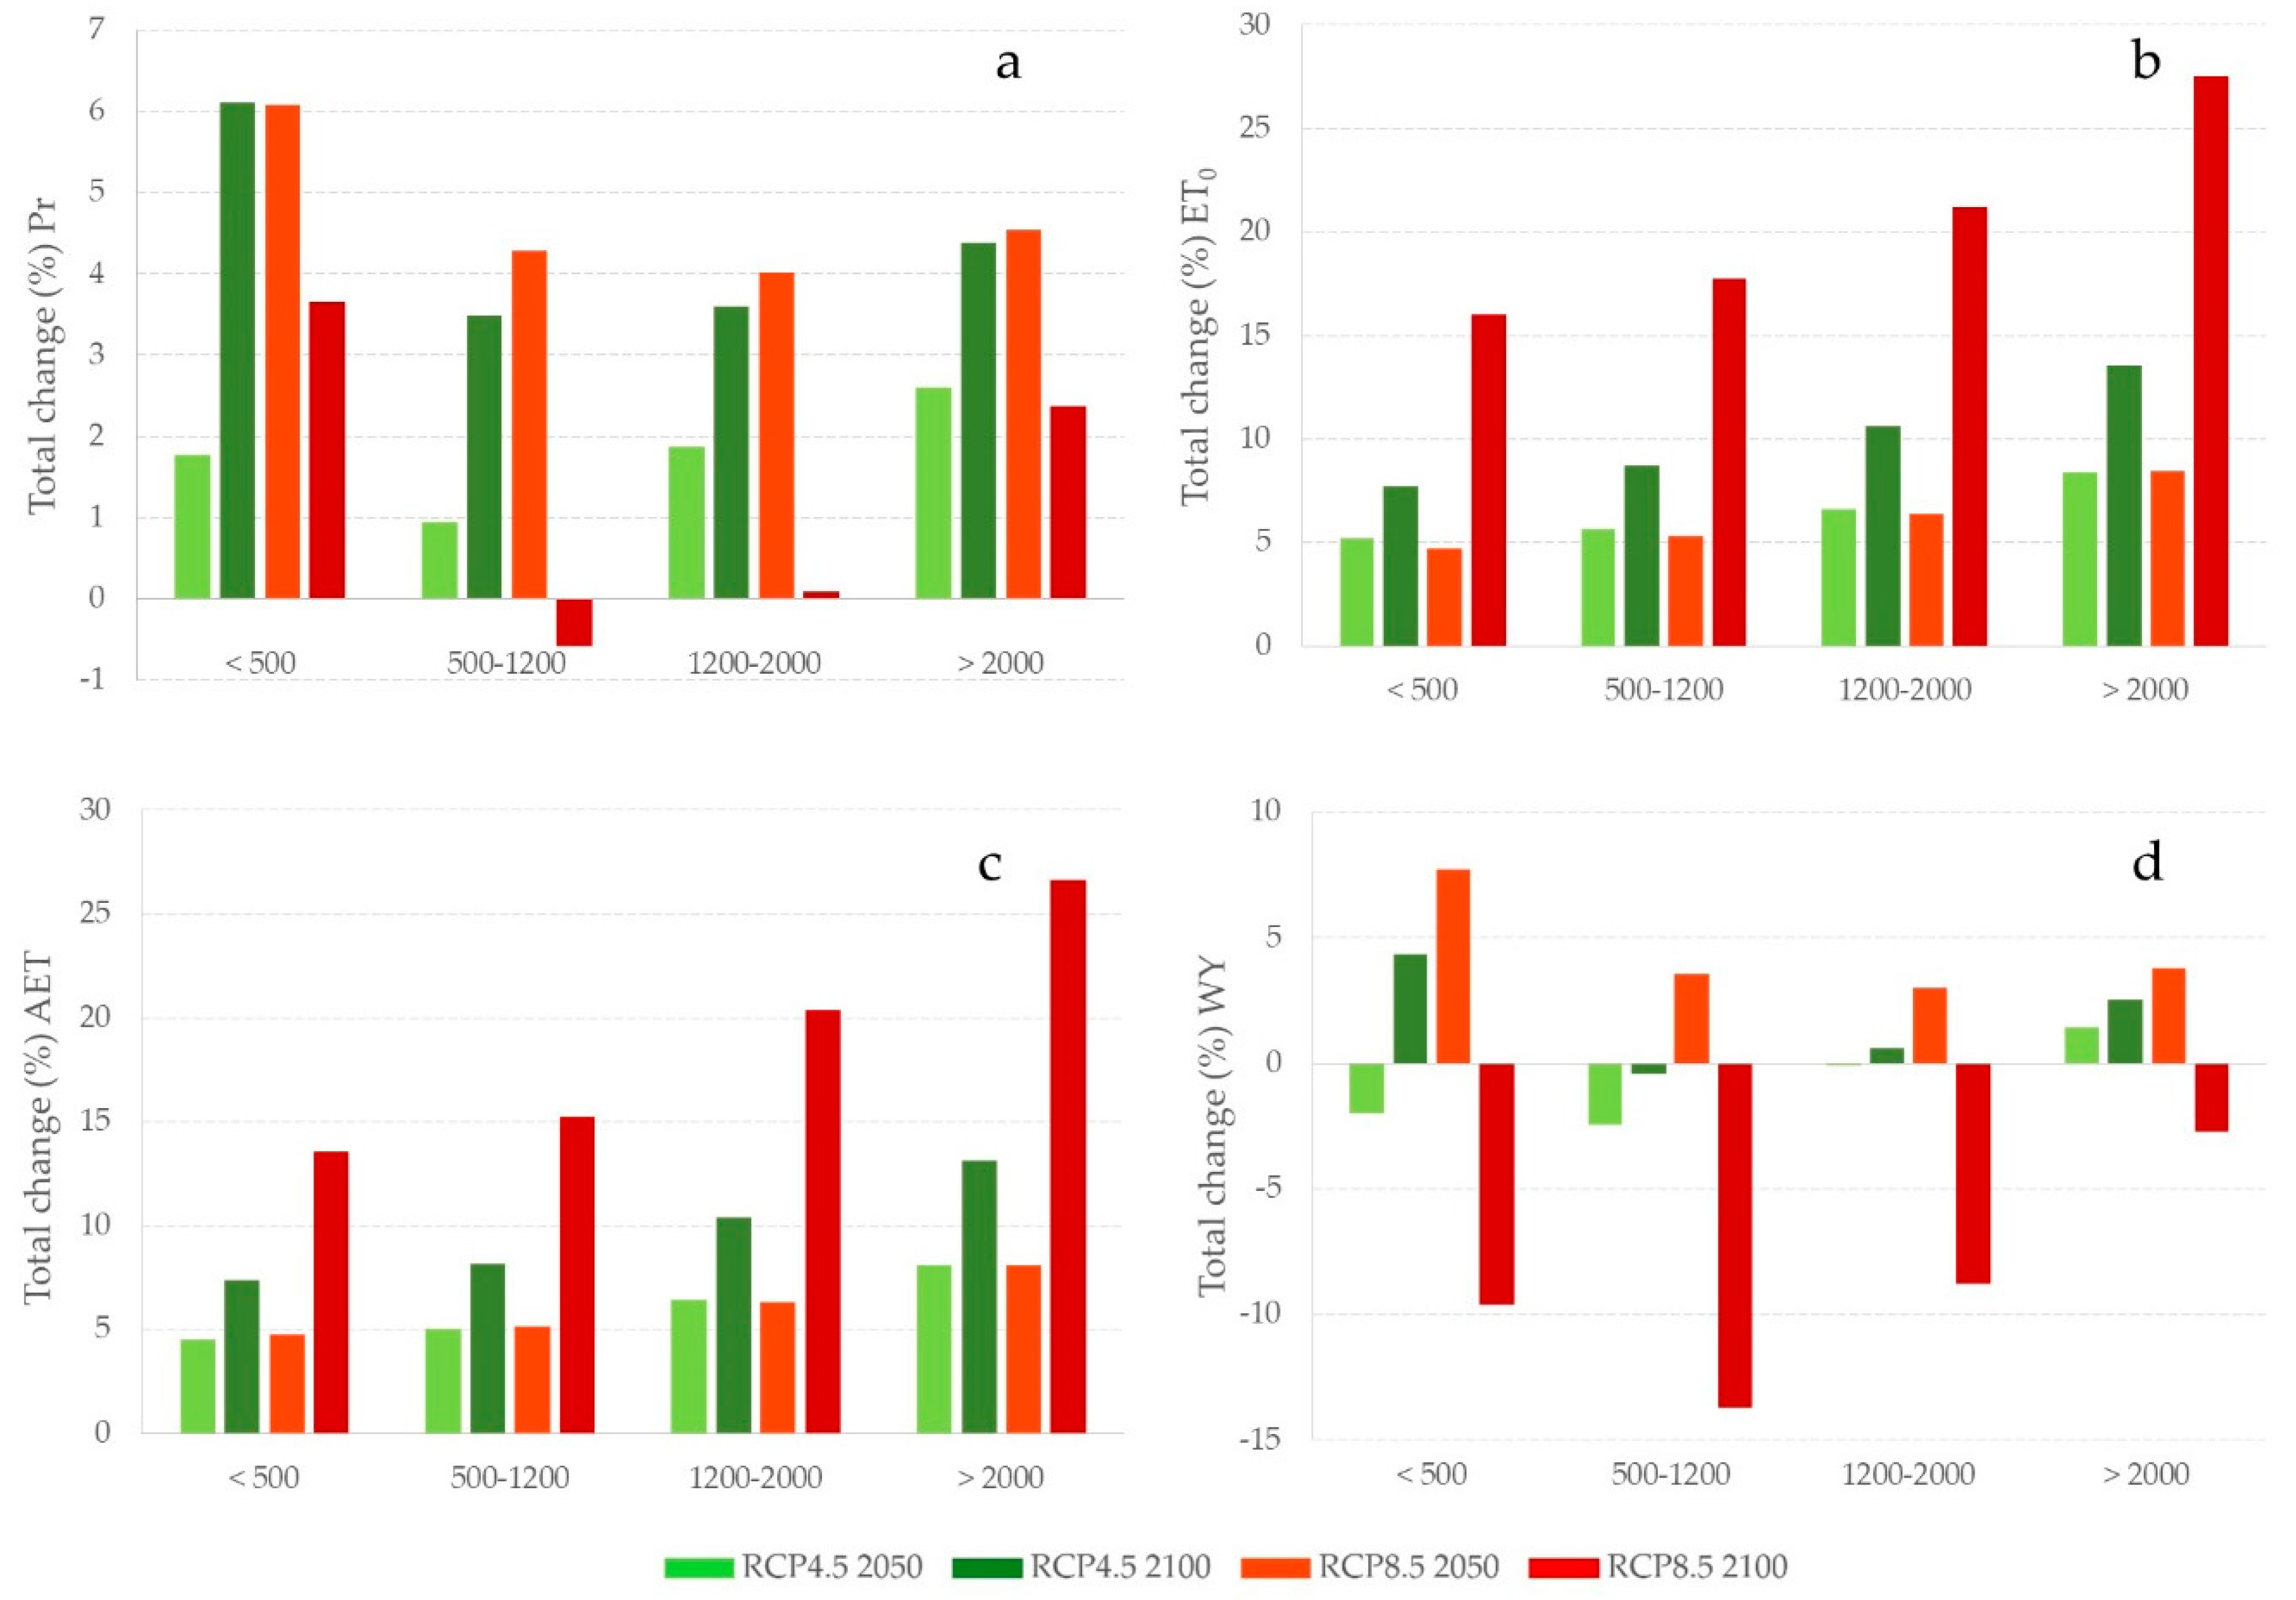
3.4. Altitudinal Analysis of the Modelled Values

This spatial analysis allows us to clarify which areas of the basin participate with the greatest influence on the flow change, which have previously been seen on maps of the entire study area. The altitudinal ranges 500–1200 m and 1200–2000 m show the lowest precipitation percentage of change in all the scenarios, becoming negative (0.6%) in the lower range (500–1200 m) for RCP8.5 2070–2100, as shown in Table 5. ET0 and AET data show a similar trend, as might be expected if we consider that both are governed by the same main parameters. Since general temperatures rise in all climate models, ET0 and AET are expected to increase in all the scenarios analysed. This increase occurs with greater incidence in the scenarios of the 2070–2100 period, reaching rates of change close to 30% in the high mountain zones (>2000 m). The WY values show the most diverse outputs, since each altitudinal range shows a different pattern. RCP8.5 2070–2100 evinces significant decreases in WY in every zone, with the highest loss (13.7%) in the 500–1200 altitudinal range.
Figure 4 shows the total percentage change in the different variables analysed regarding the current values. Precipitation, as shown in Figure 4a, shows a positive correlation with the altitudinal criterion in both periods of RCP4.5 and for 2020–2050 of RCP8.5. The change seems homogeneous by altitudinal range, although it is more pronounced (6%) in the valley and hill zones (<500 m). This trend changes in the RCP8.5 of 2070–2100, with a notable effect in the subalpine zones (1200–2000 m), in which the increase is practically nil for the latter scenario; being able to reverse in the mountain zones (500–1200 m), where the estimated precipitation loss would be around 0.61%.
AET values, as ET0, show a similar pattern than precipitation with small increases for each future scenario in all altitudinal ranges, as shown in Figure 4b,c. Although the effect is more relevant in the alpine zones (>2000 m), where the increase in evapotranspiration reaches 14, 15, 21 and 27% in the two periods of RCP4.5 and in both of RCP8.5, respectively, as shown in Figure 4c.
Finally, Figure 4d shows that water contribution of the basin will be more variable, providing very different effects depending on the altitudinal range. Regarding the first scenario (RCP4.5 2020–2050), it is observed that there is a decrease in the availability of water in low altitudes, but reaching an increase of 1.9% in the alpine zone. RCP4.5 2070–2100 and RCP8.5 2020–2050 show a similar trend, although with different magnitudes, in which the valleys and hills zone shows higher values. Lastly, the most extreme scenario (RCP8.5 2070–2100) shows a clear decreasing trend in all the altitudinal environmental zones, but more sharply in the mountain and subalpine zones, with losses around 14 and 8%, respectively, as shown in Figure 4d.

4. Discussion

The exploration of the input data to the InVEST “Water Yield” module, expressed in monthly values of precipitation and ET0, provides very interesting information to determine trends in future climate change scenarios, essential in the sustainable management of water resources in socio-ecological systems. Regarding the ET0, indirectly related to the temperature data, their values show an increase of similar intensity throughout the year. This directly affects not only the loss due to habitual evapotranspiration in the summer period, but it amplifies this effect during the rest of the year. This change directly affects the water balance of the basin, which could generate a considerable loss of around 100 mm every 2 °C of increase in temperature [70].
The monthly distribution of precipitation shows more significant seasonal variations. The elaborated climate change scenarios show a strong decrease in precipitation during the warmest months. According to [71], this decrease triggers a complex web of impacts that span many sectors of the economy. In this study area, it could directly impact numerous socioeconomic activities, especially the agriculture in the middle and lower part of the basin. The latter could be especially concerned since it is characterised by a great diversity, where milk production predominates, followed by viticulture and fruit trees [5,72]. In this regard, the aforementioned decrease in precipitation in the periods of highest agricultural productivity, along with the increase in evapotranspiration, is beginning to show negative effects in agricultural communities of mountain zones [15,71,73], which play a vital role for the economies of the surrounding valleys and for maintaining the alpine cultural landscape. These environmental zones are the most vulnerable, since they also face other disadvantages, such as low productivity and high production costs due to topography, soil features and climatic restrictions [74].
In turn, the changes in the precipitation described above may cause an increase in the current values, which are evident between the months of November and April, as shown in Figure 2a, promoting a recovery of the annual balance of the precipitation records. In this way, the precipitation regime could be transformed from two maximums to a single one in winter, and a very dry summer season. Logically, whether this trend was to materialise, the river basin regime would be especially altered in the coming decades, as other hydrological models have recently attested [20,21,75]. Given these new climatic circumstances, the surface runoff is expected to decrease significantly by the end of the century, causing decreasing water flows in certain areas of the Rhône basin, along with a reduction of the ordinary flood frequency and an increase of the extraordinary floods, which are the most damaging in terms of socioeconomic impact [16,71].
Regarding the potential changes in the water balance of the basin, the total volume of water shows a complex pattern and uncertainty for both periods and RCP analysed. This significant uncertainty has been highlighted in numerous studies carried out in the Rhône basin [7,16,29,30,36,69,76]. This may be mainly associated with the projections of the effects of climate change, which are largely uncertain due to the development of the climate models, as well as the complex hydrological, morphological and environmental structure of the Rhône basin. Concerning the results of water yield, a diverse spatial distribution occurs in all the scenarios analysed. The northernmost parts are characterised by an increase in water yield; whereas in the southern part of the basin, the decrease in WY is evident, which is similar to the expected pattern within the rest of the basins of the northwestern Mediterranean side. For their part, [77] determined significant decreases; around a third of the flows of coastal Mediterranean rivers in Southern France at the end of this century, which represents an estimated reduction of 20% of the total water resources in this part of the Mediterranean coast, although they concluded that “annual precipitation did not follow clear trends” [77] (p. 452). Therefore, if the expected changes of the precipitation and AET values—which express the input and output data to the water system—do not vary substantially between them, as shown in Figure 3, it would be necessary to explore other potential factors which could explain the loss of flow in the basin. Thus, a detailed review of the different environmental zones of the Rhône basin would be necessary in order to assess with greater precision how this socio-ecological system will be affected in different altitudinal environments, and to establish what role they play in the water balance of the basin.
In this regard, the valley and hill zones, delimited by areas below 500 m and occupied by agricultural activities and deciduous and Mediterranean forests, show the highest increases in precipitation. For RCP4.5 2070–2100 and RCP8.5 2020–2050, growths around 6% are estimated, which, along with a weak rise in evapotranspiration, could mean greater availability of water resources, over 5%. According to the conclusions of [37], the response of runoff varies by hydrographic basins according to meteorological anomalies and the intrinsic features of each zone (soil, vegetation and dominant climate); although, in general, their results are in line with those shown in our work.
Likewise, consistently with the obtained results, in the northern river valleys (Saône, Doubs and Ain), precipitation and runoff would increase for the period of analysis (2054–2064) between 17–29% and 20–48%, respectively, while the increase in evaporation is relatively weaker (13%), compared to precipitation and runoff values. In contrast, in the southern part, these data are reduced, but they seem to be more associated with the decrease in runoff which leads to lower levels of groundwater and higher temperatures, which, in turn, would favour the infiltration in these less humid soils [77].
On the other hand, in the environmental zones located in the range between the levels 500–1200 m, as well as the subalpine zone (1200–2000 m), the model outputs provide similar patterns of change. The decrease in the water yield capacity of these zones is significant, especially at higher altitudes, and very pronounced in the most extreme scenario (RCP8.5 2070–2100). The intermediate zones are very susceptible to changes in future climate scenarios, strongly influenced by the transformation of land cover due to land use changes [69]. The general rise in temperatures, already shown in the observation scenario, might favour the expansion of conducive spaces to the development of both crops and natural vegetation at higher elevations. Recent studies have pointed out that there has been a general trend in the increase of green cover or “greening up” in the mountains of the northern Mediterranean basin during the last decades, which is causing alterations in the water cycle [78,79]. The increase in forest mass in areas such as the one under study, where, initially, there was significant vegetation cover, may trigger a substantial reduction in runoff [80,81,82], linked to the improvement of the soil structure and the increase of its infiltration capacity. This could explain the loss of part of the water flows, since growth of this green cover also has an associated partition effect that the vegetation introduces, through processes such as evaporation, transpiration and interception, with a new precipitation redistribution [83,84].
Finally, the last altitudinal environmental zone located in the eastern part of the basin, is considered the pure alpine landscape, associated with the upper range (>2000 m). The model results provide a slight increase in precipitation in all the scenarios, following the overall trend of the rest of the altitudinal environmental zones. Nevertheless, in this case, the clearest effect is the highest increase in evapotranspiration, with rates of change between 30 and 68%, depending on the scenario, as shown in Figure 4b. In addition, the decrease in the albedo caused by the loss of a large snow cover exerts a local influence on the atmosphere and hydrology through a feedback mechanism which increases the melting of ice and the retreat of glaciers [85]. Early melting could affect hydropower-based energy production, due to reservoir filling as a result of a shortage during peak flows [69]. This accelerated process of permanent snow and ice cover loss may explain an important part of the variation of water supplied in high mountains, where three out of the four analysed scenarios show increasing values compared to the observation scenario. These data coincide with other studies carried out in these alpine environments [86], which estimated that, in the next 100 years, alpine glaciers might lose between 50 and 90% of their current volume, and for each degree of temperature rise, the average level of snow will increase by 150 m of altitude [14]. Therefore, it is expected that hydrological systems, directly connected to the processes of melting glaciers, will respond in quantity and seasonality to precipitations of high variability and uncertainty, but with a clear pattern of increased risk of flooding during the spring, and an increase in droughts during summer and autumn [32,87]. Even though the values of the expected changes in the alpine zone are not as big as in the rest of our analysed zones, these are considered very important since they are very sensitive areas and prone to undergo the greatest transformations caused by the effects of climate change [86].
Despite of the potentialities of the model to generate valuable information, these kinds of models show certain limitations. The empirical models use available data, at a general level, accepting spatially explicit inputs and producing spatially explicit outputs, and limiting the model structure to key biophysical processes involved in land use change [88]. Although they are considered the easiest models to apply, they do not offer a dynamic view of the process, but rather are geared towards predicting long-term average values [89]. In the case of the “Water Yield” module of InVEST, as an example of these kinds of models, is not exempt from limitations [90]. First of all, there is a limitation due to the limited capacity of the model to account for inter- or intra-annual change in the water supply. Another drawback is shown in the calibration process, in which it shows few adjustment parameters [91]. In addition, it might produce unrealistic outputs when the underlying hydrological processes are not adequately described [92]. In this sense, the lack of some transfers in the water flows in the model has been observed, such as the values related to crop irrigation, as well as the similar interpretation of natural vegetation and crops [93]. According to [89], an improvement in the differentiation of the uses of groundwater would be also necessary in order to treat it as part of evapotranspiration in the case of irrigation water, or as a return flow to the river in the case of drinking water. These factors are likely to provide measurements with some precision of the estimated flow, but not the real total water yield observed at gauging stations [91].
Another important limitation is the lack of ability of the model to deal with melting processes, which may affect the results in the higher altitude zones of our study area. Despite the model applying annual precipitation values, in which the total volumes of ice and snow are considered, the melting processes in different periods of the year are not detectable. This might trigger a noteworthy error, if the size of the glacier area is relatively large regarding the total surface of the basin. The study of [94] applies the InVEST “Water Yield” model in a basin located in the greater Himalayan range, with a glacier area around 24%, compared to the total area of the basin. These authors calibrate the model, applying a high value of kc for permanent snow and ice areas, trying to simulate an increasing water contribution of this area. Despite these kinds of solutions, we should be cautious, since this inconvenience may increase the uncertainty in the results in higher altitude zones [95,96].
Regarding the analysis of changes in land use and coverage in water flows, it would be interesting to analyse its effect in different future climate scenarios in more detail, since the interaction of human activities and the transforming effect of the climate determine great uncertainty in these cover changes [97]. These changes, although lesser than those caused by the effect of the climate, have a significant influence on the availability of water, and it is important to determine their impacts in order to establish strategies at various scales for the sustainability of ecosystem services [57,98]. Taking all these limitations of the model into account, it would be advisable to involve stakeholders in decision-making to improve the interpretation of the results obtained in order to face the sustainability of this socio-ecological system [90].
As a complex socio-ecological system, characterised by strong interdependence of interactions between factors [99], little changes in some of the processes in this area may trigger transformations into other processes that may cause, in turn, instability in the entire system. These results suggest that, in the coming years, it will be necessary to attend to the prevention and mitigation of the risk of extraordinary floods, especially in areas of highly populated and sensitive socioeconomic sectors, such as tourism and industry [100]. Moreover, [16] (p. 9) have suggested that the changes in runoff in the Rhône River “might lead to an increase of use rivalries between the different sectors using water resources (such as hydropower, agriculture, cooling of nuclear plants, production of drinking water or ecosystem) for their own purposes”. For these authors, ensuring stronger adaptive capacities by anticipating potential tensions within actors is needed, even more due to the multiplicity of institutional levels and frameworks of a transboundary area as the Rhône basin.
In conclusion, the results of the application of a methodological approach, based on the use of the InVEST model, have been analysed in this work. According to [101], these outputs can be considered essential to improve decision-making in complex socio-ecological systems, considering long-term adjustment, as also has been shown by [41,42]. In addition, these outputs might be used to identify viable adaptation strategies for each altitudinal environmental zone, with indication of trade-offs between decisions or policy options. In this regard, sustainable management of water resources within the context of a complex SES requires the explicit consideration of numerous interacting factors, the ecological and socioeconomic impacts of climate extremes and uncertainty [101], as well as the need to maintain the sustainable uses “under changing, possibly adverse, climatic conditions” [102] (p.1). According to [101], the adaptive capacity of SES to absorb climate changes needs to be further enhanced and it is also claimed from the recent European Commission’s report [71]. Therefore, it seems essential to deepen the existing knowledge about potential effects of climate change scenarios to improve adaptation and mitigation policies and decision-making, particularly aimed at minimising uncertainties and assessing potential risks associated to management decisions [6,101].

5. Conclusions

The analysis of the different environmental zones characterised by altitudinal features establish important differences in the final water balance in the whole basin under the different scenarios of climate change addressed in this work. The most evident effect is expected to occur in mountain (500–1200 m) and subalpine (1200–2000 m) zones, regarding the overall variables analysed.
Despite of the fact that alpine zones (>2000 m) do not show the biggest rate of change, these expected changes would require further attention and monitorisation due to the high sensitivity of these alpine zones. Among them, the increases in evapotranspiration, which would be close to 26%, and which could be associated with the increase in albedo due to the glacier coverage loss, may be highlighted. This accelerated process of permanent ice cover loss in the long term may explain an important part of the increase in water contributed by high peaks, which, in turn, will affect the rest of the Rhône basin.
The methodological approach applied to obtain the results could be extrapolated to other nearby areas of the Mediterranean basin, where the gradual loss of resources will require important adaptations to new challenges imposed by the uncertainty of water yield shown by these scenarios. The development of tools which allow the assessment of the changes of the elements that constitute the water cycle linked to climate change may serve as a basis for solutions related to water management and its future demands, as well as in the development of more effective and sustainable policies in the management of water resources in these kinds of socio-ecological systems.

Author Contributions

P.P.-C. and P.B.P. had the original idea and contributed to the discussion of the study. I.B.-G. and P.P.-C. contributed to data collection and calculation analysis, and both wrote the paper. All authors have read and approved the final manuscript.

Funding

This work has been carried out within the framework of the research project ‘Identification of realistic scenarios of climate change and Sustainable Land Management (SLM) for 2010–2100 period, in the catchment area of the Mediterranean Sea’, funded by the University of Fribourg (Switzerland) in the internationalization scholarship program for the period 2016–2017.

Acknowledgments

P.B.P. is grateful to Laboratoire Méditerranéen de Sociologie (LAMES) for the research stay at Aix Marseille Université-CNRS–UMR 7305. Special mention should be made of the researchers Joris de Vente, Carolina Boix-Fayos and Joris Eekhout from the Soil Erosion and Conservation Group of the Center for Soil Science and Applied Biology (CEBAS-CSIC), and also Reynald Delaloye and Luc Braillard from the Department of Physical Geography group of Geosciences (University of Fribourg) for their help and support in the development of the project.

Conflicts of Interest

The authors declare no conflict of interest.

References

  1. IPCC. Global warming of 1.5 °C. An IPCC Special Report on the impacts of global warming of 1.5 °C above pre-industrial levels and related global greenhouse gas emission pathways, in the context of strengthening the global response to the threat of climate change, sustainable development, and efforts to eradicate poverty. In Summary for Policy Makers; Masson-Delmotte, V., Zhai, P., Pörtner, H.O., Roberts, D., Skea, J., Shukla, P.R., Pirani, A., Moufouma-Okia, W., Péan, C., Pidcock, R., et al., Eds.; IPCC: Geneva, Switzerland, 2018; Available online: https://www.ipcc.ch/site/assets/uploads/sites/2/2018/07/SR15_SPM_version_stand_alone_LR.pdf (accessed on 1 April 2020).
  2. Mendizabal, M.; Sepúlveda, J.; Torp, P. Climate change impacts on flood events and its consequences on human in Deba River. Int. J. Environ. Res. 2014, 8, 221–230. [Google Scholar]
  3. Pavanelli, D.; Capra, A. Climate change and human impacts on hydroclimatic variability in the reno river catchment, Northern Italy. Clean Soil Air Water 2014, 42, 535–545. [Google Scholar] [CrossRef]
  4. Bréthaut, C.; Clarvis, M.H. Interdisciplinary approaches for analysing governance challenges across the Rôhne basin. Reg. Environ. Chang. 2015, 15, 499–503. [Google Scholar] [CrossRef] [Green Version]
  5. Olivier, J.M.; Carrel, G.; Lamouroux, N.; Dole-Olivier, M.J.; Malard, F.; Bravard, J.P.; Amoros, C. The Rhône River basin. In Rivers of Europe; Tockner, K., Robinson, C., Uehlinger, C.T., Eds.; Academic Press: London, UK, 2009; pp. 247–295. [Google Scholar]
  6. Guerrin, J.; Bouleau, G.; Grelot, F. “Functional fit” versus “politics of scale” in the governance of floodplain retention capacity. J. Hydrol. 2014, 519, 2405–2414. [Google Scholar] [CrossRef] [Green Version]
  7. Sauquet, E.; Richard, B.; Devers, A.; Prudhomme, C. Water restrictions under climate change: A Rhône–Mediterranean perspective combining bottom-up and top-down approaches. Hydrol. Earth Syst. Sci. 2019, 23, 3683–3710. [Google Scholar] [CrossRef] [Green Version]
  8. Bréthaut, C.; Pflieger, G. The shifting territorialities of the Rhone River’s transboundary governance: A historical analysis of the evolution of the functions, uses and spatiality of river basin governance. Reg. Environ. Chang. 2015, 15, 549–558. [Google Scholar] [CrossRef] [Green Version]
  9. Karpouzoglou, T.; Dewulf, A.; Clark, J. Advancing adaptive governance of social-ecological systems through theoretical multiplicity. Environ. Sci. Policy 2016, 57, 1–9. [Google Scholar] [CrossRef] [Green Version]
  10. Bréthaut, C. Transboundary Water Management: From Geopolitics to a Non-state Analytical Perspective: The Case of the Rhône River. In A Critical Approach to International Water Management Trends. Palgrave Studies in Water Governance: Policy and Practice; Bréthaut, C., Schweizer, R., Eds.; Palgrave Macmillan: London, UK, 2018; pp. 71–95. [Google Scholar] [CrossRef]
  11. Tonka, L. Hydropower license renewal and environmental protection policies: A comparison between Switzerland and the USA. Reg. Environ. Chang. 2014, 15, 539–548. [Google Scholar] [CrossRef]
  12. European Commission (EC). Guidance Document on the Intercalibration Process 2008–2011. Guidance Document No. 14. Implementation Strategy for the Water Framework Directive (2000/60/EC); Office for Official publications of the European Communities: Luxembourg, 2010; p. 102. [Google Scholar]
  13. Majone, B.; Villa, F.; Deidda, R.; Bellin, A. Impact of climate change and water use policies on hydropower potential in the south-eastern Alpine region. Sci. Total Environ. 2016, 543, 965–980. [Google Scholar] [CrossRef] [PubMed]
  14. Vivrioli, D.; Weingartner, R. Water towers a global view on the hydrological importance of mountains. In Mountains: Sources of Water, Sources of Knowledge; Wiegandt, E., Ed.; Springer: Dordrecht, The Netherlands, 2008; pp. 15–20. [Google Scholar]
  15. Briner, S.; Elkin, C.; Huber, R.; Grêt-Regamey, A. Assessing the impacts of economic and climate changes on land-use in mountain regions: A spatial dynamic modeling approach. Agric. Ecosyst. Environ. 2012, 149, 50–63. [Google Scholar] [CrossRef]
  16. Ruiz-Villanueva, V.; Stoffel, M.; Bussi, G.; Francés, F.; Bréthaut, C. Climate change impacts on discharges of the Rhone River in Lyon by the end of the twenty-first century: Model results and implications. Reg. Environ. Chang. 2015, 15, 505–515. [Google Scholar] [CrossRef]
  17. Beniston, M. Impacts of climatic change on water and associated economic activities in the Swiss Alps. J. Hydrol. 2012, 412, 291–296. [Google Scholar] [CrossRef] [Green Version]
  18. Beniston, M.; Stoffel, M. Assessing the impacts of climatic change on mountain water resources. Sci. Total Environ. 2014, 493, 1129–1137. [Google Scholar] [CrossRef] [PubMed]
  19. Gobiet, A.; Kotlarski, S.; Beniston, M.; Heinrich, G.; Rajczak, J.; Stoffel, M. 21st century climate change in the European Alps—A review. Sci. Total Environ. 2014, 493, 1138–1151. [Google Scholar] [CrossRef] [PubMed]
  20. Beniston, M.; Stoffel, M.; Hill, M. Impacts of climatic change on water and natural hazards in the Alps: Can current water governance cope with future challenges? examples from the European ‘‘ACQWA’’ project. Environ. Sci. Policy 2011, 14, 734–743. [Google Scholar] [CrossRef] [Green Version]
  21. Chauveau, M.; Chazot, S.; Perrin, C.; Bourgin, P.Y.; Sauquet, E.; Vidal, J.P.; Rouchy, N.; Martin, E.; David, J.; Norotte, T.; et al. Quels impacts des changements climatiques sur les eaux de surface en France à l’horizon 2070? La Houille Blanche Rev. Int. de l’eau EDP Sci. 2013, 4, 5–15. [Google Scholar] [CrossRef] [Green Version]
  22. Gaudard, L.; Romerio, F.; Dalla-Valle, F.; Gorret, R.; Maran, S.; Ravazzani, G.; Stoffel, M.; Volonterio, M. Climate change impacts on hydropower in the Swiss and Italian Alps. Sci. Total Environ. 2014, 493, 1211–1221. [Google Scholar] [CrossRef]
  23. Pellicciotti, F.; Carenzo, M.; Bordoy, R.; Stoffel, M. Changes in glaciers in the Swiss Alps and impact on basin hydrology: Current state of the art and future research. Sci. Total Environ. 2014, 493, 1152–1170. [Google Scholar] [CrossRef]
  24. Rohling, E.J.; Bryden, H.L. Man-induced salinity and temperature increases in Western Mediterranean Deep Water. J. Geophys. Res. 1992, 97, 191–198. [Google Scholar] [CrossRef] [Green Version]
  25. Bethoux, J.P.; Gentili, B. Functioning of the Mediterranean Sea: Past and present changes related to freshwater input and climate changes. J. Mar. Syst. 1999, 20, 33–47. [Google Scholar] [CrossRef]
  26. Barboux, C.; Strozzi, T.; Delaloye, R.; Wegmüller, U.; Collet, C. Mapping slope movements in Alpine environments using TerraSAR-X interferometric methods. ISPRS J. Photogramm. Remote Sens. 2016, 109, 178–192. [Google Scholar] [CrossRef] [Green Version]
  27. Delaloye, R.; Lambiel, C.; Gärtner-Roer, I. Overview of rock glacier kinematics research in the Swiss Alps: Seasonal rhythm, interannual variations and trends over several decades. Geogr. Helv. 2010, 65, 135–145. Available online: https://www.zora.uzh.ch/id/eprint/38562/1/Delaloye_Lambiel_Overview_Rock_Glacier_2010.pdf (accessed on 16 March 2020). [CrossRef]
  28. Mollaret, C.; Hilbich, C.; Pellet, C.; Flores-Orozco, A.; Delaloye, R.; Hauck, C. Mountain permafrost degradation documented through a network of permanent electrical resistivity tomography sites. Cryosphere 2019, 13, 2557–2578. [Google Scholar] [CrossRef] [Green Version]
  29. Jones, D.B.; Harrison, S.; Anderson, K.; Whalley, W.B. Rock glaciers and mountain hydrology: A review. Earth Sci. Rev. 2019, 193, 66–90. [Google Scholar] [CrossRef]
  30. Fatichi, S.; Rimkus, S.; Burlando, P.; Bordoy, R. Does internal climate variability overwhelm climate change signals in streamflow? The upper Po and Rhone basin case studies. Sci. Total Environ. 2014, 493, 1171–1182. [Google Scholar] [CrossRef]
  31. Sikorska, A.E.; Renard, B. Calibrating a hydrological model in stage space to account for rating curve uncertainties: General framework and key challenges. Adv. Water Resour. 2017, 105, 51–66. [Google Scholar] [CrossRef] [Green Version]
  32. Huss, M.; Zemp, M.; Joerg, P.C.; Salzmann, N. High uncertainty in 21st century runoff projections from glacierized basins. J. Hydrol. 2014, 510, 35–48. [Google Scholar] [CrossRef] [Green Version]
  33. IDR (French National Research Institute for Sustainable Development). Available online: http://www.ird.fr/ (accessed on 4 April 2019).
  34. Lamouroux, N.; Olivier, J.M.; Camenen, B.; Castella, E.; Clemens, A.; Doledec, S.; Forcellini, M.; Piégay, H.; Riquier, J.; Rosset, V. RhônEco (1998–2018). Suivi Écologique de la Restauration du Rhône. Bilan et Proposition Technique Pour la Période 2014–2018; halshs-01240098, Version 1; ZABR: Lyon, France, 2013; p. 9. [Google Scholar]
  35. HYDRO. Available online: http://hydro.eaufrance.fr (accessed on 13 March 2019).
  36. Clarvis, M.H.; Fatichi, S.; Allan, A.; Fuhrer, J.; Stoffel, M.; Romerio, F.; Gaudard, L.; Burlando, P.; Beniston, M.; Xoplaki, E.; et al. Governing and managing water resources under changing hydroclimatic contexts: The case of the upper Rhone basin. Environ. Sci. Policy 2014, 43, 56–67. [Google Scholar] [CrossRef]
  37. Etchevers, P.; Golaz, C.; Habets, F.; Noilhan, J. Impact of a climate change on the Rhone river catchment hydrology. J. Geophys. Res. 2002, 107, 6–18. [Google Scholar] [CrossRef]
  38. InVEST User Guide. Available online: http://releases.naturalcapitalproject.org/invest-userguide/latest/reservoirhydropowerproduction.html (accessed on 5 April 2020).
  39. Arkema, K.K.; Guannel, G.; Verutes, G.; Woo, S.A.; Guerry, A.; Ruckelshaus, M.; Silver, J.M. Coastal habitats shield people and property from sea-level rise and storms. Nat. Clim. Chang. 2013, 3, 913–918. [Google Scholar] [CrossRef]
  40. Wei, Y.; He, S.; Li, G.; Chen, X.; Shi, L.; Lei, G.; Su, Y. Identifying Nature–Community Nexuses for Sustainably Managing Social and Ecological Systems: A Case Study of the Qianjiangyuan National Park Pilot Area. Sustainability 2019, 11, 6182. [Google Scholar] [CrossRef] [Green Version]
  41. Fu, B.; Li, N. Tradeoff between Hydropower and River Visual Landscape Services in Mountainous Areas. Sustainability 2019, 11, 5509. [Google Scholar] [CrossRef] [Green Version]
  42. Meisch, C.; Schirpke, U.; Huber, L.; Rüdisser, J.; Tappeiner, U. Assessing Freshwater Provision and Consumption in the Alpine Space Applying the Ecosystem Service Concept. Sustainability 2019, 11, 1131. [Google Scholar] [CrossRef] [Green Version]
  43. Xu, X.; Liu, W.; Scanlon, B.R.; Zhang, L.; Pan, M. Local and global factors controlling water-energy balances within the Budyko framework. Geophys. Res. Lett. 2013, 40, 6123–6129. [Google Scholar] [CrossRef]
  44. Fu, B.P. On the calculation of the evaporation from land surface. Sci. Atmos. Sin. 1981, 5, 23–31. [Google Scholar]
  45. Budyko, M.I. Climate and Life; Van Mieghem, J., Hales, A.L., Eds.; Academic Press: New York, NY, USA, 1974; Volume 18. [Google Scholar]
  46. Sanchez-Canales, M.; López, A.; Pons, R.; Bangash, R.; Acuña, V.; Schuhmacher, M.; Elorza, F.J. Sensitivity analysis of an ecosystem service valuation: Application in a sediment retention modeling of a Mediterranean watershed. Sci. Total Environ. 2012, 440, 140–153. [Google Scholar] [CrossRef]
  47. ESA. Available online: https://www.esa-landcover-cci.org/ (accessed on 13 March 2019).
  48. JPL (Jet Propulsion Laboratory. California Institute of Technology). Available online: https://www2.jpl.nasa.gov/srtm (accessed on 6 January 2018).
  49. Lehner, B.; Grill, G. Global river hydrography and network routing: Baseline data and new approaches to study the world’s large river systems. Hydrol. Proces. 2013, 27, 2171–2186. Available online: www.hydrosheds.org (accessed on 16 March 2020). [CrossRef]
  50. ISRIC. Available online: https://soilgrids.org (accessed on 30 July 2017).
  51. WorldClim. Available online: http://worldclim.org (accessed on 10 July 2017).
  52. Fick, S.E.; Hijmans, R.J. Worldclim 2: New 1-km spatial resolution climate surfaces for global land areas. J. Clim. 2017, 37, 4302–4315. [Google Scholar] [CrossRef]
  53. EURO-CORDEX-Coordinated Downscaling Experiment-European Domain. Available online: https://www.euro-cordex.net/ (accessed on 10 June 2017).
  54. van Vuuren, D.; Edmonds, J.; Kainuma, M.; Riahi, K.; Thomson, A.; Hibbard, K.; Hurtt, G.; Kram, T.; Krey, V.; Lamarque, J.F.; et al. The representative concentration pathways: An overview. Clim. Chang. 2011, 109, 5–31. [Google Scholar] [CrossRef]
  55. Chen, J.; Brissette, F.P.; Leconte, R. Uncertainty of downscaling method in quantifying the impact of climate change on hydrology. J. Hydrol. 2011, 401, 190–202. [Google Scholar] [CrossRef]
  56. Eekhout, J.P.C.; de Vente, J. Assessing the effectiveness of Sustainable Land Management for large-scale climate change adaptation. Sci. Total Environ. 2019, 654, 85–93. [Google Scholar] [CrossRef] [PubMed]
  57. Eekhout, J.P.C.; Boix-Fayos, C.; Pérez-Cutillas, P.; de Vente, J. The impact of reservoir construction and changes in land use and climate on ecosystem services in a large Mediterranean catchment. J. Hydrol. 2020, 590, 125208. [Google Scholar] [CrossRef]
  58. San-Martín, D.; Manzanas, R.; Brands, S.; Herrera, S.; Gutiérrez, J. Reassessing model uncertainty for regional projections of precipitation with an ensemble of statistical downscaling methods. J. Clim. 2017, 30, 203–223. [Google Scholar] [CrossRef]
  59. Moss, R.H.; Edmonds, J.A.; Hibbard, K.A.; Manning, M.R.; Rose, S.K.; van Vuuren, D.P.; Carter, T.R.; Emori, S.; Kainuma, M.; Kram, T.; et al. The next generation of scenarios for climate change research and assessment. Nature 2010, 463, 747–756. [Google Scholar] [CrossRef] [PubMed]
  60. Hargreaves, G.H.; Samani, Z.A. Reference crop evapotranspiration from temperature. Appl. Eng. Agric. 1985, 1, 96–99. [Google Scholar] [CrossRef]
  61. Boithias, L.; Acuña, V.; Vergoñós, L.; Ziv, G.; Marcé, R.; Sabater, S. Assessment of the water supply: Demand ratios in a Mediterranean basin under different global change scenarios and mitigation alternatives. Sci. Total Environ. 2014, 470–471, 567–577. [Google Scholar] [CrossRef]
  62. Federal Office for the Environment FOE-Hydrological Data and Forecast. Scheizeriche Eidgenossenschaft (Switzerland Confederation). Available online: http://www.hydrodaten.admin.ch/ (accessed on 16 July 2020).
  63. Allen, R.G.; Pereira, L.S.; Raes, D.; Smith, M. Crop evapotranspiration. Guidelines for computing crop water requirements. In FAO Irrigation and Drainage Paper 56; Food and Agriculture Organization of the United Nations: Rome, Italy, 1998; Available online: http://www.fao.org/docrep/x0490e/x0490e00.htm (accessed on 15 July 2020).
  64. Allen, R.; Pruitt, W.; Raes, D.; Smith, M.; Pereira, L. Estimating Evaporation from Bare Soil and the Crop Coefficient for the Initial Period Using Common Soils Information. J. Irrig. Drai. Eng. 2005, 131, 14–23. [Google Scholar] [CrossRef]
  65. Oliva, R. Model calibration as a testing strategy for system dynamics models. Eur. J. Oper. Res. 2003, 151, 552–568. [Google Scholar] [CrossRef]
  66. Yu, P.S.; Yang, T.C. Fuzzy multi-objective function for rainfall-runoff model calibration. J. Hydrol. 2000, 238, 1–14. [Google Scholar] [CrossRef]
  67. Becker, T.; Dietz, H.; Billeter, R.; Buschmanna, H.; Edwards, P.J. Altitudinal distribution of alien plant species in the Swiss Alps. Perspec. Plant Ecol. Evol. Systemat. 2005, 7, 173–183. [Google Scholar] [CrossRef]
  68. Niedbała, G. Application of Artificial Neural Networks for Multi-Criteria Yield Prediction of Winter Rapeseed. Sustainability 2019, 11, 533. [Google Scholar] [CrossRef] [Green Version]
  69. Farley, K.A.; Jobbágy, E.G.; Jackson, R.B. Effects of afforestation on water yield: A global synthesis with implications for policy. Glob. Chang. Biol. 2005, 11, 1565–1576. [Google Scholar] [CrossRef]
  70. Riedo, M.; Gyalistras, D.; Fuhrer, J. Pasture responses to elevated temperature and doubled CO2 concentration: Assessing the spatial pattern across an alpine landscape. Clim. Res. 2001, 17, 19–31. [Google Scholar] [CrossRef]
  71. Feyen, L.; Ciscar, J.C.; Gosling, S.; Ibarreta, D.; Soria, A. Climate Change Impacts and Adaptation in Europe. JRC PESETA IV Final Report; EUR 30180EN; Publications Office of the European Union: Luxembourg, 2020; p. JRC119178. [Google Scholar] [CrossRef]
  72. Agreste (La Statisitque, L’évaluation et la Prospective Agricole du Ministère de L’agriculture et de L’alimentation). Available online: http://agreste.agriculture.gouv.fr/en-region/rhone-alpes/ (accessed on 10 April 2020).
  73. Fuhrer, J.; Smith, P.; Gobiet, A. Implications of climate change scenarios for agriculture in alpine regions—A case study in the Swiss Rhone catchment. Sci. Total Environ. 2014, 493, 1232–1241. [Google Scholar] [CrossRef]
  74. Mann, S. The Future of Mountain Agriculture; Springer: Berlin/Heidelberg, Germany, 2013; p. 176. [Google Scholar]
  75. Boé, J.; Habets, F. Multi-decadal river flow variations in France. Hydrol. Earth Syst. Sci. 2014, 18, 691–708. [Google Scholar] [CrossRef] [Green Version]
  76. Clarvis, M.H. Governing and managing water resources under changing hydro-climatic contexts: The case of the upper Rhone basin. Environ. Sci. Policy 2013, 43, 56–67. [Google Scholar] [CrossRef]
  77. Lespinas, F.; Ludwig, W.; Heussner, S. Impact of recent climate change on the hydrology of coastal Mediterranean rivers in Southern France. Clim. Chang. 2010, 99, 425–456. [Google Scholar] [CrossRef]
  78. Rahman, K.; Gago da Silva, A.; Moran Tejeda, E.; Gobiet, A.; Beniston, M.; Lehmann, A. An independent and combined effect analysis of land use and climate change in the upper Rhone River watershed, Switzerland. App. Geograp. 2015, 63, 264–272. [Google Scholar] [CrossRef]
  79. Molina, A.; Vanacker, V.; Brisson, E.; Mora, D.; Balthazar, V. Multidecadal change in streamflow associated with anthropogenic disturbances in the tropical Andes. Hydrol. Earth Syst. Sci. 2015, 19, 4201–4213. [Google Scholar] [CrossRef] [Green Version]
  80. Morán-Tejeda, E.; Ceballos-Barbancho, A.; Llorente-Pinto, J.M. Hydrological response of Mediterranean headwaters to climate oscillations and land-cover changes: The mountains of Duero River basin (Central Spain). Glol. Planet Chang. 2010, 72, 39–49. [Google Scholar] [CrossRef]
  81. López-Moreno, J.I.; Vicente-Serrano, S.M.; Zabalza, J.; Revuelto, J.; Gilaberte, M.; Azorín-Molina, C.; Morán-Tejeda, E.; García-Ruiz, J.M.; Tague, C. Respuesta hidrológica del Pirineo central al cambio ambiental proyectado para el siglo XXI. Pirineos 2014, 169, e004. [Google Scholar] [CrossRef]
  82. Pérez-Cutillas, P.; Zema, D.A.; Cataldo, M.F.; de Vente, J.; Boix-Fayos, C. Efectos de la revegetación a escala de cuenca sobre el caudal y la evapotranspiración en ambiente mediterráneo. Cuenca del Taibilla (SE de España). Bosque 2017, 39, 119–129. [Google Scholar] [CrossRef] [Green Version]
  83. García-Ruiz, J.M.; López-Moreno, J.I.; Vicente-Serrano, S.M.; Lasanta-Martínez, T.; Beguería, S. Mediterranean water resources in a global change scenario. Earth Sci. Rev. 2011, 105, 121–139. [Google Scholar] [CrossRef] [Green Version]
  84. Linhoss, A.C.; Siegert, C.M. A comparison of five forest interception models using global sensitivity and uncertainty analysis. J. Hydrol. 2016, 538, 109–116. [Google Scholar] [CrossRef] [Green Version]
  85. Fassnacht, S.R.; Cherry, M.L.; Venable, N.B.H.; Saavedra, F. Snow and albedo climate change impacts across the United States Northern Great Plains. Cryosphere 2016, 10, 329–339. [Google Scholar] [CrossRef] [Green Version]
  86. Hohmann, C.; Kirchengast, G.; Birk, S. Alpine foreland running drier? Sensitivity of a drought vulnerable catchment to changes in climate, land use, and water management. Clim. Chang. 2018, 147, 179–193. [Google Scholar] [CrossRef] [Green Version]
  87. Kormann, C.; Francke, T.; Bronstert, A. Detection of regional climate change effects on alpine hydrology by daily resolution trend analysis in Tyrol, Austria. J. Water Clim. Chang. 2015, 6, 124–143. [Google Scholar] [CrossRef]
  88. Guswa, A.; Brauman, K.A.; Brown, C.; Hamel, P.; Keeler, B.; Sayre, S. Ecosystem services: Challenges and opportunities for hydrologic modeling to support decision making. Water Resour. Res. 2014, 50, 4535–4544. [Google Scholar] [CrossRef] [Green Version]
  89. Terrado, M.; Acuña, V.; Ennaanay, D.; Tallis, H.; Sabater, S. Impact of climate extremes on hydrological ecosystem services in a heavily humanized Mediterranean basin. Ecol. Ind. 2013, 37, 199–209. [Google Scholar] [CrossRef]
  90. Sharp, R.; Tallis, H.T.; Ricketts, T.; Guerry, A.D.; Wood, S.A.; Chapin-Kramer, R.; Nelson, E.; Ennaanay, D.; Wolny, S.; Olwero, N.; et al. InVEST 3.2.0 User’s Guide The Natural Capital Project; WWF: Gland, Switzerland; TNC: Arlington County, VA, USA; Institute for the Environment, University of Minnesota: Twin Cities, MN, USA; Stanford WOODS Institute for the Environment: Stanford, CA, USA, 2015. [Google Scholar]
  91. Redhead, J.W.; Stratford, C.; Sharps, K.; Jones, L.; Ziv, G.; Clarke, D.; Oliver, T.H.; Bullock, J.M. Empirical validation of the InVEST water yield ecosystem service model at a national scale. Sci. Total Environ. 2016, 569–570, 1418–1426. [Google Scholar] [CrossRef] [Green Version]
  92. Scordo, F.; Lavender, T.M.; Seitz, C.; Perillo, V.L.; Rusak, J.A.; Piccolo, M.C.; Perillo, G.M. Modeling Water Yield: Assessing the role of site and region-specific attributes in determining model performance of the InVEST Seasonal Water Yield Model. Water 2018, 10, 1496. [Google Scholar] [CrossRef] [Green Version]
  93. Hamel, P.; Guswa, A.J. Uncertainty analysis of a spatially explicit annual water-balance model: Case study of the Cape Fear basin, North Carolina. Hydrol. Earth Syst. Sci. 2015, 19, 839–853. [Google Scholar] [CrossRef] [Green Version]
  94. Goyal, M.K.; Khan, M. Assessment of spatially explicit annual water-balance model for Sutlej River Basin in eastern Himalayas and Tungabhadra River Basin in peninsular India. Hydrol. Res. 2017, 48, 542–558. [Google Scholar] [CrossRef] [Green Version]
  95. Shukla, A.K.; Pathak, S.; Pal, L.; Ojha, C.S.P.; Mijic, A.; Garg, R.D. Spatio-temporal assessment of annual water balance models for upper Ganga Basin. Hydrol. Earth Syst. Sci. 2018, 22, 5357–5371. [Google Scholar] [CrossRef] [Green Version]
  96. Pathak, S.; Ojha, C.S.; PShukla, A.K.; Garg, R.D. Assessment of Annual Water-Balance Models for Diverse Indian Watersheds. J. Sustain. Water Built Environ. 2019, 5, 04019002. [Google Scholar] [CrossRef]
  97. Clerici, N.; Cote-Navarro, F.; Escobedo, F.J.; Rubiano, K.; Villegas, J.C. Spatio-temporal and cumulative effects of land use-land cover and climate change on two ecosystem services in the Colombian Andes. Sci. Total Environ. 2019, 685, 1181–1192. [Google Scholar] [CrossRef]
  98. Khan, M.; Sharma, A.; Goyal, M.K. Assessment of future water provisioning and sediment load under climate and LULC change scenarios in a peninsular river basin, India. Hydrol. Sci. J. 2019, 64, 405–419. [Google Scholar] [CrossRef]
  99. Thonicke, K.; Bahn, M.; Lavorel, S.; Bardgett, R.D.; Erb, K.; Giamberini, M.; Reichstein, M.; Vollan, B.; Rammig, A. Advancing the understanding of adaptive capacity of social-ecological systems to absorb climate extremes. Earth’s Future 2020, 8, e2019EF001221. [Google Scholar] [CrossRef] [Green Version]
  100. EEA. Climate Change, Impacts and Vulnerability in Europe 2016. An Indicator-Based Report; Agency, E.E., Ed.; Publications Office of the European Union: Luxembourg, 2017; p. 419. [Google Scholar]
  101. Thorel, M.; Piégay, H.; Barthelemy, C.; Räpple, B.; Stella, J.C. Socio-environmental implications of process-based restoration strategies in large rivers: Should we remove novel ecosystems along the Rhône (France)? Reg. Environ. Chang. 2018, 18, 2019–2031. [Google Scholar] [CrossRef]
  102. Iwanaga, T.; Partington, D.; Ticehurst, J.; Croke, B.F.; Jakeman, A.J. A socio-environmental model for exploring sustainable water management futures: Participatory and collaborative modelling in the Lower Campaspe catchment. J. Hydrol. Reg. Stud. 2020, 28, 100669. [Google Scholar] [CrossRef]
Figure 1. Location of the Rhône river basin, and delimitation of the altitudinal environmental zones.
Sustainability 12 06402 g001
Figure 2. (a) Left axis: monthly precipitation values (mm) for the observation period (1970–2000); right axis: total percentage change of the Representative Concentration Pathway (RCP) scenarios regarding the historical period (observation). (b) Left axis: monthly reference evapotranspiration values (mm) for the observation period (1970–2000); right axis: total percentage change of the RCP scenarios with respect to the historical period (observation).
Sustainability 12 06402 g002
Figure 3. Rhône basin models of precipitation (Pr), reference evapotranspiration (ET0), actual evapotranspiration (AET) and water yield (WY) for the historical period (observation) 1970–2000, expressed in mm per year. Percentage of change of Pr, ET0, AET and WY for future scenarios, defined as: RCP4.5 2020–2050, RCP4.5 2070–2100, RCP8.5 2020-2050 and RCP8.5 2070-2100. Percentage of change: values in blue mean “increased” Pr and WY, while “decreased” ET0 and AET. Values in yellow mean “no change”. Values in red mean “decreased” Pr and WY, while “increased” ET0 and AET.
Sustainability 12 06402 g003
Figure 4. Total percentage change in the variables analysed regarding the current values of the environmental zones characterised by altitudinal features (<500: valleys and hills; 500–1200: mountains; 1200–2000: subalpine; <2000: alpine). (a) Total of change (%) in precipitation (Pr). (b) Total of change (%) in reference evapotranspiration (ET0). (c) Total of change (%) in actual evapotranspiration (AET). (d) Total change (%) in water yield (WY). Soft green RCP4.5 2050; dark green RCP4.5 2100; soft red RCP8.5 2050; dark red RCP8.5 2100.
Sustainability 12 06402 g004
Table 1. General and regional climate models used for developing the climate scenarios.
Regional Climate Model
CCLMCNRM-ALADINHIRHAM5 RACMORCAWRF
General Circulation ModelCNRM-CM5oo o
EC-EARTHo ooo
IPSL-CM5A-MR oo
MPI-ESM-LRo o
HadGEM2-ES oo
Regional Climate Models: Research Institutes. CLCM: Climate Limited-area Modelling Community (CLMcom). CNRM-ALADIN: Centre National de Recherches Météorologiques (CNRM). HIRHAM5: Danish Meteorological Institute (DMI). RACMO: Royal Netherlands Meteorological Institute (KNMI). RCA: Swedish Meteorological and Hydrological Institute (SMHI). WRF: Institute Pierre Simon Laplace (IPSL).
Table 2. Available data of water volumes from gauging stations used in the model calibration.
River Sub-BasinGauging StationRecord PeriodCatchment Area Upstream (ha)Total Discharge (hm3 Year−1)
Upper RhônePorte-de-Scexfrom 1935814,435.325771.09
AinChazey Sur Ainfrom 1959367,649.533878.93
SaôneMâconfrom 19522,983,111.4512,709.01
IsèreBeaumont-Monteuxfrom 19561,190,725.3410,627.63
DuranceMeyrarguesfrom 19941,330,705.916338.74
Lower RhôneBeaucairefrom 19203,103,491.3314,317.34
Total9,790,118.8953,642.736
Water volume calculated by means of annual discharge in record period. Data origin: Federal Office for Water and Geology [62]; Direction Régionale de l’Environnement Provence-Alpes-Côte d’Azur (French data available at [35]).
Table 3. Summary of the main results of the model calibration.
River Sub-BasinObserved (hm3 Year−1)SimulatedMAPE (%)
Upper Rhône5771.095934.422.8
Ain3878.933365.3513.2
Saône12,709.0113,178.483.7
Isère10,627.6310,351.762.6
Durance6338.746402.611.0
Lower Rhône14,317.3414,705.972.7
Table 4. Quantification of the basin flow volumes (WY) in the five analysed scenarios. Rates of change expressed in percent (%) for RCP scenarios compared to the historical period (observation).
ScenarioVolume (Hm3)Variation (Hm3)Rate (%)
Observation53,322.75
RCP4.5 2020–205052,662.85−659.90−1.24
RCP4.5 2070–210054,298.05975.311.83
RCP8.5 2020–205055,952.592629.854.93
RCP8.5 2070–210048,095.63−5227.11−9.80
Table 5. Data of precipitation, reference evapotranspiration, actual evapotranspiration and water yield expressed in average values and rates of change regarding altitudinal ranges.
Alt. Range<500500–12001200–2000>2000
Surface km248,17429,25611,1909151
Pr (mm) x ˜ σ% x ˜ σ% x ˜ σ% x ˜ σ%
Observation917.2119.0 1073.6176.8 1277.8220.7 1257.5358.4
RCP4.5 50933.4129.71.81083.8193.10.91301.7238.31.91290.2372.82.6
RCP4.5 100973.2127.46.11111.0187.63.51323.7236.13.61312.6376.24.4
RCP8.5 50972.9126.16.11119.6187.54.31328.9232.44.01314.6373.54.5
RCP8.5 100950.7132.83.71067.4193.3−0.61278.9237.60.11287.4367.02.4
ET0 (mm)
Observation415.467.2 404.268.3 345.463.0 238.753.5
RCP4.5 50437.170.35.2427.071.45.6368.265.16.6258.855.38.4
RCP4.5 100447.673.67.7439.674.38.7382.066.710.6271.056.713.5
RCP8.5 50435.172.04.7425.772.85.3367.565.76.4258.955.38.4
RCP8.5 100481.877.016.0475.877.917.7418.768.721.2304.559.127.5
AET (mm)
Observation520.696.8 485.498.8 390.888.7 233.683.5
RCP4.5 50544.499.84.6509.9101.05.0415.991.76.4252.688.78.1
RCP4.5 100559.1103.17.4525.1104.58.2431.494.110.4264.392.113.1
RCP8.5 50545.5101.44.8510.4103.55.1415.592.76.3252.688.78.1
RCP8.5 100591.3105.413.6559.5104.615.3470.596.020.4295.9100.426.6
WY (mm)
Observation394.5162.2 588.2242.9 888.4283.2 1100.4283.1
RCP4.5 50386.8170.1−2.0573.9259.2−2.4887.5303.6−0.11116.2298.11.4
RCP4.5 100411.7170.34.3585.8257.2−0.4893.9302.80.61128.4298.62.5
RCP8.5 50425.1171.77.7609.1257.53.5915.1298.83.01142.2295.03.8
RCP8.5 100356.7169.5−9.6507.7258.2−13.7810.4306.0−8.81070.2292.2−2.7
Average value ( x ˜ ), standard deviation (σ) and total percentage change (%) in precipitation (Pr); reference evapotranspiration (ET0); actual evapotranspiration (AET); and water yield (WY), regarding environmental zones characterised by altitudinal features (<500: valleys and hills; 500–1200: mountains; 1200–2000: subalpine; <2000: alpine). Percentage of change: values in blue mean “increased" Pr and WY, while “decreased” ET0 and AET. Values in yellow mean “no change”. Values in red mean “decreased” Pr and WY, while “increased” ET0 and AET.

