Article

Landscape Evaluation as a Complementary Tool in Environmental Assessment. Study Case in Urban Areas: Salamanca (Spain)

by
Marco Criado
1,*,
Antonio Martínez-Graña
2,
Fernando Santos-Francés
1 and
Leticia Merchán
1
1
Department of Soil Sciences, Faculty of Environmental Sciences, University of Salamanca, 37007 Salamanca, Spain
2
Department of Geology, Faculty of Sciences, University of Salamanca, 37008 Salamanca, Spain
*
Author to whom correspondence should be addressed.
Sustainability 2020, 12(16), 6395; https://doi.org/10.3390/su12166395
Submission received: 14 July 2020 / Revised: 5 August 2020 / Accepted: 6 August 2020 / Published: 8 August 2020

Abstract

:
In recent years, the landscape has become another environmental resource, so it is important to incorporate it into planning actions. However, its broad sense of study has made it difficult to develop methodologies that precisely diagnose the state of the landscape and its management requirements, especially in dynamic spaces like urban areas. In order to develop a method capable of providing information that can be incorporated into environmental assessment and territorial planning tasks so that the needs of the landscape are taken into account in the decision-making stages, an objective methodology is presented based on the study of different parameters (biotic, abiotic and socioeconomic) analyzed in the field and subsequently geoprocessed through Geographic Information Systems according to their influence on the landscape. Through the proposed methodology it is possible to determine the quality, fragility and need of protection of the landscape, as well as to identify the diverse landscape units that form the landscape of a territory. Based on these results, a landscape diagnosis can be drawn up to quantify its overall and partial state, carry out monitoring analyses and make comparisons between different landscape units, so that management measures can be adopted according to the obtained scenarios.

1. Introduction

The landscape is an area, as perceived by people, whose character is the result of the action and interaction of natural and/or human factors [1]. Thus, the landscape can be understood as an entity resulting from the interaction between ecology, vegetation, geology, geomorphology, hydrology, edaphology, climatology, fauna and anthropic activity, and its dynamism must also be taken into account due to the continuous action of natural agents and human activity, which is currently the most important in the alteration of landscapes [2,3,4]. However, the complexity of the relationships between the different components, the difficulty in studying them, the discrepancies in their interpretation and the analysis of the landscape exclusively through the visual aspect (VIA), without including other aspects (natural, social, cultural, etc.) made the analysis and inclusion of the landscape in the environmental assessment processes late in relation to the rest of the physical environment components [4]. Nowadays, the landscape is considered to be yet another resource of great importance within the set of environmental values demanded by society, since it is perceived as an important factor in the quality of life [5,6]. Furthermore, the search for highly valuable natural landscapes promotes tourism and is the economic driving force behind small rural municipalities [7,8]. All these aspects mean that the landscape is integrated into planning policies and actions as another element of the environment [9,10].
Today, anthropic activity is one of the main causes of landscape alteration, especially in urban environments [11], due to the agglomeration of population and services that rapidly and irreversibly consume the land [12,13]. The magnitude and speed of changes in land use [14] lead to the breakdown of the landscape, causing transformations in its initial value and identity [4]. Therefore, properly assessing the landscape in different development initiatives is essential to avoid the degradation of the most valuable landscapes. Planners and leaders need to have methodologies that allow for the preparation of detailed landscape inventories and the monitoring of changes in order to make appropriate decisions, a very important aspect in such dynamic, complex and multifunctional spaces as cities [15]. In addition, ensuring a diversity of well-preserved landscapes is necessary given the diversity of observers, with subjective assessments of them according to their tastes and perception [2]. This aspect becomes crucial in the urban environment due to the need to achieve landscape performance in line with sustainable development and in addition to performing economic and social functions, it also preserves ecological ones [16,17].
For landscape analysis, there are direct and indirect methodologies or combinations of both [18,19,20]. The first to appear were the direct methodologies (1970s), which are based on the subjective evaluation of landscape aesthetics based on sensory perceptions such as visual, sound or olfactory [21,22]. In that regard, studies were carried out that estimated the preferences of the population and groups of experts in relation to perception "in situ" or through photographs of the landscape [23,24,25,26], and these can currently be carried out using virtual reality and similar technologies [27,28]. However, some authors have begun to highlight the need for quantitative landscape measurements to define indicators for landscape assessment that would contribute to a conceptual framework for landscape planning [29,30,31]. In this way, indirect methods were developed, which analyze the distribution of the components of the landscape and their relationship with the different components of the environment (vegetation, orography, etc.) whose combination defines the elements of the landscape [32]. Indirect methods have increased since the advance of Geographical Information Systems (GIS) at the beginning of the 21st century [33,34,35,36,37], and they establish a series of study factors and evaluate their impact on the landscape [38].
The principles underlying the methodology proposed in this manuscript are in line with the European Landscape Convention: identification of existing landscapes, analysis of their characteristics and identification of transformation pressures [1]. Landscape units are spaces that share a unique and singular structural, functional or perceptually differentiated configuration, identified by their internal coherence and their differences from other units [2,39]. The quality of the landscape evaluates the different spaces according to their relevance, singularity and importance in the perception of the landscape [40,41]. The fragility of the landscape is related to its vulnerability to change through the action of an external impact that implies a deterioration of its values [42,43]. Based on these two concepts, the absorption capacity of a landscape can be estimated, which is the capacity of response that a landscape has in the face of an impact and, from this, the need for protection that the landscape requires in each location can be established [38,44]. Transformation pressures are often linked to socioeconomic dynamics and are often multiple and complex in urban and periurban environments [11,45], and alteration of the landscape can also affect the ecological structure [46,47,48].
There is therefore a clear need for adequate and up-to-date information on the state of the landscape. In view of this, the aim of the manuscript is to establish a methodology based on the study and processing of preestablished objective criteria using GIS techniques that will make it possible in a highly anthropized area (1) to characterize the diversity of existing landscapes, (2) to evaluate the quality and fragility of the landscape, (3) to determine the need for landscape protection, (4) to carry out a diagnosis of the landscape situation and (5) to create a methodology capable of developing appropriate information that can be incorporated into environmental assessment procedures.

2. Materials and Methods
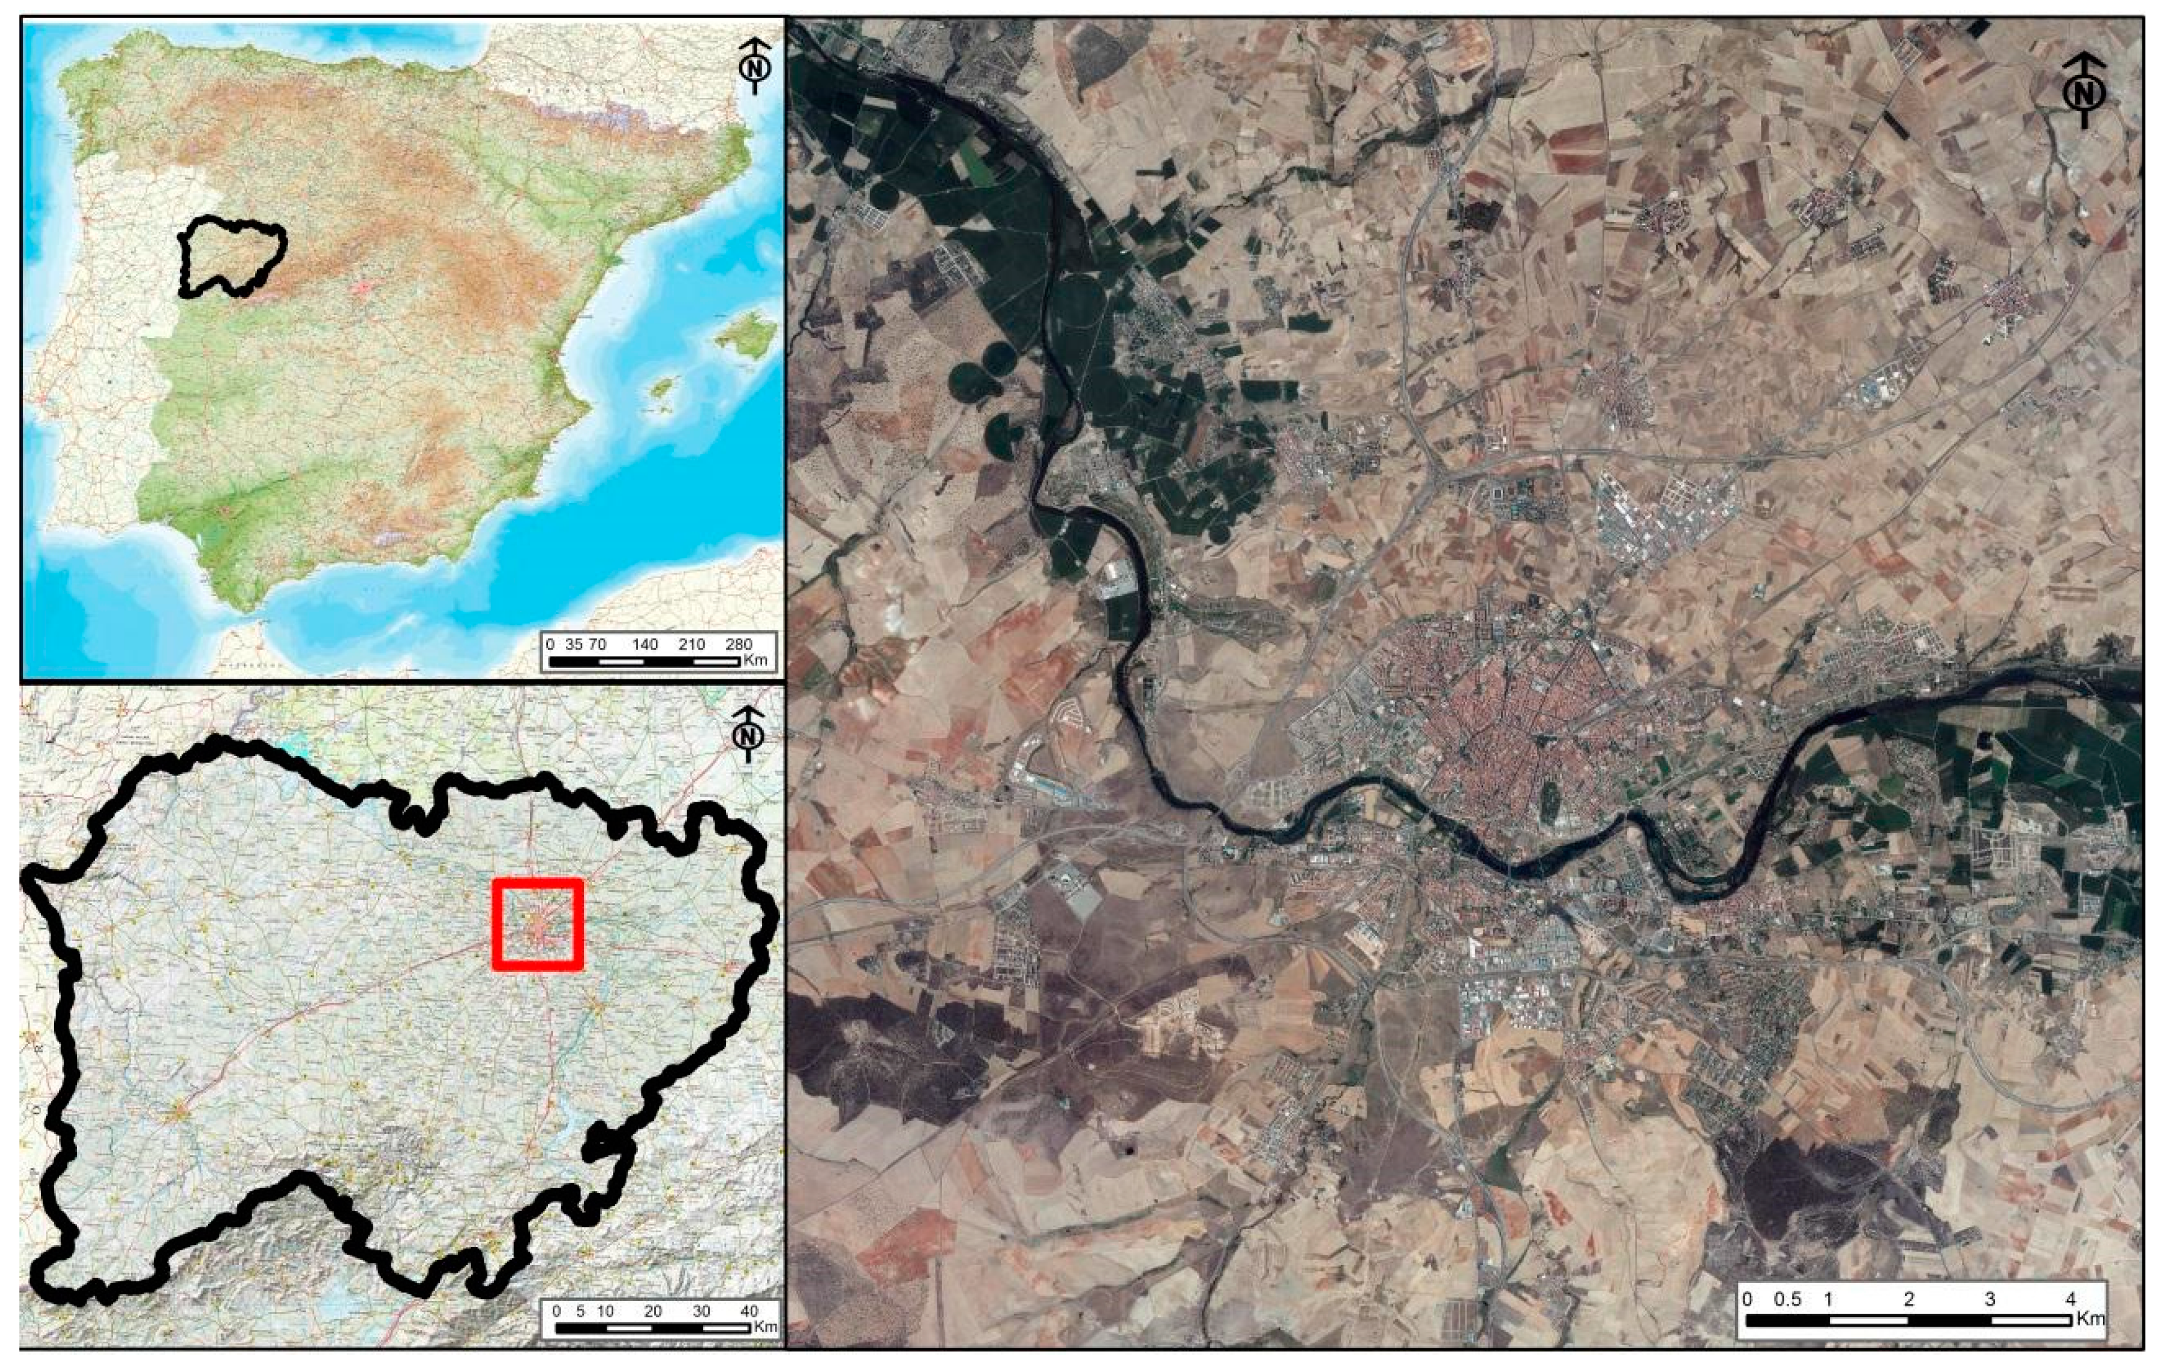
2.1. Study Area

The study area, located in central-western Spain, includes the city of Salamanca and its periurban area of influence (Figure 1), where 200,000 inhabitants live [49]. Salamanca is the capital of the province to which it gives its name and is the largest urban agglomeration in its surroundings, eminently agricultural. One of the main attractions of Salamanca is the diversity and large number of elements of historical, artistic and cultural interest that it contains, which is why its old town is listed as a UNESCO World Heritage Site [50].

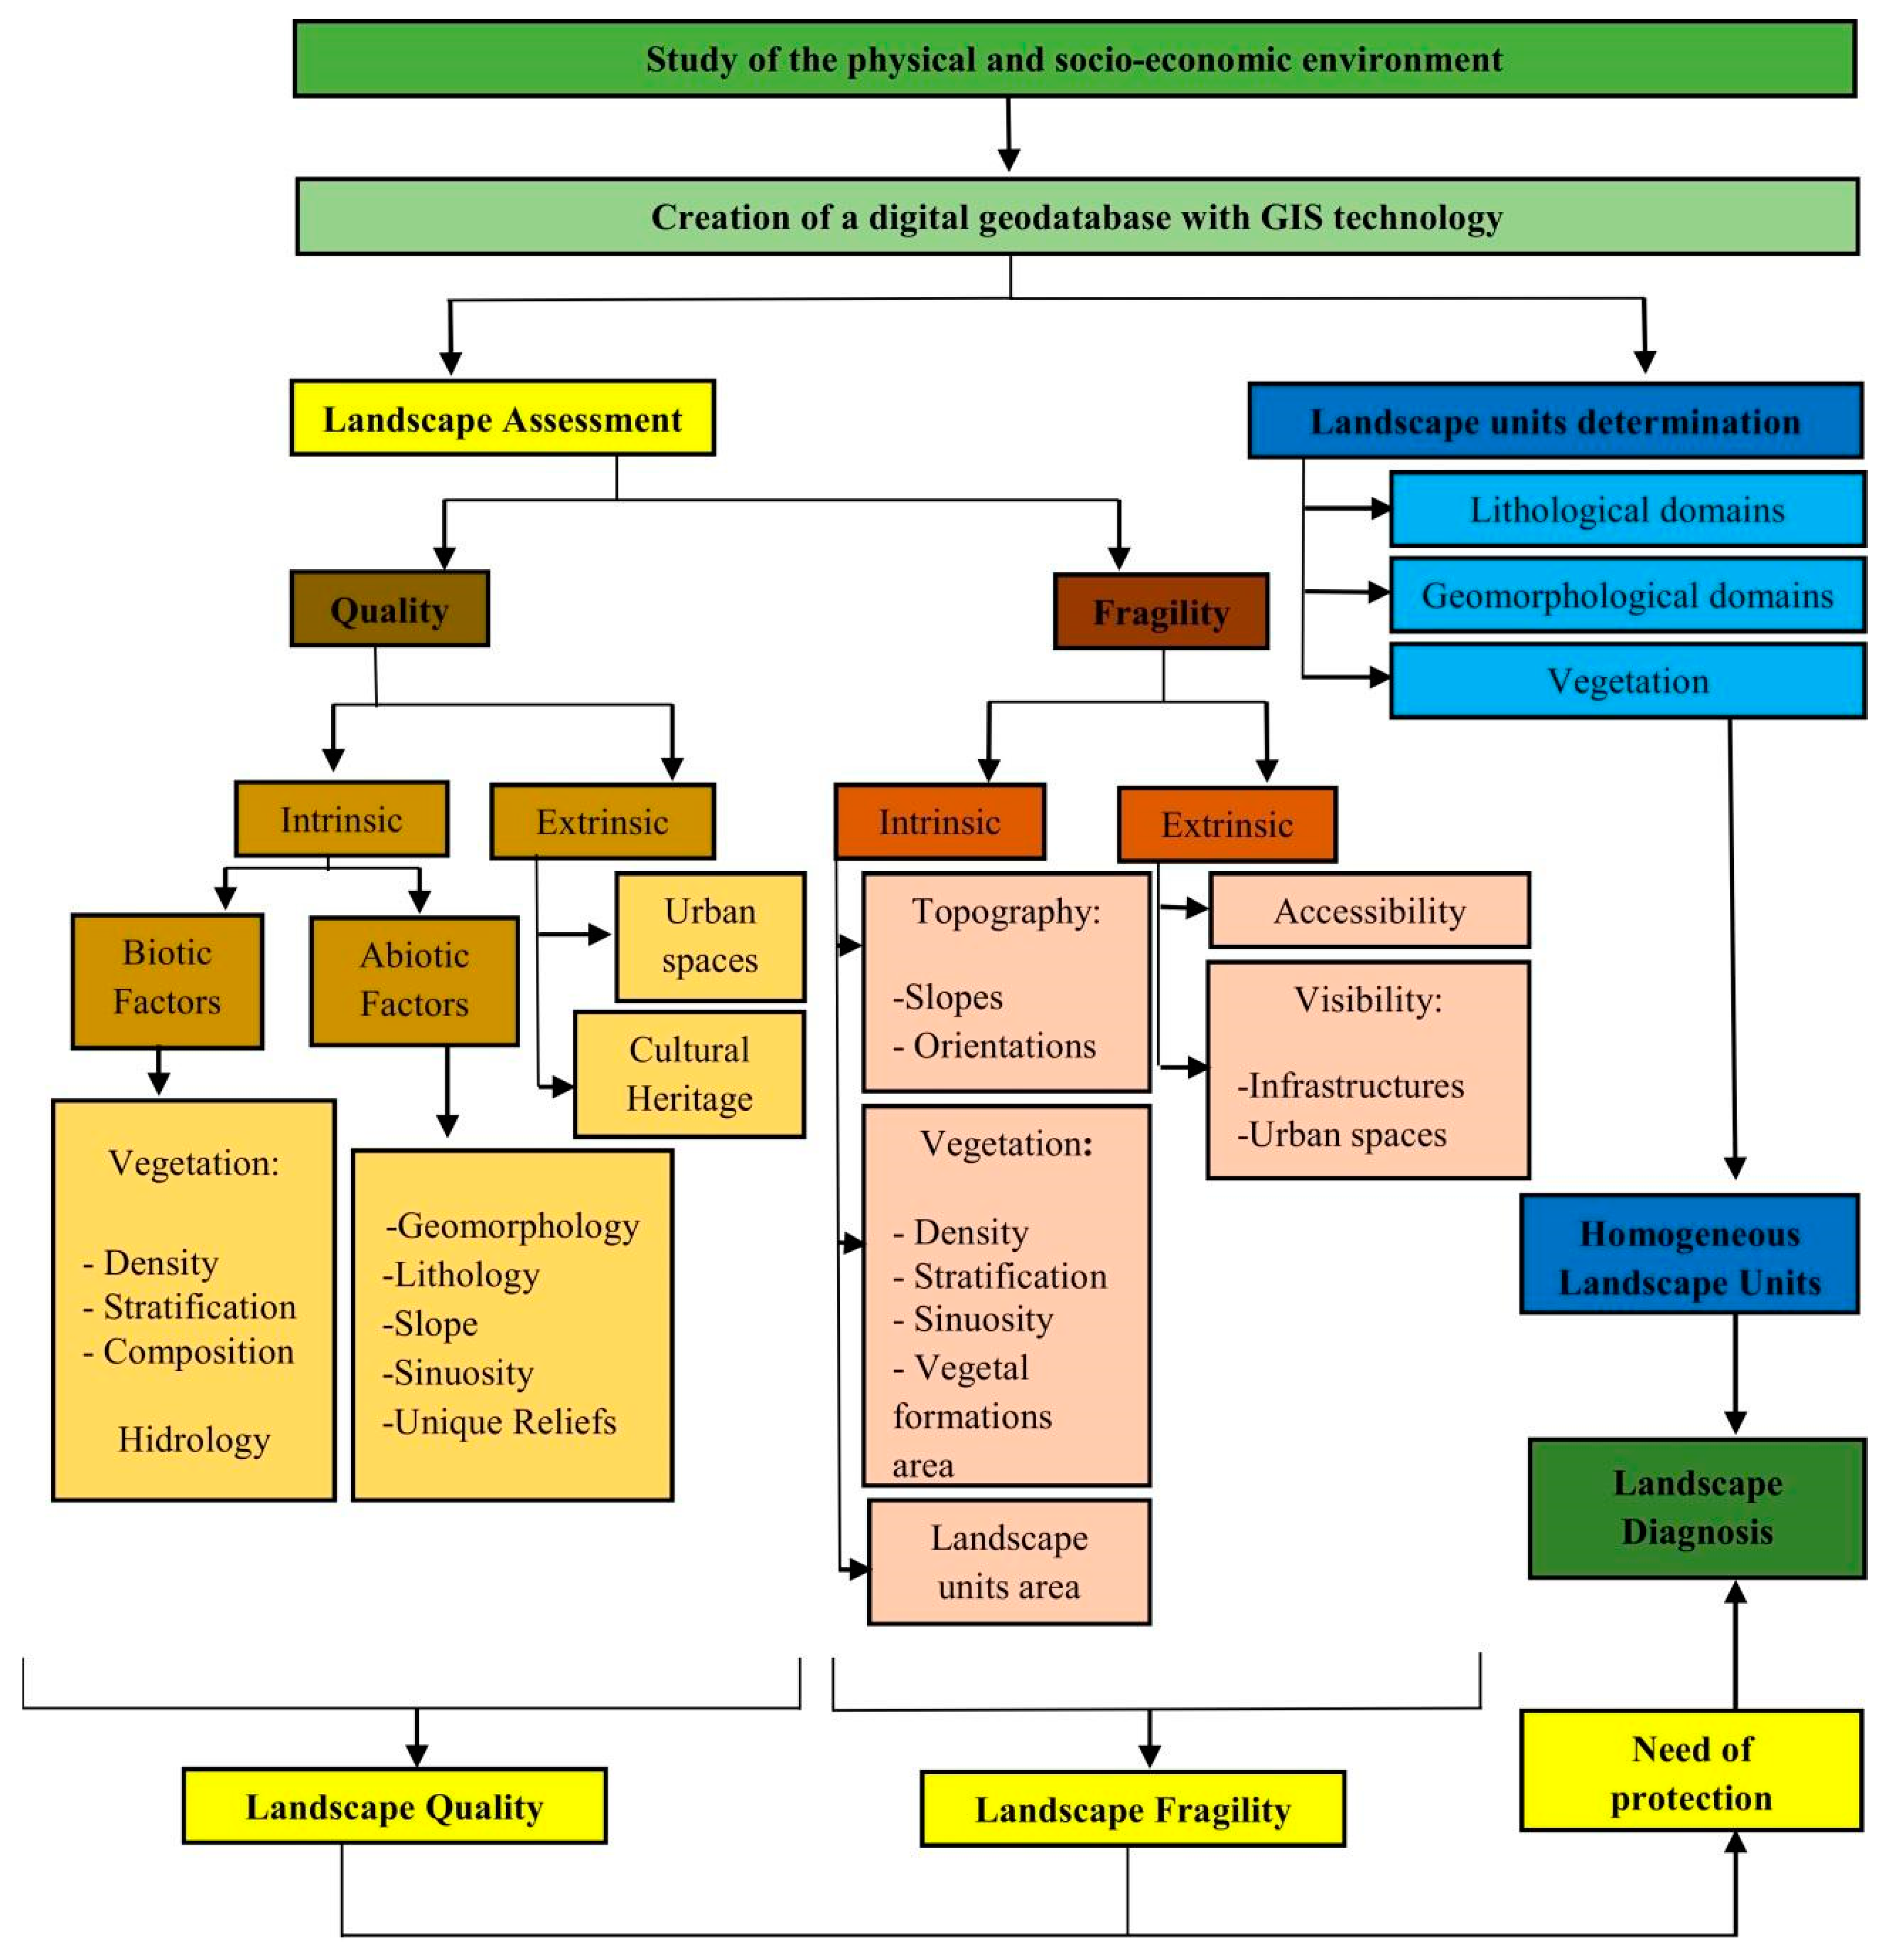
2.2. General Methodology

An indirect methodology has been followed for the study of the landscape, which allows an objective and quantitative assessment of the landscape based on the analysis of various components of the environment [38] (Figure 2). Firstly, the characteristic landscape units are defined. After this, the quality of the landscape is evaluated through the analysis of intrinsic and extrinsic quality, which consider different criteria for analysis, obtaining the quality mapping that determines the landscape value of each area. Next, the fragility of the landscape is studied in the face of possible impacts that would cause the alteration of its conditions through intrinsic and extrinsic fragility. Finally, the areas are classified according to the need for protection they present in each place and, superimposing this on the distribution of the landscape units, a landscape diagnosis can be made of each one of them.
In order to characterize all the parameters analyzed in the landscape assessment, a digital geodatabase was created using GIS, which is based on the study of the physical and socioeconomic environment carried out in the study sector.

2.3. Landscape Units Identification

The study sector was divided into homogeneous landscape units. Three factors were studied, and their combination gives rise to the homogeneous landscape units: geomorphology, lithology and vegetation/use of the soil. In the geomorphological analysis, 13 units were identified that were grouped according to their representativeness and impact on the landscape in six groups: ridges and hills, hillsides, surfaces, escarpments, terraces and valley bottoms. In the geological analysis, the different formations were grouped into lithological groups that have similar landscape effects: slates, quartzites, sandstones, tertiary red sediments, conglomerates and sands, and alluvial deposits. With respect to existing land uses, the following have been defined: wooded plant formations (holm oak and pasture), natural meadows, crops (dry and irrigated), wastelands and urbanized areas [14]. After crossing the cartography, 22 landscape units are obtained. These will be described in Section 3 of Results. The distribution of these three factors is delimited after field work using GIS techniques and, by superimposing these the homogeneous landscape units are generated. Urban areas are defined along with other land uses, in this case determined by remote sensing in previous studies [14,51].

2.4. Landscape Quality

The intrinsic and extrinsic landscape quality has been studied for its determination. An indirect methodology has been followed based on the manipulation of the geographical information elaborated and collected in the field campaign and data collection. The different parameters studied, both in the case of intrinsic and extrinsic quality, are treated with GIS techniques and by means of map algebra; by making a summation of all parameters, the intrinsic and extrinsic quality is determined. The final quality is obtained from the sum of the intrinsic and extrinsic quality values. For all cases, the resulting values are segmented into five intervals of equal range, which correspond to the quality values: very high, high, moderate, low and very low [38]. The size of the pixel was 20 m in all studied cartography.

2.4.1. Intrinsic Quality (IQ)

The IQ is the visual attraction for the observer that derives from the natural characteristics of each point in the territory [2]. Each of the abiotic and biotic parameters studied in this analysis are weighted for their determination.
The main abiotic factors are geology and geomorphology, which are key elements in the study of the landscape since they strongly condition the arrangement of the reliefs and the forms of the terrain and, therefore, they have a clear influence on the perception of the landscape in addition to conditioning the establishment and development of the biotic elements [52]. The parameters analysed to determine the impact of the abiotic factor on the intrinsic quality of the landscape are the following: geomorphological domains, slope of the terrain, sinuosity of the terrain, lithology and unique reliefs. The scores assigned to each component of these parameters are shown in Table 1. These scores are based on the field work carried out and on studies preferably analyzed in the bibliography [20,21,22,23,53,54,55,56]. The geomorphological domains are the different forms that the terrain takes as a result of the action of the forming and modeling agents of the relief. The slope evaluates how abrupt the terrain is. The sinuosity refers to the disposition that the lines of the terrain take, determining its curved character. To do this, GIS techniques are used to determine the resulting polygons between the contours and calculate their perimeter and area. Using an index that relates both parameters (sinuosity = perimeter2/area), the values of the curvature of the terrain lines are obtained, which are reclassified in equal intervals. Rough terrains, with a diversity of shapes and sinuousness, are visually very attractive. The effect that the lithological factor confers on the landscape, in addition to conditioning the forms of the terrain, is determined by the chromatism that each lithology presents (light and striking colors being more highly valued than dark and dull ones). Finally, the presence of elements with a singular imprint on the relief leads to an increase in its visual perception (lithostructural reliefs related to geological structures, such as folds or faults).
On the other hand, in relation to biotic factors, vegetation and hydrology are the main elements in the intrinsic evaluation of landscape quality [57,58], since evaluating the effect of other elements such as fauna, is an added difficulty due to their mobility. The effect of vegetation varies according to its structure; that is, how the different plant components are distributed within the formation to which they belong (it depends on the density or quantity of elements per unit of surface area and the number of strata present in each plant formation) and the composition or types of existing plant formations. On the other hand, the bodies and courses of water provide added visual and sound values when contemplating the landscape in the spaces near them.
The biotic parameters studied in the analysis of intrinsic quality are the following: density, stratification and composition in relation to the vegetation and proximity and visibility of water bodies with respect to hydrology. The plant density of a site is determined by the fractional vegetation cover (FVC) where, depending on its value, we find different plant formations, which are weighted according to their characteristics, with dense formations being more highly valued than scattered ones. Stratification refers to the variety of growths or plant strata present in each of the existing formations (herbaceous, shrub and tree) so that the more growths there are in a formation, the more diverse the forms and, therefore, the greater the quality of the landscape. The composition of the vegetation is related to the grouping of a set of related plant elements to give rise to different formations, with woodlands being more valuable than shrubs and herbaceous ones. With regard to hydrology, the visual and sound impression of water masses is limited to an environment close to them so, depending on their entity, these areas of influence must be determined by means of the GIS, being 20 m for streams, while in the case of the Tormes, due to its greater importance, an analysis of its visibility is carried out to determine from which areas it is observable and influences the perception of the landscape. The scores of each component of the parameters analyzed are located in Table 2.

2.4.2. Extrinsic Quality (EQ)

The EQ analyzes the impact that external anthropic components, such as infraestructures, have on the landscape, especially those for housing (urban centers), transport and the different elements that make up the historical, artistic and cultural heritage. First, the impact of the landscape on human settlements is assessed through a visibility analysis, which allows the identification of natural landscapes visible from urban centers. These areas are weighted with a value of 2. Secondly, the analysis of the historical, artistic and cultural heritage is carried out [59], where a total of 50 cultural heritage sites, five livestock trails and 60 archaeological sites were identified. In this analysis, livestock routes and archaeological sites (whose areas of influence, of 100 and 300 m, respectively, have been evaluated with a value of 2) have been taken into account as have the properties of cultural interest, around which an area of influence of 200 m was estimated, with these zones being assigned a value of 6.

2.5. Landscape Fragility

A procedure analogous to quality analysis has been followed for its determination, studying both intrinsic and extrinsic fragility. Using GIS techniques, a series of parameters are analyzed (related to topographical, plant and surface factors of the landscape units), whose components are weighted according to their contribution to fragility, with the final fragility being the sum of the intrinsic and extrinsic ones.

2.5.1. Intrinsic Fragility (IF)

The intrinsic fragility of the landscape has been analyzed according to the study of the parameters: slope of the land, orientation of the land, area of the landscape units, plant stratification, plant density, extension of the plant units and sinuosity of the vegetation [38]. Table 3 includes the weights of the parameters. In relation to the slope, the areas with high values are more fragile, since an alteration of the existing conditions and forms will have a great impact on the valuation of the landscape. On the other hand, the perception of the impacts related to the orientation or spatial arrangement of the elements is due to the way in which the light falls on it, so that the most fragile areas are the most illuminated (sunny), while the shady areas present shadows and are protected from direct solar exposure on a large number of occasions. The average situations are the east and west exposures, although these considerations must take into account the variations in sunshine that occur throughout the year due to the movement of the Earth. With regard to vegetation, stratification can be related to plant diversity, so that the most vulnerable areas will be those with little diversity (fewer layers). The plant density allows for better cushioning of impacts as there is a greater number of specimens, so the areas with lower density will be the most fragile. The surface area of a plant mass also has an impact on the fragility values, since the smaller the surface area, the greater the emphasis on impact and, therefore, the greater the fragility. With regard to the sinuosity of the vegetation, the aim is to evaluate its forms and, especially, to evaluate the edge effect, since it is in these external areas of the plant mass that the impacts are most visible, so that the greater the sinuosity, the greater the fragility. Finally, the extension of each landscape unit is important in order to evaluate its fragility, since units with a small surface area will be more sensitive to impacts than those with a larger surface area. The extension (ha) of each unit has been calculated and, depending on its contribution to the total surface area studied, it is weighted with values ranging from 0 for the largest units to 8 for those with a smaller surface area.

2.5.2. Extrinsic Fragility (EF)

The determination of the extrinsic fragility of the landscape is based on the study of two parameters: accessibility and visibility. Accessibility to each point of the sector is analyzed on the basis of its proximity to urban centers and linear infrastructures, as these areas have better access and, therefore, greater fragility to new impacts. The GIS has calculated an area of influence of 500 m around the urban centers and infrastructures and has assigned them a value of fragility of 4, while the sectors of worse accessibility receive a value of 0. On the other hand, the visibility of the environment is calculated from the places with the greatest transit of people (municipalities and main infrastructures) and, therefore, where the greatest observations are made. The GIS has identified, by calculating visual basins, those places in the territory where the impacts or alterations would be most visible as they are highly exposed to places with high traffic, with the most visible areas showing high values of fragility (value 4) compared to the low fragility represented by the less exposed areas (value 0).

2.6. Landscape Need of Protection

Each sector studied has been assigned a type of protection class, from one to five, depending on the quality and fragility values it presents, confronted in a double-entry matrix (Table 4), so that class one represents the areas with the greatest absorption capacity and, therefore, the least need for protection, while class five represents the areas most susceptible to alteration and therefore requiring conservation efforts.

2.7. Landscape Diagnosis

The landscape diagnosis consists of an evaluation of the landscape situation in each of the identified landscape units. Using GIS techniques, the quality, fragility and need for protection cartography is superimposed on the mapping of landscape units and the extension (ha) and percentage (%) of each degree (very high, high, moderate, low and very low) of quality, fragility or need for protection in each unit is determined.

3. Results

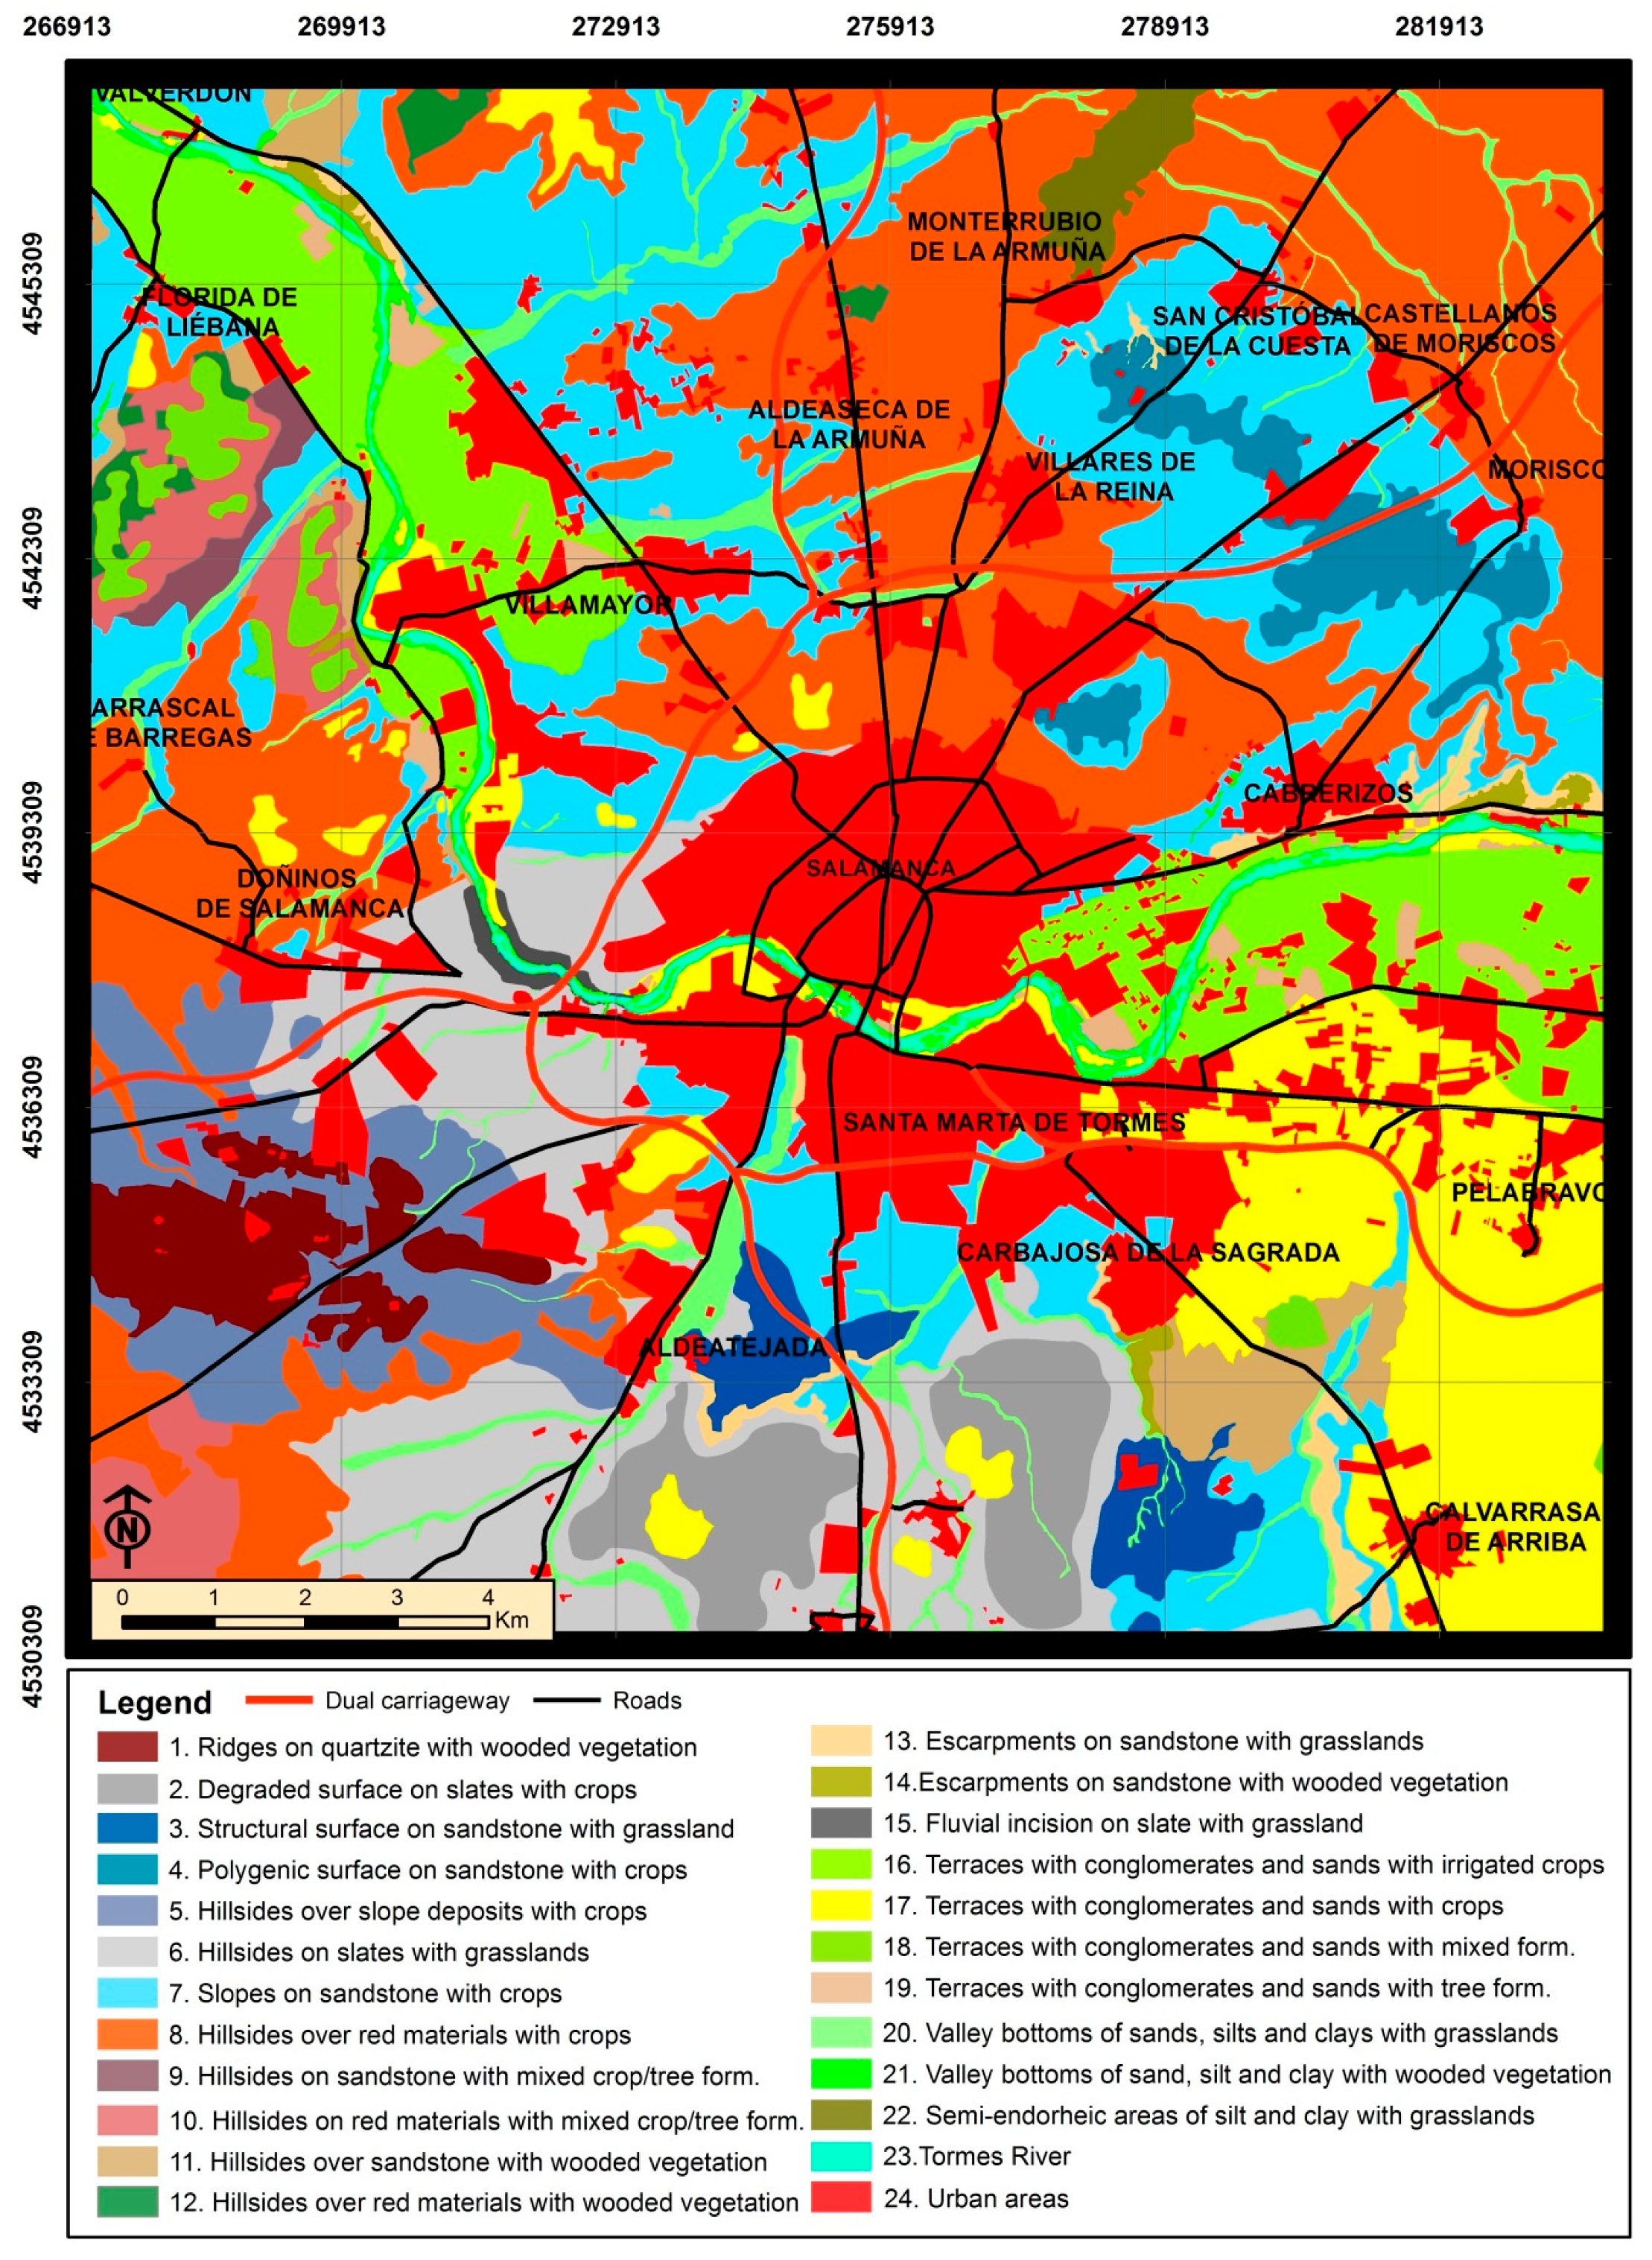
3.1. Landscape Units

After crossing the cartography of geomorphology, lithology, land use and urban areas (Figure 3), 24 landscape units are obtained (Table 5) along with their distribution, which is presented next to that of the urban nucleuses (Figure 4). Due to these common characteristics of the spaces belonging to the same unit, which in turn are distinguished from the rest of the units, they allow the landscape units to be used as land management units in the territorial planning processes.

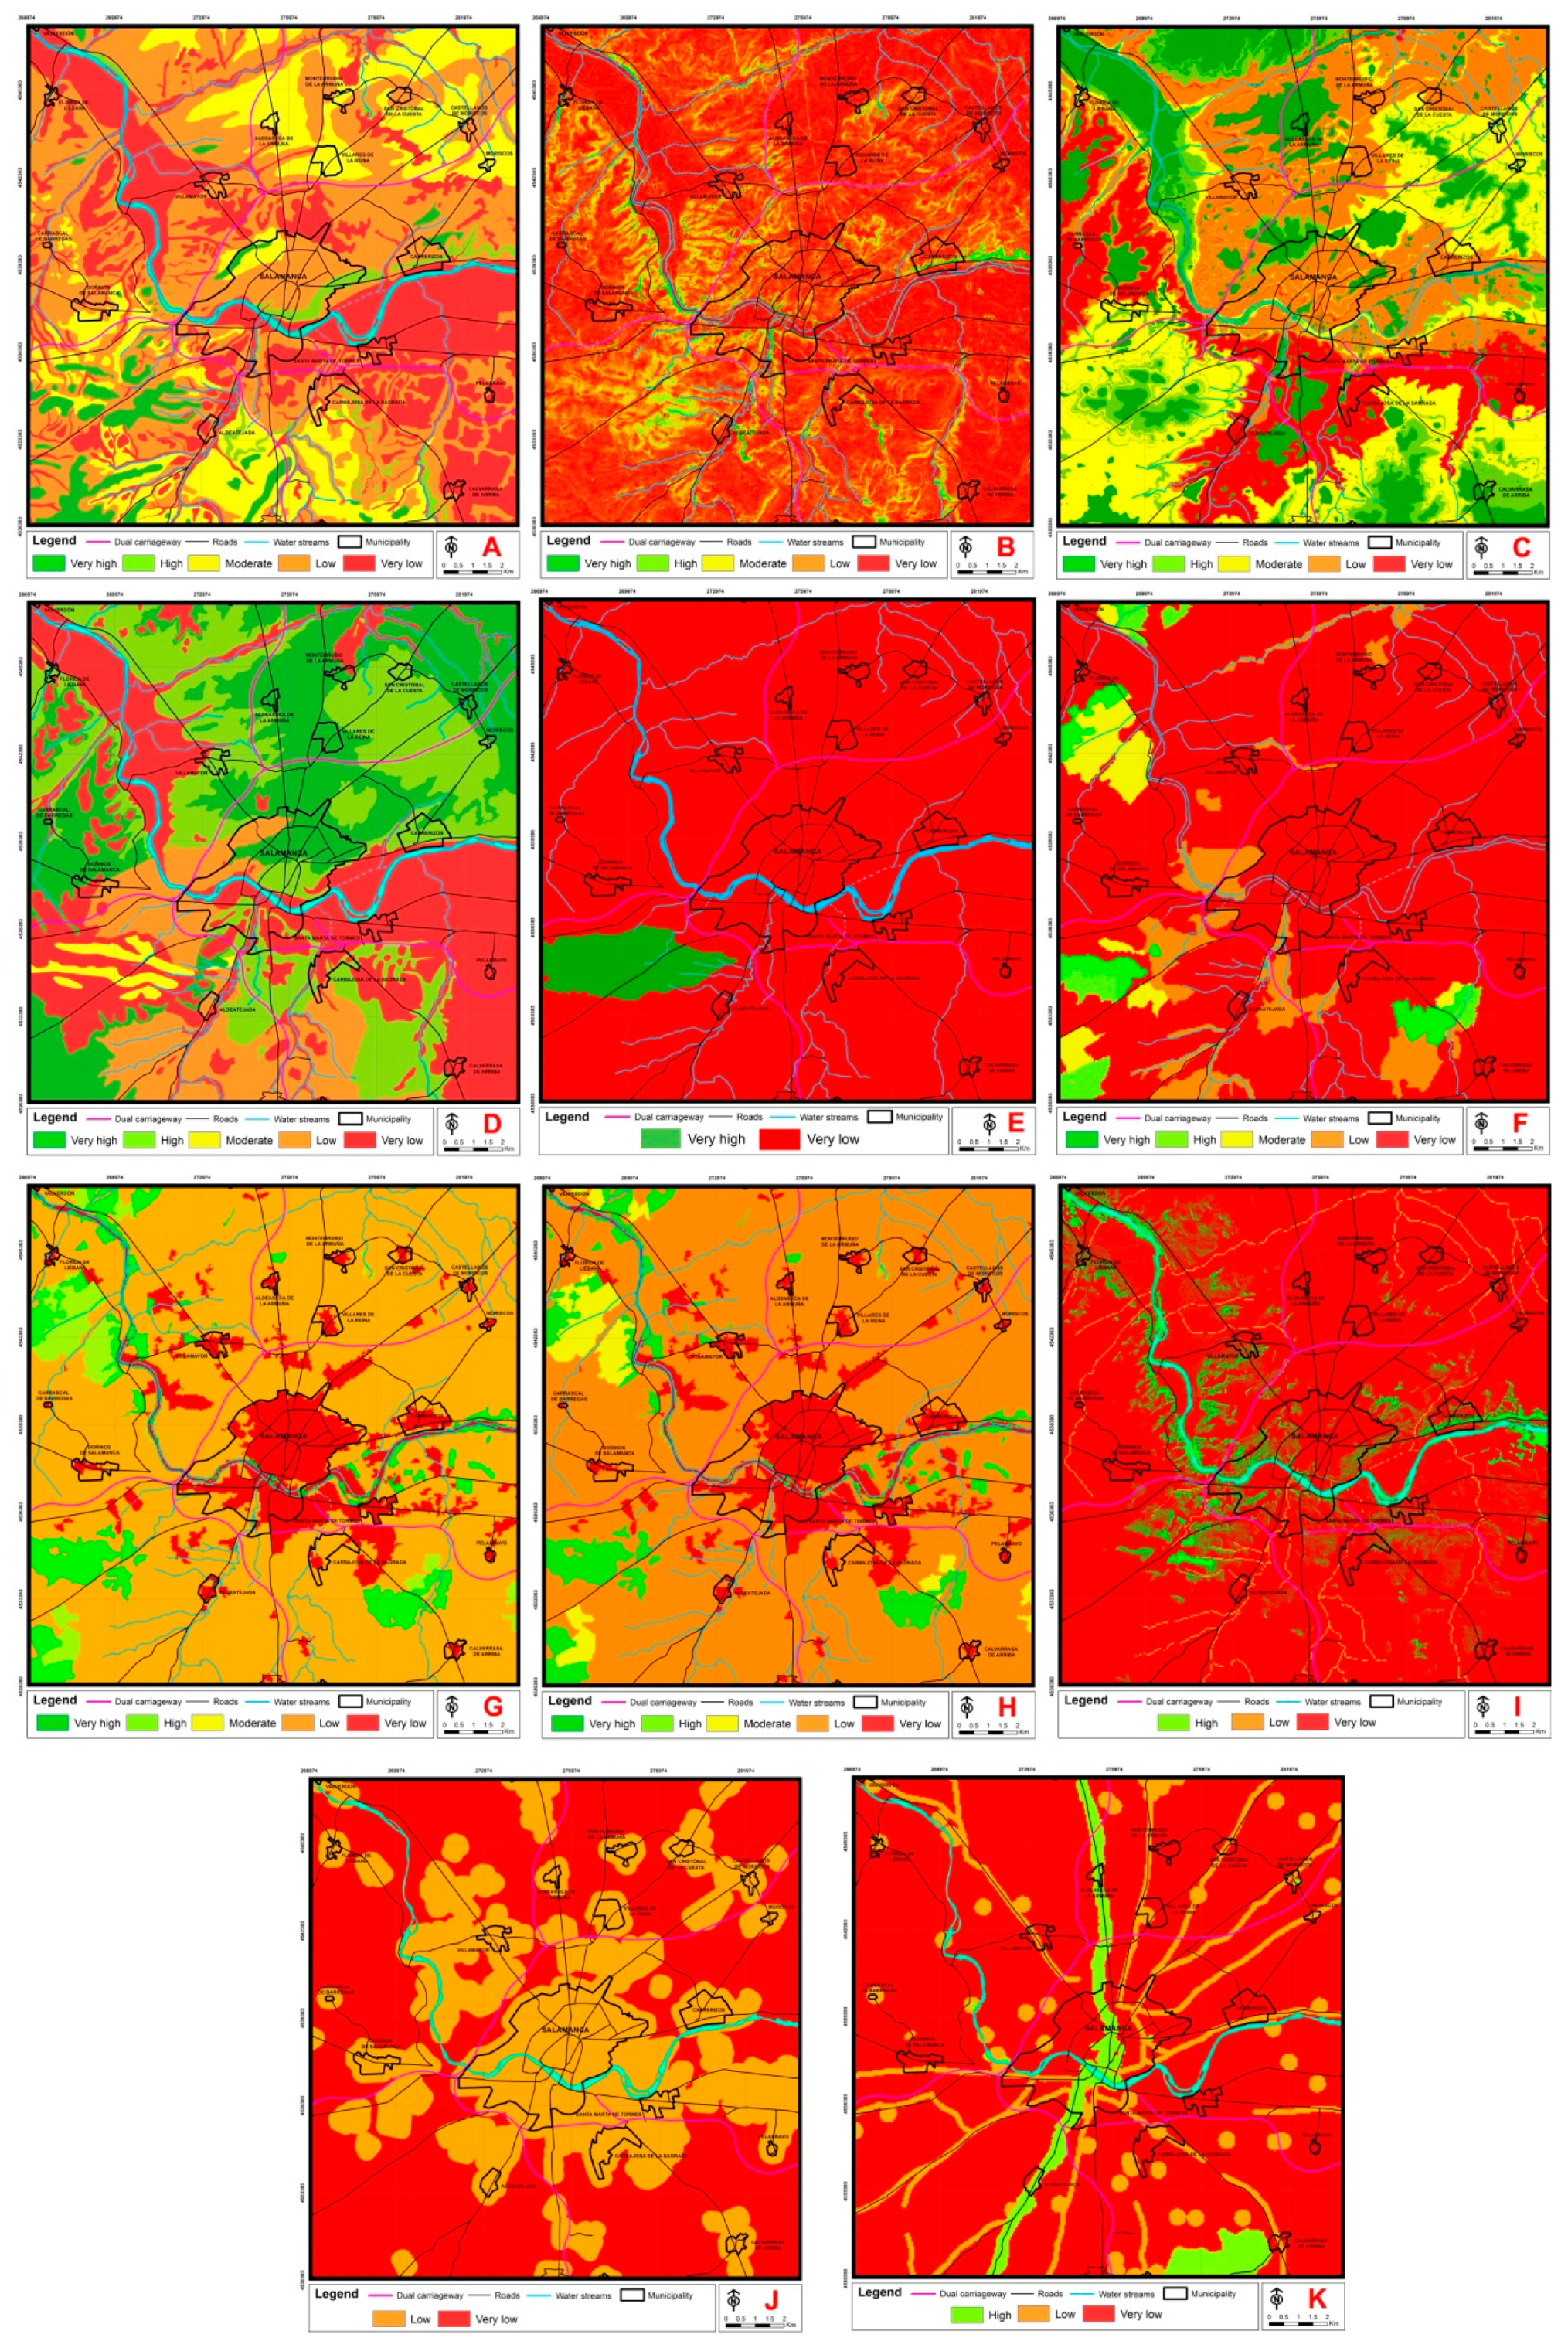
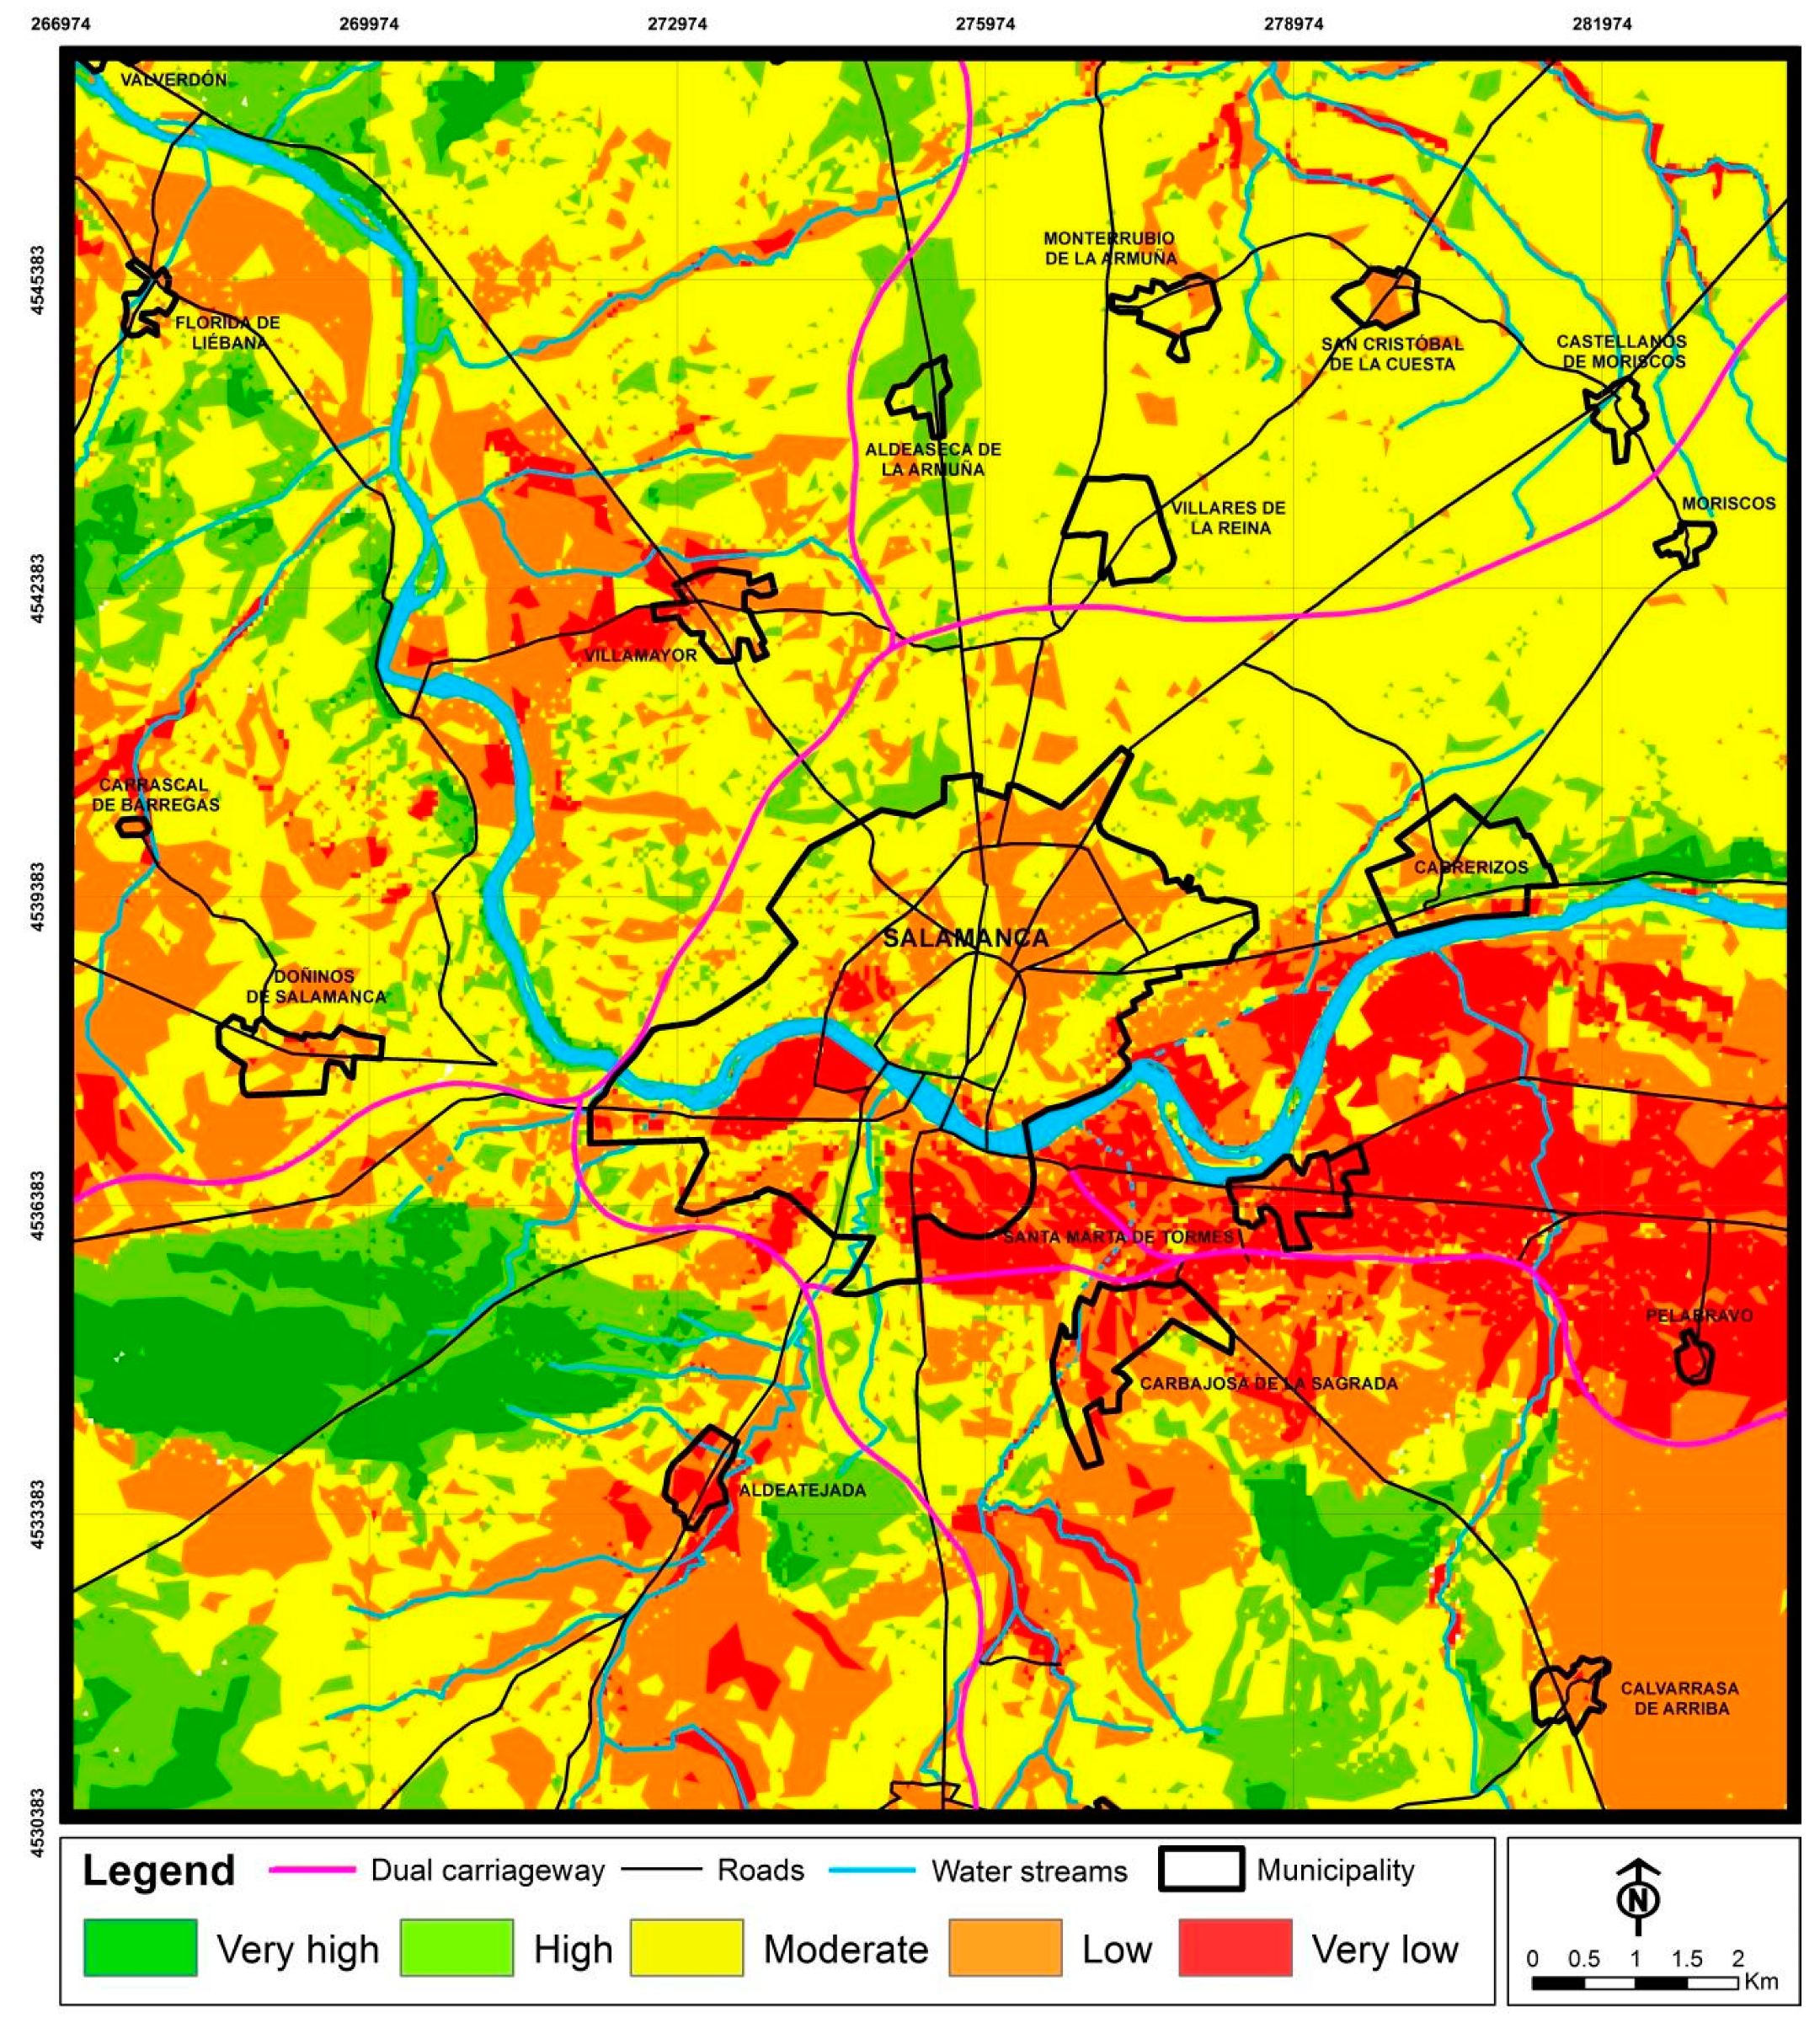
3.2. Landscape Quality

After mapping the weighting of the parameters studied for the determination of intrinsic and extrinsic quality (Figure 5), they are added up to obtain the intrinsic and extrinsic quality, from which the final landscape quality is obtained (Figure 6). The areas of very high quality correspond to the most outstanding geological and geomorphological elements as well as to the most diverse and striking reliefs of the environment, such as in the area of Los Montalvos (southwestern sector of the study area), escarpments along the Tormes and forest areas irregularly distributed throughout the sector. The high-quality areas present a diversity of forms and are usually spaces surrounding the higher quality areas. Therefore, they appear in the southwestern sector, the central-southern sector and the northwestern quadrant, linked to large slopes and spaces with morphological highlights, where forest ecosystems generally appear. The areas of moderate quality cover a large part of the sector studied, mainly occupying the northeast quadrant, although they also appear in the rest of the sector although to a lesser extent the further south. The low-quality areas appear to be mainly linked to the dynamics of the Tormes (the whole of the river plain and the terrace sectors of the south-eastern quadrant) and are also represented in areas of the southwestern sector in undulating slate and red materials. The very low-quality areas are mostly concentrated in the eastern sector of the area studied, coinciding with very monotonous terrace spaces that have undergone a high level of urban development in recent years, their presence being anecdotal in the rest of the sector.

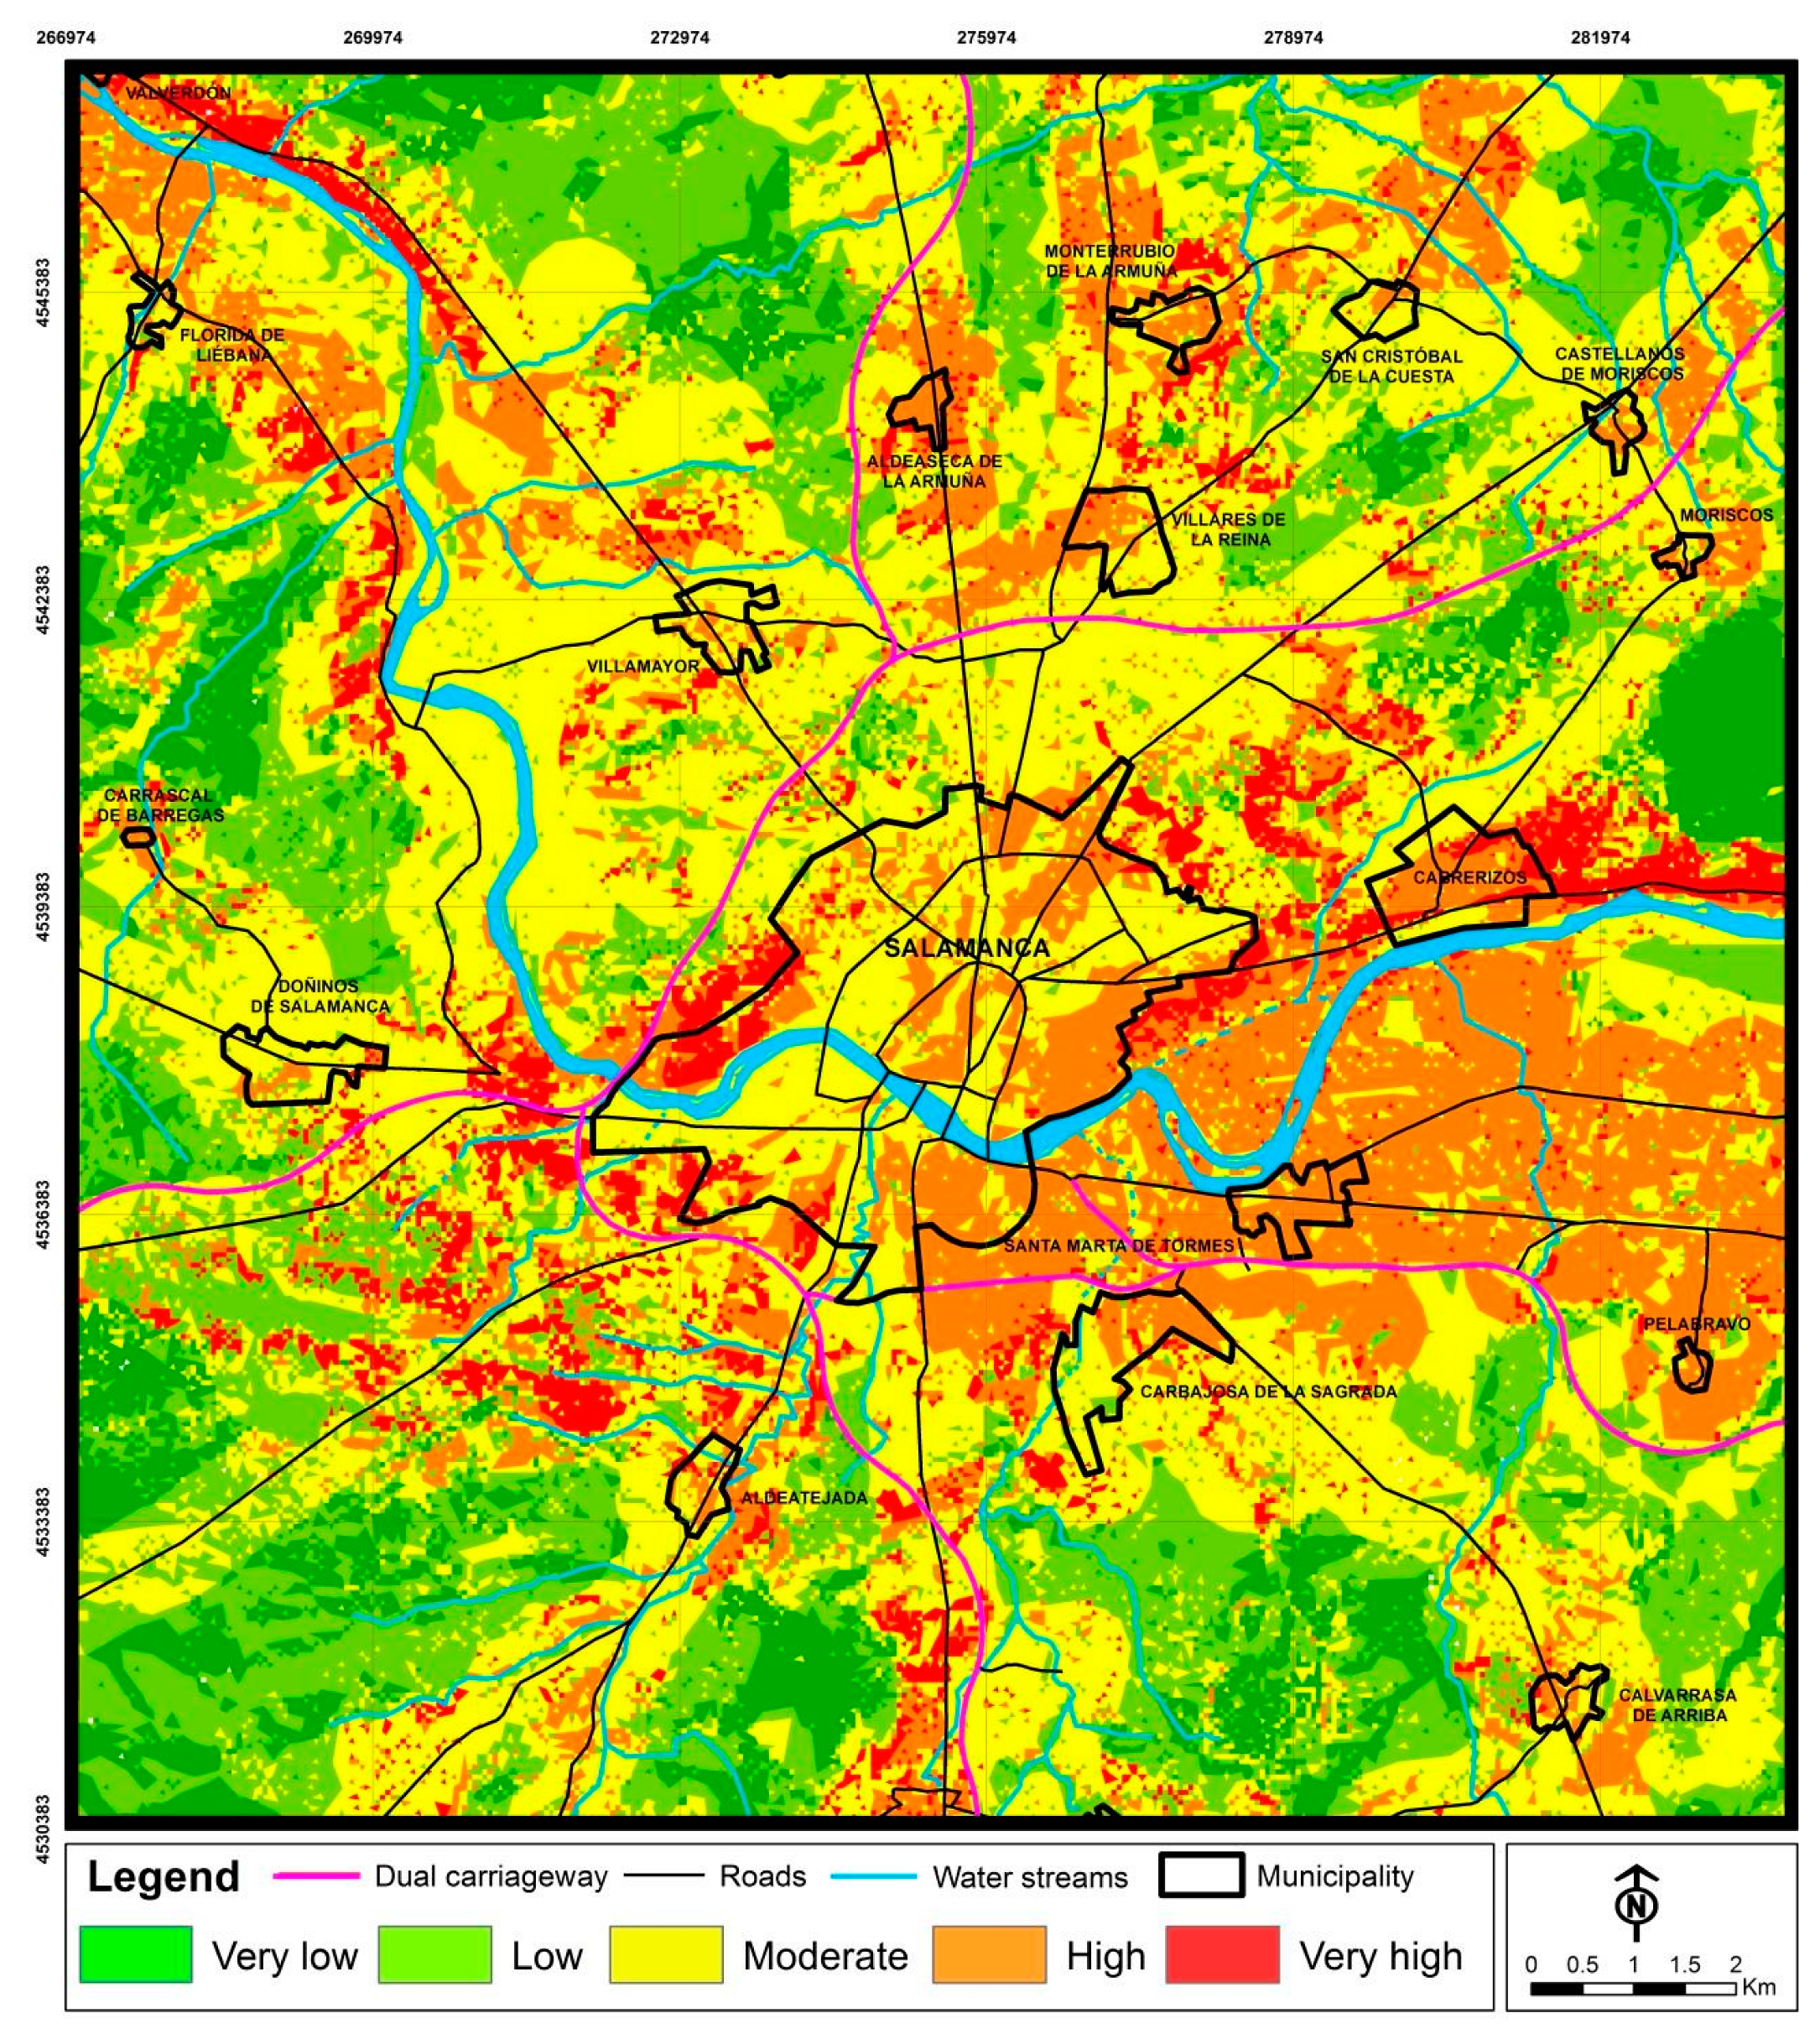
3.3. Landscape Fragility

After carrying out the mapping related to the weighting of the parameters studied for the determination of intrinsic and extrinsic fragility (Figure 7), the sum of these parameters is elaborated to obtain the intrinsic and extrinsic fragility, from which the final landscape fragility is obtained (Figure 8). The areas of very high fragility generally extend over the most abrupt areas and those that have wooded vegetation, usually corresponding, in turn, to landscape units of scarce extension. The areas of high fragility stand out in the eastern sector, characterized by high anthropization, with a large number of buildings and infrastructures as well as a reduced plant diversity. The areas of moderate fragility cover large areas of the sector studied, especially around Salamanca, and seem to be related to accessibility and visibility from the linear infrastructures. The areas of low and very low fragility correspond to the most inaccessible areas and generally have an important diversity and plant cover, being present in the sectors furthest from Salamanca.

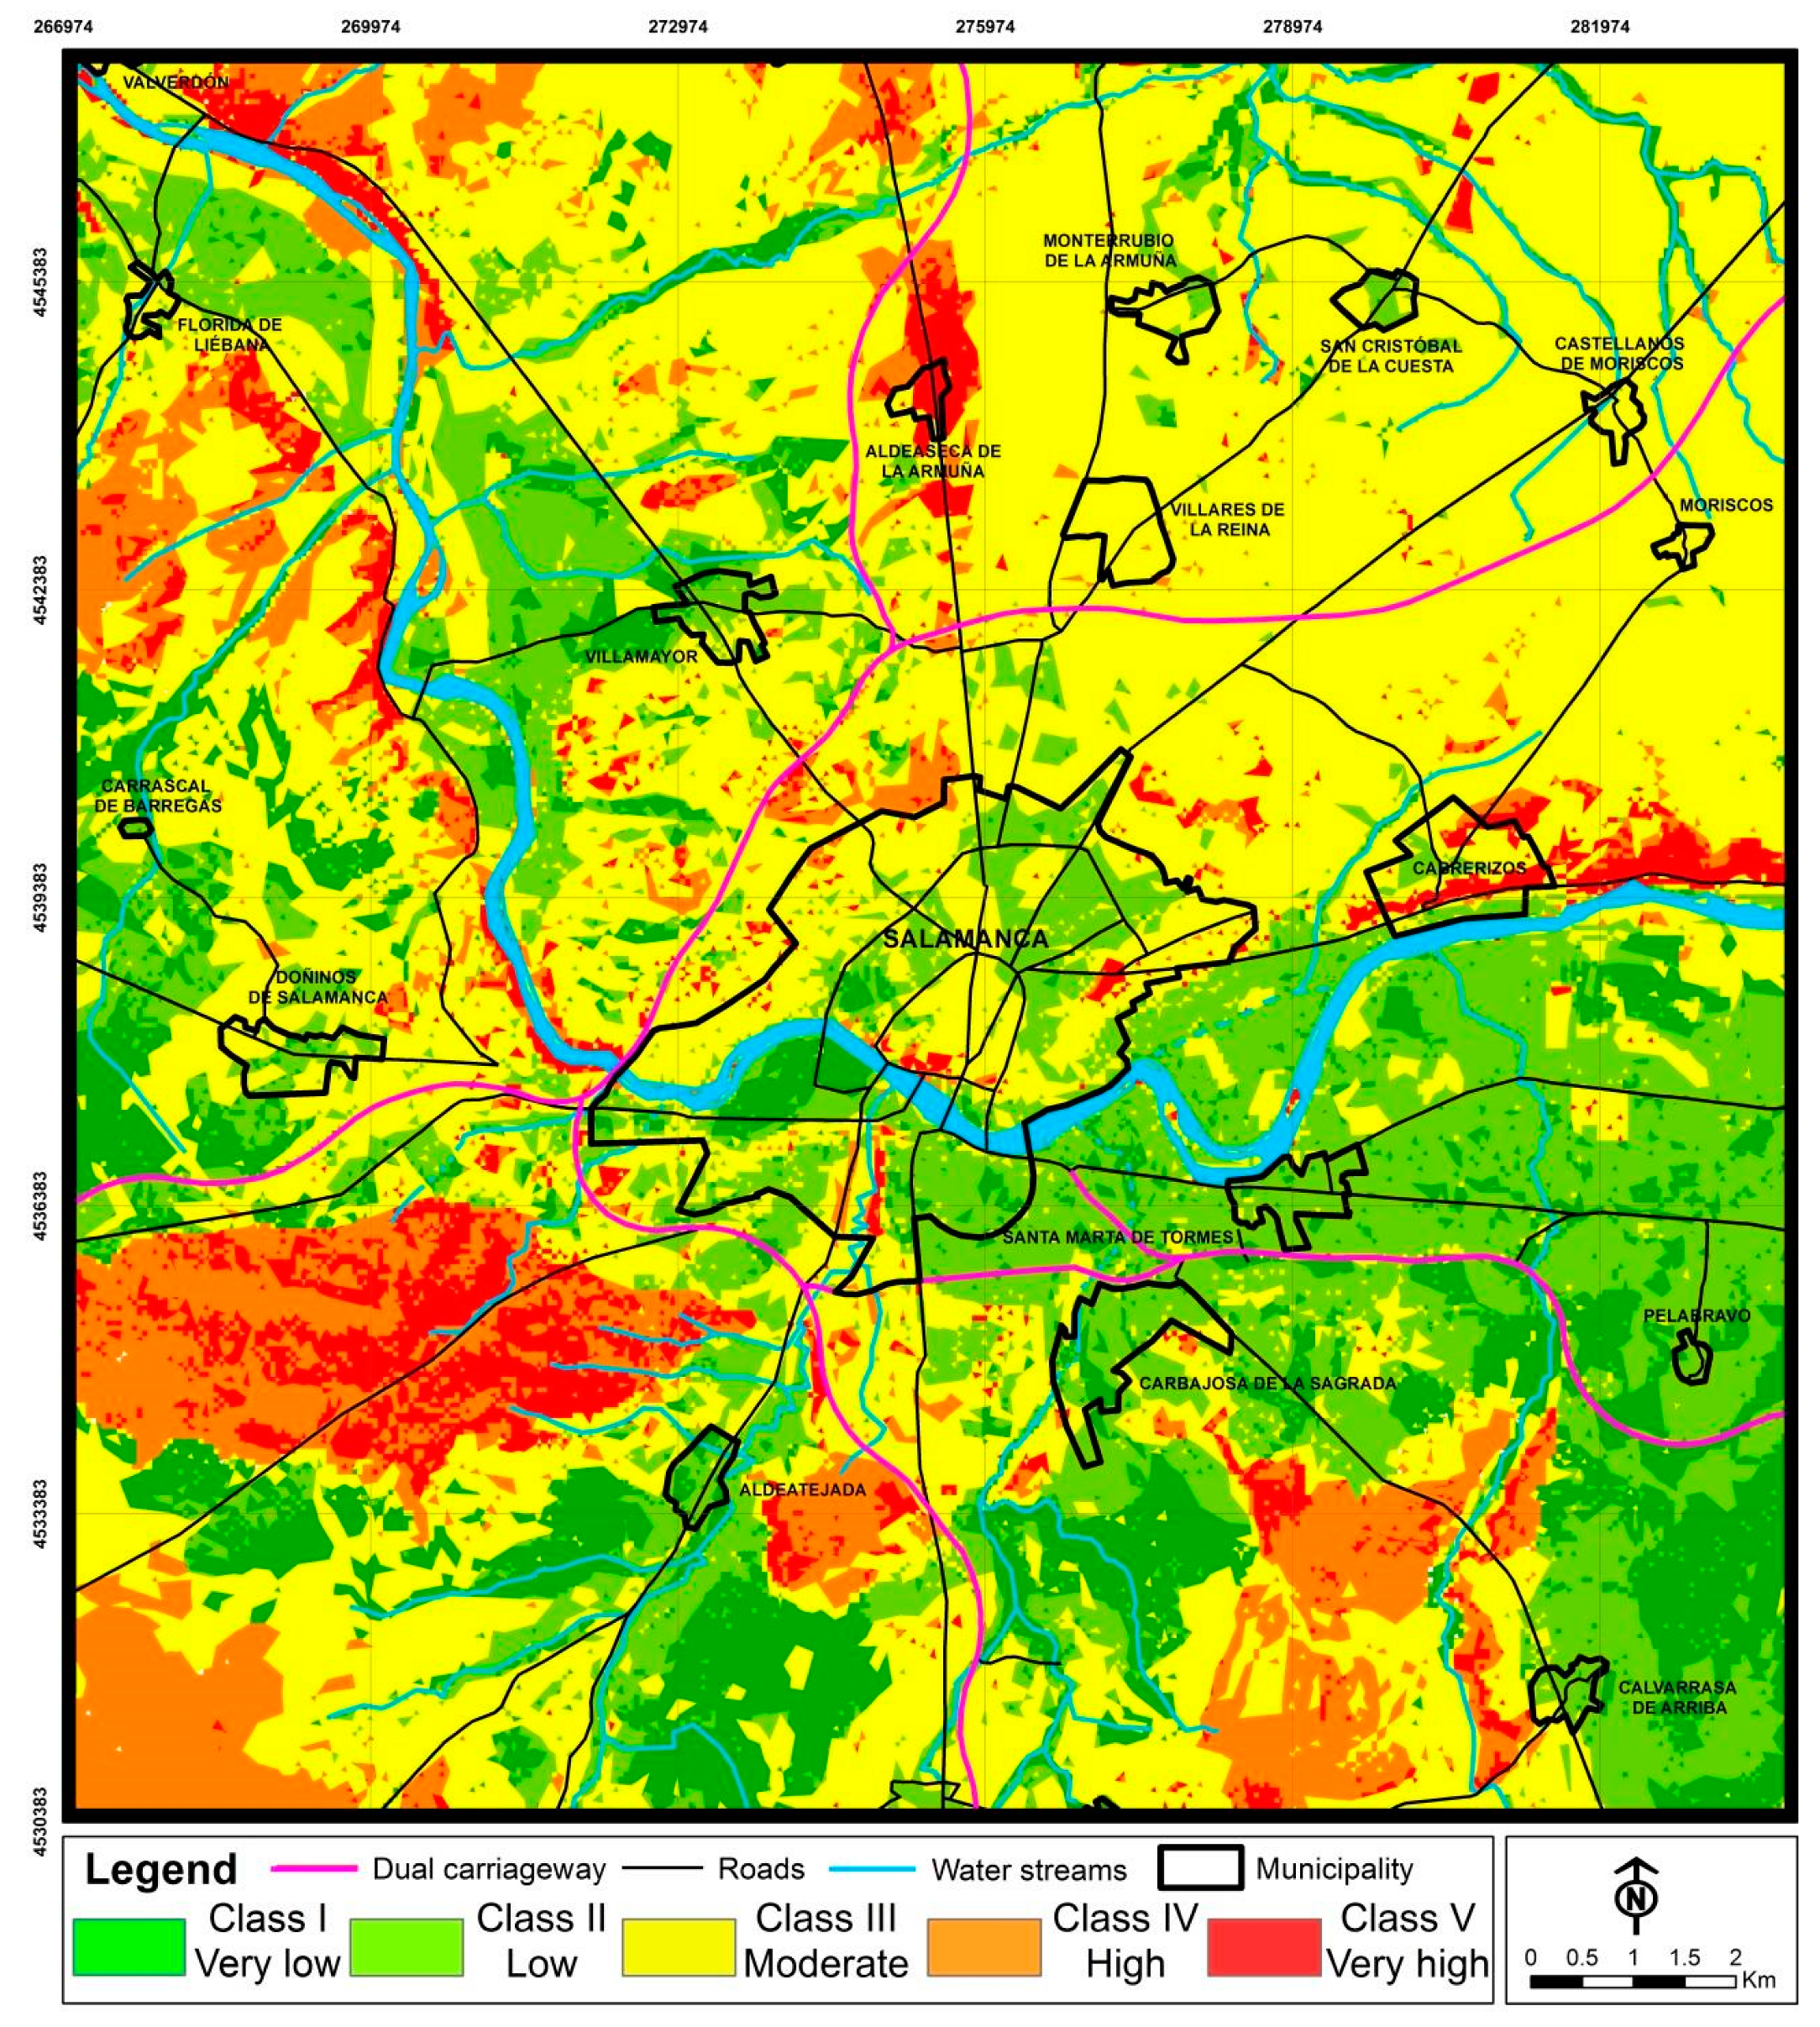
3.4. Landscape Need of Protection

From the fragility and quality of the landscape, the need for landscape protection in each sector is obtained (Figure 9). Classes I and II areas are representative of the least valued landscapes, in which the implementation of different activities would not produce a significant impact. They are identified as being linked to the dynamics of the Tormes, which is very frequent throughout the floodplain, as well as in the terrace systems, mainly in the southeastern sector of the area, with its appearance being more dispersed throughout other parts of the sector. On the other hand, the areas most vulnerable to impacts related to the alteration of the landscape are those belonging to Classes IV and V which need protection measures to conserve the most valuable landscapes of the environment. This includes landscapes linked to river escarpments, to the reliefs of Los Montalvos (southwestern sector) or to areas with well-conserved tree vegetation, preserved in areas far from the city of Salamanca. Finally, a large part of the sector is classified as Class III, indicating that no urgent or priority conservation measures are required. It is mainly distributed in the northern half and around the capital, although there are also areas irregularly distributed throughout the rest of the study area.

3.5. Landscape Diagnosis

Table 6 summarizes the percentage (%) for each landscape unit that is related to each of the degrees of quality, fragility and need for protection. In relation to landscape quality, the units with the highest quality values are 1 and 14, which correspond to the greatest slopes and tree-lined plant formations. Units with high quality are those with diverse orography and generally tree-lined vegetation, as is the case with units 3, 9, 10, 11, 12 and 13. The moderate quality level is characteristic of most landscape units. With regard to fragility, units 13, 14 and 15 show the highest values due to the fact that they group together the most abrupt spaces in the sector, although high and very high values are not common in general. Moderate fragility is predominant in the majority of landscape units, with lower values appearing in units with a greater diversity of forms and especially important tree formations (units 1, 2, 3, 4, 10, 11 and 12). As regards protection needs, they are very high mainly in units 1, 11 and 12, which group together the main forests in the area. With high needs are other units of scarce entity but of varied forms and rich in vegetation (units 3 and 10). Units 2, 16, 17 and 20 have low and very low protection needs and correspond to monotonous landscapes characterized by soft or flat carved forms. The remaining units clearly present intermediate protection requirements, in line with the results obtained from the analysis of quality and fragility.

4. Discussion

The high diversity of environmental elements, and their synergies, make it very difficult to analyze the landscape, especially in such dynamic environments as periurban ones. Therefore, it is necessary to develop methods to manage this high amount of information. On the other hand, the numerous approaches that have been given to the landscape resource caused the appearance of multiple interpretations of it. It is therefore necessary that current methodologies address common criteria in the approach to analysis, with the European Landscape Convention serving as the basic starting framework. The search for quantitative interpretations of the landscape must also be a requirement when developing new methodologies, so that these results can be incorporated into territorial planning.
The proposed model allows for an objective assessment of the landscape through the implementation of rapid, low-cost parametric mapping using GIS, a widely used tool for landscape analysis [34,35,38,44]. The development of a digital geodatabase with the analyzed data allows their weighting and processing with GIS techniques, allowing the automation of the process and its implementation in other places. In addition, the objectives of the European Landscape Convention are achieved as it allows the identification of landscape units and the analysis of landscape quality, as well as identifying pressures for change. Also, complementary analyses of vulnerability and landscape protection needs are incorporated, which are very valuable in the planning and decision-making processes, and which finally allow a diagnosis of the situation to be made. Using direct methods, the divisions made for each landscape unit can be corroborated and validated in the field. This can also serve to validate the analysis of landscape quality, although the diversity and conditions of observers may appear as limitations. On the other hand, the limitations of the methodology derive from its lesser capacity to value urban landscapes to the detriment of taking into consideration the natural and seminatural landscapes of periurban areas. Likewise, the methodology aims to obtain information of a markedly environmental nature, which allows it to be used in the decision-making stages, which perhaps partly underestimates the perceptive component of the landscape. Furthermore, for the methodological development, part of the subjective information derived from the authors’ assessments and scores is also assumed. In relation to this, the preferences of the population established from landscape studies were also incorporated, although this information is considered intrinsically objective as it is representative of large groups surveyed. In addition, the methodology does not promote direct citizen participation, an aspect included in other papers [60].The determination and evaluation of landscape units allowed the identification of areas of landscape interest. Through the quality evaluation, the areas of greatest landscape value were identified, which coincided with the spaces of greatest natural interest in the area, in line with what has been observed by other authors in Spain [61], which may correspond to the general high degree of anthropization of the sector, dominated by agriculture. In addition, these areas of higher quality were identified mainly on the edges of the area studied, far from the city of Salamanca and areas of greater influence, which can be linked to rural spaces where urban pressures have been lower and allowed for landscape conservation.
On the other hand, the vulnerability of landscapes must be taken into account when deciding whether or not to install a specific activity in a given landscape. This aspect is particularly relevant in urban and periurban areas due to the greater speed and diversity of pressures in these areas, with urban expansion being the main pressure on the landscape in and around Salamanca, as shown by the increase of almost 600% in the built area in the period 1956–2018 [14]. In addition, the installation of new industries and the construction of new infrastructures were also identified as important alterations to the landscape in Salamanca and its surroundings. Agricultural practices (crop and fallow land rotation, transformation of agricultural patches, etc.) and the management of natural ecosystems in the surroundings (forest treatments and agro-livestock practices) also have importance in the dynamics of the landscape. Due to the magnitude and speed of transformations in the urban environment [62], it is necessary to establish the protection needs of each type of landscape, which varies according to the capacity of the landscape to cushion the impact that an activity in question would produce. These conservation recommendations are necessary tools that can be incorporated into planning processes [35]. Furthermore, the cross-checking of this mapping of recommendations with that of landscape units allows a diagnosis of the landscape situation to be made. The main contribution of this diagnosis is that it makes it possible to quantify the landscape characteristics of each unit, so that comparisons and discriminations can be made between units that could be qualitatively identical. Therefore, it provides more precise and concrete results that would contribute a greater amount of information to the planning process, facilitating decision making, in line with other multicriteria landscape research [34,35,38]. Furthermore, the use of these homogeneous landscape units as territorial planning units is proposed since, due to their unique and singular characteristics they present clearly identifiable vocational uses of the territory [39].

5. Conclusions

The various landscape units determined by this method can be interpreted as territorial sectors with similar characteristics due to the many constraints they share. At present, environmental assessment procedures require analyses of the quality and fragility of the different entities or sectors of the territory. Therefore, the analysis of landscape units can be incorporated into these procedures not only to strictly determine the attributes of the landscape, but also to characterize the broad outlines of the territorial entities.
The proposed methodology objectively assesses the landscape components in accordance with the provisions of the European Landscape Convention, so its results are compatible with their incorporation into the decision-making processes.
The superimposition of landscape units on landscape assessment cartographies makes it possible to carry out a landscape diagnosis and to better specify the characterization of each landscape unit, facilitating decision-making and landscape management measures in future planning actions. It is therefore an instrument for sustainable management of the space capable of limiting the implementation of development initiatives according to the carrying capacity of the physical environment.
By means of the proposed landscape diagnosis it is possible to quantify the general state of the landscape of a sector and of the corresponding units that make it up, enabling situation, monitoring and comparative reports to be made over time. In Salamanca and the surrounding area, intermediate assessments dominate. The quality of the landscape is greater in the areas furthest from the city, coinciding with the areas of diverse orography that best conserve the natural values of the sector. Almost 20% of the study sector presented high and very high landscape quality, with a majority, however, of low (29%) and, especially, moderate quality areas (54%). In turn, the fragility shows a more irregular distribution, tending to show higher values in areas of unevenness and those close to urban areas and roads. The spaces of low and moderate fragility are predominant (37% and 42% respectively) over the spaces of high landscape fragility (21%). Finally, high protection needs are restricted to the most environmentally and scenically valuable units, although they occupy scarce extensions (17% of the territory) in comparison to those that do not require conservation measures (12% and 17% for very low and low requirements, respectively), with those in need of intermediate protection being the majority (54% of the territory).

Author Contributions

Conceptualization, M.C. and A.M.-G.; methodology, M.C. and A.M.-G.; software, M.C.; validation, M.C. and F.S.-F.; formal analysis, M.C.; investigation, M.C. and A.M.-G.; resources, M.C. and L.M.; data curation, M.C.; writing—original draft preparation, M.C. and A.M.-G.; writing—review and editing, M.C. and F.S.-F.; visualization, M.C.; supervision, A.M.-G and F.S.-F.; project administration, A.M.-G. All authors have read and agreed to the published version of the manuscript.

Funding

This research was funded by projects Junta Castilla y León SA044G18 and the GEAPAGE research group has participated.

Conflicts of Interest

The authors declare no conflict of interest.

References

  1. European Landscape Convention. “Council of Europe, Florence”. Available online: https://rm.coe.int/1680080621 (accessed on 10 April 2020).
  2. Bolós, M. Manual de Ciencia del Paisaje. Teoría, Métodos y Aplicaciones; Masson: Barcelona, Spain, 1992; p. 273. [Google Scholar]
  3. Zhang, F.; Ayinuer, Y.; Dongfang, W. Ecological risk assessment due to land use/cover changes (LUCC) in Jinghe County, Xinjiang, China from 1990 to 2014 based on landscape patterns and spatial statistics. Environ. Earth Sci. 2018, 77, 491–507. [Google Scholar] [CrossRef]
  4. Fairclough, G.; Herlin, I.S.; Swanwick, C. (Eds.) Routledge Handbook of Landscape Character Assessment: Current Approaches to Characterisation and Assessment; Routledge: Abingdon, UK, 2018; p. 294. [Google Scholar]
  5. Thompson, C.W. Linking landscape and health: The recurring theme. Landsc. Urban Plan. 2011, 99, 187–195. [Google Scholar] [CrossRef]
  6. Liu, B.X. Study on the effects of different landscapes on elderly people’s body-mind health. Landsc. Archit. 2016, 7, 113–120. [Google Scholar]
  7. Domon, G. Landscape as resource: Consequences, challenges and opportunities for rural development. Landsc. Urban Plan. 2011, 100, 338–340. [Google Scholar] [CrossRef]
  8. Smith, M.; Ram, Y. Tourism, landscapes and cultural ecosystem services: A new research tool. Tour. Recreat. Res. 2017, 42, 113–119. [Google Scholar] [CrossRef]
  9. Willemen, L.; Hein, L.; Verburg, P.H. Evaluating the impact of regional development policies on future landscape services. Ecol. Econ. 2010, 69, 2244–2254. [Google Scholar] [CrossRef]
  10. Nassauer, J.I. Landscape as medium and method for synthesis in urban ecological design. Landsc. Urban Plan. 2012, 106, 221–229. [Google Scholar] [CrossRef] [Green Version]
  11. Antrop, M. Landscape change and the urbanization process in Europe. Landsc. Urban Plan. 2004, 67, 9–26. [Google Scholar] [CrossRef]
  12. Angel, S.; Parent, J.; Civco, D.L.; Blei, A.; Potere, D. The dimensions of global urban expansion: Estimates and projections for all countries, 2000–2050. Prog. Plan. 2011, 75, 53–107. [Google Scholar] [CrossRef]
  13. World Urbanization Prospects: The 2018 Revision. Available online: https://population.un.org/wup/Publications/Files/WUP2018$-$KeyFacts.pdf (accessed on 25 May 2020).
  14. Criado, M.; Santos-Francés, F.; Martínez-Graña, A.; Sánchez, Y.; Merchán, L. Multitemporal Analysis of Soil Sealing and Land Use Changes Linked to Urban Expansion of Salamanca (Spain) Using Landsat Images and Soil Carbon Management as a Mitigating Tool for Climate Change. Remote Sens. 2020, 12, 1131. [Google Scholar] [CrossRef] [Green Version]
  15. Antrop, M. Background concepts for integrated landscape analysis. Agric. Ecosyst. Environ. 2000, 77, 17–28. [Google Scholar] [CrossRef]
  16. Termorshuizen, J.W.; Opdam, P. Landscape services as a bridge between landscape ecology and sustainable development. Landsc. Ecol. 2009, 24, 1037–1052. [Google Scholar] [CrossRef]
  17. Bateman, I.J.; Harwood, A.R.; Mace, G.M.; Watson, R.T.; Abson, D.J.; Andrews, B.; Binner, A. Bringing Ecosystem Services into Economic Decision-Making: Land Use in the United Kingdom. Science 2013, 341, 45–50. [Google Scholar] [CrossRef] [PubMed]
  18. Panagopoulos, T. Linking forestry, sustainability and aesthetics. Ecol. Econ. 2009, 68, 2485–2489. [Google Scholar] [CrossRef]
  19. Mayoh, J.; Onwuegbuzie, A.J. Toward a conceptualization of mixed methods phenomenological research. J. Mixed Methods Res. 2015, 9, 91–107. [Google Scholar] [CrossRef] [Green Version]
  20. Loures, L.; Loures, A.; Nunes, J.; Panagopoulos, T. Landscape Valuation of Environmental Amenities throughout the Application of Direct and Indirect Methods. Sustainability 2015, 7, 794–810. [Google Scholar] [CrossRef] [Green Version]
  21. Arthur, L.; Daniel, T.; Boster, R. Scenic assessment: An overview. Landsc. Plan. 1977, 4, 109–129. [Google Scholar] [CrossRef]
  22. Stamps, A.E. Demographic effects in environmental aesthetics: A meta-analysis. J. Plan. Literature 1999, 14, 155–175. [Google Scholar] [CrossRef]
  23. Ulrich, R.S. Human responses to vegetation and landscapes. Landsc Urban Plan 1986, 13, 29–44. [Google Scholar] [CrossRef]
  24. Lothian, A. Landscape and the philosophy of aesthetics: Is landscape quality inherent in the landscape or in the eye of the beholder? Landsc. Urban Plan. 1999, 44, 177–198. [Google Scholar] [CrossRef]
  25. Daniel, T.C. Whither scenic beauty? Visual landscape quality assessment in the 21st century. Landsc. Urban Plan. 2001, 54, 267–281. [Google Scholar] [CrossRef]
  26. Cañas, I.; Ayuga, E.; Ayuga, F. A contribution to the assessment of scenic quality of landscapes based on preferences expressed by the public. Land Use Policy 2009, 26, 1173–1181. [Google Scholar] [CrossRef]
  27. Martínez-Graña, A.M.; Goy, J.L.; Cimarra, C. 2D to 3D geologic map transformation using virtual globes and flight simulators and their applications in the analysis of geodiversity in natural areas. Environ. Earth Sci. 2015, 73, 8023–8034. [Google Scholar] [CrossRef]
  28. Shi, J.; Honjo, T.; Zhang, K.; Furuya, K. Using virtual reality to assess landscape: A comparative study between on-site survey and virtual reality of aesthetic preference and landscape cognition. Sustainability 2020, 12, 2875. [Google Scholar] [CrossRef] [Green Version]
  29. Tveit, M.; Ode, A.; Fry, G. Key concepts in a framework for analysing visual landscape character. J. Landsc. Res. 2006, 31, 229–255. [Google Scholar] [CrossRef]
  30. Ode, A.; Tveit, M.; Fry, G. Capturing landscape visual character using indicators: Touching base with landscape aesthetic theory. Landsc. Res. 2008, 33, 89–117. [Google Scholar] [CrossRef]
  31. Sevenant, M.; Antrop, M. Cognitive attributes and aesthetic preferences in assessment and differentiation of landscapes. J. Environ. Manage. 2009, 8, 2889–2899. [Google Scholar] [CrossRef]
  32. Martín, B.; Otero, I. Mapping the visual landscape quality in Europe using physical attributes. J. Maps 2012, 8, 56–61. [Google Scholar]
  33. Van Der Perk, M.; De Jong, S.M.; McDonnell, R.A. Advances in the spatiotemporal modeling of environment and landscape. Int. J. Geogr. Inf. Sci. 2007, 21, 477–481. [Google Scholar] [CrossRef] [Green Version]
  34. Jeong, J.S.; García-Moruno, L.; Hernández-Blanco, J. A site planning approach for rural buildings into a landscape using a spatial multi-criteria decision analysis methodology. Land Use Policy 2013, 32, 108–118. [Google Scholar] [CrossRef]
  35. Jeong, J.S.; Montero-Parejo, M.J.; García-Moruno, L.; Hernández-Blanco, J. The visual evaluation of rural areas: A methodological approach for the spatial planning and color design of scattered second homes with an example in Hervás, Western Spain. Land Use Policy 2015, 46, 330–340. [Google Scholar] [CrossRef]
  36. Veronesi, F.; Hurni, L. A GIS tool to increase the visual quality of relief shading by automatically changing the light direction. Comput. Geosci. 2015, 74, 121–127. [Google Scholar] [CrossRef]
  37. Criado, M.; Martínez-Graña, A.; Santos-Francés, F.; Veleda, S.; Zazo, C. Multi-Criteria Analyses of Urban Planning for City Expansion: A Case Study of Zamora, Spain. Sustainability 2017, 9, 1850. [Google Scholar] [CrossRef] [Green Version]
  38. Martínez-Graña, A.M.; Silva, P.G.; Goy, J.L.; Elez, J.; Valdés, V.; Zazo, C. Geomorphology applied to landscape analysis for planning and management of natural spaces. Case study: Las Batuecas-S. de Francia and Quilamas natural parks,(Salamanca, Spain). Sci. Total Environ. 2017, 584, 175–188. [Google Scholar] [CrossRef]
  39. Soto, S.; Pintó, J. Delineation of natural landscape units for Puerto Rico. Appl. Geogr. 2010, 30, 720–730. [Google Scholar] [CrossRef]
  40. Bulut, Z.; Yilmaz, H. Determination of landscape beauties through visual quality assessment method: A case study for Kemaliye (Erzincan/Turkey). Environ. Monit. Assess. 2008, 141, 121–129. [Google Scholar] [CrossRef]
  41. Vizzari, M. Spatial modelling of potential landscape quality. Appl. Geogr. 2011, 31, 108–118. [Google Scholar] [CrossRef]
  42. Burley, J. Environmental Design for Reclaiming Surface Mines; The Edwin Mellen Press: New York, NY, USA, 2001; p. 504. [Google Scholar]
  43. Ayala, R.; Ramirez, J.; Camargo, S. Valoración de La Calidad y Fragilidad Visual del Paisage en el Valle de Zapotitlán de Las Salinas, Puebla (México); Faculdad de Geografia e Historia da Universidad de Madrid: Madrid, Spain, 2003. [Google Scholar]
  44. Vargues, P.; Loures, L. Using Geographic Information Systems in visual and aesthetic analysis: The case study of a golf course in Algarve. WSEAS Trans. Environ. Dev. 2008, 4, 774–783. [Google Scholar]
  45. von Haaren, C.; Lovett, A.A.; Albert, C. Landscape Planning with Ecosystem Services, 1st ed.; Springer: Dordrecht, The Netherlands, 2019; p. 540. [Google Scholar]
  46. With, K.A. The application of neutral landscape models in conservation biology. Conserv. Biol. 1997, 11, 1069–1080. [Google Scholar] [CrossRef]
  47. Galpern, P.; Manseau, M.; Fall, A. Patch-based graphs of landscape connectivity: A guide to construction, analysis and application for conservation. Biol. Conserv. 2011, 144, 44–55. [Google Scholar] [CrossRef]
  48. Qi, K.; Fan, Z.; Ng, C.N.; Wang, X.; Xie, Y. Functional analysis of landscape connectivity at the landscape, component, and patch levels: A case study of Minqing County, Fuzhou City, China. Appl. Geogr. 2017, 80, 64–77. [Google Scholar] [CrossRef]
  49. Instituto Nacional de Estadística (National Institute of Statistics of Spain). Available online: http://www.ine.es/dyngs/INEbase/es/operacion.htm?c=Estadistica_C&cid=1254736176951&menu=ultiDatos&idp=1254735572981 (accessed on 28 June 2020).
  50. UNESCO. Available online: https://whc.unesco.org/en/list/381/ (accessed on 28 June 2020).
  51. CORINE-Land Cover. Available online: https://land.copernicus.eu/pan-european/corine-land-cover (accessed on 7 April 2020).
  52. DiPietro, J.A. Geology and Landscape Evolution: General Principles Applied to the United States, 2nd ed.; Elsevier: Amsterdam, The Netherlands, 2018; p. 638. [Google Scholar]
  53. Meinig, D.W. The Beholding Eye. Ten versions of the same scene. Landsc. Archit. 1976, 66, 47–54. [Google Scholar]
  54. Dearden, P. Societal Landscape Preferences: A Pyramid of Influences. Landscape Evaluation: Approaches and Applications; University of Victoria: Victoria, BC, Canada, 1989; pp. 41–64. [Google Scholar]
  55. Kaltenborn, B.P.; Bjerke, T. Associations between environmental value orientations and landscape preferences. Landsc. Urban Plan. 2002, 59, 1–11. [Google Scholar] [CrossRef]
  56. Dramstad, W.E.; Tveit, M.S.; Fjellstad, W.J.; Fry, G.L. Relationships between visual landscape preferences and map-based indicators of landscape structure. Landsc. Urban Plan. 2006, 78, 465–474. [Google Scholar] [CrossRef]
  57. Istanbulluoglu, E.; Bras, R.L. Vegetation-modulated landscape evolution: Effects of vegetation on landscape processes, drainage density, and topography. J. Geophys. Res. Earth Surf. 2005, 110. [Google Scholar] [CrossRef] [Green Version]
  58. Roy, N.G.; Sinha, R. Linking hydrology and sediment dynamics of large alluvial rivers to landscape diversity in the Ganga dispersal system, India. Earth Surf. Proc. Land. 2017, 42, 1078–1091. [Google Scholar] [CrossRef]
  59. Tengberg, A.; Fredholm, S.; Eliasson, I.; Knez, I.; Saltzman, K.; Wetterberg, O. Cultural ecosystem services provided by landscapes: Assessment of heritage values and identity. Ecosyst. Serv. 2012, 2, 14–26. [Google Scholar] [CrossRef]
  60. Santé, I.; Fernández-Ríos, A.; Tubío, J.M.; García-Fernández, F.; Farkova, E.; Miranda, D. The Landscape Inventory of Galicia (NW Spain): GIS-web and public participation for landscape planning. Landsc. Res. 2019, 44, 212–240. [Google Scholar] [CrossRef]
  61. Holgado, P.M.; Rieth, L.J.; Menárguez, A.B.B.; Álvarez, F.A. The Analysis of Urban Fluvial Landscapes in the Centre of Spain, Their Characterization, Values and Interventions. Sustainability 2020, 12, 4661. [Google Scholar] [CrossRef]
  62. González-Ávila, S.; López-Leiva, C.; Bunce, R.G.; Elena-Rosselló, R. Changes and drivers in Spanish landscapes at the Rural-Urban Interface between 1956 and 2018. Sci. Total Environ. 2020, 714, 136858. [Google Scholar] [CrossRef]
Figure 1. Study area location.
Sustainability 12 06395 g001
Figure 2. General methodology of the manuscript.
Sustainability 12 06395 g002
Figure 3. (A) Geomorphological domains, (B) lithological domains, (C) vegetation-land cover and (D) urban areas.
Sustainability 12 06395 g003
Figure 4. Landscape units map.
Sustainability 12 06395 g004
Figure 5. Studied parameters in the determination of quality Intrinsic: (A) geomorphology, (B) slope, (C) sinuosity, (D) lithology, (E) unique reliefs, (F) fractional vegetation cover (FVC), (G) stratification, (H) composition and (I) hydrology; and Extrinsic: (J) accessibility and (K) visibility.
Sustainability 12 06395 g005
Figure 6. Landscape quality map.
Sustainability 12 06395 g006
Figure 7. Studied factors for the analysis of fragility Intrinsic: (A) slope, (B) orientation, (C) fractional vegetation cover (FVC), (D) stratification, (E) vegetation units surface (VS), (F) vegetal sinuosity and (G) area of landscape units; and Extrinsic: (H) accessibility and (I) visibility.
Sustainability 12 06395 g007
Figure 8. Landscape fragility map.
Sustainability 12 06395 g008
Figure 9. Landscape need-of-protection map.
Sustainability 12 06395 g009
Table 1. Weights assigned to the components of each analyzed parameter (linked to abiotic factors) for the determination of intrinsic landscape quality.
PComponents of Each ParameterQuality
Geomorpholo-
gical domains
Ridges and hillsVery high
EscarpmentsHigh
SurfacesModerate
Hillside Low
TerracesVery low
Valley bottomsVery low
Slope>30%Very high
20–30%High
15–20%High
10–15%Moderate
5–10%Low
<5%Very low
Sinuosity<5000Very high
5000–10,000High
10,000–15,000Moderate
15,000–25,000Low
>25,000Very low
LithologyRed materials: red sediments and white limestone crustsVery high
Sandstone: ochre, beige, yellowish and greenish colorsHigh
Quartzite: white-grey and reddish colorsModerate
Slates: brown and greyish shadesLow
Conglomerates and sand: dark brown colorsVery low
Sand, silt and clay: brown or grey shadesVery low
Unique reliefs: ridges and escarpmentsVery high
Table 2. Weights assigned to the components of each analyzed parameter (linked to biotic factors) for the determination of intrinsic landscape quality.
PComponents of Each ParameterQuality
Fractional vegetation cover (FVC)>40%Very high
10–40%High
5–10%:Moderate
<5%Low
0: urban areas and croplandsVery low
Stratification3High
2Moderate
1Low
0Null
CompositionWoodlandVery high
ScrublandHigh
Mixed crop-tree formationsModerate
Croplands and grasslandsLow
Urban spaces and areas without vegetationNull
HydrologyVisibility and proximity to Tormes riverHigh
Proximity to minor streamsLow
Table 3. Weights assigned to the components of each parameter analyzed for the determination of intrinsic landscape fragility.
PComponents of Each ParameterFragility
Slope>30%Very high
20–30%High
10–20%Moderate
5–10%Low
<5%Very low
OrientationSouthVery high
EastHigh
WestModerate
NorthLow
PlaneVery low
Stratification3Low
2Moderate
1High
0 (urban areas)Null
Fractional vegetation cover (FVC)>40%Low
10–40%Moderate
5–10%:High
<5%Very high
0: urban areas and croplandsNull
Vegetal sinuosity (S)Shrub areas (S = 309)Very low
Mixed (cropland and woodland) (S = 324)Low
Cropland, grassland and fallows (S = 1062)Moderate
Woodland (S = 3513)High
Vegetation units surface (VS)Shrub areas (VS = 21.6 ha)High
Mixed (cropland and woodland) (VS = 911.3 ha)Moderate
Woodland (VS = 1923.2 ha)Low
Cropland, grassland and fallows (VS = 22,770 ha)Very low
Area of each landscape unit in relation to the average extension
Table 4. Matrix for allocating landscape need-of-protection classes [36].
Quality
Very LowLowModerateHighVery High
FragilityVery LowIIIIIIVIV
LowIIIIIIVIV
ModerateIIIIIIIVV
HighIIIIIIIVV
Very HighIIIIIIIVV
Table 5. Landscape units present in the study area.
Name of the Landscape Unit
1Ridges on quartzite with wooded vegetation
2Degraded surface on slates with crops
3Structural surface on sandstone with grassland
4Polygenic surface on sandstone with crops
5Hillsides over slope deposits with crops
6Hillsides on slates with grasslands
7Slopes on sandstone with crops
8Hillsides over red materials with crops
9Hillsides on sandstone with mixed crop/tree formations
10Hillsides on red materials with mixed crop/tree formations
11Hillsides over sandstone with wooded vegetation
12Hillsides over red materials with wooded vegetation
13Escarpments on sandstone with grasslands
14Escarpments on sandstone with wooded vegetation
15Fluvial incision on slate with grassland
16Terraces with conglomerates and sands with irrigated crops
17Terraces with conglomerates and sands with crops
18Terraces with conglomerates and sands with mixed crop and tree formations
19Terraces with conglomerates and sands with tree formations
20Valley bottoms of sands, silts and clays with grasslands
21Valley bottoms of sand, silt and clay with wooded vegetation
22Semiendorheic areas of silt and clay with grassland
23Tormes river
24Urban areas
Table 6. Area (%) of landscape units (according to their total surface area) included in each of the ranges of quality, fragility and need for landscape protection.
LU 1 (nº)A 2 (ha)Landscape QualityLandscape FragilityNeed of Protection
VL 3LM HVHVLLMHVHVLLM HVH
155000011892035228150015742
275956330202348232453153020
33730038575224224750038539
450001963021413143109621
51007440162416114332953114162415
62320130626162348111213186243
746061137610010245187597673
860601879120102845143547993
91010048511212723121700473320
1063202255716314120532025676
114550176230203334761087219
121290023563462616930027820
132440131531501132233411322343
14870052174292012570051679
1550023450140832481202352043
1619671949302008434459593011
172490295514205264127134501420
182540466255173735742266291
191896125226401040455315512110
20894164238401627479132253931
212149242933501156267826292413
2218853359307275510116225921
Tot2406952454125102742156121754125
1 LU: landscape unit (see Table 5); 2 A: area; 3 VL: very low, L: low; M: moderate; H: high; VH: very high.

